DOI:10.32604/iasc.2022.019500
| Intelligent Automation & Soft Computing DOI:10.32604/iasc.2022.019500 | |
| Article |
Blood Group Classification System Based on Image Processing Techniques
Department of Computer Science, Faculty of Specific Education, Mansoura, Egypt
*Corresponding Author: S. A. Shaban. Email: soh.shabaan@gmail.com
Received: 15 April 2021; Accepted: 23 June 2021
Abstract: The present paper proposes a novel system that automatically classifies the eight different blood groups according to the ABO and Rh blood group systems. The proposed system is developed by applying MATLAB’s image processing techniques on the blood sample images. These images are acquired from the laboratory using the slide test. It utilizes a mean filter for removing noise from blood sample images. In addition, the Contrast Limited Adaptive Histogram Equalization (CLAHE) is used for enhancing the image characteristics analysis. The proposed system also utilizes the automated threshold strategy (Otsu’s approach) for obtaining the blood samples binary images. Since, adding the three antigens (A, B, D) to the blood samples works on clumping the samples or not, and this, in turn, works on the variation number of objects and holes in the different blood groups’ samples. Therefore, the “Bwboundaries” Matlab function is applied for the first time in the proposed system to count the number of objects and holes for blood group classification. The database used in the proposed system consists of 600 images collected from different laboratories. The suggested system has many advantages such as simplicity, speeding up processing time, reducing human interference and errors, decreasing the risk of transfusion reactions, and high accuracy, even in remote places. As well, it can be used by a lab technician or any user who doesn’t have any previous knowledge of the blood group detection technique. In addition to using this system to assist in several applications such as premarital tests, blood transfusion as well as paternity tests.
Keywords: ABO blood system; premarital tests; blood transfusion; paternity tests; image processing technology; mean filter; CLAHE; Otsu’s approach; “Bwboundaries” Matlab function
There are various kinds of blood group. The main two basic types are the ABO blood system and the Rhesus blood system. The most critical system in human blood transfusion is the ABO blood system. It was created by Austria's Rand Steiner at the beginning of 19 century [1]. There are eight distinct blood groups according to the ABO and Rh blood group systems. These are A Rh+, A Rh−, B Rh+, B Rh−, AB Rh+, AB Rh−, O Rh+, and O Rh− [2]. Blood classification is a manual process performed by laboratory technicians in laboratories and achieved by glass slide checking. First, Antigen-A, Antigen-B, Antigen-D are mixed into the blood sample of an individual. These antigens may or may not be combined with red blood cell antibodies from a specific blood group. Then, the technician scans for blood cell clumps. For e.g., if clumps are found in antigen-A added and Antigen-D added samples, the blood group is known as an A-positive blood type. The category is known as A− Negative if clumps are detected only in samples added with Antigen-A [3].
Blood group knowing and understanding are very important nowadays for many critical tasks such as premarital testing, blood transfusion, donation, organ transplantation, accidents, parental disputes, and other emergency situations [4]. A premarital test is described by a series of laboratory and clinical tests that are offered to both spouses prior to marriage [5]. It includes clinical assessment for family, barrenness, and laboratory tests such as blood count, blood type, the rate of hemoglobin, rhesus factor, functions of liver and kidney, HIV testing, male semen testing [6]. It also reduces the risk of children developing a disorder. This is done by alerting the spouses to the need for treatment or by helping them determine whether pregnancy should be prevented in the face of the high probability of an abnormality or not [7]. There is a fact that says that there is no harm in marrying a man or woman of a different blood type, the damage occurs when both have a different Rh element [8]. If D antigen is in the red blood cells, the person has a positive Rh. If there is an absence of D antigen in the red blood cells, Rh is negative [9,10].
In Rh-negative women with Rh-positive children (Rh blood incompatibility), health issues do not arise during the first pregnancy. This is because there is not a possibility for the wife's body to produce a lot of antibodies. On the other hand, if treatment is not presented during the first pregnancy and the wife becomes pregnant with Rh-positive child again, more antibodies will be made. More antibodies pose a danger to the second pregnancy [11,12].
Blood transfusion is a lifesaving way that rescues a huge number of people yearly. About 81 million blood units are usually donated annually. It requires accurate matching of blood types to prevent significant adverse effects [13,14]. It is well recognized that if anyone requires a blood transfusion, it is risky for him/her to receive a differing blood type due that the blood can contain antigens that his/her antibodies can attack this may lead to the sudden death of the patient [15].
The ABO blood group has been used for personal identification and paternity test in forensic medicine and criminal investigations for many years. It cannot prove paternity, but it can definitely rule out a suspected parent as a candidate, this is because the baby must inherit his blood type from his parents. Thus, if the blood group of the child differs from the blood type of the mother and the alleged father, then the man cannot be the father of the child [16,17]. For instance, if the child is in group A, and the mother and the putative father are in the group (O), the man is banished from paternity.
The manual technique for blood group detection has undesirable disadvantages with increasing the sample number and in case of disasters such as slowness, inaccurate typing in the reports as it bases on the skills and fatigue of the operator. Thus, the use of automatic procedures decreases the influence of human mistakes in laboratories and increases the efficiency of the findings obtained [18,19].
Due to the exponential development of image processing technology, including image detection, interpretation, and enhancement, medical imaging is evolving rapidly. Consequently, the time and the efforts used by people in the medical field have decreased [20]. A closer look at the researches that are based on image processing, many types of research have been found in face recognition, fingerprint recognition, iris recognition, etc., but little has been done in blood group identification. In recent years, the development of automatic recognition systems dependent on computer vision technologies has become a vital need in the area of blood group detection [21]. Based on the above, an impeccable operation justified by empirical and statistical measurements and perfect image analysis is required to identify the blood group.
Few papers have been suggested methods in order to identify the blood groups. An adaptive method of Hough transform techniques has presented to analyze blood samples by Keerthana et al. [22]. Image processing techniques such as thresholding, morphological operations, attribute extraction by Scale-Invariant Feature Transform (SIFT) algorithm, and classification using Support Vector Machine (SVM) have proposed for the identification of blood group by Pathan et al. [23]. The attributes of standard deviation, histogram, Histogram of Oriented Gradients, and fast Fourier transform have calculated for different regions of interest to use as inputs for SVM and Decision Trees classifiers for blood type classification by Ferraz et al. [24]. Gray Level Co-occurrence Matrix (GLCM) approach for the extraction of feature matrix, also SVM, Decision Tree, and Linear Discriminate Analyzer (LDA) classifiers have been used for determination of blood samples group by Jogi et al. [25]. Different attributes like (contrast, correlation, energy, homogeneity, mean, standard deviation, entropy, Root Mean Square (RMS), variance, smoothness, kurtosis, skewness, and GLCM) and SVM classifier have used to identify different blood groups by Gurav et al. [26]. A blood group testing framework depended on Field Programmable Gate Arrays (FPGA) has been evolved utilizing Verilog Hardware Description Language (HDL) by Noorbasha et al. [27]. Different systems have been reviewed and their outputs evaluated to detect the class of blood sample using MATLAB calculations to assist researchers in their work by Jogi et al. [28]. The image processing techniques such as Region of Interest (RoI), image cropping, grey-scale segmentation, contouring or edge-detection techniques, and HSL (hue, saturation, lightness) average value have used to the patient’s blood type in a short time by Sathiyan et al. [29]. A survey on recent advances made for the detection of blood group based on different techniques, like thresholding, histogram, and cluster conditions has been presented by Pavithra [30]. Morphological operations have used for classifying the blood regions based on statistical features such as area, shape, size of the segmented regions by Danti et al. [31]. The following techniques for image processing: preprocessing, Grayscale image, image segmentation, feature extraction, and classification have applied to detect blood groups for more than one person at a single stretch in a short time by Banu et al. [32]. Image processing techniques like thresholding, morphological operations, HSL Luminance plane, and quantification have used for blood group identification by Ravindran et al. [33].
3 The Proposed System Description
The proposed system consists of two basic stages for determining the blood group. These stages are preprocessing stage for preparing blood samples and image processing techniques for the classification of the blood samples. Fig. 1 shows the proposed system flowchart for blood group detection and uses it in different applications. Below is a detailed explanation of the flowchart of the proposed system.
3.1 Preprocessing Stage for Preparing Blood Sample
At this stage, a set of steps are applied in order to obtain an image of the blood sample in preparation for its entry to the next stage. A detailed explanation of these steps is as follows:
A clean microscopic slide is brought up which called a glass slide. Whereas, slide testing is relatively the least sensitive procedure, among other things for determining blood group. But due to its rapid results, it is very useful in an emergency situation [34].
3.1.2 Mixing Blood Sample with Antigens (A, B and D)
A drop of antisera A, B, and D are put on the left, middle and right portions of the glass slide respectively. The color of Anti-A is blue, yellow for Anti-B, and transparent for Anti-D. These antigens are added with a dropper. Also, the finger is wiped with alcohol and softly rubbed next to the fingertip. Next, the tip of the finger is pricked with a scalpel, and the first drop of blood is wiped. When the blood starts to bleed, it falls on three antigens on the glass slide. After that, the blood sample is mixed with the three antigens.
3.1.3 Waiting for Blood Cell Clumps
The blood sample is left for a little while to see if the blood cells are sticking together (clumping). If blood cells stick to one another, this means that the blood has reacted with an antibody.
3.1.4 Taking Image for the Blood Sample
An image of the blood sample in the glass slide is captured using a USB Camera (Samsung ES65). USB 2.0 or USB 3.0 technology is used to transfer image files. USB cameras are designed to connect conveniently with dedicated computer systems that use the same USB technology.
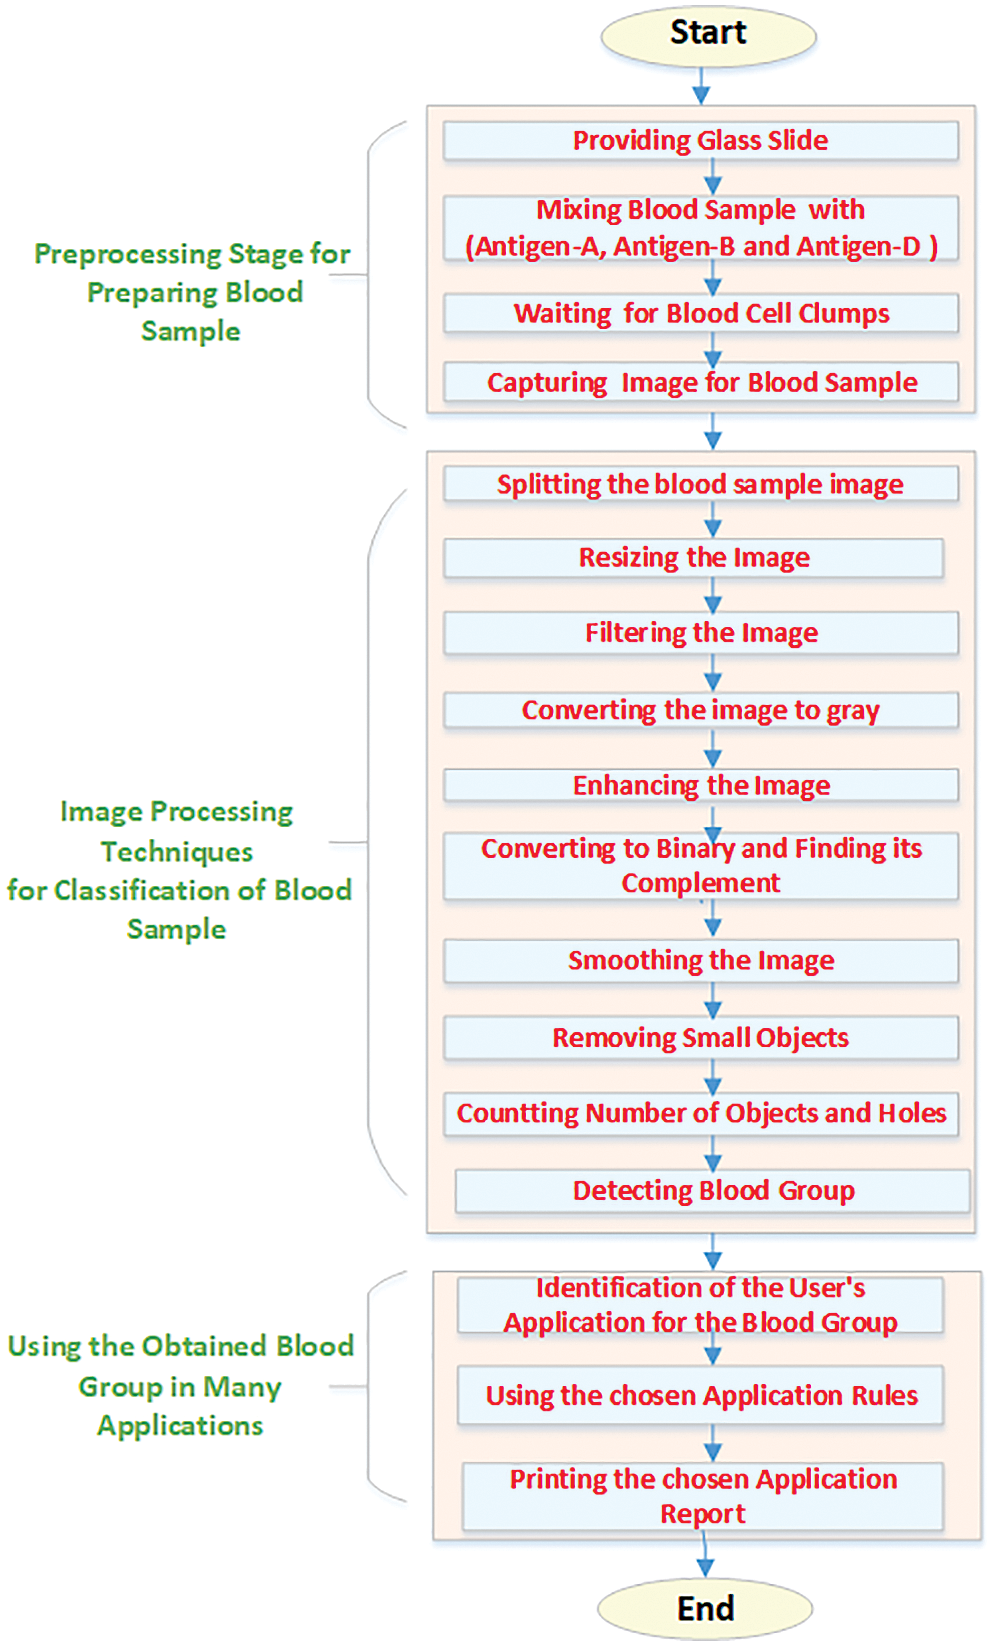
Figure 1: The proposed system flowchart for blood group detection and use it in different applications
3.2 Image Processing Techniques for Classification of the Blood Sample
The image of the blood sample captured from the USB camera is processed utilizing different image processing techniques. The detailed analysis of these techniques is as follows:
3.2.1 Splitting the Image to Three Parts Equally
Since the three parts (A, B, RH factor) are located on the left, center, and right of the slide, the blood sample image on the slide is divided vertically into three parts evenly. This is done based on the number of columns in the image. The number of columns is obtained using the “size” function in Matlab. The image of the blood sample is divided into three parts as follows in Eqs. (1)–(3):
Here, N is the number of columns for the blood sample image and A is N divided by 3.
The major aim of resizing the image is to adaptively resize the image to obtain an ideal display under different conditions. Also, for smaller data size and making the processing time faster [35,36]. It is done using “imresize” Matlab function and the size used is 256 × 256 pixels.
Image filter methods are applied to images to remove various types of noise that may have been present in the image during capture or transfer [37]. Here, the noise is removed with an average or (mean) filter. This filter operates by replacing every pixel value in an image with the mean value of its neighbors, including itself. This has the effect of removing pixel values that are not representative of their surroundings. Measuring the mean is dependent on a kernel, which represents the form and scale of the neighborhood to be sampled [38,39]. Kernels of (5 × 5 squares) are used in the proposed system. This is done using “imfilter” Matlab function [40].
3.2.4 Converting the Image to Gray
Since color image processing is mathematically high, most applications use grayscale or binary images [41]. Grayscale is a set of shades of gray with no visible color. The darkest possible shade is black and the lightest possible shade is white [42]. Here, converting the blood sample color image to gray is achieved using “rgb2gray” Matlab function [43].
Image enhancement is a widely used technique to enhancing certain characteristics of an image in order to increase its visual quality and to aid in further image analysis. CLAHE is the tool used in the proposed system for contrast enhancement. This method divides the image into different sub-images (tiles) and calculates the corresponding histogram for different parts of the image [44]. However, before the Cumulative Distribution Function (CDF) is computed, the histogram clips to the predefined values to limit the amplification. The overflow created by the clipped bins is redistributed over the histogram of that tile [45]. Here, this is applied using the Matlab function called “adapthisteq” [46].
3.2.6 Converting the Image into a Binary and Finding its Complement
Otsu’s approach is the automated threshold strategy used in the proposed system. This is achieved using the “graythresh” Matlab function that calculates the global threshold T of the grayscale image [47]. It computes the optimal threshold that separates the two-pixel classes; foreground (black) and background (white) such that the difference between the two is small [48]. With the Matlab “imbinarize” function, the global threshold T can be used to convert a grayscale image into a binary image [49]. In the complement of the binary image, the zeros become the ones and the ones turn into zeros; black and white are reversed. Here, this is done using Matlab function called “imcomplement” [50].
3.2.7 Smoothing Edge of the Binary Image
Smoothing the edge of the image helps guide the computer to retrieve images more accurately. The “conv2” function in MATLAB is used to execute this task in the proposed system. It convolves 2-D data with a specified kernel whose items determine how to remove or enhance attributes of the original data [51].
3.2.8 Removing of Small Objects in the Binary Image
In the proposed system, the “Bwareaopen” Matlab function is used to remove small objects from the binary image. This function removes all connected components (objects) that are less than P pixels, resulting in another binary image [52].
3.2.9 Counting the Number of Objects and Holes
Since the “Bwboundaries” Matlab function is not used in most research in determining blood groups, it has been used here in this research for the first time. It traces the outlines of objects, as well as the boundaries of holes within these objects, in the binary images. It also gets down to outside things (parents) and keeps track of their children (things parents totally surround it). These components are illustrated in Fig. 2 [53].
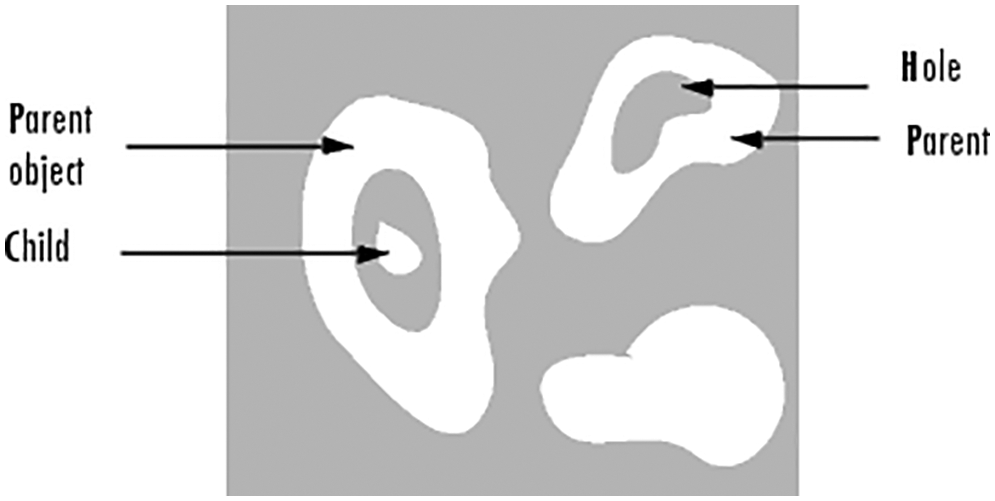
Figure 2: The Components that followed by using “bwboundaries” Matlab function
The general form of the function is [B, L] = Bwboundaries (BW, conn, options). Here, “BW” is the binary image. The value of “conn” in the proposed system is “8-connected” which represents pixel connectivity. In it, pixels are connected if their edges or corners touch. Two adjoining pixels are part of the same object if they are both on and are connected along the horizontal, vertical, or diagonal direction. The value of “options” in the proposed system is “holes” which used to search for both object and hole boundaries. B is a cell array of boundary pixel locations. L is a label matrix in which objects and holes are labeled. L is a two-dimensional array of nonnegative integers that represent contiguous regions. The number of objects and holes represented by L is equal to max (L (:)). Also, the number of objects and holes represented by B is equal to Length (B).
3.2.10 Classification of the Blood Sample Image
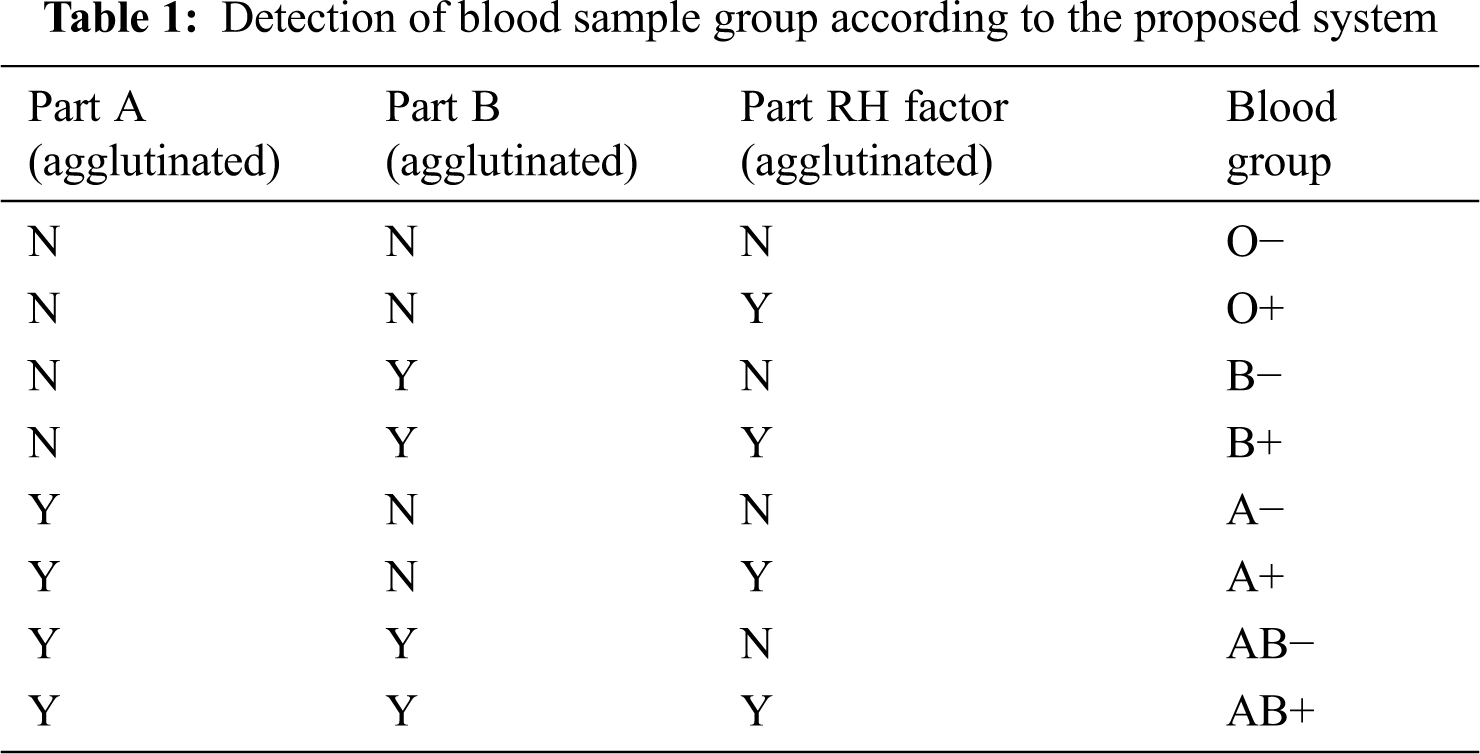
The blood sample image is classified based on the number of objects (parent and child) and holes in the three-segmented parts (A, B, RH factor). By looking at the numerous tests performed, it is verified that if the number of objects and holes is less than or equal to 4, the image is classified as a “non-agglutinated” image. If the number of objects and holes is greater than 4, the image is classified as “agglutinated”. Tab. 1 shows the detection of the blood sample group according to the proposed system.
3.3 Using the Obtained Blood Group in Many Applications
At this stage, a set of steps are required for using the obtained blood type in many applications. The following is an explanation of these steps:
3.3.1 Identification of the User’s Application for the Blood Group
After determining the blood group, it can be used in many applications. The proposed system addresses three applications: pre-marital tests, blood transfusion, and paternity tests.
3.3.2 Using the Chosen Application Rules
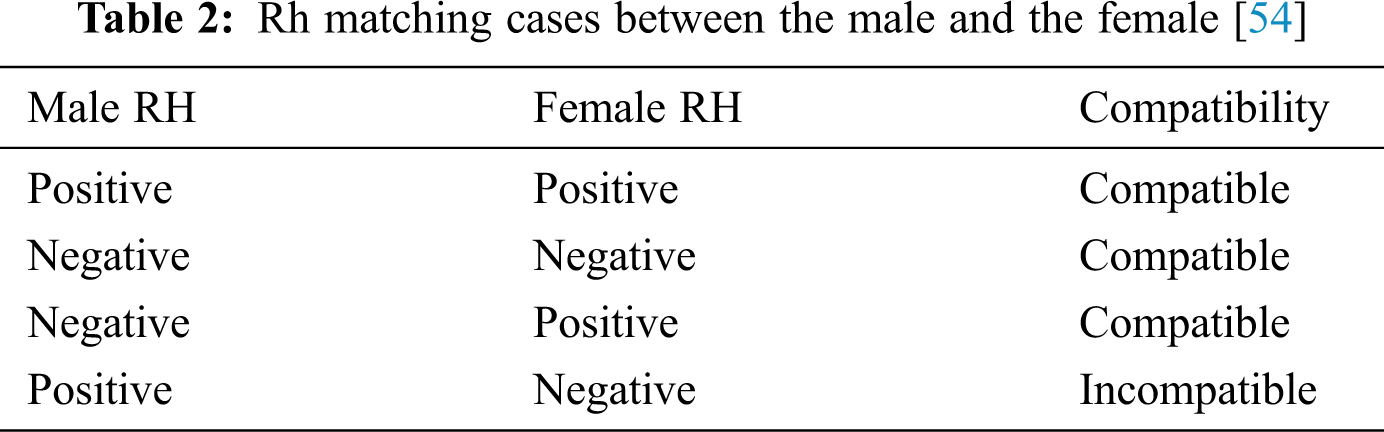
In premarital tests, it is determined whether there is compatibility between the male and the female or not based on the rules in Tab. 2.
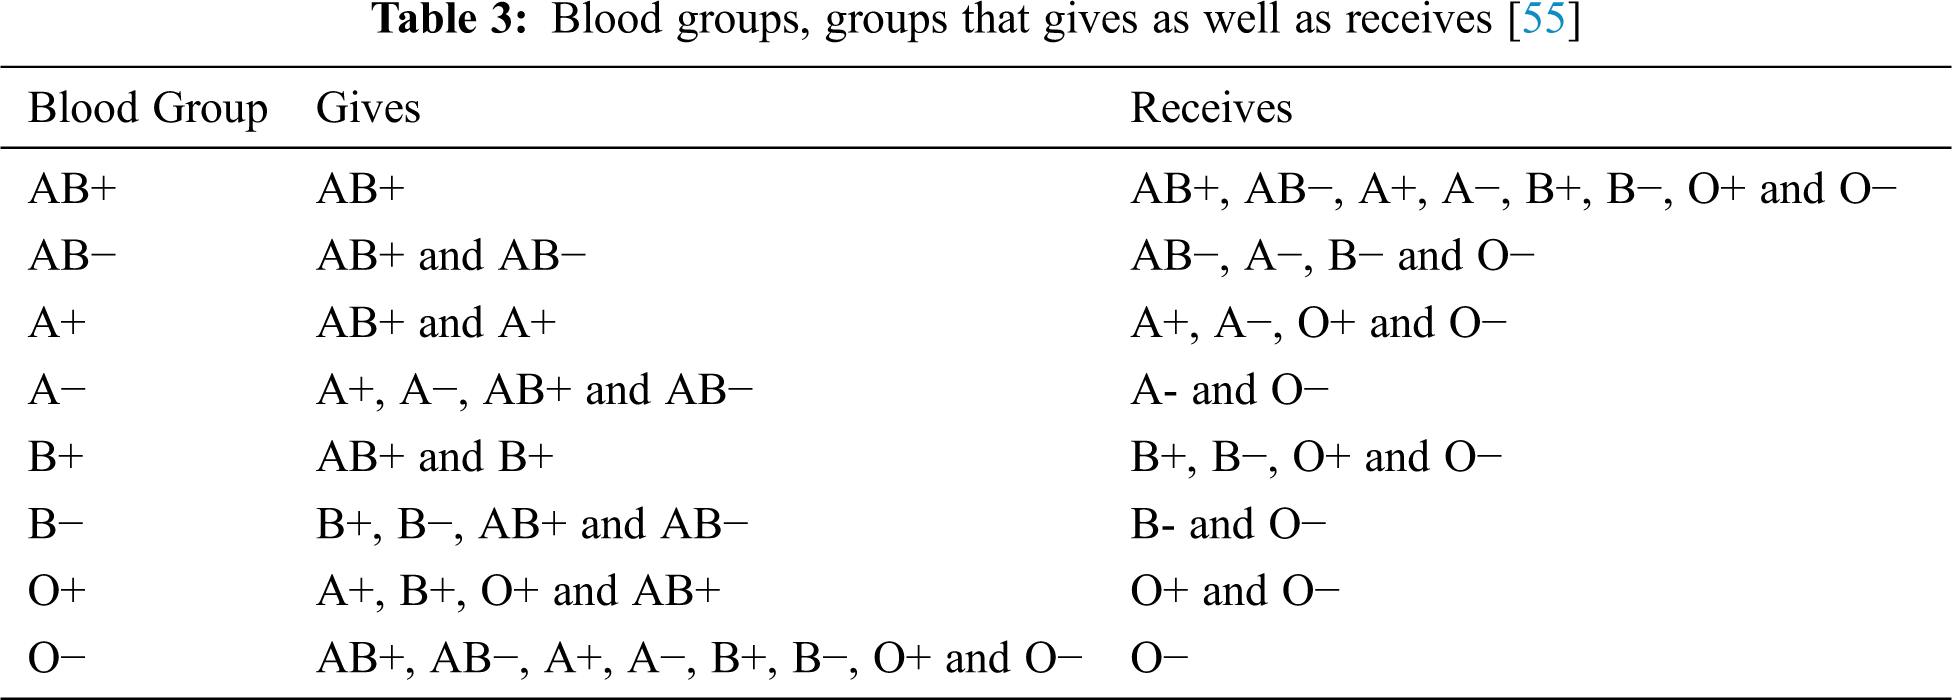
In the process of blood transfusion, it is decided whether any blood group is permitted to give or receive from another or not based on the rules in Tab. 3.
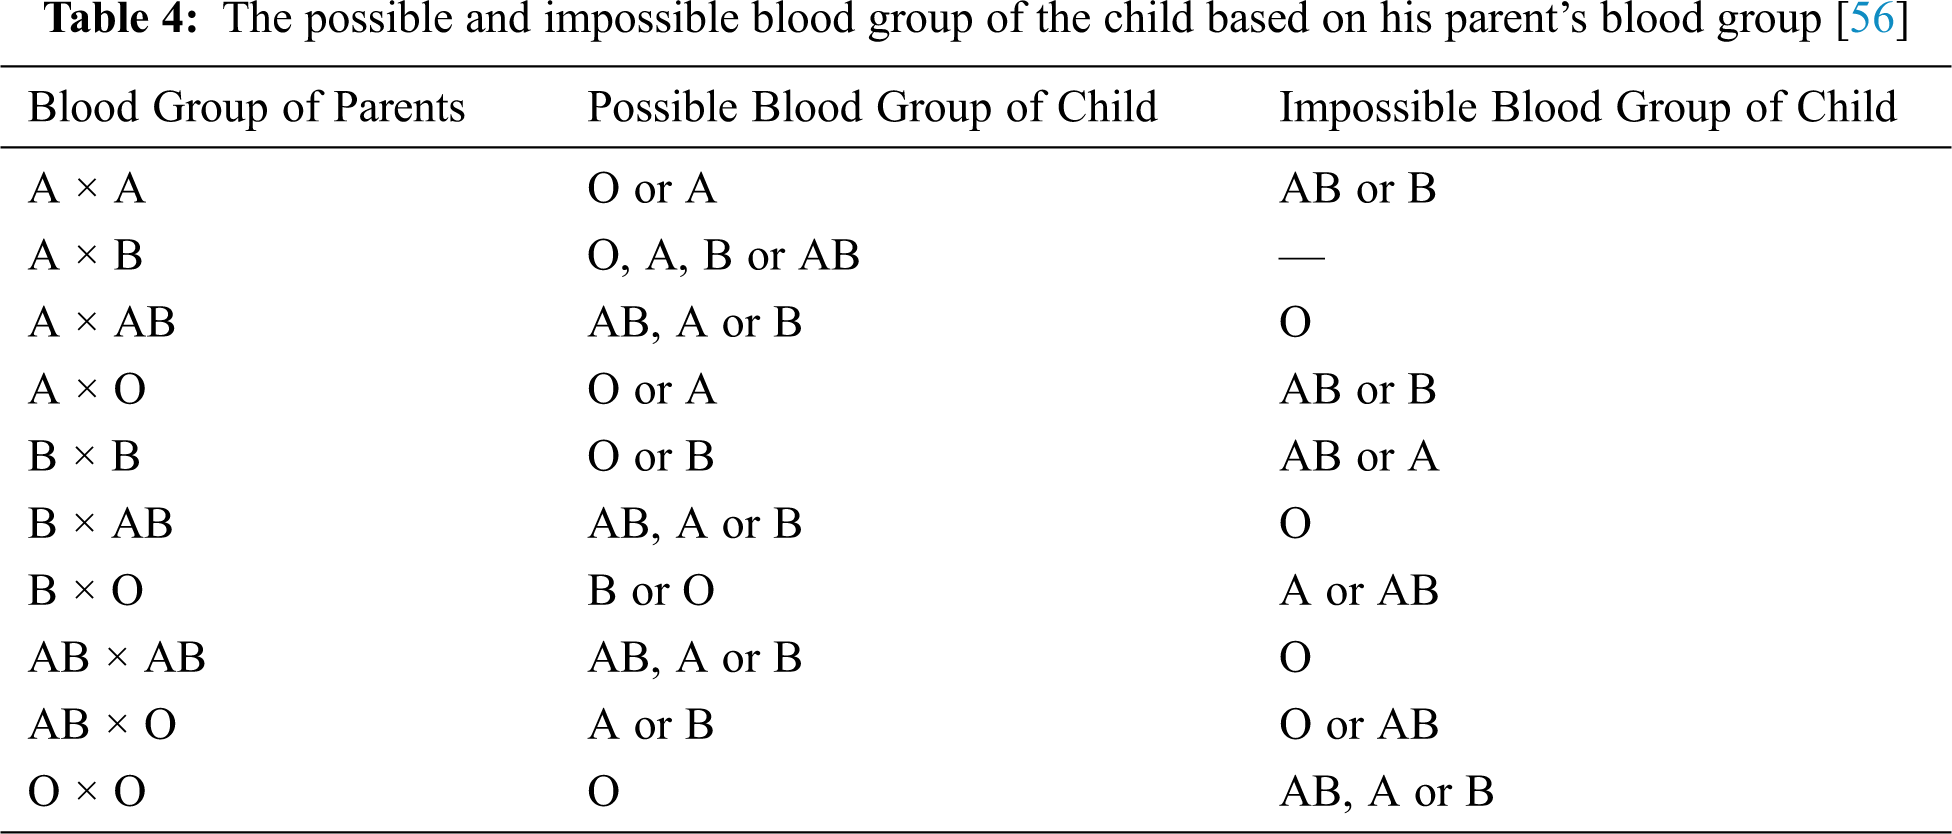
In the paternity tests, it is decided whether this child is the son of the father and the mother according to their blood groups, based on the rules in Tab. 4.
3.3.3 Printing the Chosen Application Report
After applying the rules for the chosen blood group application, a medical report is extracted in Word. This report shows whether there is compatibility between the spouses in the case of pre-marital tests, blood transfusion is allowed or not in the case of blood transfusion and the father is the father of the child or not in the case of paternity tests.
4 Application and Experimental Results
The database used in the proposed system consists of 600 images taken from blood samples tested in the laboratory, with 75 images taken for each blood group. The proposed system for blood group applications was designed using the MATLAB language (R2018b). The proposed system Graphical User Interface (GUI) is shown in Fig. 3. The button of the chosen blood group application is pressed to enter its application.
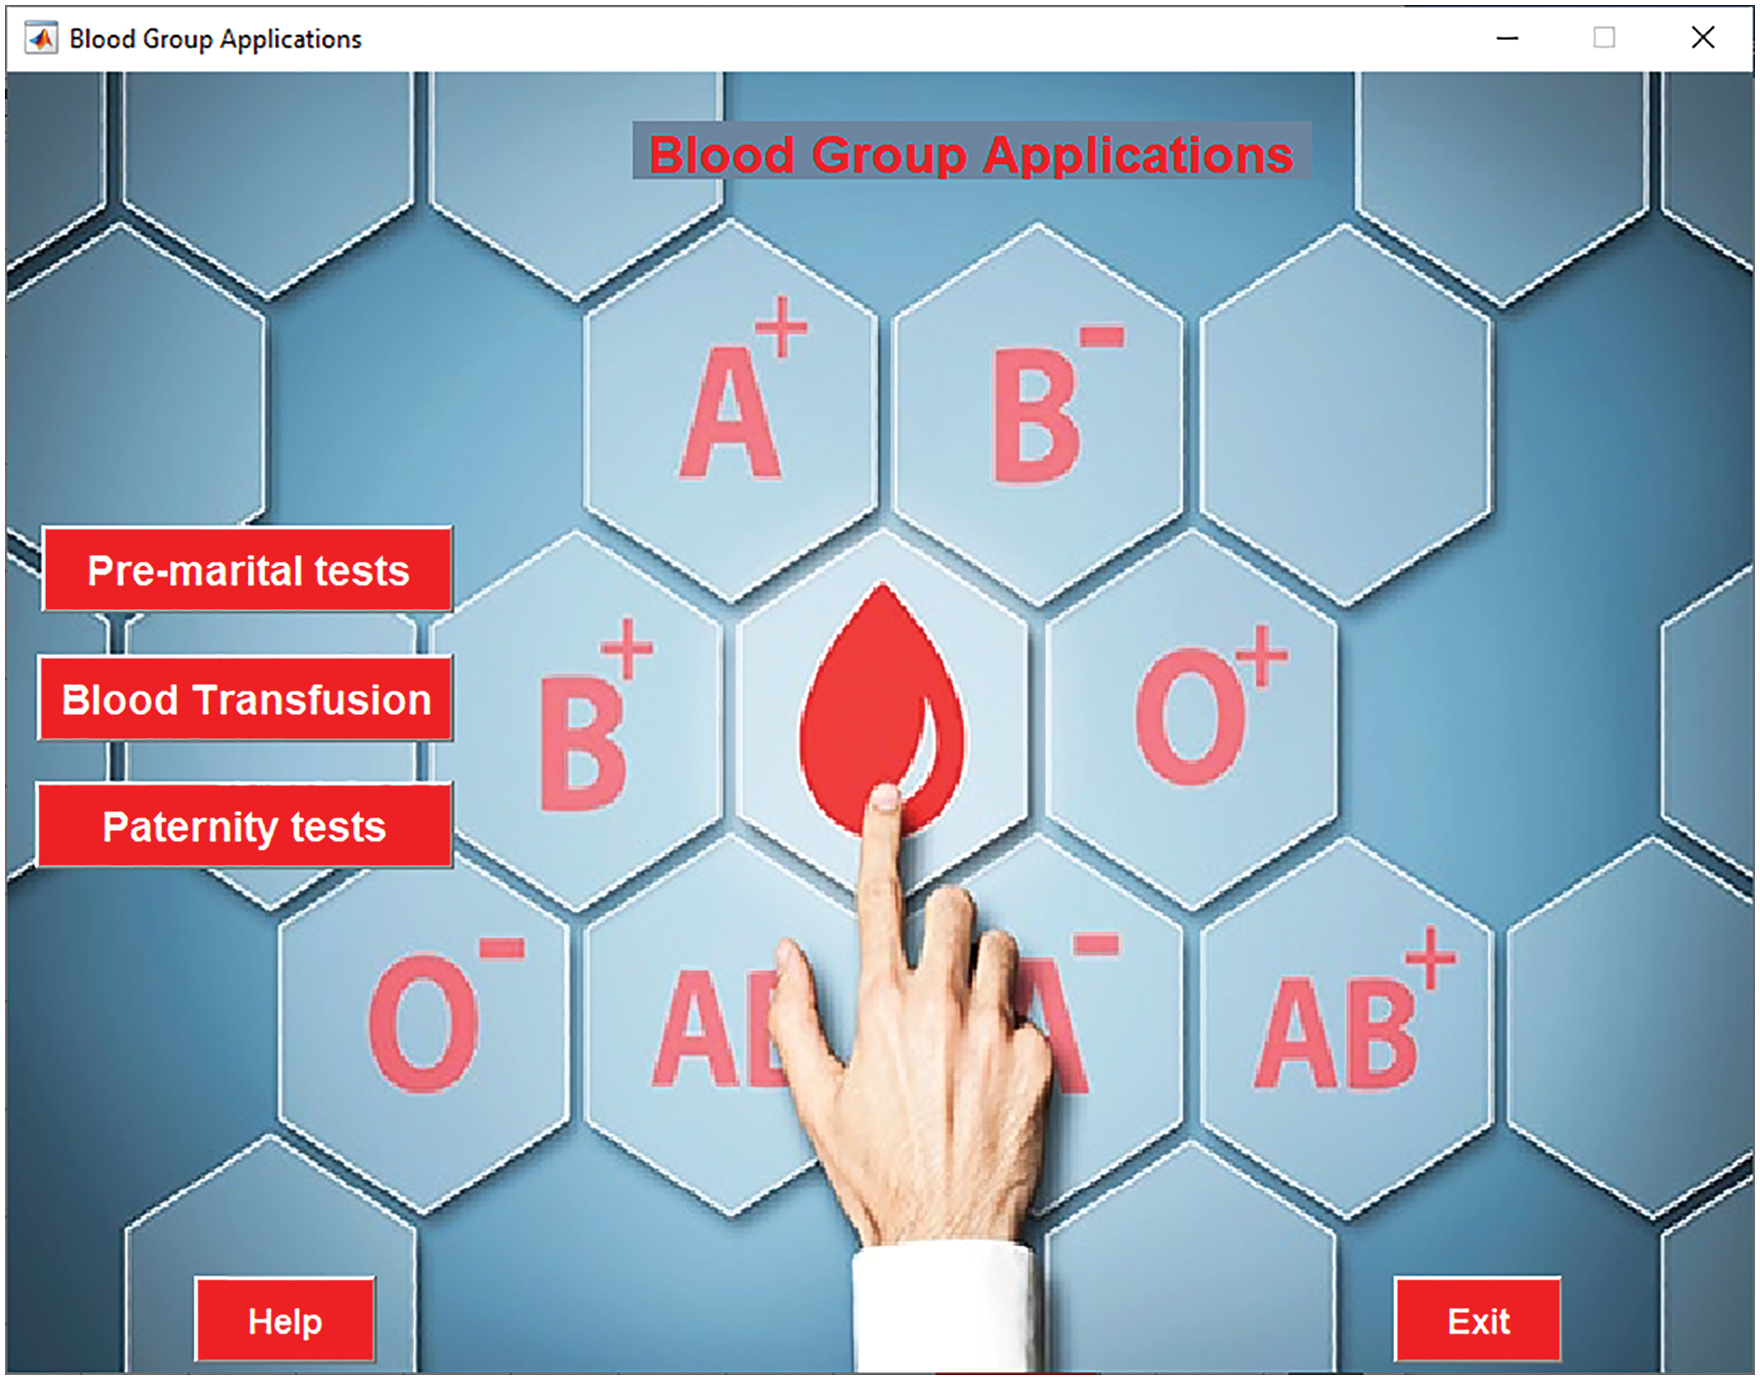
Figure 3: The proposed system GUI
Fig. 4 shows the GUI for premarital tests application. First, the “Select Blood Sample” buttons are pressed to enter the blood sample images for both male and female. Then, click on the “Detect Blood Group” buttons to detect blood groups for the male and the female. Finally, the final report is printed by clicking the “Print Report” as shown in Fig. 5.
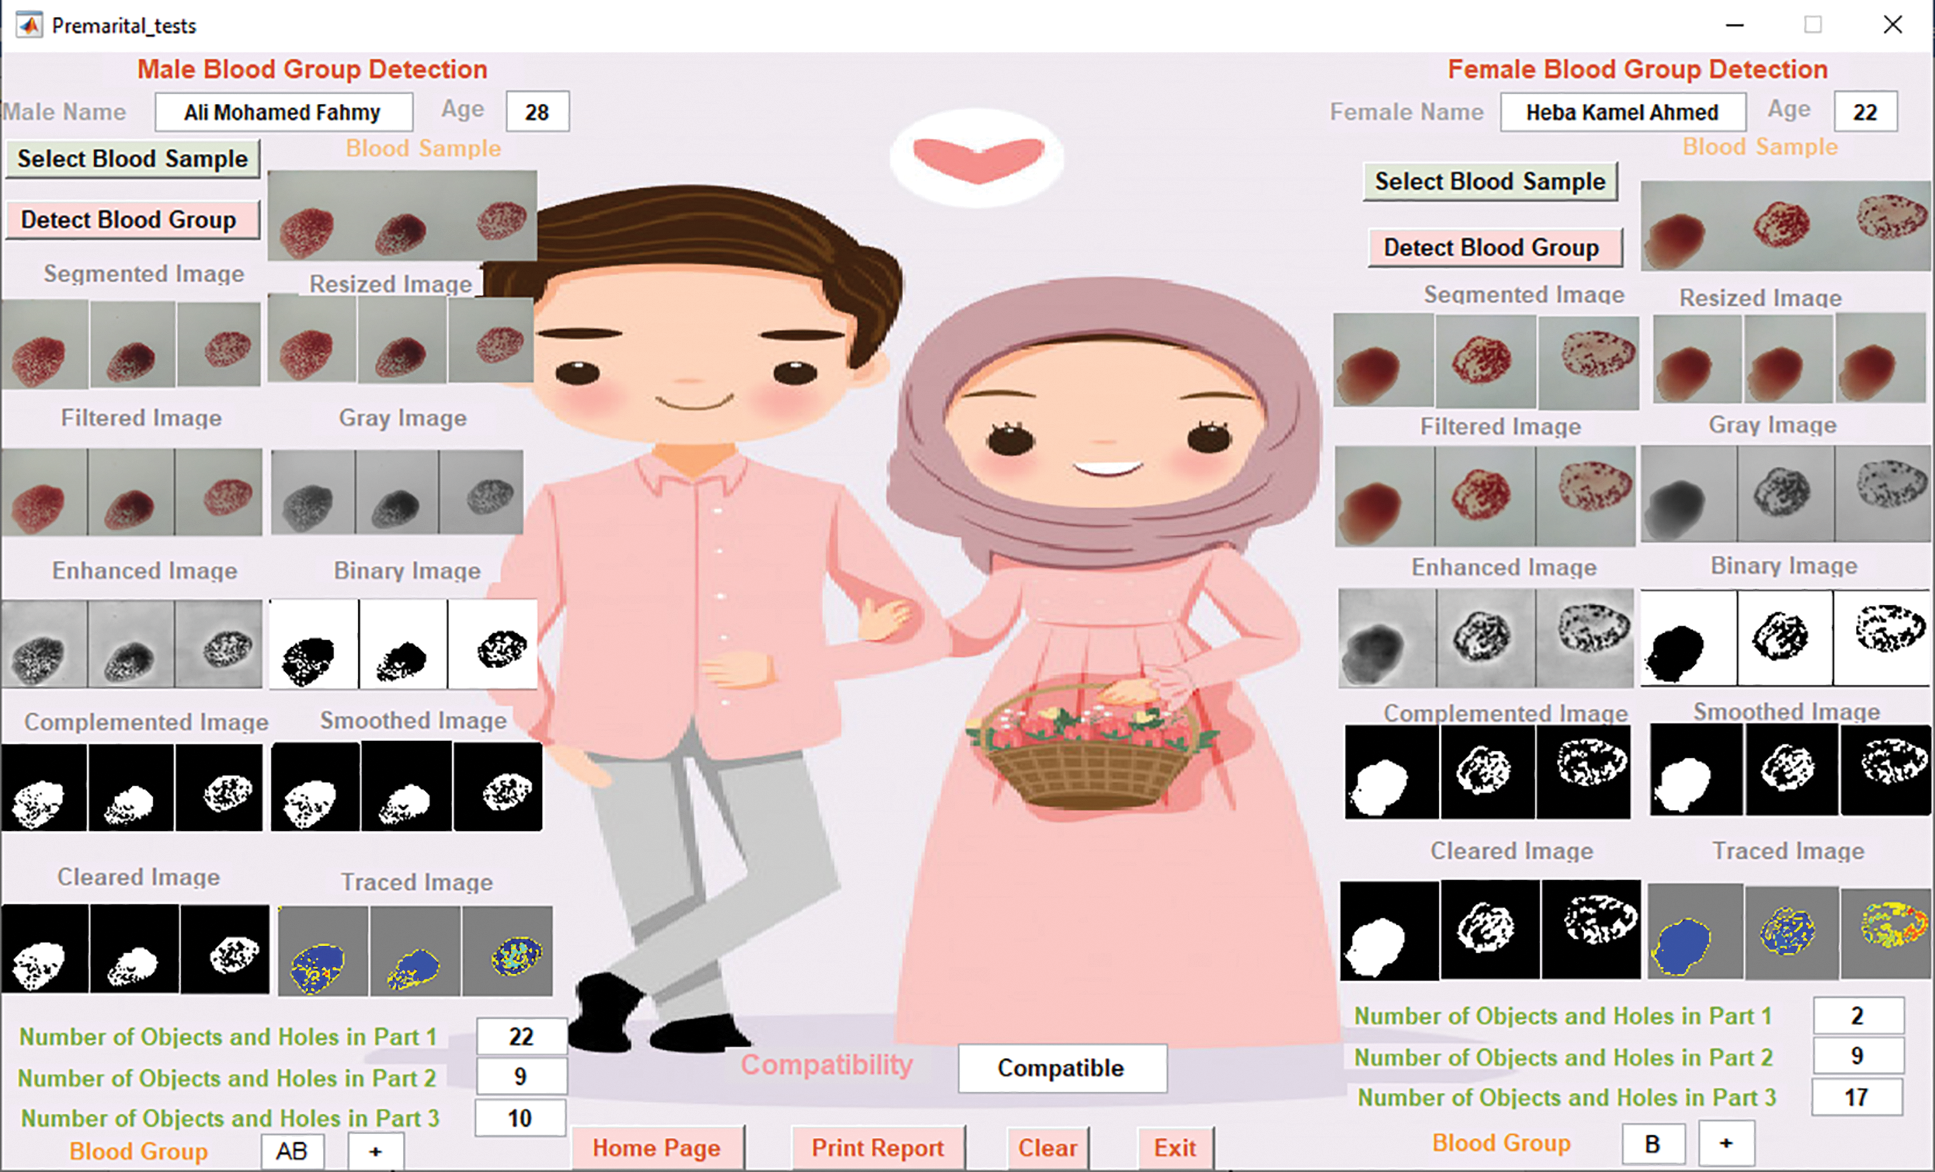
Figure 4: The premarital tests GUI
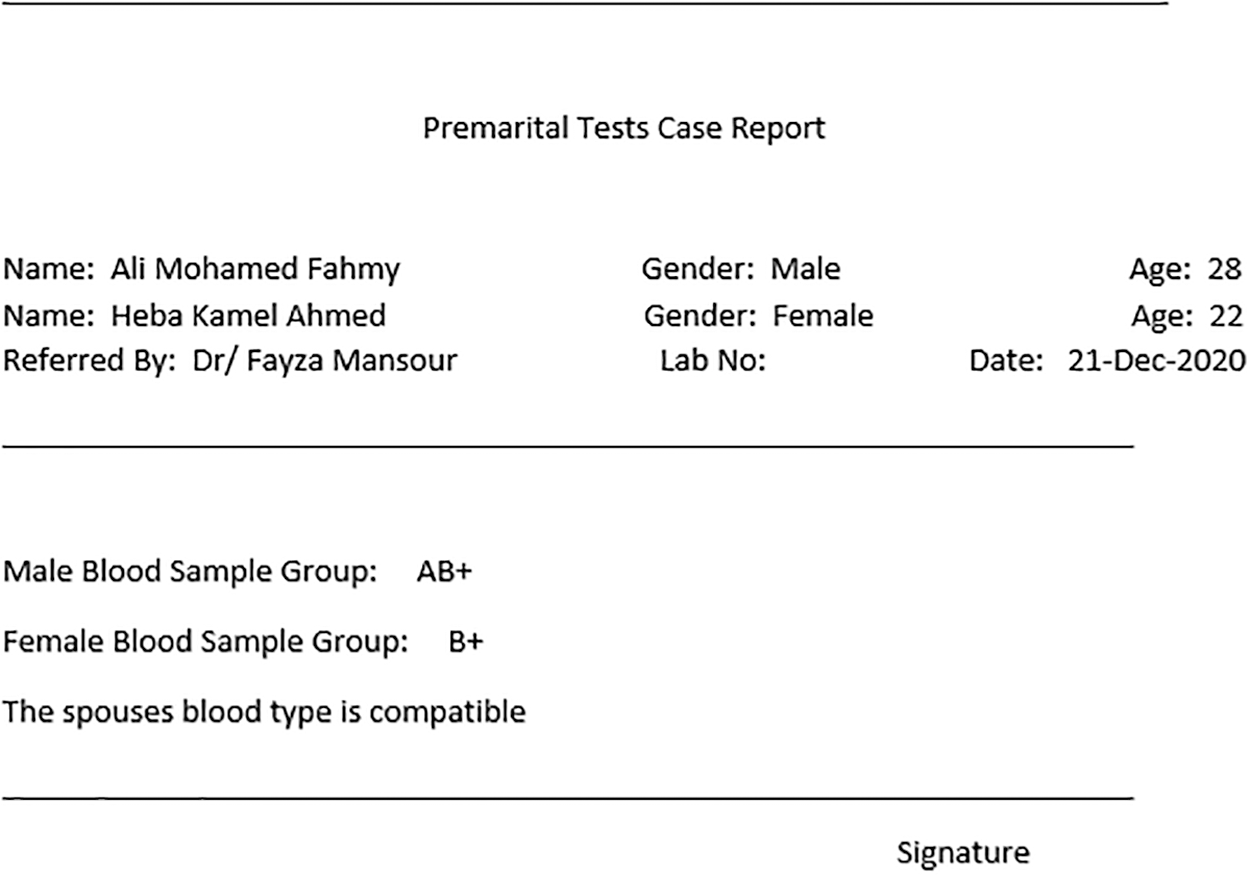
Figure 5: The premarital tests case report GUI
Fig. 6 shows the GUI for blood transfusion application and its final report appears in Fig. 7.
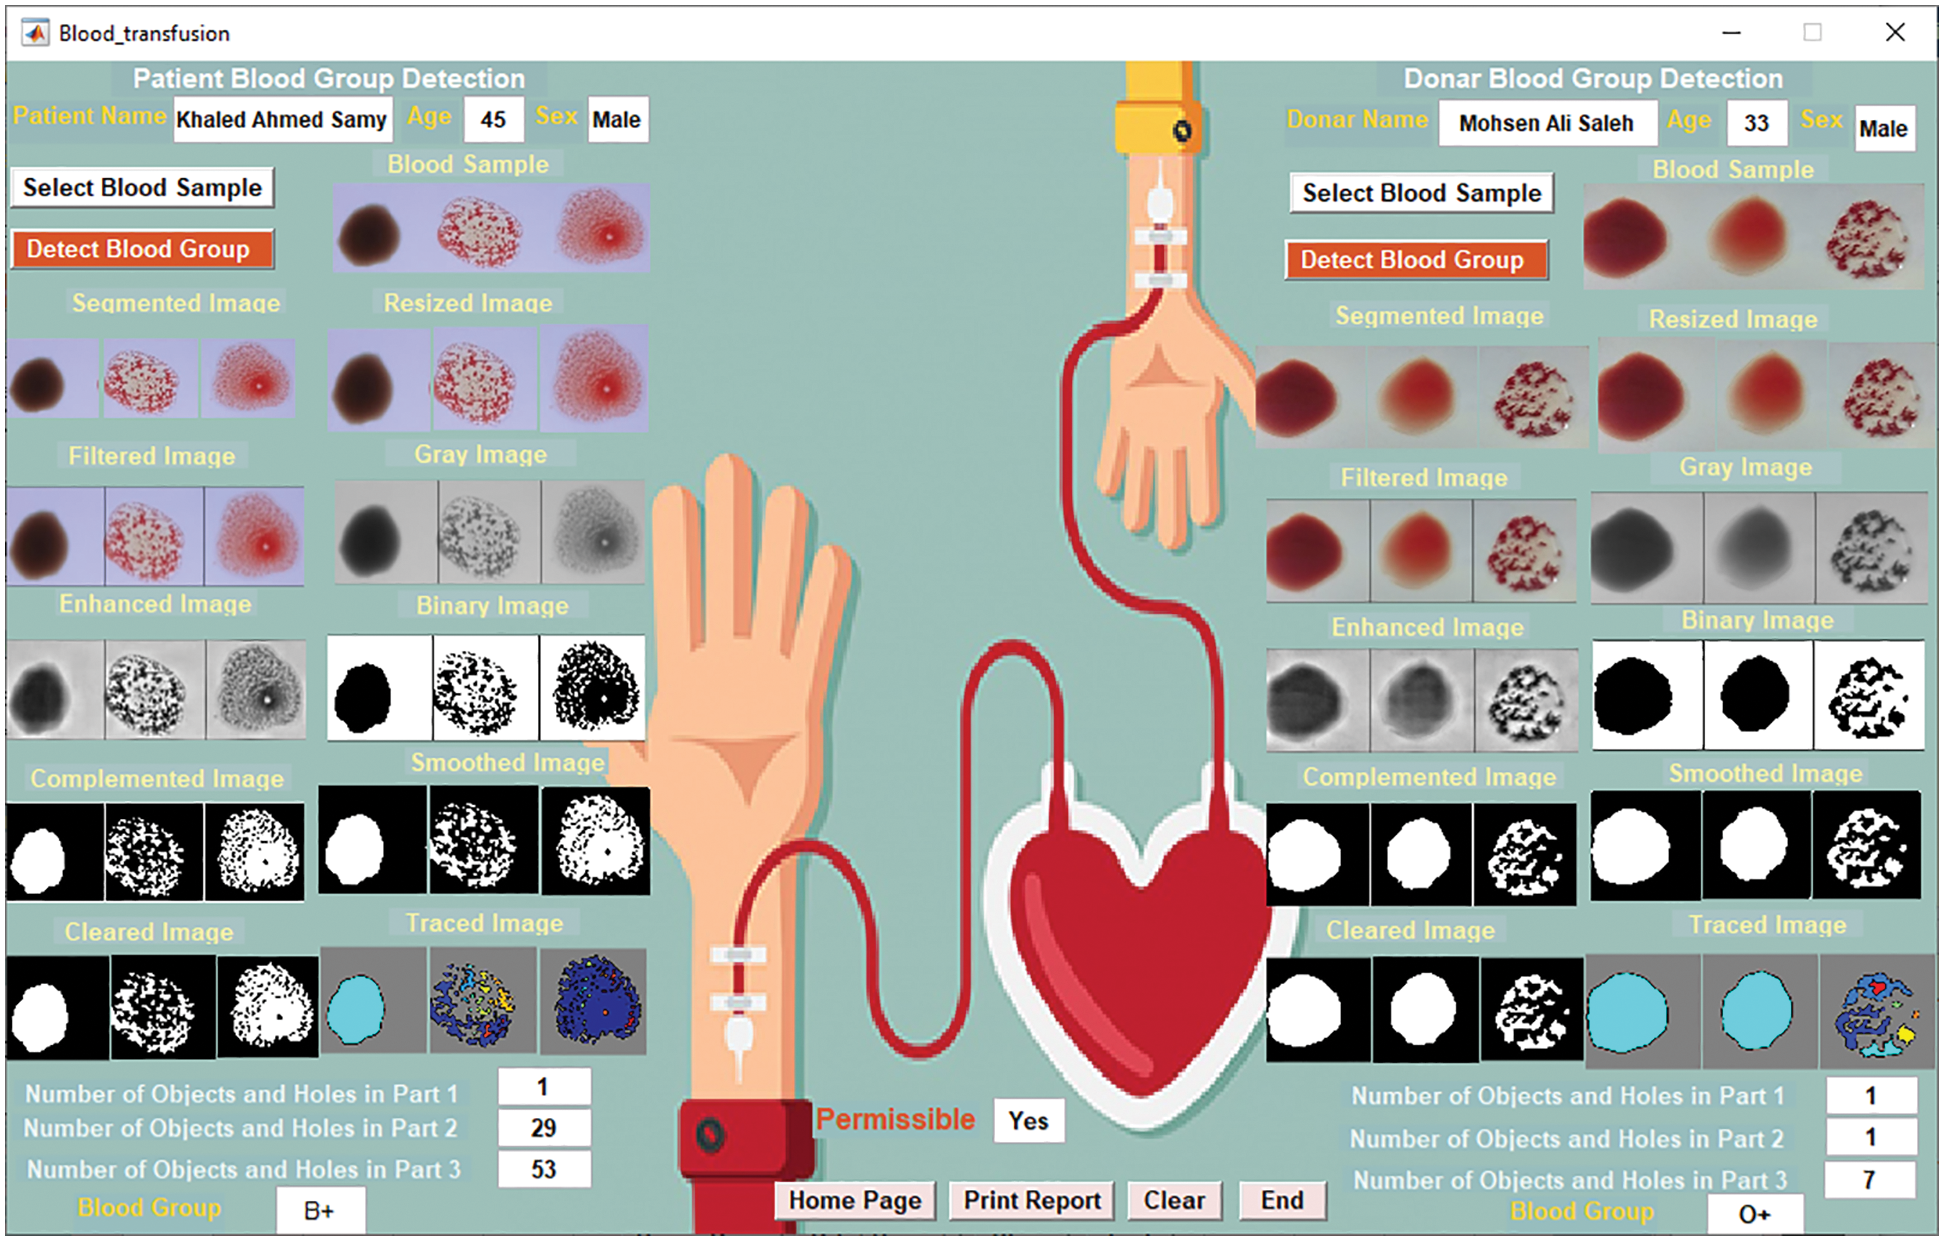
Figure 6: The blood transfusion GUI
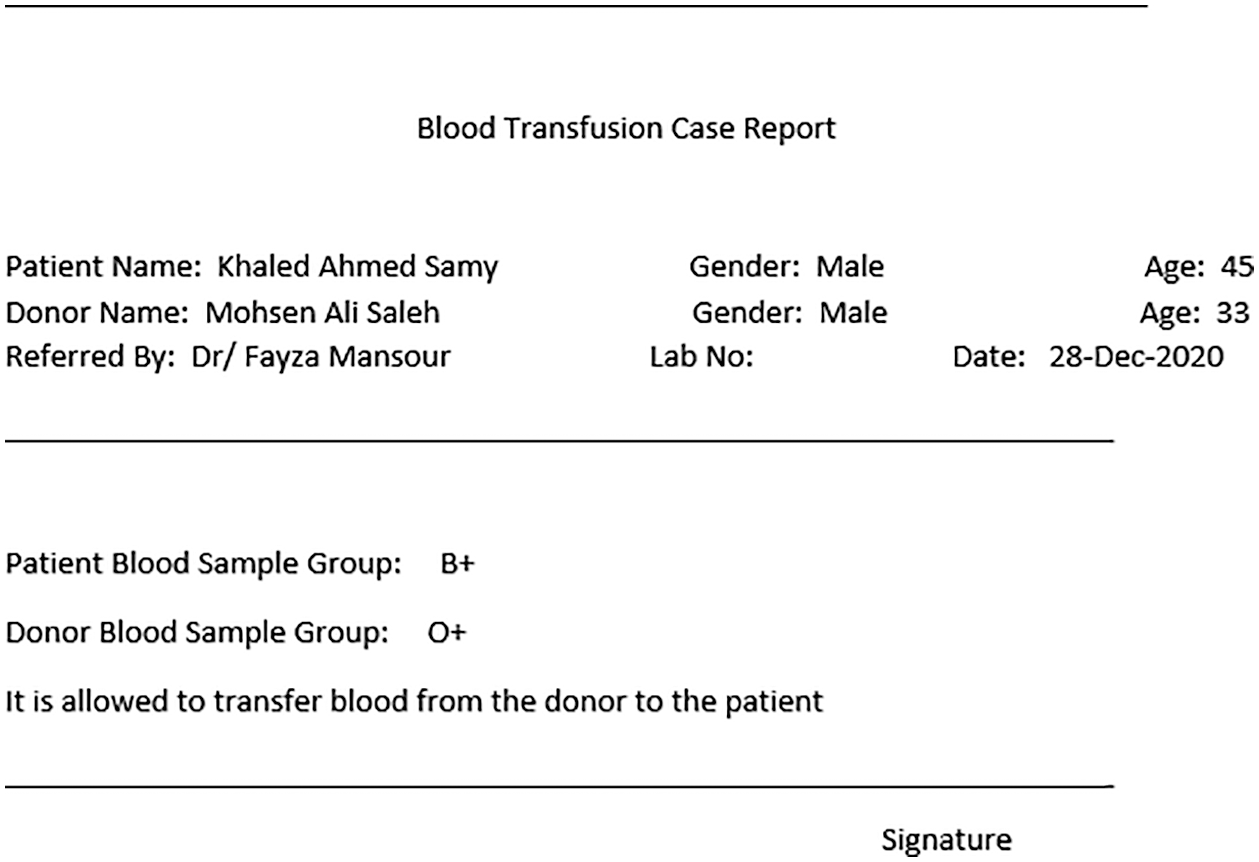
Figure 7: The blood transfusion case report GUI
Fig. 8 shows the GUI for paternity tests application and its final report appears in Fig. 9.
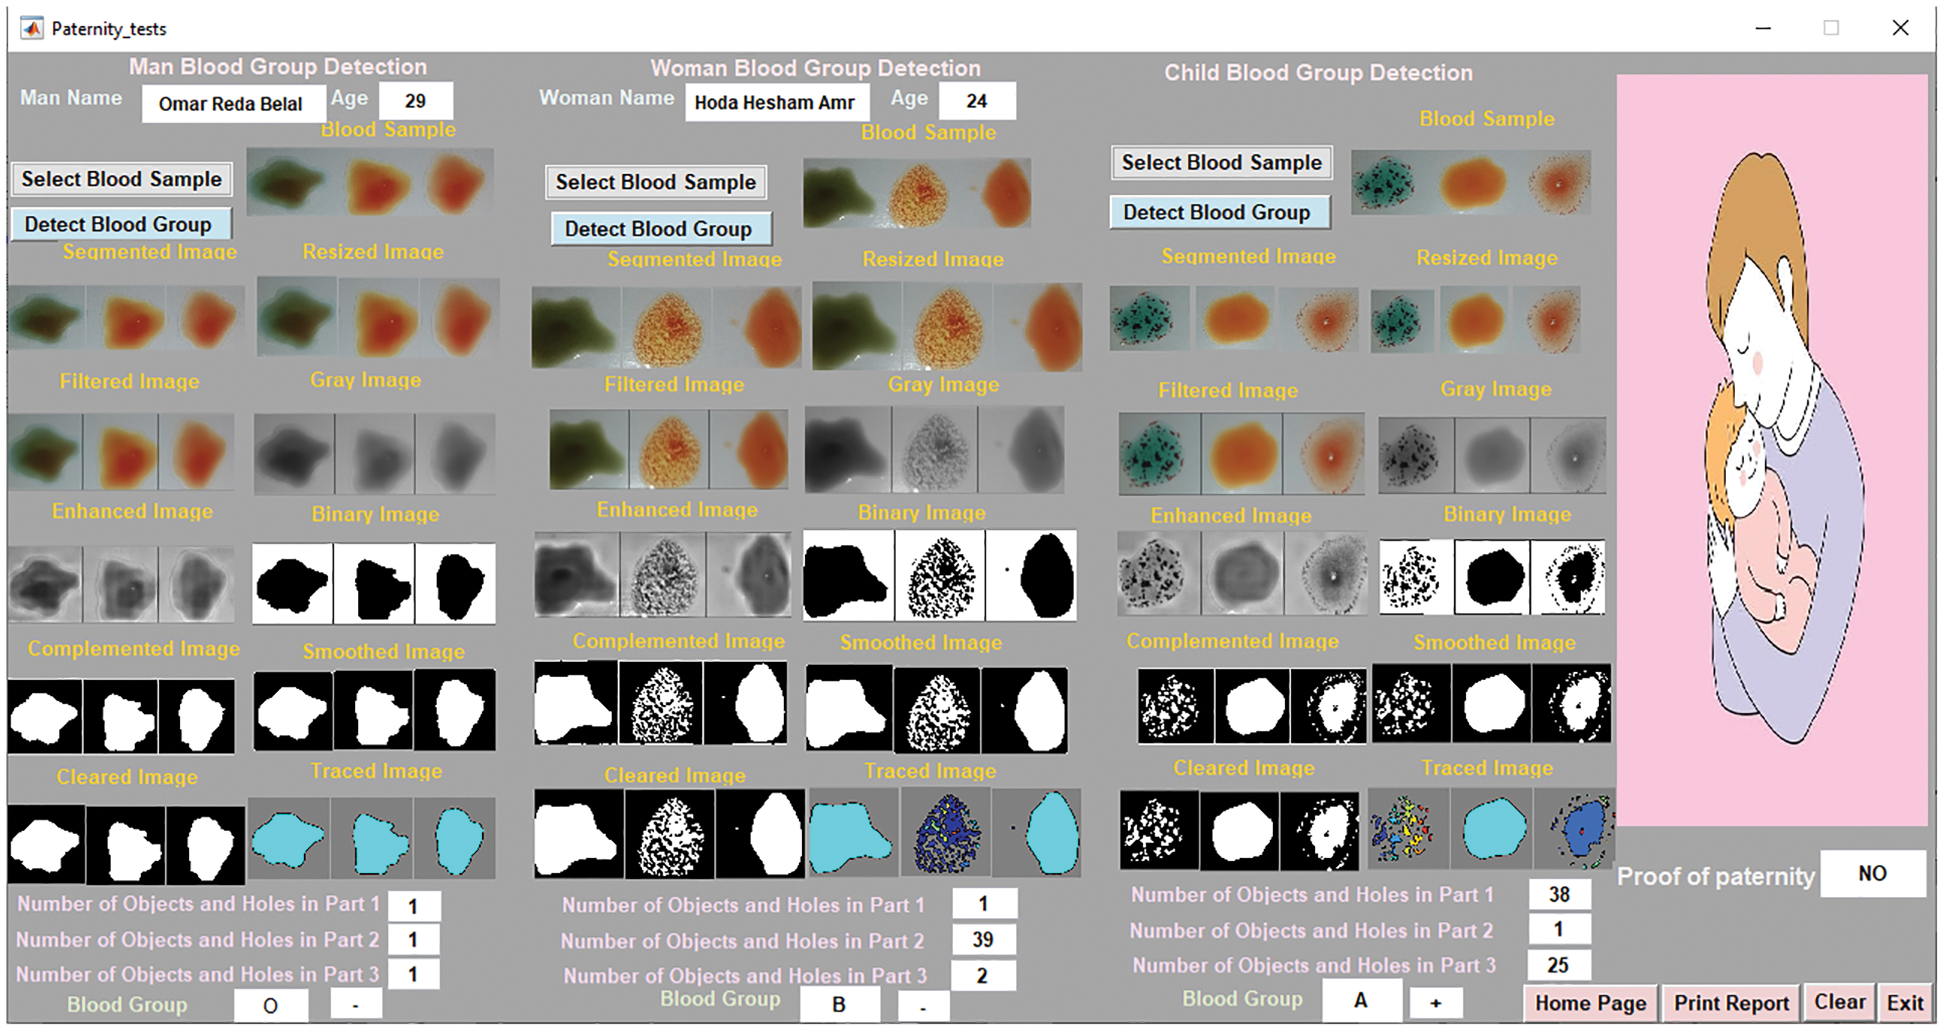
Figure 8: The paternity tests GUI
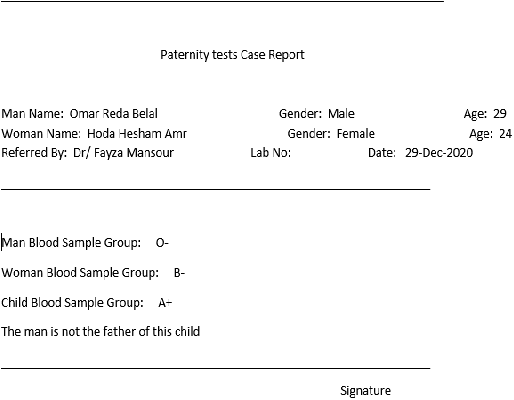
Figure 9: The paternity tests case report GUI
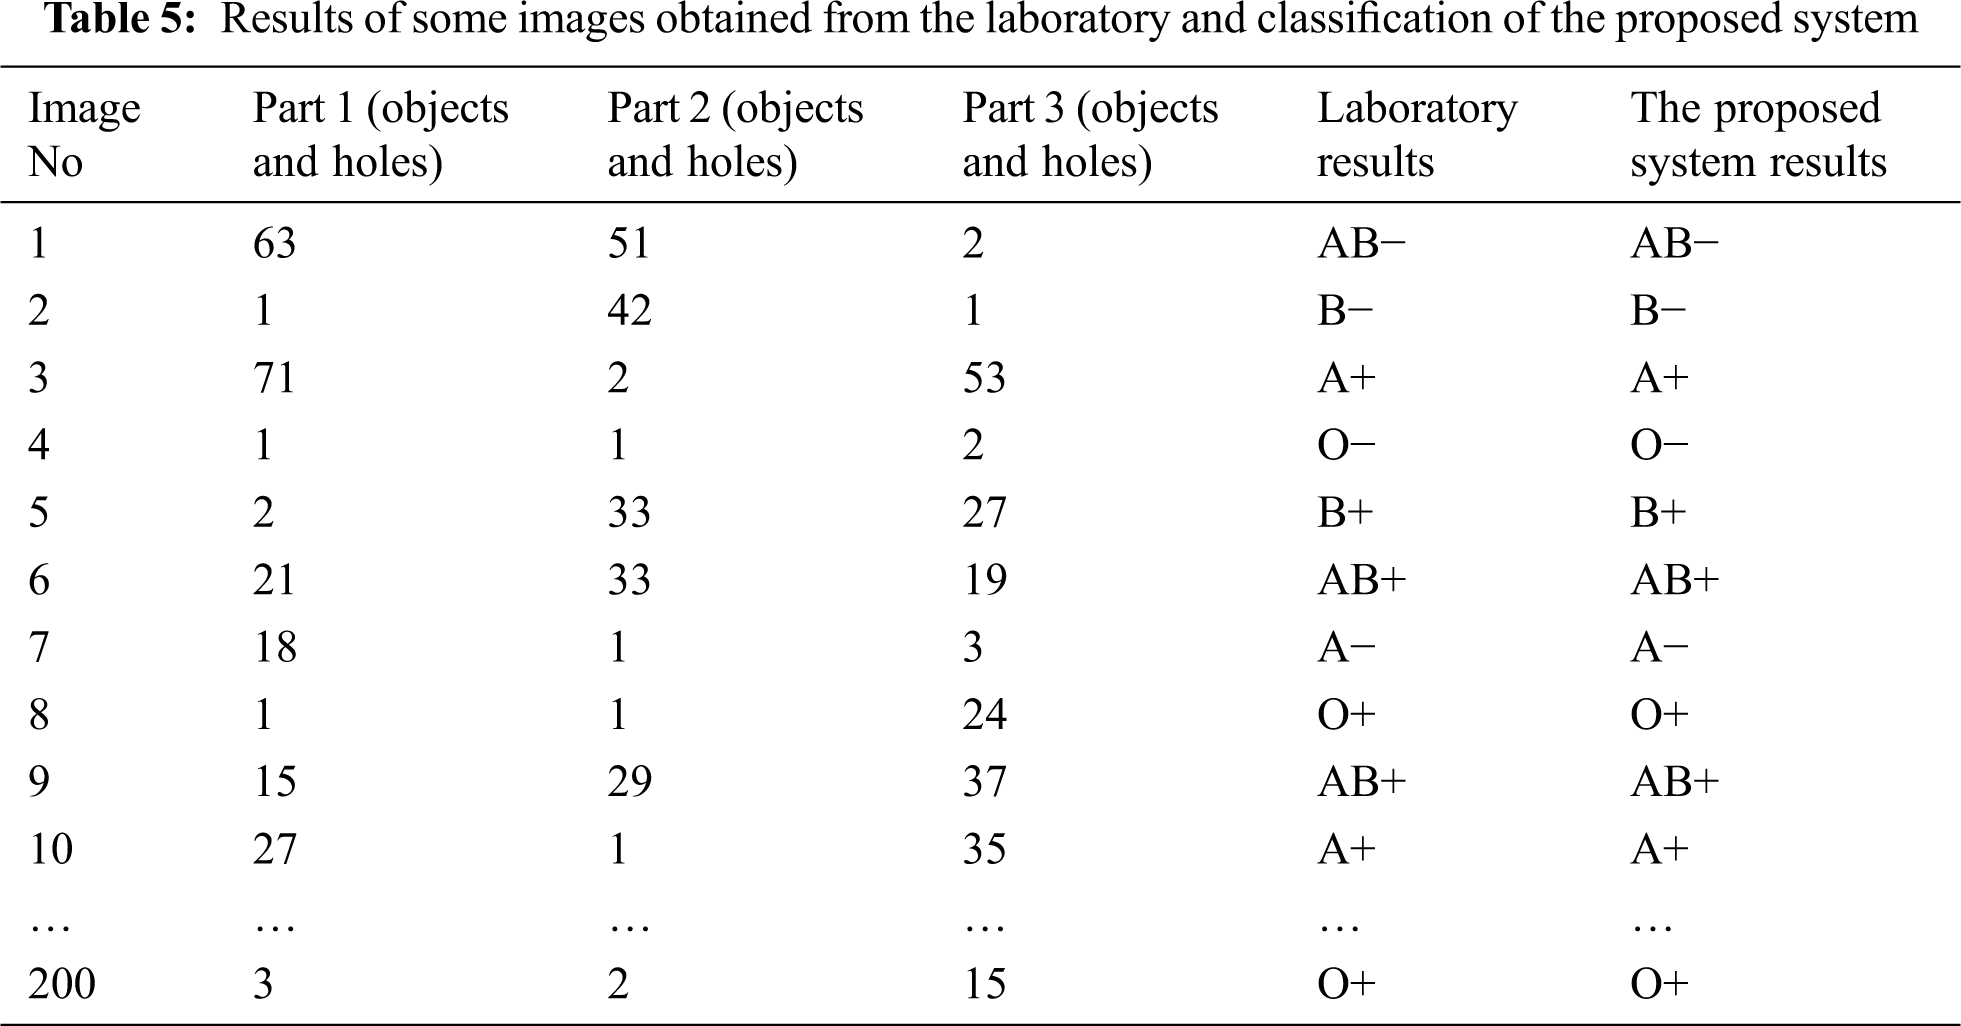
For testing purposes, the results of 200 images of the proposed system were taken and compared with the laboratory results. Tab. 5 displays the results of some images obtained from the laboratory and the classification of the proposed system.
The confusion matrix is applied to evaluate the performance of classifiers in datasets. It is used to distinguish between expected and real values of model elements in software engineering [57]. The confusion matrix has four outcomes [58,59]:
• True Positives (TP): are positive items correctly classified as positive.
• True Negatives (TN): are negative items correctly identified as negatives.
• False Positives (FP): are negative items classified as positive.
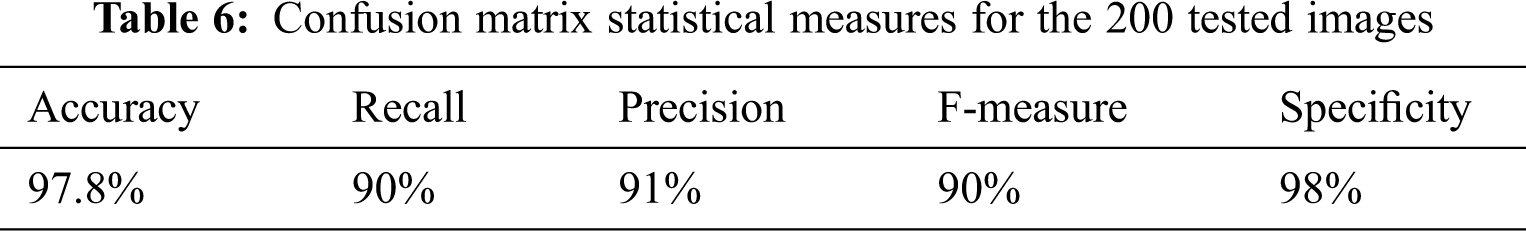
• False Negatives (FN): are positives items classified as negative. Fig. 10 and Tab. 6 show confusion matrix statistical measures for the 200 tested images.
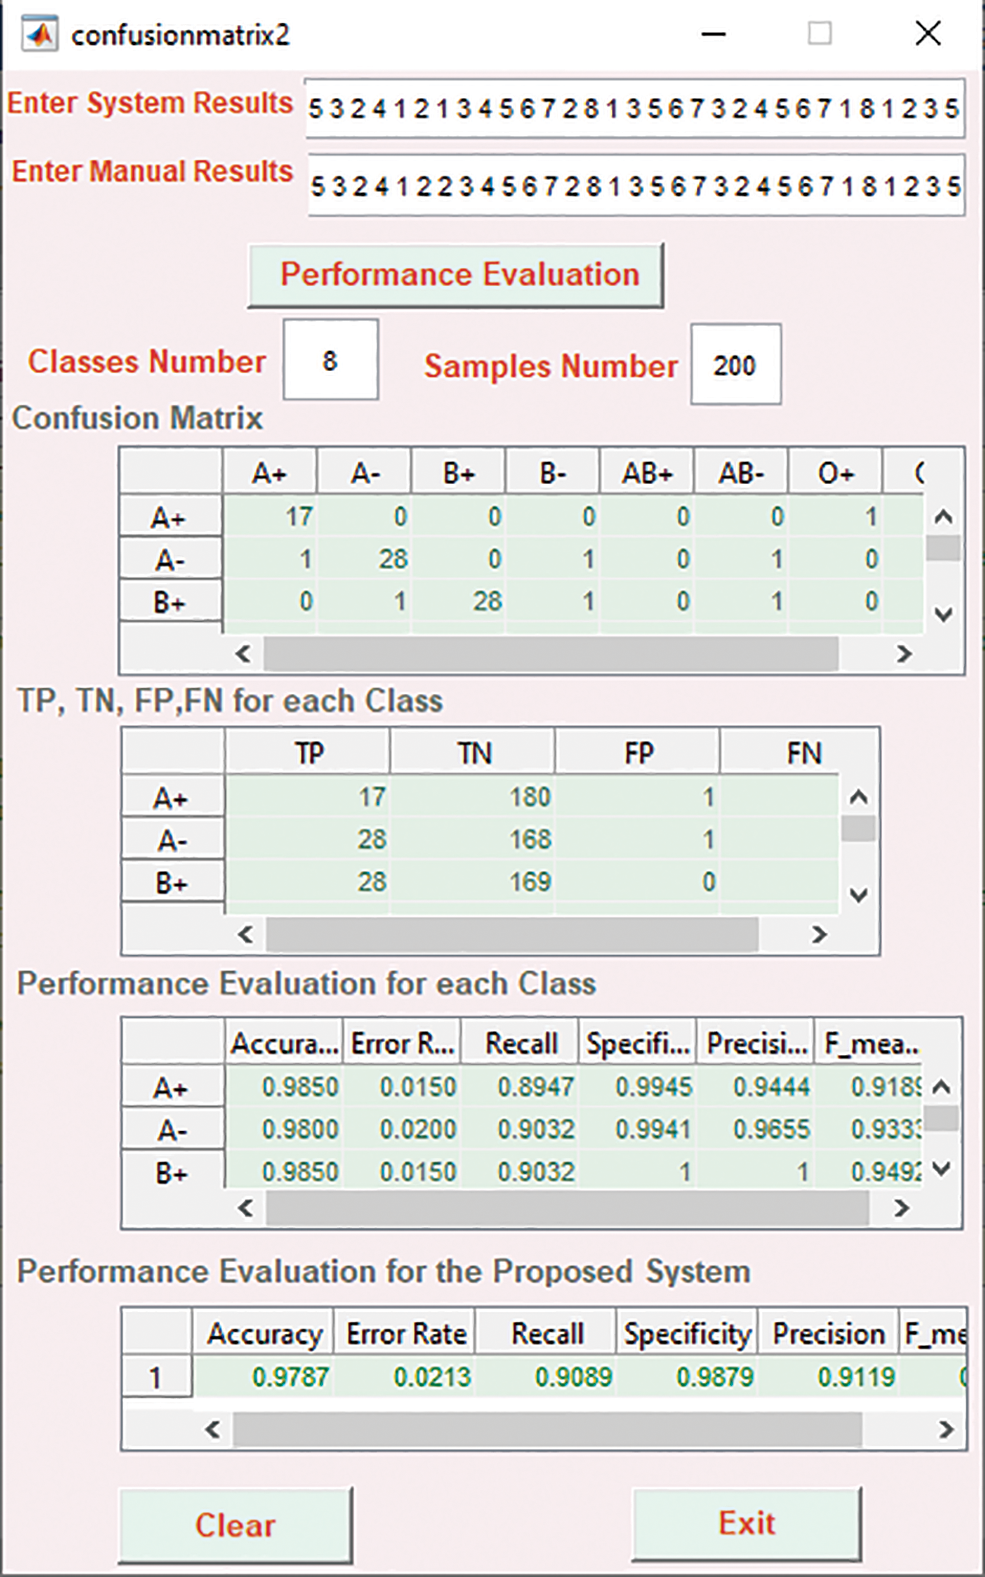
Figure 10: Confusion matrix statistical measures for the 200 tested images
Blood type is a way to find out what type of blood a person has. It is very helpful in cases of blood transfusion, blood donation, accidents, and other emergencies. This paper presents an innovative approach based on image processing techniques for accurate, rapid, and safe detection of blood groups. Images of blood samples are filtered using the mean filter and are enhanced using CLAHE. Classification is done based on the “Bwboundaries” Matlab function that uses here for the first time. This function is a very appropriate to distinguish between the form of clumping or not that occurs in the blood sample images as it counts the number of objects and holes in it. The proposed system also extends to present applications that depend on blood groups, such as pre-marital tests, paternity tests on the basis of the mother’s and father’s blood group, as well as blood groups that are given and received during the blood transfusion. The suggested user interfaces are easy to use and display step-by-step blood group detection and use in the different applications. The proposed system has achieved a high accuracy reached to 98% when compared with manual results which prove that it is an efficient and reliable system.
Funding Statement: The authors received no specific funding for this study.
Conflicts of Interest: The authors declare that they have no conflicts of interest to report regarding the present study.
1. S. G. Panpatte, A. S. Pande and R. K. Kale, “Application of image processing for blood group detection,” International Journal of Electronics, Communication & Soft Computing Science and Engineering, pp. 61–65, 2017. [Google Scholar]
2. V. A. Kanade, “Bio-optics: Blood type determination based on image processing techniques by utilizing an optical sensor device,” International Journal of Science and Research, vol. 5, no. 7, pp. 214–217, 2016. [Google Scholar]
3. S. Jana, N. S. Reddy and K. Gopi, “Novel image based blood group identification from agglutinated images,” International Journal of Recent Technology and Engineering, vol. 8, no. 1, pp. 2210– 2214, 2019. [Google Scholar]
4. E. Diyab, K. Al-Wehibi, J. AL-Nasseri, I. AL-Ghadani, K. AL-Baloushi et al., “Assessment of blood group’s awareness among the Omani population,” Madridge Journal of Nursing, vol. 3, no. 1, pp. 101–106, 2018. [Google Scholar]
5. A. Khazaleh, T. A. Hwaidi, M. S. Alnasraween and H. Al-Taj, “Students’ attitudes at Amman Arab university towards the pre-marital medical examination and its role in reducing disability from their point of view,” International Education Studies, vol. 12, no. 1, pp. 80–89, 2019. [Google Scholar]
6. J. Ayatollahi, Z. Akhondimeybodi, M. D. Mohebbi, T. Fallah, M. Pedarzadeh et al., “Descriptive factors associated to acceptability of premarital HIV testing in the Islamic Republic of Iran (2016–2017),” HSOA Journal of AIDS Clinical Research and STDs, vol. 6, pp. 1–8, 2019. [Google Scholar]
7. I. A. Kabbash, A. O. Attalla and S. A. Atlam, “Perception of importance of premarital counseling among medical students of Tanta university,” Egypt The Egyptian Journal of Community Medicine, vol. 37, no. 2, pp. 66–75, 2019. [Google Scholar]
8. Healthcare, Wellness, “Best blood group compatibility for marriage,” Accessed 2 September 2020. [Online]. Available: https://www.tampabaynewswire.com/2019/04/17/best-blood-group-compatibility-for-marriage-76963. [Google Scholar]
9. A. Dalvi and H. K. Pulipaka, “Determination of blood group using image processing,” International Journal of Scientific & Engineering Research, vol. 9, no. 3, pp. 24–27, 2018. [Google Scholar]
10. M. I. Qadir and M. Asad, “Synergy of blood grouping and body sweating,” Archives of Hematology Case Reports and Reviews, vol. 4, pp. 6–7, 2019. [Google Scholar]
11. T. Al-Dughaishi, Y. Al Harrasi, M. Al-Duhli, I. Al-Rubkhi, N. Al-Riyami et al., “Red cell alloimmunization to Rhesus antigen among pregnant women attending a tertiary care hospital in Oman,” Oman Medical Journal, vol. 31, no. 1, pp. 77–80, 2016. [Google Scholar]
12. S. Acharya and S. Ahmed, “A case of pregnancy with Rhesus antibody and bicornuate uterus: A favourable outcome: a case report,” Cases Journal, vol. 3, no. 50, pp. 1–4, 2010. [Google Scholar]
13. A. A. Almaiman and S. H. Almaiman, “Evaluation of blood donors and transfusion transmitted infections and their association with ABO and Rh blood groups in Unaizah, Saudi Arabia: A retrospective study,” International Journal of Medical Research & Health Sciences, vol. 7, no. 3, pp. 143–150, 2018. [Google Scholar]
14. P. Rahfeld and S. G. Withers, “Towards universal donor blood: enzymatic conversion of A and B to O type,” Journal of Biological Chemistry, vol. 295, no. 2, pp. 325–334, 2020. [Google Scholar]
15. J. Fernandes, S. Pimenta, F. O. Soares and G. Minas, “A complete blood typing device for automatic agglutination detection based on absorption spectrophotometry,” IEEE Transactions on Instrumentation and Measurement, vol. 64, no. 1, pp. 112–119, 2015. [Google Scholar]
16. J. Kim, E. Park and H. Lee, “The study of ABO genotyping for forensic application, forensic science international, Genetics Supplement Series, vol. 6, pp. e570–e572, 2017. [Google Scholar]
17. A. Mishra, S. Sathyan and S. Shukla, “Application of DNA fingerprinting in an alleged case of paternity,” Biochemistry & Analytical Biochemistry, vol. 4, no. 2, pp. 1–6, 2015. [Google Scholar]
18. S. M. N. Fathima, “Classification of blood types by microscope color images,” International Journal of Machine Learning and Computing, vol. 3, no. 4, pp. 376–379, 2013. [Google Scholar]
19. Y. Hande, S. Abhang, S. Bhosale and R. Deshpande, “Automated blood group detection system using image processing,” International Journal of Engineering Science and Computing, vol. 6, pp. 6702– 6705, 2016. [Google Scholar]
20. Y. M. Abdallah and T. Alqahtani, “Research in medical imaging using image processing techniques, medical imaging,” Principles and Applications, pp. 1–16, 2019. [Google Scholar]
21. Y. Dong, N. Chen, W. Fu, M. Lie, Z. Zhou et al., “ABO blood group detection based on image processing technology,” in 2017 2nd Int. Conf. on Image, Vision and Computing, Chengdu, China, pp. 655–659, 2017. [Google Scholar]
22. D. Keerthana and L. Ranganathan, “Design and development of blood sample analyzer using intelligent machine vision techniques,” International Journal of Engineering Science and Computing, vol. 7, no. 5, pp. 12017– 12020, 2017. [Google Scholar]
23. R. A. Pathan and R. Rathod, “Determination and classification of human blood types using SIFT transform and SVM classifier,” International Journal of Engineering Technology, Management and Applied Sciences, vol. 5, no. 1, pp. 1–8, 2017. [Google Scholar]
24. A. Ferraz, J. H. Brito, V. Carvalho and J. Machado, “Blood type classification using computer vision and machine learning,” Neural Computing and Applications, vol. 28, no. 8, pp. 2029–2040, 2017. [Google Scholar]
25. R. Jogi and A. Dhole, “Detection and classification of blood samples using soft computing techniques,” International Journal of Engineering Science Invention, vol. 8, no. 8, pp. 73–78, 2019. [Google Scholar]
26. G. V. Gurav and S. N. Patil, “Automatic blood group classification based on SVM,” International Journal of Innovative Research in Technology, vol. 4, no. 7, pp. 382– 387, 2017. [Google Scholar]
27. F. Noorbasha, B. P. Panda, T. Dinesh, B. Jaideepsai, G. N. Jagadeesh et al., “Design of FPGA based system to determining the type of human blood group,” International Journal of Innovative Technology and Exploring Engineering, vol. 8, no. 6S, pp. 120–123, 2019. [Google Scholar]
28. R. Jogi and A. Dhole, “Blood group detection using image processing techniques: A review,” International Journal of Computer Sciences and Engineering, vol. 7, no. 4, pp. 859–863, 2019. [Google Scholar]
29. S. P. Sathiyan, K. G. Jennifer, S. Swathi and G. M. Sharmini, “Blood group determination and classification using Raspberry Pi3,” in Proc. of the Int. Conf. on Microelectronics, Signals and Systems 2019, Kollam, India, pp. 30002-1–30002-8, 2020. [Google Scholar]
30. V. Pavithra, “Survey on identification of blood group by using image processing technique,” International Journal of Advance Research, Ideas and Innovations in Technology, vol. 5, no. 3, pp. 38–40, 2019. [Google Scholar]
31. A. Danti and K. Kumari, “Blood regions segmentation for automatic blood group identification,” International Journal of Computer Engineering and Applications, vol. XII, no. I, pp. 16–30, 2018. [Google Scholar]
32. A. N. Banu and V. Kalpana, “An automatic system to detect human blood group of many individuals in a parallel manner using image processing,” International Journal of Pure and Applied Mathematics, vol. 118, no. 20, pp. 3119–3127, 2018. [Google Scholar]
33. G. Ravindran, T. J. Titus, M. Pravin and P. Pandiyan, “Determination and classification of blood types using image processing techniques,” International Journal of Computer Applications, vol. 157, no. 1, pp. 12–16, 2017. [Google Scholar]
34. A. Mujahid and F. L. Dickert, “Blood group typing: from classical strategies to the application of synthetic antibodies generated by molecular imprinting,” Sensors, vol. 16, no. 1, pp. 2–5, 2016. [Google Scholar]
35. Q. Wang and Y. Yuan, “Learning to resize image,” Neurocomputing, vol. 131, pp. 357–367, 2014. [Google Scholar]
36. N. H. Barnouti, “Improve face recognition rate using different image pre-processing techniques,” American Journal of Engineering Research, vol. 5, no. 4, pp. 46–53, 2016. [Google Scholar]
37. P. K. Patidar and P. Dadheech, “Performance of fuzzy filter and mean filter for removing Gaussian noise,” International Journal of Computer Applications, vol. 182, no. 38, pp. 29–30, 2019. [Google Scholar]
38. A. Susmitha, I. Mishra and S. Jain, “Performance analysis of average and median filters for denoising of digital images,” International Research Journal of Engineering and Technology, vol. 3, no. 11, pp. 1436– 1438, 2016. [Google Scholar]
39. N. R. Kumar and J. U. Kumar, “A spatial mean and median filter for noise removal in digital images,” International Journal of Advanced Research in Electrical, Electronics and Instrumentation Engineering, vol. 4, no. 1, pp. 246–249, 2015. [Google Scholar]
40. MathWorks, “Filter Grayscale and Truecolor (RGB) Images using imfilter Function,” Accessed 13 October 2020. [Online]. Available: https://www.mathworks.com/help/images/filter-images-using-imfilter.html. 2020 [Google Scholar]
41. H. D. Alemayehu, “Development of automatic sesame grain classification and grading system using image processing techniques,” M.S. dissertation, Addis Ababa University, Ethiopia, pp. 15–16, 2017. [Google Scholar]
42. K. Khobragade, “A comparative study of converting coloured image to gray-scale image using different technologies,” in National Conf. on Recent Trends in Information, Technology, JSPM Pune Maharashtra, India, pp. 1–5, 2012. [Google Scholar]
43. MathWorks, “Convert RGB image or colormap to grayscale,” Accessed 17 October 2020. [Online]. Available: https://www.mathworks.com/help/matlab/ref/rgb2gray.html#. 2020 [Google Scholar]
44. J. Ma, X. Fan, S. X. Yang, X. Zhang and X. Zhu, “Contrast limited adaptive histogram equalization-based fusion for underwater image enhancement,” International Journal of Pattern Recognition and Artificial Intelligence, vol. 32, no. 7, pp. 2–3, 2017. [Google Scholar]
45. J. Lee, S. R. Pant and H. Lee, “An adaptive histogram equalization based local technique for contrast preserving image enhancement,” International Journal of Fuzzy Logic and Intelligent Systems, vol. 15, no. 1, pp. 35–44, 2015. [Google Scholar]
46. MathWorks, “Contrast-limited adaptive histogram equalization (CLAHE),” Accessed 18 November 2020. [Online]. Available: https://www.mathworks.com/help/images/ref/adapthisteq.html?searchHighlight=adapthisteq&s_tid=srchtitle. 2020 [Google Scholar]
47. MathWorks, “Global image threshold using Otsu's method,” Accessed 22 November 2020. [Online]. Available: https://www.mathworks.com/help/images/ref/graythresh.html. 2020 [Google Scholar]
48. S. Bhaskar, N. Lavassar and S. Green, “Implementing optical character recognition on the android operating system for business cards,” IEEE 2010, EE 368 Digital Image Processing, pp. 1–5, 2010. [Google Scholar]
49. MathWorks, “Binarize 2-D grayscale image or 3-D volume by thresholding,” Accessed 25 November 2020. [Online]. Available: https://www.mathworks.com/help/images/ref/imbinarize.html?searchHighlight=imbinarize&s_tid=srchtitle. 2020 [Google Scholar]
50. MathWorks, “Complement image,” Accessed 26 November 2020. [Online]. Available: https://www.mathworks.com/help/images/ref/imcomplement.html. 2020 [Google Scholar]
51. MathWorks, “Smooth Data with Convolution,” Accessed 2 December 2020. [Online]. Available: https://www.mathworks.com/help/matlab/data_analysis/convolution-filter-to-smooth-data.html. 2020 [Google Scholar]
52. MathWorks, “Remove small objects from binary image,” Accessed 9 December 2020. [Online]. Available: https://www.mathworks.com/help/images/ref/bwareaopen.html. 2020 [Google Scholar]
53. MathWorks, “Trace region boundaries in binary image,” Accessed 13 January 2021. [Online]. Available: https://www.mathworks.com/help/images/ref/bwboundaries.html?searchHighlight=Bwboundaries&s_tid=srchtitle. 2021 [Google Scholar]
54. S. I. R. Okoduwa, “Blood group and genotype compatibility,” Infohealth Awareness Article, vol. 1, pp. 84–87, 2013. [Google Scholar]
55. M. Alizadeh, F. Sharbafi and M. M. Paydar, “A bi-objective natural disaster blood supply chain network considering blood transfusion: A case study in Babol,” International Journal of Industrial Engineering & Management Science, vol. 7, no. 1, pp. 20–43, 2020. [Google Scholar]
56. E. D. Shapiro, S. Reifler and C. L. Psome, “The DNA paternity test: Legislating the future paternity action,” Journal of Law and Health, vol. 7, no. 1, pp. 19–22, 1992. [Google Scholar]
57. M. Hasnain, M. F. Pasha, I. Ghani, M. Imran, M. Y. Alzahran et al., “Evaluating trust prediction and confusion matrix measures for web services ranking,” IEEE Access, vol. 8, pp. 90847, 2020. [Google Scholar]
58. K. J. Bhanushree and M. B. Meenavathi, “Feature based face recognition using machine learning techniques,” International Journal of Recent Technology and Engineering, vol. 8, no. 6, pp. 1313–1315, 2020. [Google Scholar]
59. Z. Rustam and N. P. Ariantari, “Support vector machines for classifying policyholders satisfactorily in automobile in insurance,” in 2nd Int. Conf. on Statistics, Mathematics, Teaching, and Research, Makassar, Indonesia, pp. 5–6, 2018. [Google Scholar]
 | This work is licensed under a Creative Commons Attribution 4.0 International License, which permits unrestricted use, distribution, and reproduction in any medium, provided the original work is properly cited. |