DOI:10.32604/iasc.2022.019060
| Intelligent Automation & Soft Computing DOI:10.32604/iasc.2022.019060 | |
| Article |
Implementation of Artificial Intelligence Based Analyzer Using Multi-Agent System Approach
1College of Computer and Information Systems, Umm Al-Qura University, Makkah, 21955, Saudi Arabia
2Department of HITM, Faculty of Public Health and Health Informatics, ICRS Consultant, Umm Al-Qura University, Makkah, 21955, Saudi Arabia
*Corresponding Author: Mohamed O. Khozium. Email: mokhozium@uqu.edu.sa
Received: 31 March 2021; Accepted: 23 May 2021
Abstract: Using Business Intelligence (BI) applications is a critical factor for modern enterprises’ success. BI is one of the key components that persistently required for the modern high-tech companies and industries were used to handle huge amounts of data in every minute of the operations. The existing literature suggested that the lack of dynamic decision making, accuracy, and the degree of flexibility are the key limitations for handling the operational data. Many industries and companies adopted the software-based solution; however, the intelligence is there due to the dependence of the operational engagement for each of the sectors. Therefore, artificial intelligence business framework is urge to implement in the industrial and company’s larger data handling and dynamic decision making that should have the multi-agent system adopting business analyzer model. Towards developing a more universal and cooperative platform, this paper proposes a business Analyzer model. It implements it in an Analyzer agent that can functionally participate in a BI Multi-Agent System (MAS). Unlike previous analyzers which are usually included in other services, this Analyzer is a stand-alone agent that adds an abstraction level to the BI model processing. We have started by defining a BI model using MAS. Building on that, we have created the Analyzer model. Then, we have suggested the Artificial Intelligence (AI) techniques that can satisfy the Analyzer model requirements and implemented it in an Analyzer agent. The functionality and results are promising. This paper opens the road for the researchers to proceed toward universal BI model and the opportunity to implement new BI services.
Keywords: Business intelligence; business analytics; artificial intelligence implementation; universal business intelligence model
Business Intelligence (BI) is no more a luxurious option for contemporary companies. It is a crucial and persistent need due to the vast amount of available data that can change the company’s competence if it was analyzed and used correctly [1,2]. It is not enough for a company to meet the minimum requirement and maintain a limited revenue in order to survive. The company should have a good awareness of the economic environment and its functionality in the economic context to gain a good degree of flexibility and dynamic decision-making in the competitive landscape [3,4].
Typically, business managers and employees have great use of documents and spreadsheet files represent data from different departments. Each department uses a suitable set of files which sometimes cannot be integrated with other sets. Sometimes, there are even multiple platforms or frameworks to run these departments. This makes the evaluation improving too complicated and almost impossible [5]. To solve this complication, BI applications provide reasonable solutions for these problems by collecting and analyzing the state of the business parameters in the context of the proceeding and completed operations and predicting future provisions [6]. Thus, BI involves Artificial Intelligence (AI) techniques, cloud computing, and big-data operations to elicit information from data and conclude knowledge from that information to assist managers and directors’ decision-making process [6–8].
Theoretically, the BI provides techniques that focus on the possibilities of having pretentious features. However, there is a crevice splitting the theoretical BI from the practical one. The observer of BI application finds rather dashboards and reporting tools which are not even user friendly. Until now, BI applications need specialists and professional users [9]. Moreover, BI techniques employ AI algorithms and data mining algorithms, requiring a comprehensive observation of the business environmental scope. In contrast, the actual business environment contains a vast and dark area representing the competitors’ information and other unavailable data [4]. These challenges represent the obstacles BI is trying to pass.
The use-case of BI applications involves cases as simple as data representation and as complex as participating in business creation [10] including reporting, dashboards, search-based BI, OLAP, interactive visualization, scorecards, predictive modeling, and data mining [11]. BI aims to create a stronger customer engagement at a higher level, lowering operating costs, improving order and stocking efficiencies, developing more-relevant customer loyalty programs, detecting and correcting budget deviations, increasing sales force effectiveness, and improving customer satisfaction [5]. As we can see, these goals go beyond the company knowledge scope. This means there are different data resources of various BI applications to analyze unstructured data such as web content [11]. This use-case requires special evaluation and development methodology based on three aspects: System reliability, flexibility, and scalability [12].
BI exploits business analysis to understand and measure the environment’s knowledge, including internal data like the organization database, and external data like the competitive environment [4]. Designing BI application from goals declaration to decision making goes through four necessary and important phases: collecting data, processing, analyzing, and presenting the findings for decision making [3]. These phases make the cost relatively expensive as it is hard to provide full functionality in real-time, and it is harder to gain all the needed information properly [4]. There are helpful models to assist in passing cost obstacles. Usually, BI application functionality is analyzed in light of the data properties to decide the appropriate model [11].
Observing the theoretical aspect of BI [13], we can design a model to create an automated artificial administration that can recognize the business world, evaluate it, make decisions, schedule tasks, and issue orders. If we disregard the cost factor, we can build a BI model structure that recognizes business changes and defines the improvement factors. However, we do not see BI applications implement such models due to the absence of a unified cooperative BI model [14]. Such a model should enable cooperative integration, which means that each BI application participates in improving a universal model and retrieve knowledge from it in real-time interaction [15]. There are many organizational models for BI, but less of them support universal integration without being cooperative. In these models, each service works, collects data, analyzes, and concludes for itself. This results in limiting the efficiency and reinventing the wheel in every application. On the other side, the cooperative model helps developers and service providers to develop and build over the previous works [16].
This paper assumes using a universal cooperative BI model based on Multi-Agent System (MAS). This MAS consists of four online agents. An agent for gathering knowledge and information retrieval [17]. This agent is called Retriever, and it represents the knowledge resource for the BI system and the sensor through which the system will recognize the world. The information gathered by a Retriever needs to be analyzed and structured in order to be useful. An Analyzer agent does this task. Meanwhile, the raw data, the under-processing information, and the pure analyzed cases are stored on a knowledge base managed by a Storage agent, be it a simple database server or a data warehouse. The information saved in the knowledge base may be shaped in the end-user preferred form using an Exhibitor agent, which can be implemented in a simple dashboard or in a complete Decision Support System (DSS).
The four agents represent the types of online applications required to implement the model. Each agent running on itself and for its service and cooperate with other agents to form and abstract Universal BI Model on the cloud to be that source of knowledge for these agents to interact retrieving and building. Three of the four agents above already have some initial implementations. The retriever agent would be a meta-search engine. The Storage agent could be a warehouse empowered by Online Analytical Processing (OLAP). The Exhibitor would be a dashboard.
Meanwhile, the Analyzer has no actual implementation. Usually, it is embodied in the previous three agents under Business Analytics [1,2]. However, the model needs to have a separate Analyzer agent for modularity and service metering. Fig. 1 presents a MAS that implements the universal BI model and how its agents interact online.
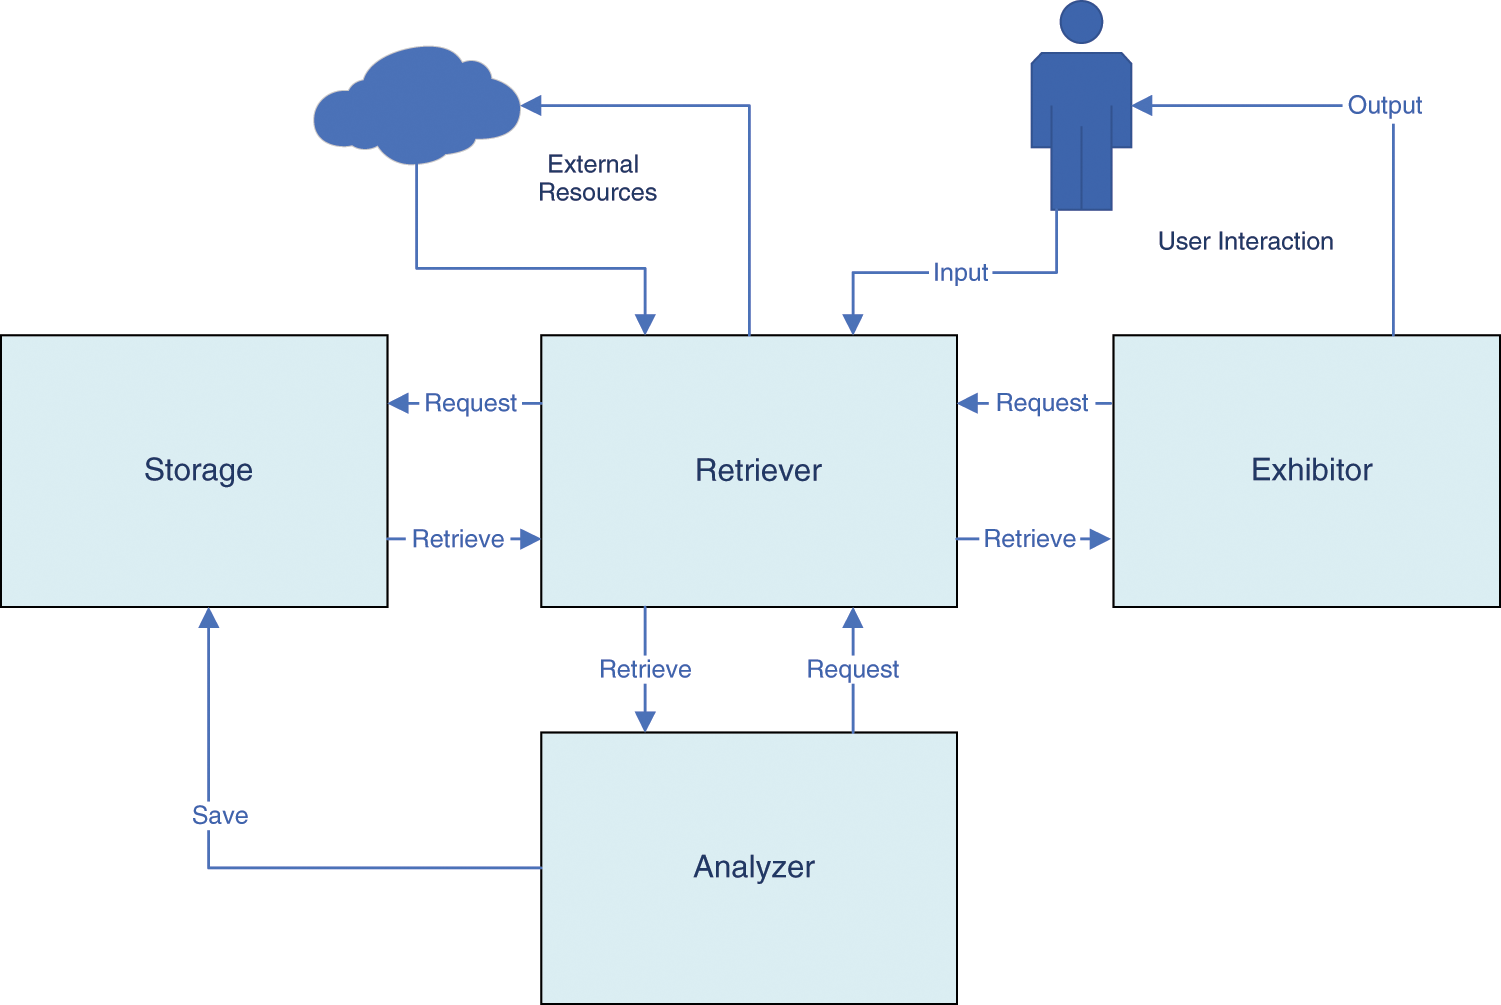
Figure 1: MAS implements universal BI model interactions
There are enough analyzing algorithms and techniques, but none of them can do the whole job. Merging some of them and adding integration among them will do the job [18]. We can find the term “Business Analyzer” in modern and legacy BI literature that might belong to the nineties of the last century [19]. Still, the concept has been improved and redefined many times [20]. While the Retriever agent collects data of different types and the Storage agent keeps the knowledge, the Analyzer agent employs the collected information to extrapolate it. The collected data could be textual, images, or even some previous processed related knowledge from the storage. The Analyzer will employ these collected data, define the relationship that connects them, and weigh their impacts on each other to reduce new modeled knowledge and send the result to the Storage to be considered if any related case is triggered.
This paper aims to propose a BI Analyzer agent model and implement it by integrating the available AI techniques. This paper contains four sections. The first section is this introduction, which contains an observation over the BI model under which the Analyzer agent will operate. The second section builds the Analyzer model. The third section proposes a case study and discusses the process of implementing an Analyzer agent. Finally, the conclusion is in the fourth section.
The Analyzer agent is an online agent that operates an analytical system in real-time to process and analyzes streams of events, which are the business aspects [1]. To understand the automatic analytical approach, we can investigate the non-automatic analysis tasks and find automated replacements. Typically, business analysis involves three elements. The first element is an electrical element represented by the information system that organizes, stores, retrieves, and delivers information. The second element is the human competencies to seek beneficial information and conclude results considering the decisions. The third element is the business processes according to company nature [21]. The second element (the human element) uses the first element (the information system) to conclude the third element (the decision). During that, this human element goes through five steps. The first step is to assemble the sources. Then, the human element will validate the information gained from those sources. Then, the information should be organized in a meaningful way after that comes to the proposing assumption. Finally, the human element will connect the information to get a validated result in light of the analytical process [22]. With a higher abstraction of the business analytics, we can find that the analytical approach contains five main sub-processes: Information access, Insight and reasoning, Foresight and prediction, Business agility and decision support, and strategic alignment and execution planning [1].
BI’s analytical process is one of four types: Decision analytics, Descriptive analytics, Predictive analytics, and Prescriptive analytics [15]. The BI Analyzer is expected to provide means for these processes [23]. The decision analytics represents the choices available in the business context. The descriptive analysis is concerned about the aspect’s status in the company. The predictive analysis is the way to gain foresight on the business aspects after changing some variables. The perspective analysis compares the predicted scenarios and chooses the most suitable one for the business context.
Consider the following scenario. Suppose that a manager is trying to find what is the suitable advertisement media for his marketing plan. He will need prior knowledge of the available media and a comprehensive awareness of his company’s business profile. He might search in the possible resources to survey the available media. Then, he will analyze the findings in light of the business profile. That analysis includes recognizing the previous findings’ content, understanding it, and evaluating it in a scalable method to compare the results and decide which one is the best. Those are the practical steps that we are automating in this paper.
Fig. 1 shows how the Analyzer agent interacts with the Retriever agent and the Storage agent. When the Retriever agent is asked about evaluating relations, it will first try to find any similar resolved association kept by the Storage agent. If no sufficient result is provided, it will request an analysis of that relation. Technically, any connected company will need at least one analytical thread for its financial goals. The Analyzer agent will start a case from the requested aspect and request information related to it. When the Retriever offers the information, the Analyzer will conclude the relations and predict the weights. In an ideal situation, the Analyzer will provide a weighted model representing the participant’s relationship. While these steps are easily understood as a scenario, they are running online in real-time and asynchronously. Fig. 2 reveals how the Analyzer agent interacts online.
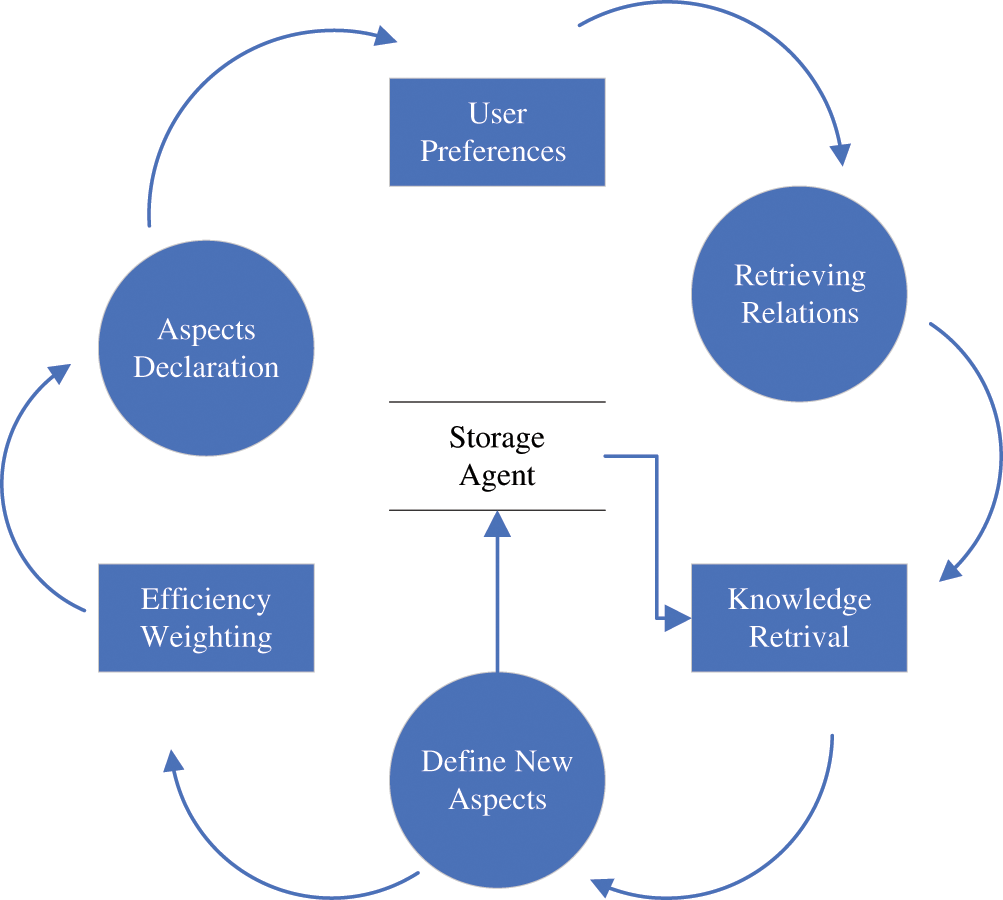
Figure 2: Analyzer agent online process
Applying this to the previous example, the manager recognizes the aspects in the resource and statistics of the relations that connect these aspects. Finally, the manager will use his prior knowledge in addition to the newly gained knowledge to evaluate these aspects by assigning a semantical value to each one that represents its priority in the context of the case. When the manager decides, he simply considers the case in light of the aspects’ values and relations’ evaluations. This section will build a model capable of making an Analyzer agent with full functionality irrespective of the implementation methodology.
2.1 Concepts: Aspects, Relations, Cases
The first step is to unify the names of the terms to be used in the model. What we are expecting the Analyzer to perform is to analyze the business context. This business context consists of aspects and relations that connect these aspects. These relations define the impact of each aspect upon others. The aspects combined with their connections form the case of the business context. The relation represents a function that takes two aspects as parameters where it will use the first to evaluate the second. Where the aspect s0 is related to the aspect s1 in the relation r, this can be expressed as:
Assumingly, the relation between the value of s0 and the value of s1 is linear. This means that we can replace the r() function with a linear model:
However, we should never forget that this linear model is of the relation and not of the aspect. This means that if two or more aspects are related to another aspect, the last aspect’s value is evaluated by the sum of the relations connected to it. Hence, we should remember that although mathematically we can sum the intercepts into one constant intercept, we need to consider them separately in the light of their relations for the coming training and abstract storage:
The important analytical variables are the intercepts and slopes of the relations, while the values of the aspects will be gained from the user’s direct input or by analyzing it and finding the relations connected to it. Here, we can define the Analyzer agent’s functionality as to organize the aspects and relations in the case and evaluate the slopes and intercepts of the relations to build a model that can predict the values of the aspects under other scenarios. For this purpose, we can use linear regression, which eventually forms a neural network.
2.2 Functionality: Recognition, Weigh, Prediction
From the manager example, we find that we have three basic steps to analyze the content. These steps are to recognize the aspects and relations in content, model the aspects and relations in a suitable structure, and assign values representing the weights of the aspects and relations. After analyzing, we will have a model that can predict the suitable decision considering the case and any similar cases. This model can also be used as a resource for other cases, which might share some common aspects.
We will come to a suitable structure later in this section. For now, we will focus on the functionalities the Analyzer agent has to serve. The first functionality is to recognize the content of raw data. Various raw data types are processed like texts, multimedia, signs, or other data types. This suggests that we need a universal functionality for all these types, while in the implementation, we just add a driver for each type defines the techniques to be used to recognize the data type. Recognizing the content means to be able to extract the aspects and represent them in a relational form.
For example, the manager would find an approved article, which might imply that social media advertising increases the demand for the company’s services. Recognizing this means to understand that there is a relation r = “increases” between the aspect s0 = “the demand for the services he provides” and s1 = “social media marketing”. While the intercepts and slopes are not recognized yet, they will be set to be predicted in light of the case context. Usually, the relation is the verb, s1 is the subject of the statement, and s0 is the statement’s object. In a non-lingual resource, the driver may provide a means to extract the relation and aspects according to the techniques used for recognition. As if the raw data is a chart representing the income after using three types of media for advertisement, the entities are the income and the media type. The relations are the effect of those media over the income as increase or decrease. Tokens would be social media, TV, journals, posters, and income. The relations then would be social media advertisement increases the income, TV advertisement increases the income, journal advertisement does not affect, and posters maintain the income.
During recognizing the content, we come over a scheme that we repeat in every recognition. We first make sure that we can identify the aspects of the content. These aspects should be expressible in a lingual form to construct a meaningful phrase like a TV advertisement or social media advertisement. That means the Analyzer Agent is lingual in nature. Other data types are transformed into lingual relations in the recognition phase using their drivers. The recognition process’s output is the same for all raw data, which is a group of related phrases. The relation of two phrases represents a function that takes the first phrase as a parameter and returns an effect on the second phrase, as we have clarified earlier. Fig. 3 represents the initial recognition for aspects and relations in the previous example.
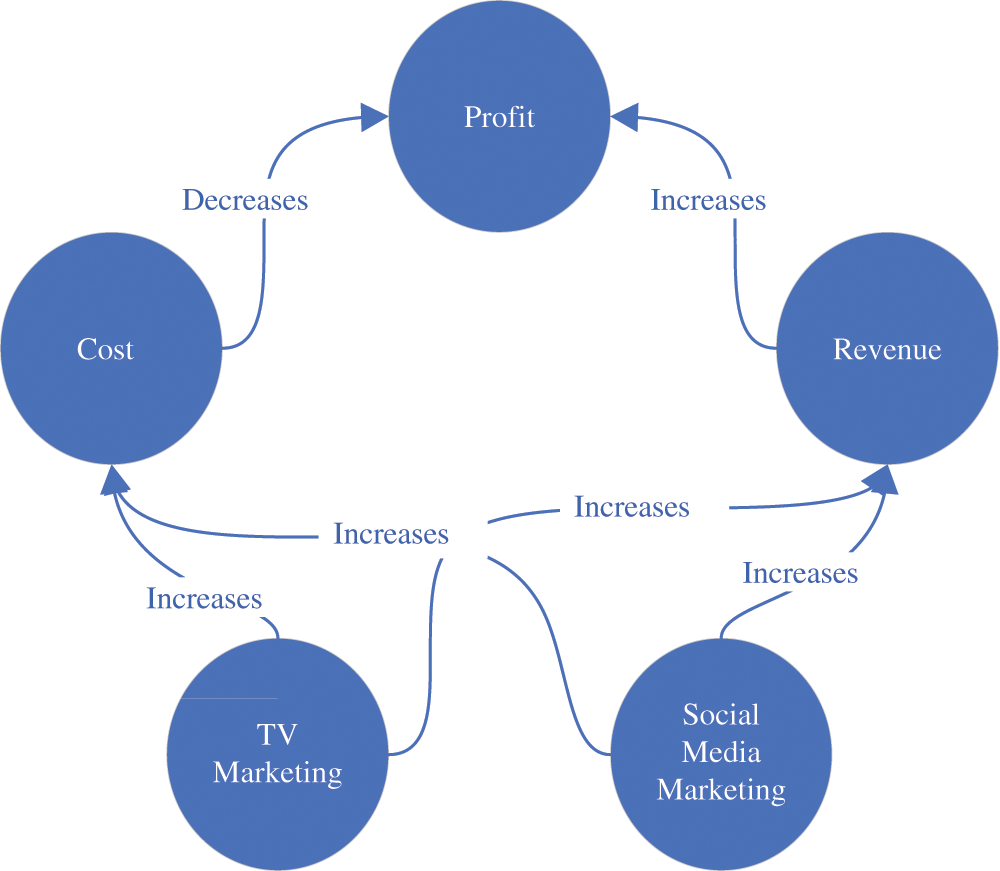
Figure 3: Relations extracted during the recognition phase
The next step is to weigh the intercepts and slopes of the relations. This can be done by three means: concluded from the information retrieval, direct input by the user, and predicted from the case context. For the weight to be concluded from the information retrieval, a new task is added to the recognition steps, recognizing any numerical relations and recognizing its operations and operands. If the meant aspect participates in that numerical relation as an operand, the connection is processed to form the equation.
The second weighing method is to use direct editing from the human element. Sometimes, there are cases which has been academically studied or sufficiently observed and concluded. It is more efficient to define the relations of this case manually.
Finally, where there is no numerical relation defined in the resources nor by the user, the intercept and slope are set to default as 0 and +1 correspondingly (−1 in case of decreasing relationship). Then, the aspects’ values are monitored, and the intercept and slope are updated occasionally, corresponding to the updated values using regressions and backpropagation. Fig. 4 shows an example of the weighted relations in the context.
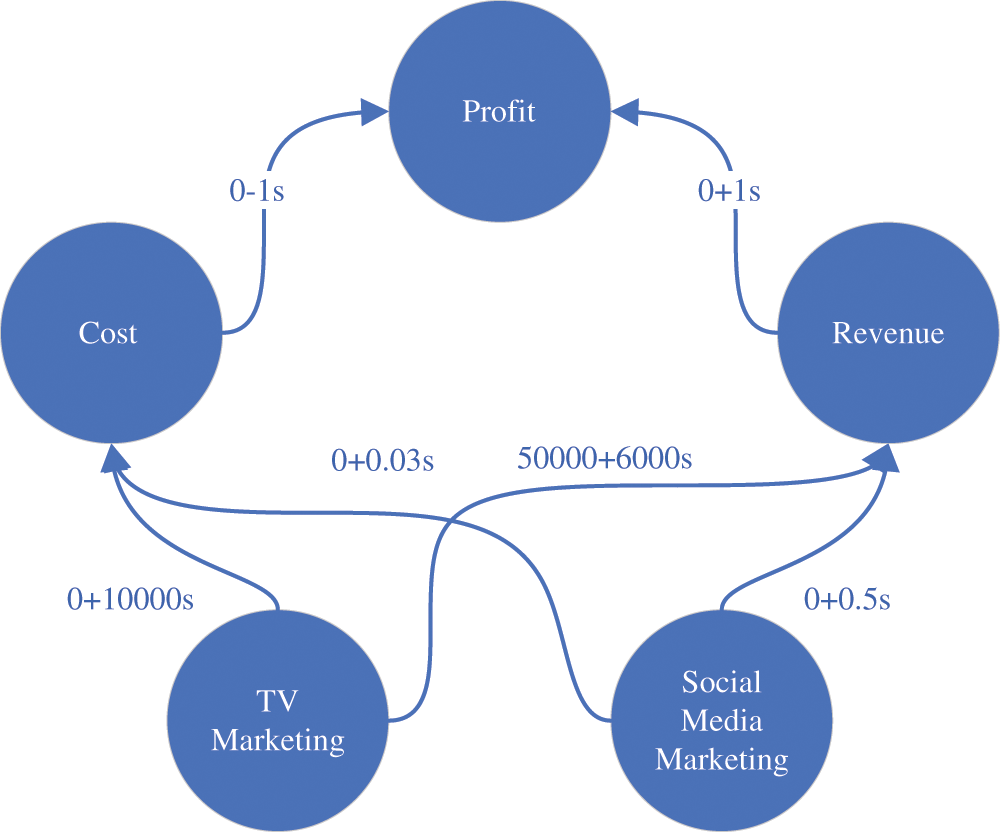
Figure 4: Relations with weights
We can find that according to the designed model, TV Marketing loses its efficiency gradually, so the final impact upon the profit decay faster than the growth. We are concerned about maintaining the growth of the profit. We will need a warning technique to attract our attention to the possibility of future loss of efficiency. This is the Analyzer’s third functionality, which is to predict values in the future and define their parameters. The Exhibitor agent will be responsible for translating these predictions into advice or decisions, while the Analyzer agent’s responsibility is to underly the effective aspects and their impact upon the case.
2.3 Belief: Weighted Graph, Chronological Index
There are many suitable data structures to organize the Analyzer agent’s data. On other occasions, where the Analyzer was used as a complete functionality entity, not as an integrated agent, the decision tree [24] is a suitable solution for modeling the Analyzer’s belief. However, considering the proceeding model, a weighted graph is the most suitable data structure where the aspects represent the vertices, and the relations represent the edges. Each edge will need an evaluation function that will calculate the effective aspect’s impact upon the affected aspect. In addition, each vertex will need to enable a value function that will sum the evaluations of the connected relations. This graph represents the belief of the Analyzer agent in real-time. The fitting of the intercepts and slopes of the graph’s relations will simultaneously separate thread.
The fitting process needs to obtain a complete observation of the changes in the aspects’ actual values. These changes need to be indexed using a global Chronological Indexer (from the model scope) that will define when each changed happened in the context of the case. This proposes implementing an auto-increment variable to indicate the online processing round to be used as an indexer and a dictionary representing the history of the changing in the values. All of these changes are done by the user updates. Upon a sufficient number of updates, the Analyzer will be able to provide accurate values of the slopes and intercepts.
2.4 Interaction: Retriever, Storage
The Analyzer agent’s belief represented by the weighted graph and the chronological indexer represents a core model for the case that, with some modification, can be applied universally. These modifications are the Storage agent’s job, which will compare the models received from multiple Analyzer agents by combining the indexers and refining the intercepts and slopes. After that, if a Retriever agent requested a relation, it will be served accordingly.
When the Analyzer asks a retriever about some relation, it will be recognized if it is a user input like a constant value or a relation between two or more aspects. If it is a relation, the Retriever will first request the available related data from the Storage agents. If no sufficient result is provided, the Retriever will search the internet for any cooccurrence involves the aspect and offer it to the Analyzer to build a new relation.
There are two main evaluations for Analyzer performance: Benchmark and Accuracy [25]. The expected running time depends on the significance threshold. The significance threshold is a global constant that defines the threshold where the fitting will stop and where finding new related aspects will stop. If the difference between the actual value and the predicted value is less than that threshold, the fitting will stop. If the new aspect’s impact upon the root aspect is less significant than the threshold, the element will be ignored. If the threshold is set to one, the fitting algorithms and finding sub-aspects processes will continue infinitely.
The Analyzer will traverse over each vertex, calculate its value, and evaluate its relation. Each of these functions belongs to ∈ O(n). On the other hand, the modern linear algorithm can solve the fitting round in an (n) time. This means the running time of the fitting algorithm = the index * n. Where the threshold h < 1, the running time = (the epochs needed to for the accuracy to reach 1-h) * n, and the growth belongs to ∈ O(n). The model applies a fit for each aspect but using a separated thread for each fit. This means the online epoch duration belongs to ∈ O(n). However, the constant C for the previous Big O notation is high for the fitting algorithm and lower for graph processing. This means there will be an asynchronous modification upon the slopes and intercepts. The chronological indexer will determine the updated value and consider it upon request.
The accuracy of the model refers to two indicators: the accuracy in finding the connected aspects and the fitting accuracy. The constant significance threshold limits both of them. Setting a too low significance threshold will loom up the threat of having an infinite fitting process or a too large model.
This section will elaborate more on the example used in this paper and develop an application to analyze the case using the Analyzer model. The example considers a manager looking for suitable advertising media for his business. The BI application of the company used by the manager implements an Exhibitor agent and is connected to the universal BI model. An external Analyzer agent provides the analyzing services. The application will request a relation model that involves the marketing media types’ impact upon financial goal (the profit). Virtually, the Retriever will ask the Storage agents to send any similar evaluated relations. Where no evaluated relation is available, the Retriever will request creating a new case from the Analyzer agent with the root of the goal, which is the profit.
This section develops an application that implements the Analyzer agent model to solve this case.
We focus on implementing the Analyzer; we manually satisfy the other agent’s universal BI model requirements and provide channels to connect to the Analyzer using the same Application Programming Interface (API). For the Storage agent, we use an in-memory Storage object that keeps the concluded relations in a relation list and appends the chronological indexer new information to a central indexer. The Retriever agent checks the Storage agent for every request. If it could find an answer there, it would search in an external file representing other resources. If the aspect is found, the paragraph will be delivered to the Analyzer. Finally, the user inputs are predefined in a dictionary so the Retriever can acquire the forced values from it.
The Analyzer agent’s concepts (aspect, relation, and case) are implemented as objects and structured using a weighted graph data structure. The graph is an attribute of the case. The chronological indexer represents using an incremental counter variable. An array of dictionaries represents the forced modifications upon the aspect values over the time-indexed by the counter for the variety and the dictionary index’s aspect name.
The application is implemented as a Python script. It should run in a loop virtually infinitely unless an interruption occurred. For the implementation purposes, the script runs on a single time basis to observe the changes and impacts. The online tasks start with requesting aspects according to the requested analysis, which is to reach a relation connect the profit aspect with the marketing aspects of different types. The Analyzer will look for relations where the profit is the object or the types of media marketing is the subject and proceed to process the results in the coming epochs until the two ends are connected. The uninvolved relations are eliminated, and the Analyzer requests the weights (the intercepts and slopes of the relations) or values of the aspect to estimate the weights. Finally, the Analyzer sends its belief to be saved in the connected Storage agents and proceed to the next round. Fig. 5 reveals the tasks the Analyzer is going through and the online interaction with the other agents.
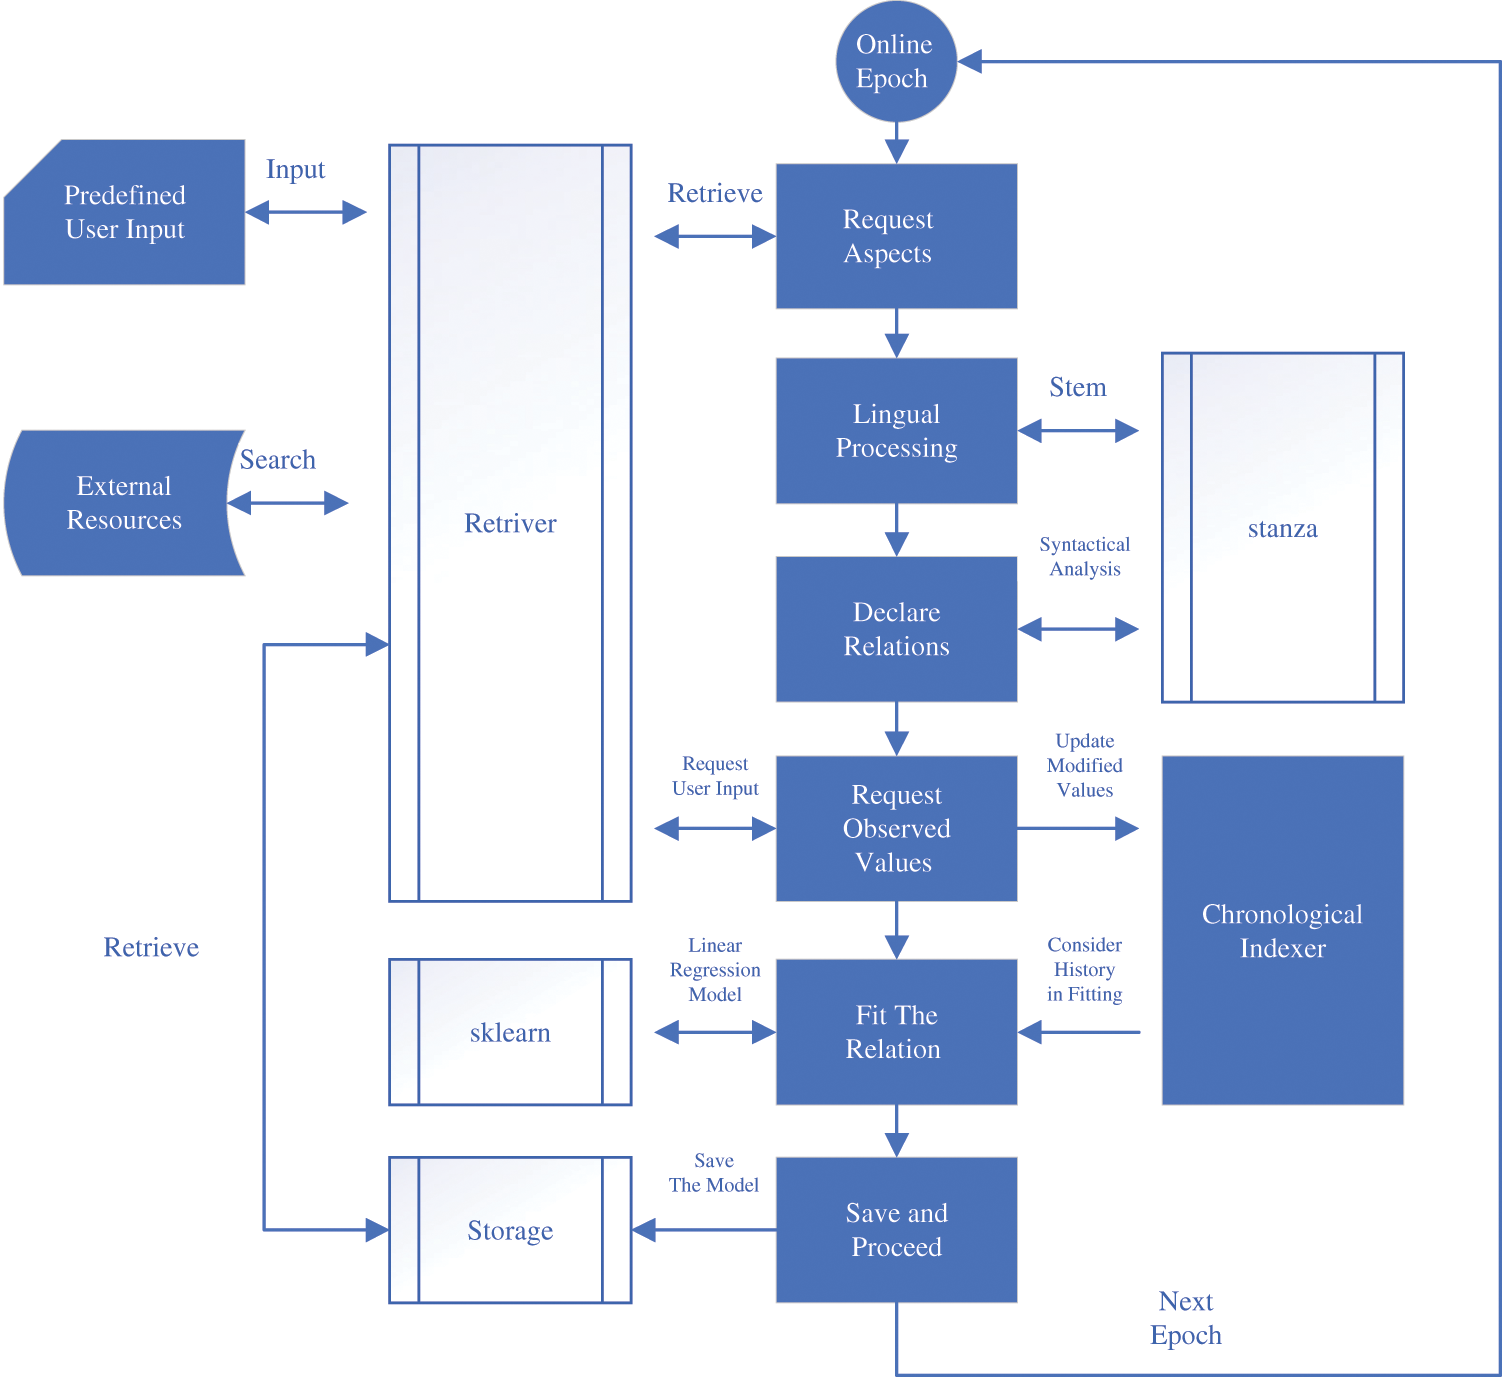
Figure 5: Online analyzer tasks and processes
The lingual processing required for the analysis involves stemming and syntactical analysis to define the subject phrase, the verb, and the object phrase. We have used CoreNLP [25] and Stanza Package [26] For the linear regression fitting [27,28], the Analyzer uses the model provided by the sklearn library.
In our case study, we need to achieve a link that relationally connects the profit with the marketing media types (social media advertising and TV advertising). To simplify the process, we have collected some paragraphs which naturally should provide a good understanding of the relations. Searching through these paragraphs, the Analyzer could determine that the profit is related to the revenue and the cost. We have predefined these relations as the following:
Then, the Analyzer requested profit, revenue, and cost values. As all the values and weights were provided and matched their model, there was no need to fit. After that, the Analyzer sent the model and the chronological indexer to the Storage agent and proceeded to the next epoch.
In the next epoch, the Analyzer retrieved information about the aspects of revenue, cost, social media advertising, and TV advertising. It could find an undefined relationship connects the revenue and the cost with the two advertising media. The Analyzer created relations with default weights and proceed to request value input for the media aspects. The Analyzer distributed the costs and the revenue between the two media equally and fitted the relations accordingly. In the coming epochs, the values of the revenue, cost, social media advertising, and TV advertising were updated, and the fitting was getting more accurate.
In the end, we have asked the Analyzer to predict in the future using the chronological indexer parameter, and it could predict that the efficiency of TV advertising decreases after seven rounds. In contrast, Figs. 6 and 7 shows social media advertising had a fewer impact early but could maintain its positive impact.
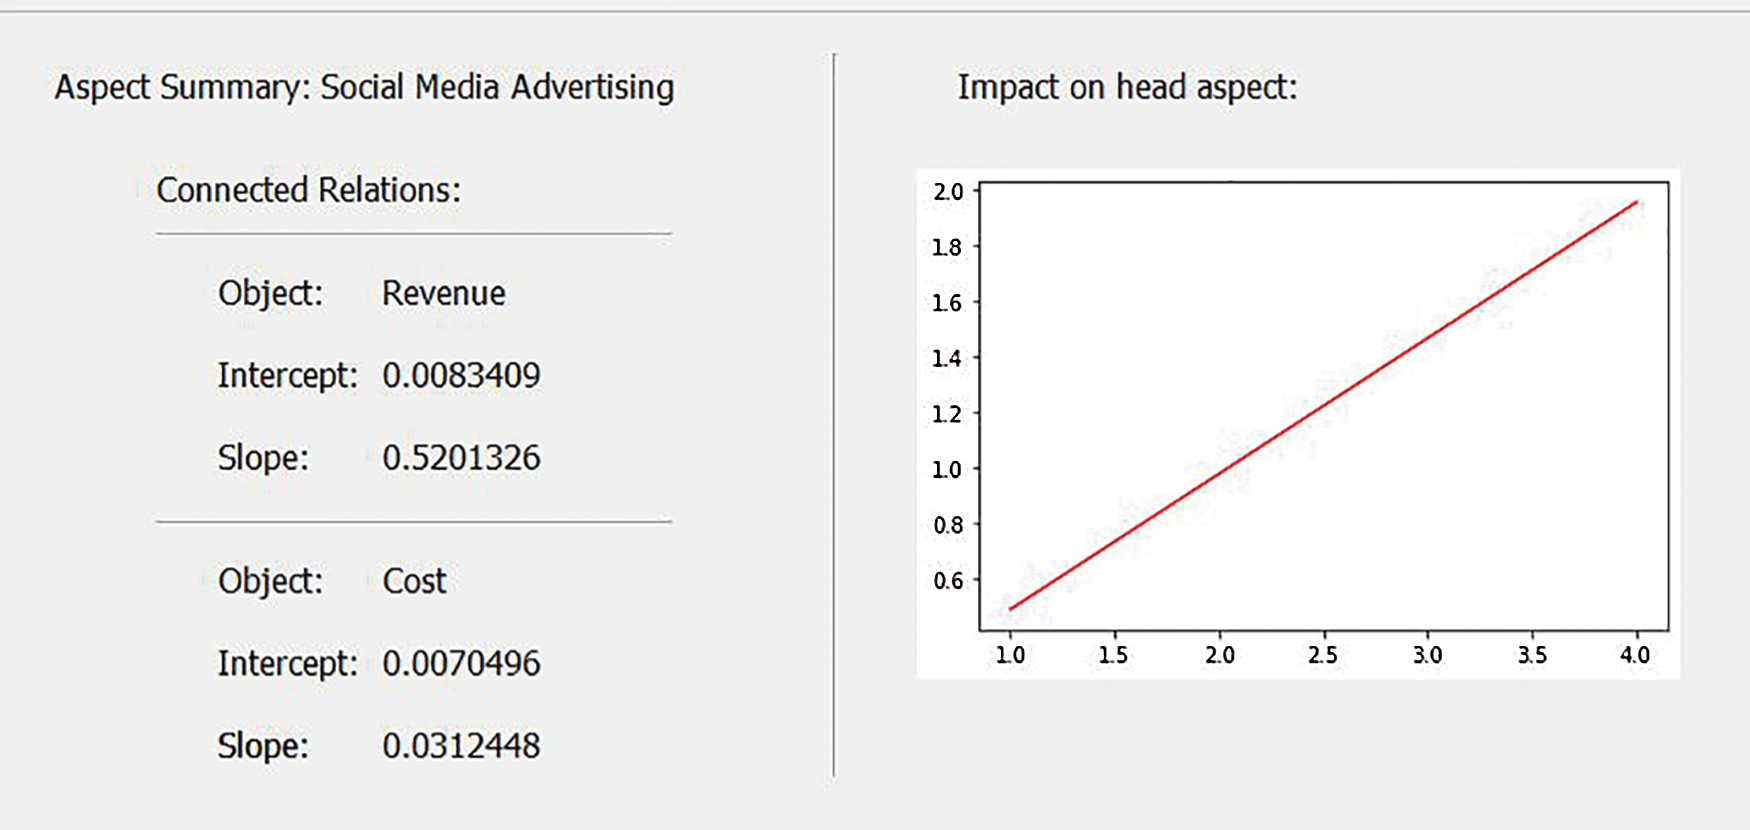
Figure 6: Summary of social media advertising aspect
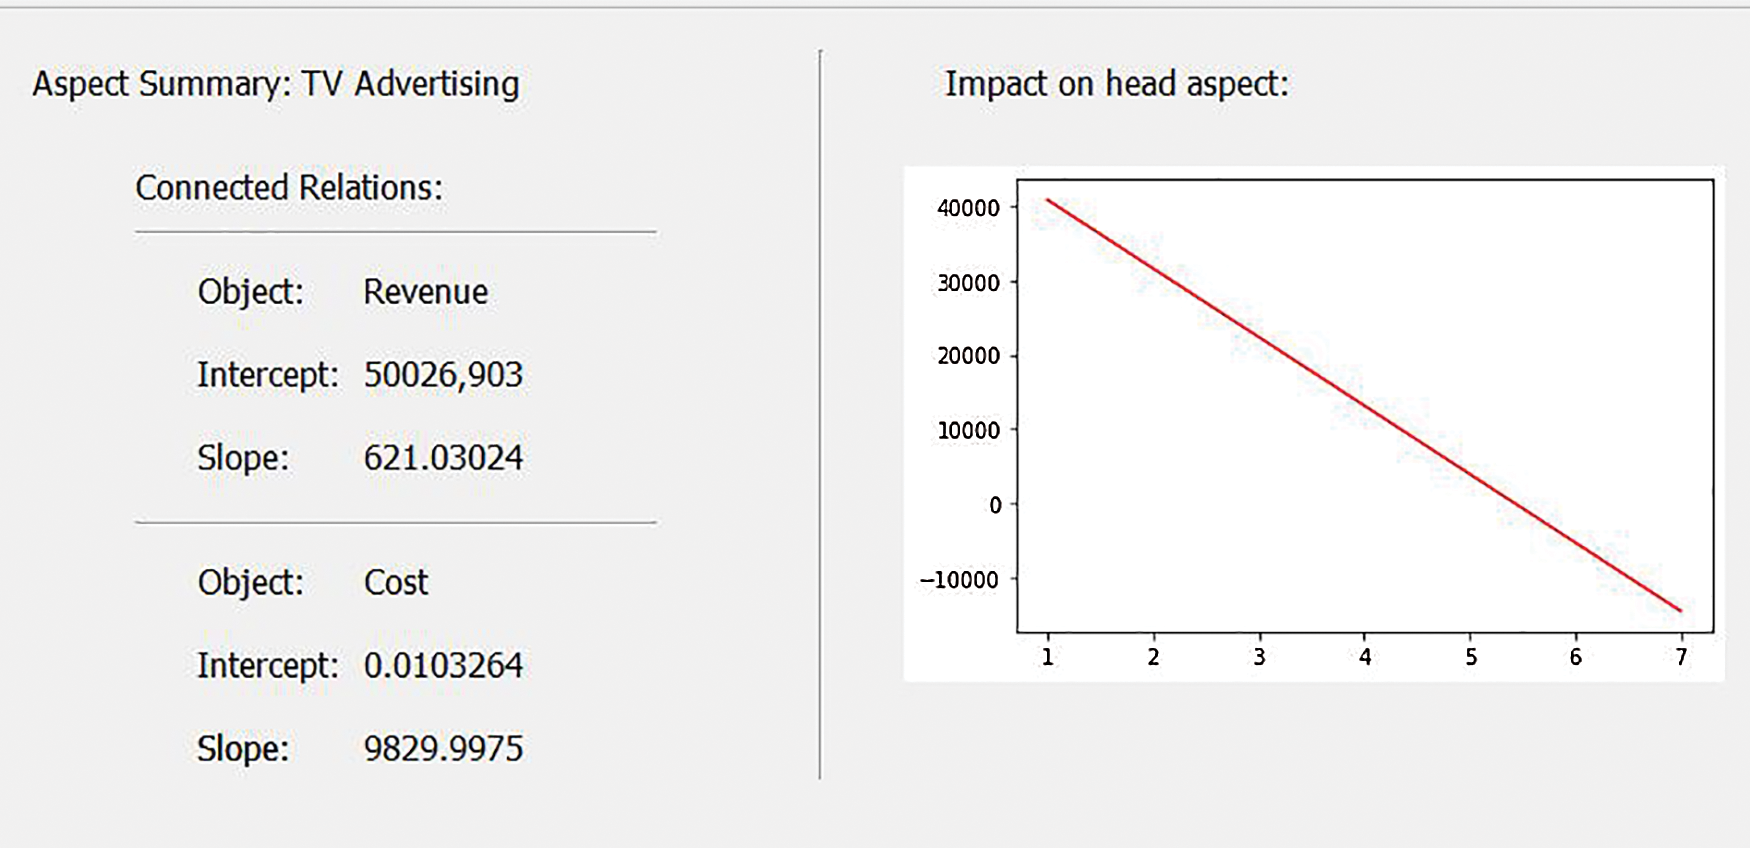
Figure 7: Summary of TV advertising aspect
According to the result of the case study, the business analyzer implemented by the Analyzer agent is both sufficient and efficient. It assists the unified and universal BI model to reshape the manufacturing concept and greatly improve it. The Analyzer agent is promising in the fields of BI, innovative manufacturing management, and Data Mining. We have come through the Analyzer model and simple implementation that sufficiently satisfy the Analyzer functionality. While it is still in its early stages, the results were reasonable and encouraging. This opens the road for future better implementations with performance optimization and wider scopes.
Moreover, this implementation encourages implementing other agents of the universal BI model. The available data science and AI techniques are enough to implement the functional tasks of that model. However, more modeling is required to unify the structure and APIs. By the end, we will achieve a universal service-oriented cooperative BI platform that can serve and empower all the BI applications.
Funding Statement: The authors received no specific funding for this study.
Conflicts of Interest: The authors declare that they have no conflicts of interest to report regarding the present study.
1. R. Akerkar, Artificial Intelligence for Business. Springer, 2019. [Online]. Available at: https://link.springer.com/book/10.1007%2F978-3-319-97436-1. [Google Scholar]
2. I. A. Ajah and H. F. Nweke, “Big data and business analytics: Trends, platforms, success factors and applications,” Big Data and Cognitive Computing, vol. 3, no. 2, pp. 32, 2019. [Google Scholar]
3. M. S. Baierle, M. A. Sellitto, R. Frozza, J. L. Schaefer and A. F. Habekost, “An artificial intelligence and knowledge-based system to support the decision-making process in sales,” South African Journal of Industrial Engineering, vol. 30, no. 2, pp. 17–25, 2019. [Google Scholar]
4. Z. Zheng, P. Fader and B. Padmanabhan, “From business intelligence to competitive intelligence: Inferring competitive measures using augmented site-centric data,” Information Systems Research, vol. 3, no. 3.1, pp. 698–720, 2012. [Google Scholar]
5. J. H. Bisack, “Business intelligence: Finding nuggets in the noise,” The Journal of Private Equity, vol. 20, no. 3, pp. 9–11, 2017. [Google Scholar]
6. B. Zohuri and M. Moghaddam, “From business intelligence to artificial intelligence,” Modern Approaches on Material Science, vol. 3, pp. 231–240, 2020. [Google Scholar]
7. V. Mazilescu and A. Micu, “Technologies that through synergic development can support the intelligent automation of business processes,” Annals of “Dunarea de Jos” University of Galati Fascicle I. Economics and Applied Informatics, vol. 25, no. 2, pp. 91–100, 2019. [Google Scholar]
8. M. A. Abusweilem and S. Abualoush, “The impact of knowledge management process and business intelligence on organizational performance,” Management Science Letters, vol. 9, no. 2, pp. 2143–2156, 2019. [Google Scholar]
9. S. M. Brito, J. J. M. Briegas and A. I. S. Iglesias, “Creativity for business intelligence,” International Journal of Developmental and Educational Psychology, vol. 1, no. 1, pp. 155–164, 2019. [Google Scholar]
10. K. German, M. Limm, M. Wölfel and S. Helmerdig, “Towards artificial intelligence serving as an inspiring co-creation partner,” EAI Endorsed Transactions on Creative Technologies, vol. 6, no. 19, pp. 4–8, 2019. [Google Scholar]
11. H. Chen, R. H. L. Chiang and V. C. Storey, “Business intelligence and analytics: From big data to big impact,” MIS Quarterly, vol. 36, no. 4, pp. 1165–1188, 2012. [Google Scholar]
12. R. A. Eryadi and A. N. Hidayanto, “Critical success factors for business intelligence implementation in an enterprise resource planning system environment using dematel: A case study at a cement manufacture company in Indonesia,” Journal of Information Technology Management, vol. 12, no. 1, pp. 67–85, 2020. [Google Scholar]
13. J. Lee, T. Suh, D. Roy and M. Baucus, “Emerging technology and business model innovation: The case of artificial intelligence,” Journal of Open Innovation, vol. 5, no. 3, pp. 44–57, 2019. [Google Scholar]
14. N. S. Farooqi and M. O. Khozium, “A model for unified agile business intelligence,” Solid State Technology, vol. 63, no. 6, pp. 19660–19674, 2020. [Google Scholar]
15. D. Bentley, Business Intelligence and Analytics. New York: Library Press, 2017. [Online]. Available at: Business Analytics: Camm, Jeffrey D., Cochran, James J., Fry, Michael J., Ohlmann, Jeffrey W., Anderson, David R.: 9781337406420: https://www.amazon.com: Books. [Google Scholar]
16. A. Shokry and Z. Ghazizadeh, “Survey of business intelligence systems as a knowledge management tool for improving business in investment holding by using systems dynamic approach,” Scientific Journal of Strategic Management of Organizational Knowledge, vol. 2, pp. 41–78, 2019. [Google Scholar]
17. V. Chang, R. Valverde, M. Ramachandran and C.-S. Li, “Toward business integrity modeling and analysis framework for risk measurement and analysis,” Applied Science, vol. 10, no. 9, pp. 31–45, 2020. [Google Scholar]
18. W. Hamscher, “The business analyzer: A second generation approach to financial decision support,” in Second Generation Expert Systems. Berlin: Springer-Verlag, pp. 93–109, 1993. [Google Scholar]
19. H. S. Dod and R. Sharma, “Competing with business analytics: Research in progress,” in Information systems foundations: Theory Building in Information Systems, 1st ed., vol. 1, pp. 239–250, 2012. [Google Scholar]
20. G. H. N. Laursen and J. Thorlund, Business Analytics for Managers. USA: Wiley, 2017. [Google Scholar]
21. B. Brijs, Business Analysis for Business Intelligence. United States: CRC Press, 2013. [Google Scholar]
22. J. Kriz, M. Dohnal and K. Fojtu, “Models of strategic management scanning based on trend heuristics as the least information intensive quantifiers,” Revista de Métodos Cuantitativos para la Economía y la Empresa, vol. 29, pp. 116–130, 2018. [Google Scholar]
23. B. De Ville, Decision Tree for Business Intelligence and Data Mining. United States: SAS Institute Inc., 2006. [Google Scholar]
24. G. Shmueli, P. C. Bruce and N. R. Patel, Data Mining for Business Analytics. USA: Wiley, 2016. [Google Scholar]
25. Stanford, “Stanza: A python nlp package for many human languages,” 2020. [Online]. Available: https://stanfordnlp.github.io/stanza/. [Google Scholar]
26. Stanford, “Stanford corenlp: Natural language software,” 2020. [Online]. Available: https://stanfordnlp.github.io/CoreNLP/index.html. [Google Scholar]
27. S. Hameed, Q. A. Minhas, S. Ahmed, S. Habib, M. K. Hasan et al., “An improved iBAT-COOP protocol for cooperative diversity in fanets,” Computers Materials & Continua, vol. 67, no. 2, pp. 2527–2546, 2021. [Google Scholar]
28. S. N. Abdullah, S. M. Ismail, M. K. Hasan and P. Shivakumara, “Novel adaptive binarization method for degraded document images,” Computers Materials & Continua, vol. 67, no. 3, pp. 3815–3832, 2021. [Google Scholar]
 | This work is licensed under a Creative Commons Attribution 4.0 International License, which permits unrestricted use, distribution, and reproduction in any medium, provided the original work is properly cited. |