DOI:10.32604/iasc.2021.016242
| Intelligent Automation & Soft Computing DOI:10.32604/iasc.2021.016242 | |
| Article |
Early Detection of Lung Carcinoma Using Machine Learning
1Department of CSE, St.Joseph College of Engineering, Chennai, 600119, Tamilnadu, India
2Department of Electronics and Communication Engineering, University College of Engineering, BIT Campus, Anna University, Tiruchirappalli, 620024, Tamilnadu, India
3School of Computing, SASTRA Deemed University, Thanjavur, 613401, Tamilnadu, India
4Department of Electronics and Instrumentation Engineering, Kongu Engineering College, Erode, 638060, Tamilnadu, India
5School of Computing, SASTRA Deemed University, Thanjavur, 613401, Tamilnadu, India
*Corresponding Author: K. R. Sekar. Email: krsekarsastra@gmail.com
Received: 28 December 2020; Accepted: 07 May 2021
Abstract: Lung cancer is a poorly understood disease. Smokers may develop lung cancer due to the inhalation of carcinogenic substances while smoking, but non-smokers may develop this disease as well. Lung cancer can spread to other parts of the body and this process is called metastasis. Because the lung cancer is difficult to identify in the initial stages. The objective of this work is to reduce the mortality rate of the disease by identifying it at an earlier stage based on the existing symptoms. Artificial intelligence plays active roles in tasks such as entropy extraction through preprocessing strategies, ordinal to cardinal value conversions, table normalizations for easy meta computations, and preparation of machine learning tools for iterative processes to achieve rational convergence. The machine learning methodologies incorporated in this work are the cross-validation classification tree, random forest cross-validation classification, and random tree, all of which are included in an ensemble algorithm. The ensemble algorithm classifies lung cancer with maximum precision rates. The outcome of the classification provides 94.3% accuracy, which is the highest precision rate in comparison with the conventional methodologies. Semantics preprocessing of a lung cancer training set is performed with least entropy, and then translation, aggregation, and navigation based methodologies are applied for identifying the disease at its initial stage.
Keywords: Carcinogenic; cross-validation; classification tree; random forest; cross-validation; classification; random tree; translation; aggregation
Lung cancer is one of the most common types of cancer today. It is a malignant tumour capable of growing at rapid rates in an uncontrolled manner. The malignancy of the tumour can be determined with the help of the ground-glass capacity strategy as well as image cropping and feature extraction using gray-level co-occurrence matrices (GLCM). Classification procedures have been accomplished with the help of the naive Bayes classifier. The outcome obtained by using these approaches in a previous study was an increase of 8.34% in the accuracy rate, 11.76% in the sensitivity rate, and 5.26% in the specificity [1]. Lung cancer does not show up in tests until later stages, after which treatments become ineffective or have lower rates of success. Some researchers focus on earlier detection of cancer in the human body, utilizing methods that include image processing algorithms and artificial neural networks. The goal is the detection of cancer in its early stages and eliminating human error in the manual detection process [2]. Therefore, performance analysis of the existing classification algorithms is needed. One study investigated the use of the naïve Bayes algorithm, Bayesian network, and J48 methods to achieve earlier lung cancer detection, among which the naive Bayes algorithm exhibited the best performance [3].
In a study by Wu et al., classifiers were employed to identify lung cancer in its earlier stages. The association between the radiomic features and tumour histologic sub-types of lung cancer patients was revealed. Random forest, naive Bayes, and K-nearest neighbours (KNN) classification methods were used. The naive Bayes classifier outperformed the other classifiers and thus achieved the highest area under the curve (AUC) [4]. The main goal of the National Lung Screening Trial (NLST) carried out by two ways: one is X-ray of the chest in its most basic form. The second is Helical CT scans, which scans the entire chest with X-rays to collect several images. A dynamic Bayesian network (DBN) was used in this work, and it was found to offer higher discrimination and prediction ranges in detecting cancerous and benign cases [5]. The ultimate objective of a study by Gong et al. was to develop a dynamic and self-adaptive CAD scheme for detecting pulmonary nodules with respect to the template matching pattern. Fisher linear discriminant analysis (FLDA) and naive Bayes classifiers were used to achieve the objective. The FLDA classifier was better at classifying pulmonary nodules than other classifiers such as naïve Bayes [6].
Every year, around 1,600,000 deaths due to lung cancer are recorded, which is higher than the number of deaths caused by other types of cancer(including breast and prostate cancer). Tobacco use has been the reason for the death of approximately 7 million people every year globally, and more than 89,000 deaths have been recorded due to exposure to second-hand smoke. Cigarette smoking is the main cause of lung cancer, contributing to 80% of lung cancer cases worldwide. According to the American Cancer Society, there will be around 235,760 new cases of lung cancer in the United States in 2021 (119,100 in men and 116,660 in women). Lung cancer claimed the lives of 131,880 people (69,410 in men and 62,470 in women).
In order to analyze the prediction of survival rates from the Electronic Health Records and to provide treatment from there on, we use methods such as naïve Bayes, support vector machine (SVM), and classification trees(C4.5) in this study; the latter method is selected because classification trees have been found to produce enhanced lung cancer prediction results [7]. The major objective of this study is to determine the status of lung cancer and evaluate the methods to detect lung cancer in an early stage. Statistical analysis of incidence, mortality, and survival rates are the methods used in this work. This provides an understanding of incidence, mortality, and survival rates in India, Egypt, US, and UK. The evolutionary algorithm combined with the data mining technique can effectively detect lung cancers [8].The northeast regions in India record the highest cancer rates, among which stomach and lung cancer contribute to a major percentage. Every year around 71% of deaths are due to cancer, among which 50% are due to lung cancers in men. Hence, detecting and treating lung cancer in its early stage could decrease the mortality rate to a great extent.
This study proposes that the specimen of bronchial biopsy could be used as a substitute for the analysis of DNA methylation in patients with untreatable lung cancer [9]. The diagnosis of lung cancer is confirmed by performing a needle biopsy of the lungs and using various methods to detect lung cancer and its severity. These methods include computed tomography(CT), new adaptive median filter, region of interest(ROI), SVM, and GLCM. A framework discovery approach involving all of these techniques could detect lung tumours using MATLAB programming [10]. The following sections discuss works, architectural diagram, proposed methodology, illustration work, research and discussion, and conclusion.
The main goal of a study by Kureshi et al. was to represent the relationships between the patient’s symptoms and tumour responses in lateral stages of NSCLC. Support vector machine, a supervised learning model, and a rule-based classier were used. These methods were observed to be promising approaches in supporting the selection of patients for the targeted treatments of advanced NSCLC [11]. The diagnosis of cancer using the gene dataset values was the main objective of a study by Krishnaraj et al. Data mining, the classification rule, and the naive Bayes algorithm were used. Mining a huge amount of data using data mining provided accurate results [12]. Earlier warning of lung cancer and performance analysis of the classification algorithms was investigated by Christopher et al. Naive Bayes, Bayesian network, and J48 were used, among which the naive Bayes algorithm offered the best performance [13]. Choudhury et al. aimed to detect the presence of lung cancer tumours or oral cancer tumours. The methods involved included rule based classification, data mining, deep learning, and simple linguistic algorithms. The outcome of this research work was to identify an intelligent and efficient lung or oral cancer detecting technique [14].
Dass et al. analyzed the gene mutations and gene expression data for the phenotypic classification of lung cancer. The methods involved included the integrated classification hierarchal induction algorithm, cross-validation technique, and J48 Weka tool. The outcomes indicated that the improved decision tree worked best, resulting in higher accuracy, which could lower the pain of examination of the patients [15]. Another study worked to precisely classify the medical training set appropriately gathered from the UCI repositories of University of California, Irvine. An improved dominance-based rough set was used for accomplishing the classification tasks. The outcome of the research proved that the rough set approach provided highly accurate results in comparison with that of the other classifiers used for classification [16]. Singh et al. calculated the behavior of two dimensionality reduction methods applied to seven separate machine learning methods precisely formulated over the plant eczema data set. The feature dimension reduction pattern appeared to be an important part of data pre-processing for choosing the factors responsible for the life expectancy in patients affected by lung cancer post-surgery. Seven machine learning methods, namely, Bayes, line regression SVM machine learning process, RBF network, K-means neighbor network, and classification and regression trees (CART)employed for examining the performance of the feature selection methods. A precision of 85.43% was recorded with the correlation-based dimension reduction, whereas the consistency-based dimension reduction resulted in 84.99% accuracy [17].
In a study by Naftchali, and, the goal was to produce a computational intelligent predictive model to predict the chemotherapy effectiveness/futility in patients in order to prevent unnecessary treatment. The method was applied in two steps. The first step was a purposeful cleansing technique involving chi-square distribution, SVM recursive feature elimination SVM-RFE, and a correlation 2D matrix, all of which were employed in the NSCLC gene expression dataset as a novel dimensionality reduction method to tackle the curse of the number of attributes and to identify the chemotherapy target genes from tens of thousands of features. A basic mathematical approach to the issue of pattern classification is the Bayesian decision theory. This method is focused on calculating the tradeoffs between different classification decisions and the costs associated with them using probability. The results of this study suggested that the deep learning feature selection approach improved the precision of classifying patients eligible for being treated with chemotherapy by minimizing the dimensionality. The results also indicated the approach would be powerful when used in medical datasets containing a small training set coupled with numerous features [18]. A study by Makond et al. employed a probabilistic model using a Bayesian network to predict the short survival rate of patients with brain blockage caused by lung cancer. The methodology included using SMOTE to resolve the imbalance property that forms a part of the problem. The Bayesian network was pitted against three other challenging models, namely the extension of conditional probability, logistic regression, and SVM. Results indicated that the SMOTE enhanced the behavior of the four said models in terms of sensitivity, thus maintaining high accuracy and specificity at the same time. Further, the proposed Bayesian network appeared to be more efficient in comparison with naive Bayes and linear regression, and SVM [19]. Hosseinzadeh, F et al. aimed to develop a diagnostic system based on the sequence-derived structural and physicochemical attributes of proteins that forma part of two types of tumorlike benign (non-cancerous) and malignant (cancerous). The methods used were feature extraction, feature selection, prediction models, and machine learning models, including seven SVM models, three ANN models, and two naive Bayes models, all of which were deployed on an original database and newly generated ones from the attribute weighting models. The results suggested that the algorithms’ performance in lung cancer tumour type prediction improved when they were applied to datasets generated by the attribute weighting models instead of the original dataset. Also, wrapper-validation provided better results than cross-validation, and the best cancer type prediction was produced by SVM and SVM linear models (82%) [20].
The aim of the study by Dong et al. was to develop a small-cell lung cancer (SCLC genetic database through comprehensive ResNet relationship data analysis, where 557 SCLC target genes were curated. Multiple levels of associations between these genes and SCLC were analyzed. The methods included sparse representation-based variable selection (SRVS) for gene selection of four SCLC gene expression datasets followed by a case-control classification procedure. The results suggested that for a given SCLC patient group, a gene vector may be present among the 557 recorded or collected SCLC genes that possesses notable prediction power. Thus, SRVS is prolific in identifying the optimal gene subset targeting customized treatment [21].
The previous related works illustrate that lung cancer detection has been accomplished with the help of various classification methods and genetic algorithms. The classification mechanisms, such as the naïve Bayes, ANN, DBN, KNN, Fisher linear discriminant analysis, self-adaptive machine learning, SVM, computed tomography, and K-means neighbor network, were used, and feature selection using deep learning methodologies, were applied in the previous strategies. In our proposed work, three different methodologies—cross-validation classification tree using R part function in R, random forest cross-validation classification, and random tree—are implemented to determine the accuracy levels of the above mentioned methodologies.
Fig. 1 shos the architectural diagram of the proposed system. The training set is the initial step for understanding the data and their parameters. The dataset represents historical events and may appear incorrect. Hence, the dataset is trained using some mathematical and statistical methodologies to eradicate the entropy in the dataset. Entropy is the disorder in the dataset, and it can be corrected using machine learning techniques with acceptable validations and verifications.
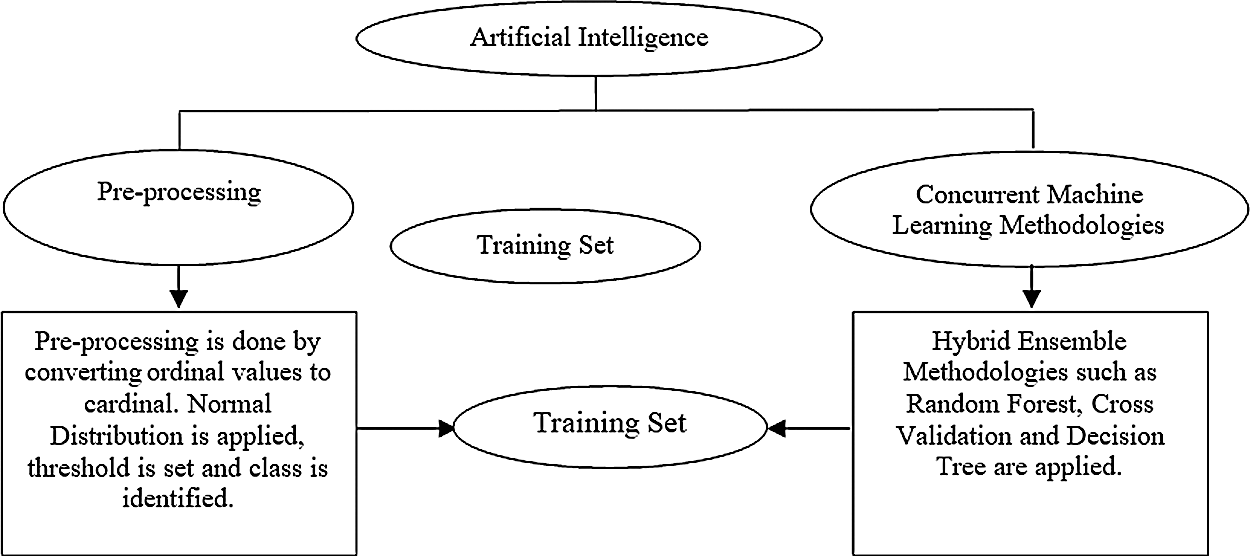
Figure 1: Architectural diagram
Dataset pre-processing can essentially eliminate the outliers and inconsistencies in real-time data. Statistical modelling helps in resolving the problem of missing data in real-time systems. Entropy is created by the irrelevant and incomplete data in the dataset. Highly precise cells can be formed by converting the dataset to its rational format; this transformation further assists in the elimination of the newly created entropies. Such converted datasets can now be used for analysing real-time systems in applications such as hospital information systems, enterprise resource planning, customer relationship management, and finance management in the banking sector.
3.3 Hybrid Ensemble Methodologies
The ensemble and hybrid ensemble models have been observed to offer greater accuracy levels for the concerned applications like Healthcare of lung carcinoma due to their associated cascading classification methodologies. A single classifier prediction model would not be accepted in industry today. Rather, there is great demand for numerous methodologies for choosing between existing alternatives. The mathematical modelling hybrid ensemble model is composed of concurrent classifiers that can be applied on a single dataset for obtaining highly accurate outcomes. At times, the dataset can be trained according to its associated models and can be incorporated into ensemble models or the classifiers; else some special type of classifier like SVM can be applied for enhancing the accuracy of the outcomes. Hybrid ensemble models can be created by applying artificial intelligence to the ensemble models. Intelligence can be achieved via the heuristic and the meta-heuristic methods. Currently, many applications rely on empirical methodologies for achieving intelligent hidden answers for their specific applications.
The sample training set for lung cancer prediction is shown in the Tab. 1 and is taken from the data. world repository and contains 4337 records. Using principal component analysis (PCA), feature extraction and dimensionality reduction is performed. Tab. 1 represents the ordinal and the cardinal values.
By applying the method of linear regression analysis, the real-time response data are denoted as m1, …, mn, and the ‘n’ dimensional vector covariates are denoted as l1, …, ln. The elements of vector li are denoted as li1, …, lip.
Using the principle of least squares method, we can construct a function m = γ + δTl to fit the data (li, mi) 1 ≤ i ≤ n. Using the mean squared error (MSE), we can find the appropriate fit. The estimated parameter values γ and δ of the MSE on the observed set (li, mi) 1 ≤ i ≤ n are defined as
Eq. (1) is absolutely derived from the mean value of the MSE for the observed set is (n − p − 1)/(n + p + 1) < 1 times the mean value of the MSE for the validation set. MSE computation on the observed set would result in a biased assessment of the model that would fit in to an independent dataset. This biased estimate is known as the in-sample estimate of the fit, but the cross-validation estimate is known as the out-of-sample estimate.
To check the cross-validation, the test error rate on the held out point on the observed model on every point except i, where i = 1, 2, … n, can be calculated using the following relations.
Mean test errors-I
represents the identifying sample ‘i’ without using the ith sample for every i = 1, . . . , n; this is for the observed model on all points except at a point ‘i’.
Mean test errors-II
For a single classification, p leaves one out of the cross-validation, and the calculation of
For linear regression, let us consider
where
Cross-validation standard errors-III
For K-fold cross-validation, it would be highly useful to assign a quantitative notion of variability to the cross-validation error estimate. It is defined as
This approximation is valid for small values of K (e.g., K = 5 or 10) and not for high values of K (e.g., K = n), as the quantities CV1(
4.2 Random Forest Cross-Validation Classification
Definition 1: A classifier consisting of a set of tree structured classifiers is known as the random forest.
There are identically independent distributed random vectors, and each tree casts a unit vote for the most popular class at an input. The equally weighted voting model is defined as
Given an ensemble of classifiers {h1(l), h2(l), …, hm(l)}, each of these can acquirea classification procedure. A classifier hk(l) represents a common way of h(l, μk). Using the training set drawn at random from the random vector distributions, the margin function is defined as
where I(.) is the indicator function. The margin measures the extent to which the average number of votes for the right class exceeds the average vote for any other class. The larger the margin, the greater the confidence in the classification.
Generalization error is defined by PE* = PL, M(mg(L, M) < 0),and its upper bound is determined by
The strength of the classifier set can be determined by the following relationship:
{h(l, μ} is , S = EL, M (Pμ(h(L,
The training dataset for lung carcinoma is taken for the illustration work. The trained data are depicted in Tab. 1. The 14 attributes are named in the form of acronym and the same is expanded in legend 1.
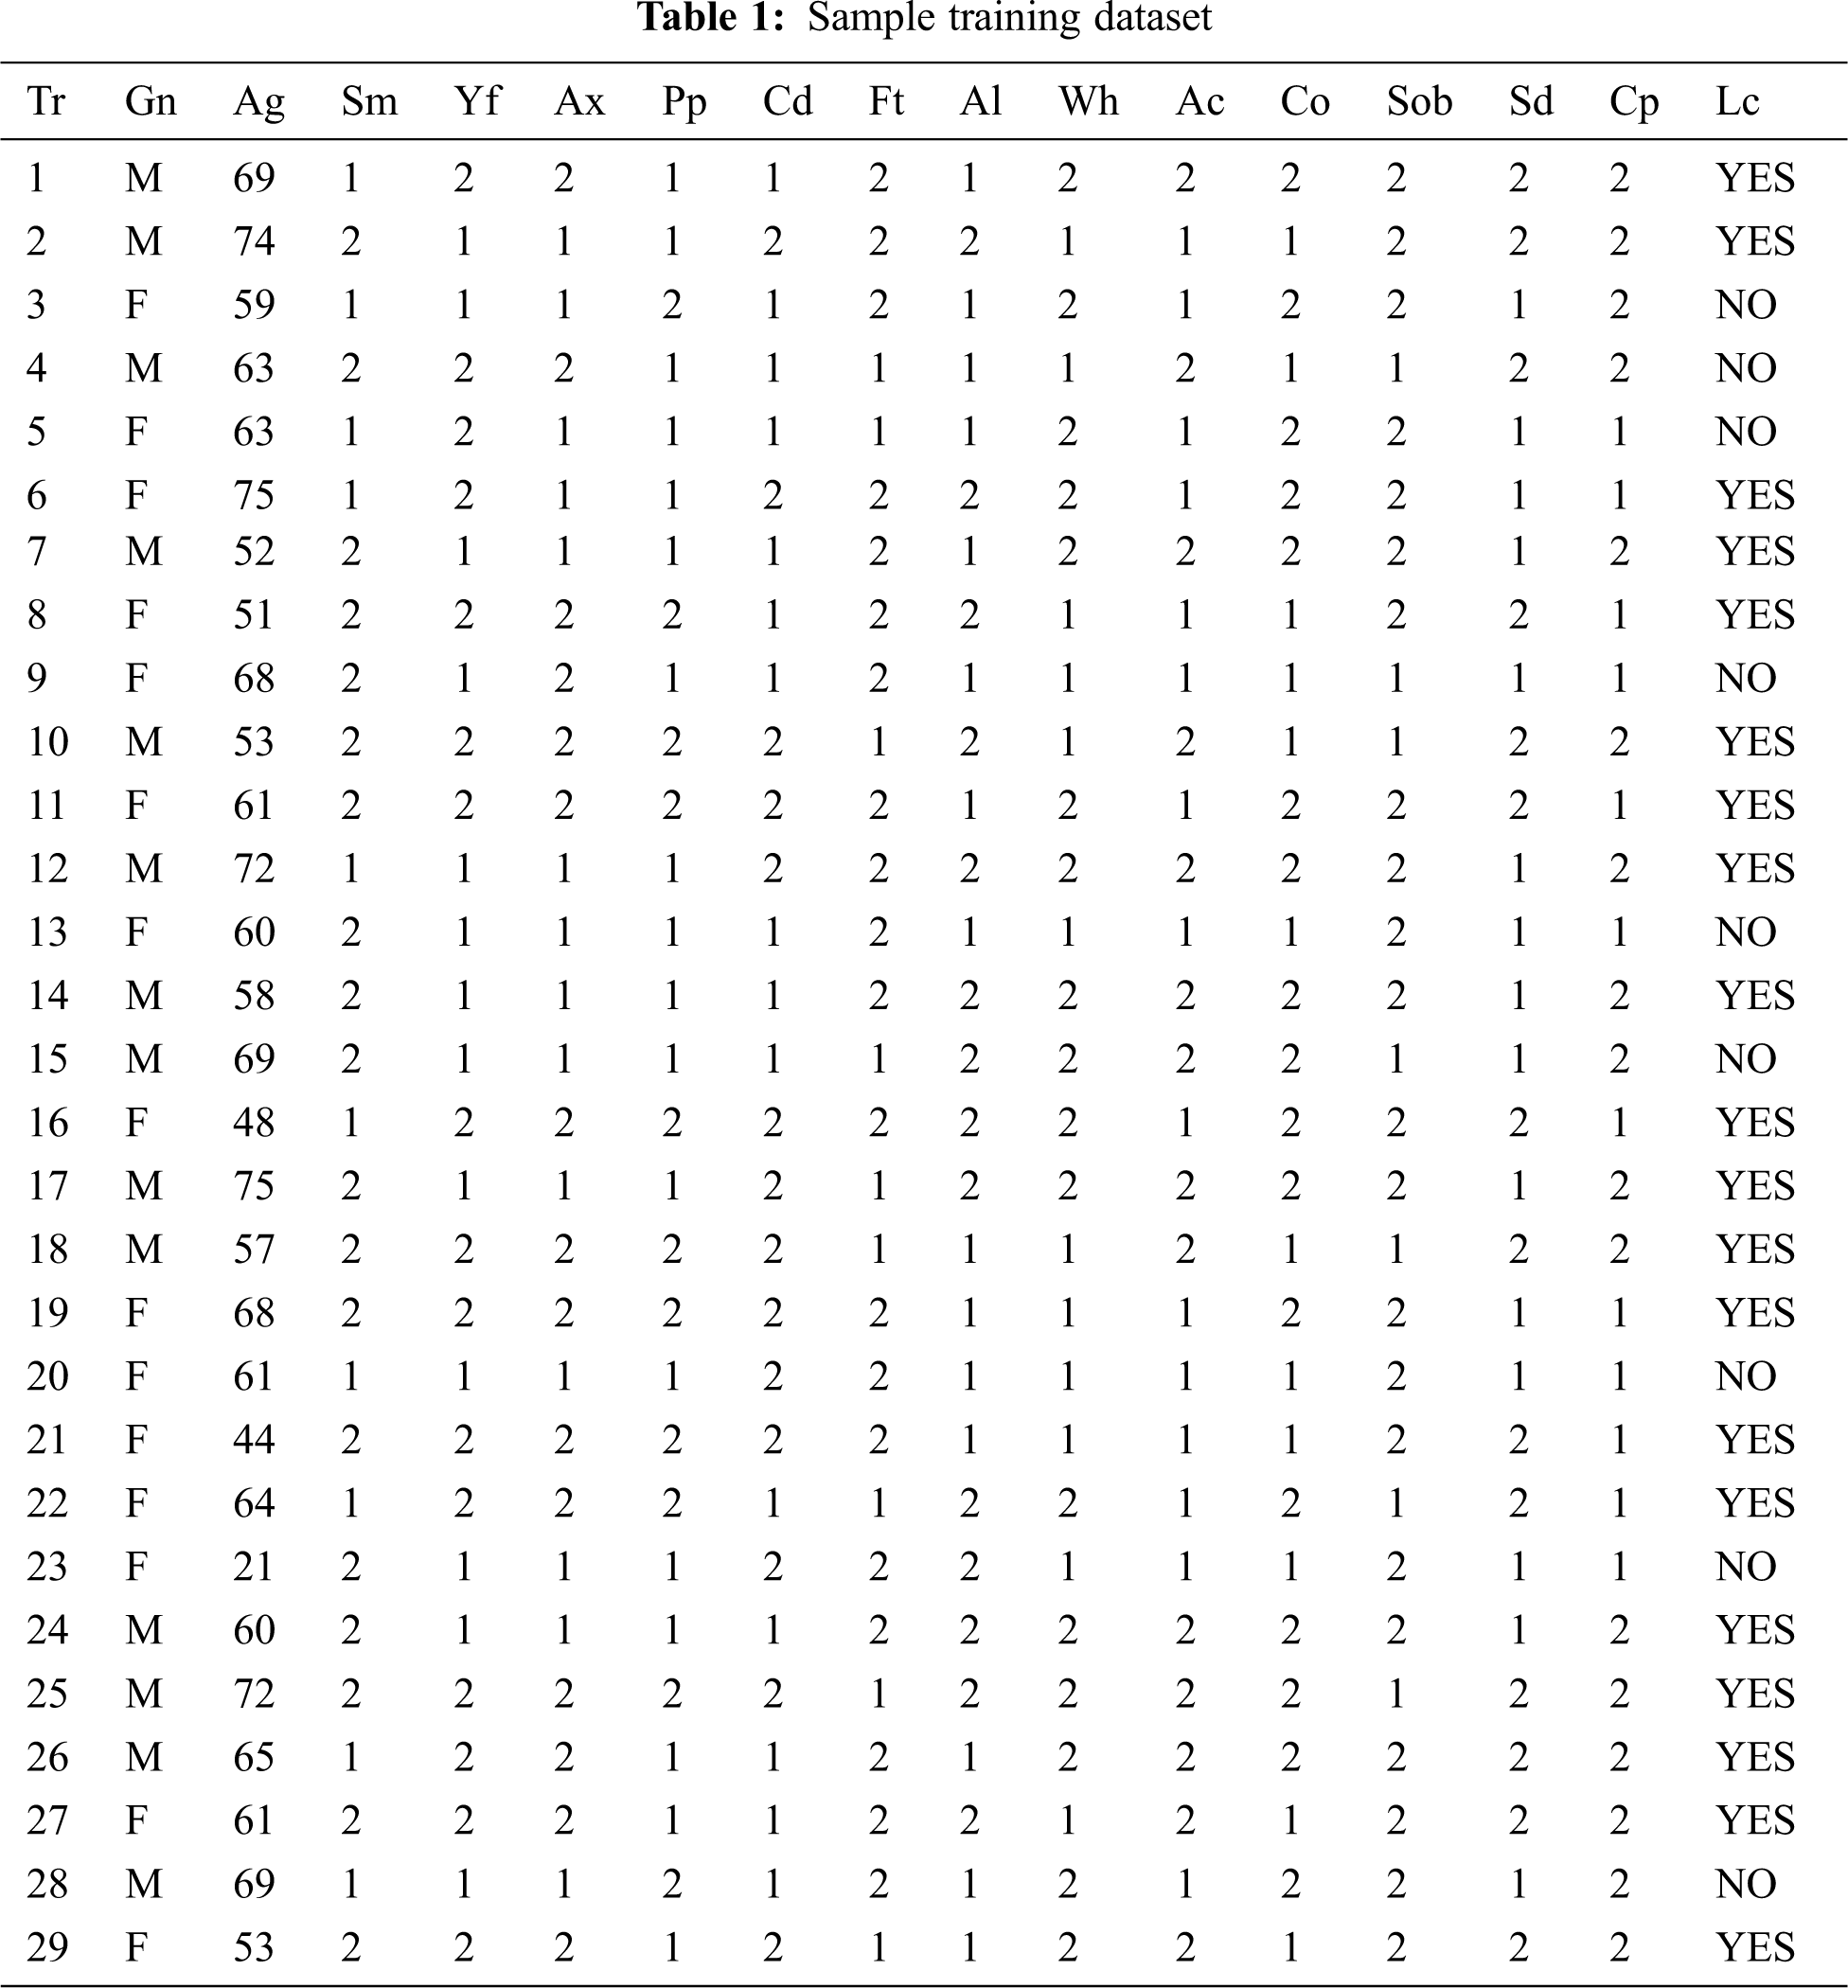
Legend 1: Tr-Transaction Table, Gn-Gender, Ag-Age, Sm-Smoking, Yf-Yellow_Fingers, Ax-Anxiety, Pp-Peer Pressure, Cd-Chronic Disease, Ft-Fatigue, Al-Allergy, Wh-Wheezing, Ac-Alcohol Consuming, Co-Coughing, Sob-Shortness Of Breath, Sd-Swallowing Difficulty, Cp-Chest Pain, Lc-Lung_Cancer. In Tab. 2, ordinal values are converted to cardinal values and the distribution is applied for the overall table to equalize the values.
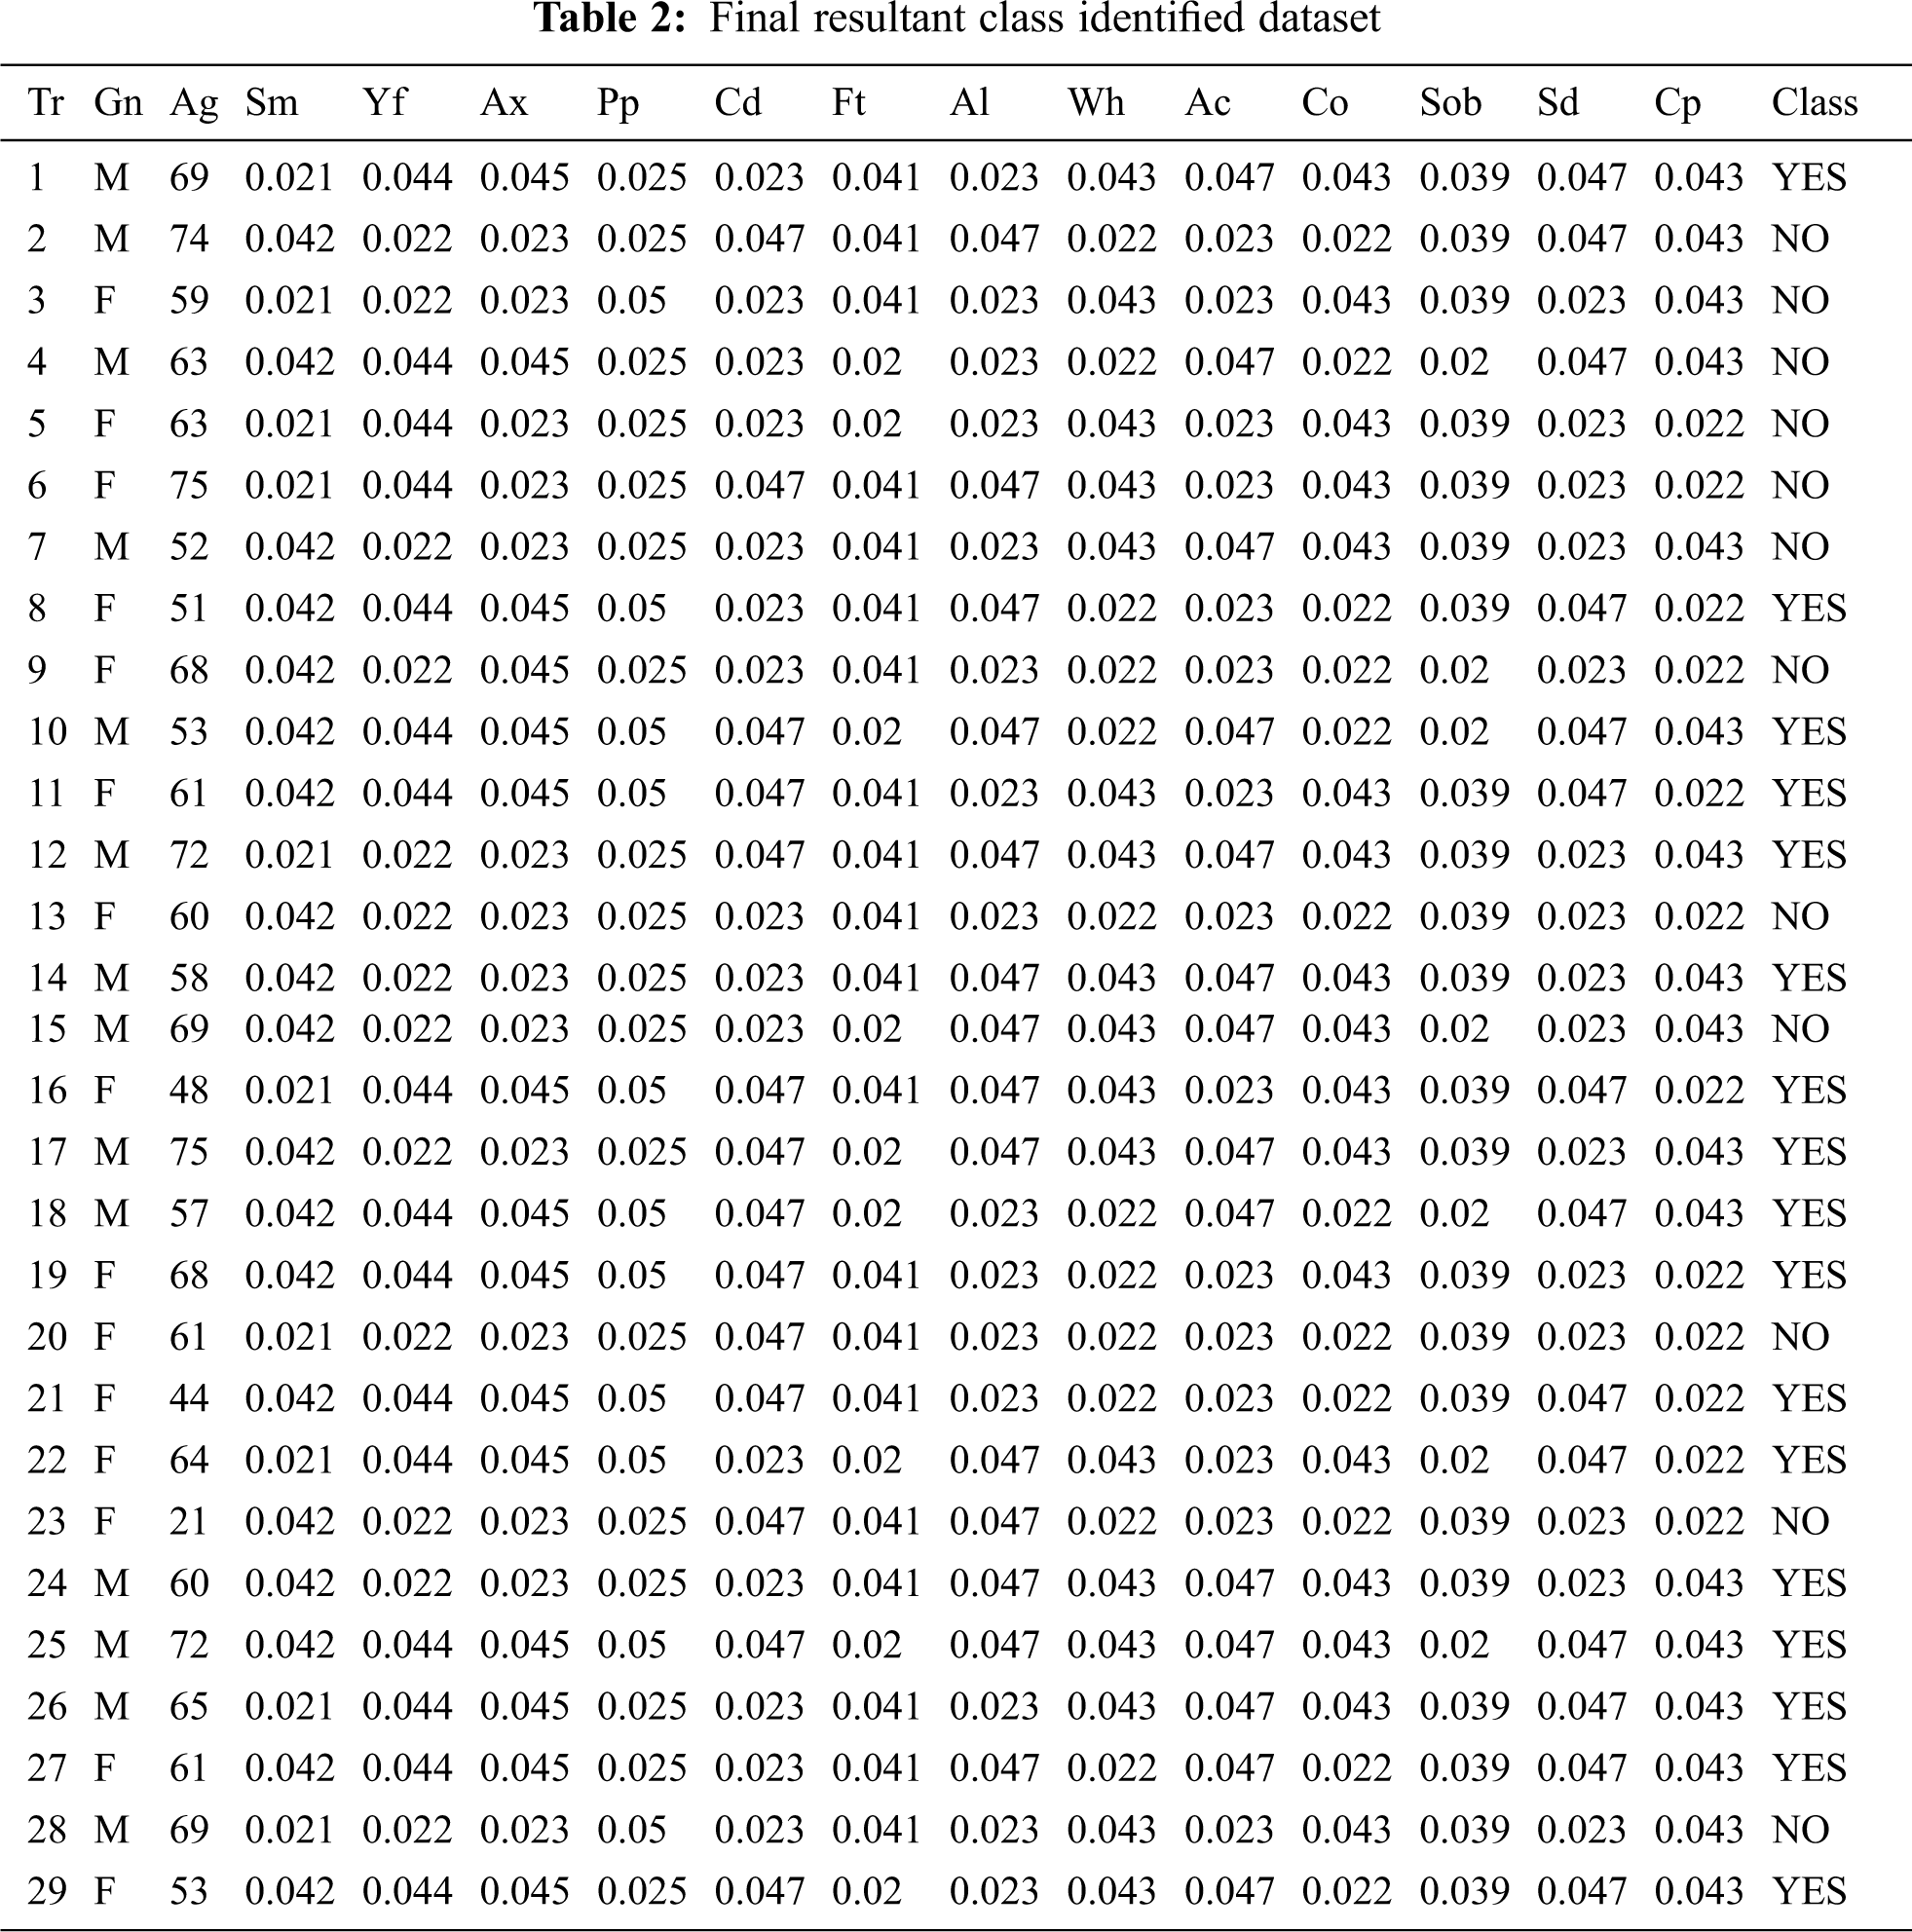
Tabs. 1 and 2 explains the training set consisting of 15 attributes and 29 columns and thus reveals the research work towards the early detection of lung carcinoma with the help of three different classifiers that weren’t used in the related works. Tab. 2 represents the final resultant pertaining to the class that has been found with the categories yes and no for the lung carcinoma early detection. The same result determined from Tab. 2 is then compared with the three methodologies, furnished under 6.1, 6.2 and 6.3 and the same is then verified with the mathematical modeling providing higher reliability and better performance rather than the ones furnished in the related papers.
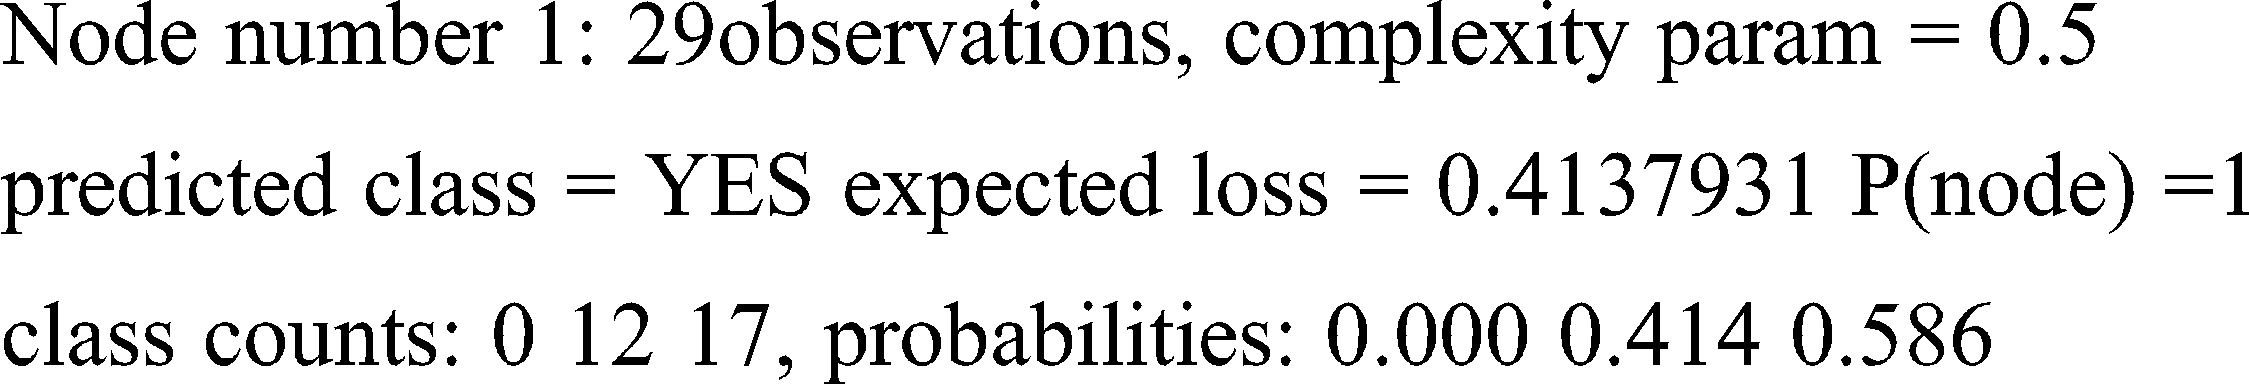
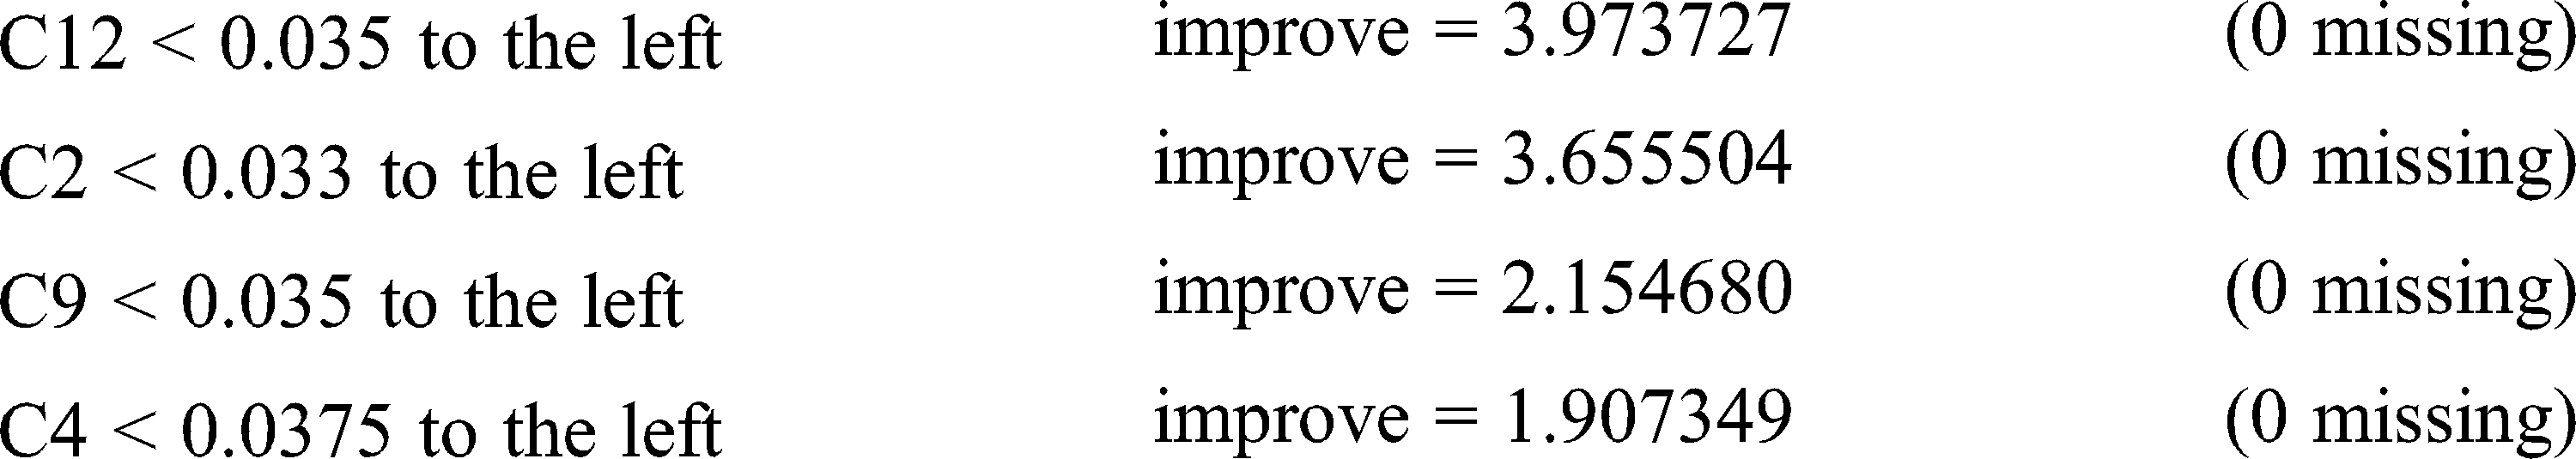
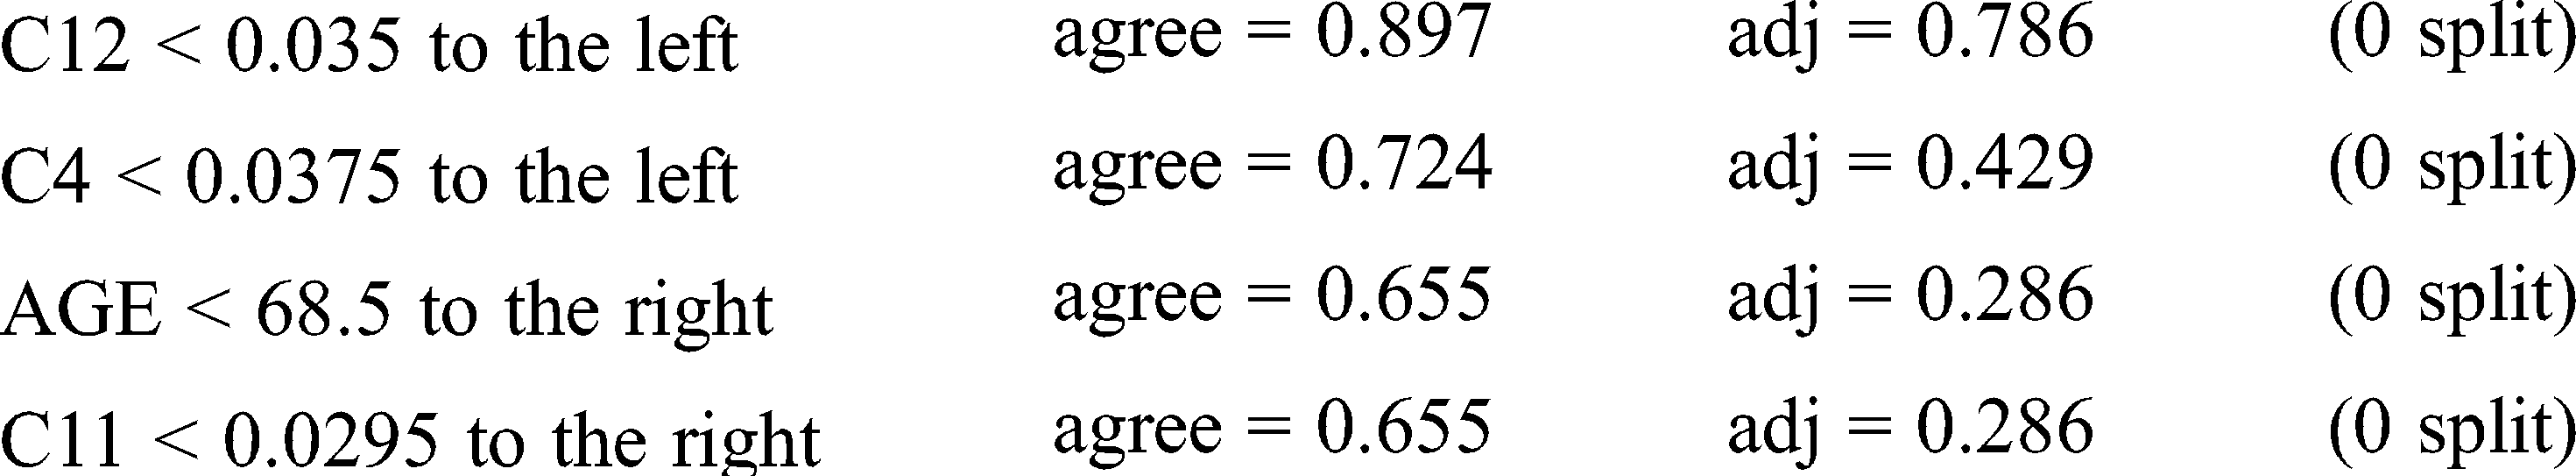
6.1 Methodology 1: Cross-Validation Classification Tree Using Rpart Function In R
The cross-validation model is the method of using a rotational model in statistics for the predictive analysis. Partitioning the training set and training the same dataset is performed via the sampling models. The mean averages will be taken into account for accurate prediction. The result’s performance will always be on the greater side because of the mean averages.
C1-Smoking, C2-Yellow Fingers, C3-Anxiety, C4-Peer Pressure, C5-Chronic Disease, C6-Fatigue, C7-Allergy, C8-Wheezing, C9-Alcohol Consuming, C10-Coughing, C11-Shortness Of Breath, C12-Swallowing Difficulty, C13-Chest Pain.
Legends: Attributes available in the sample training test
rpart(formula = CLASS ~ AGE + C1 + C2 + C3 + C4 + C5 + C6 + C7 +
C8 + C9 + C10 + C11 + C12 + C13, data = data1, method = “class”)
Variables actually used in tree construction: [1] C3
Root node error: 12/29 = 0.41379
No of observations = 29
CP nsplit results
Call: rpart(formula = CLASS ~ AGE + C1 + C2 + C3 + C4 + C5 + C6 + C7 +
C8 + C9 + C10 + C11 + C12 + C13, data = data1, method = “class”)
Variable importance
C3 C12 C2 C4 AGE C11 28 22 22 12 8 8
left son = 2 (14 obs) right son = 3 (15 obs)
Primary splits: C3 < 0.034 to the left, improve = 4.888013, (0 missing)
Surrogate splits: C2 < 0.033 to the left, agree = 0.897, adj = 0.786, (0 split)
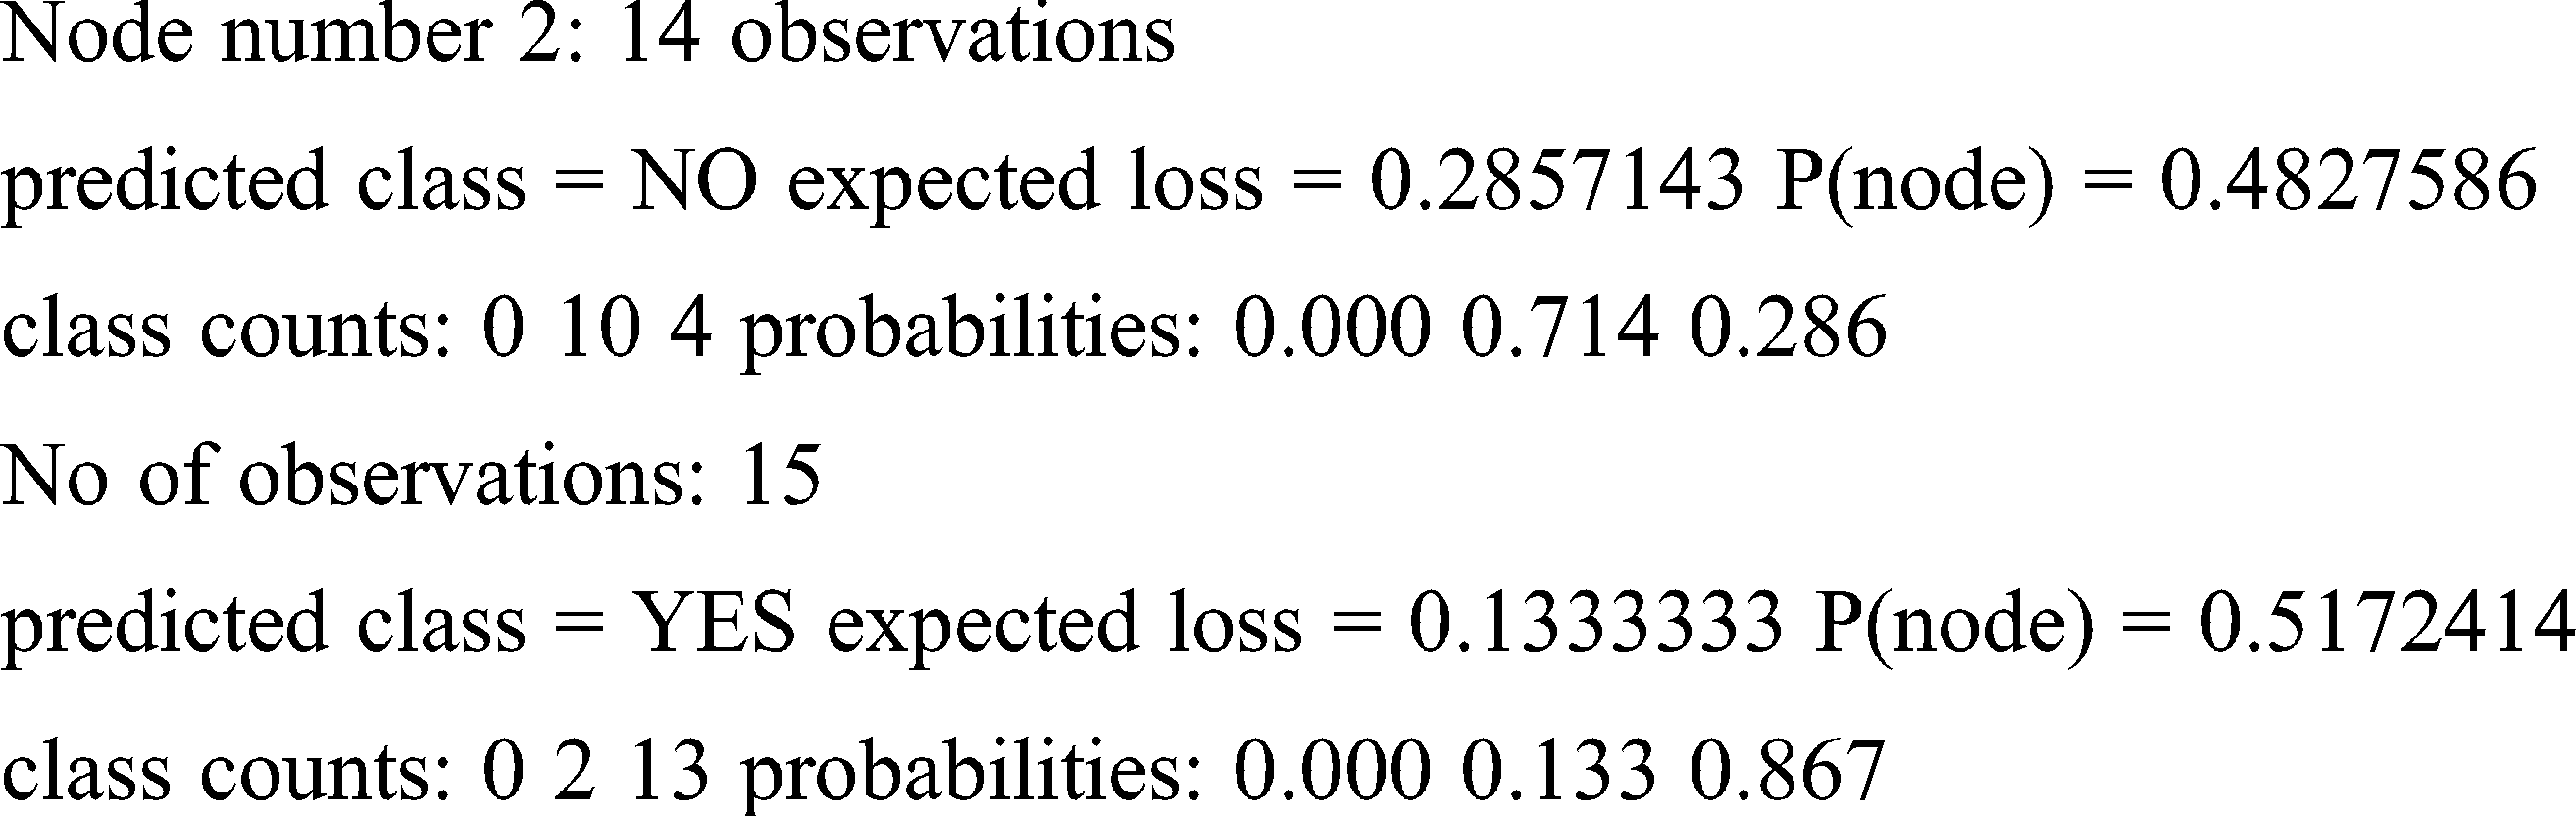
Loss and probability are the two factors taken into account for finding the right prediction for the patterns. Because of less entropy, the training set produces the prediction given below for the said pattern.
Result obtained: YES
From the above patterns, it is clear that the obtained results accurately match the selected patterns due to their equal distributions.
6.2 Random Forest Cross-Validation Classification
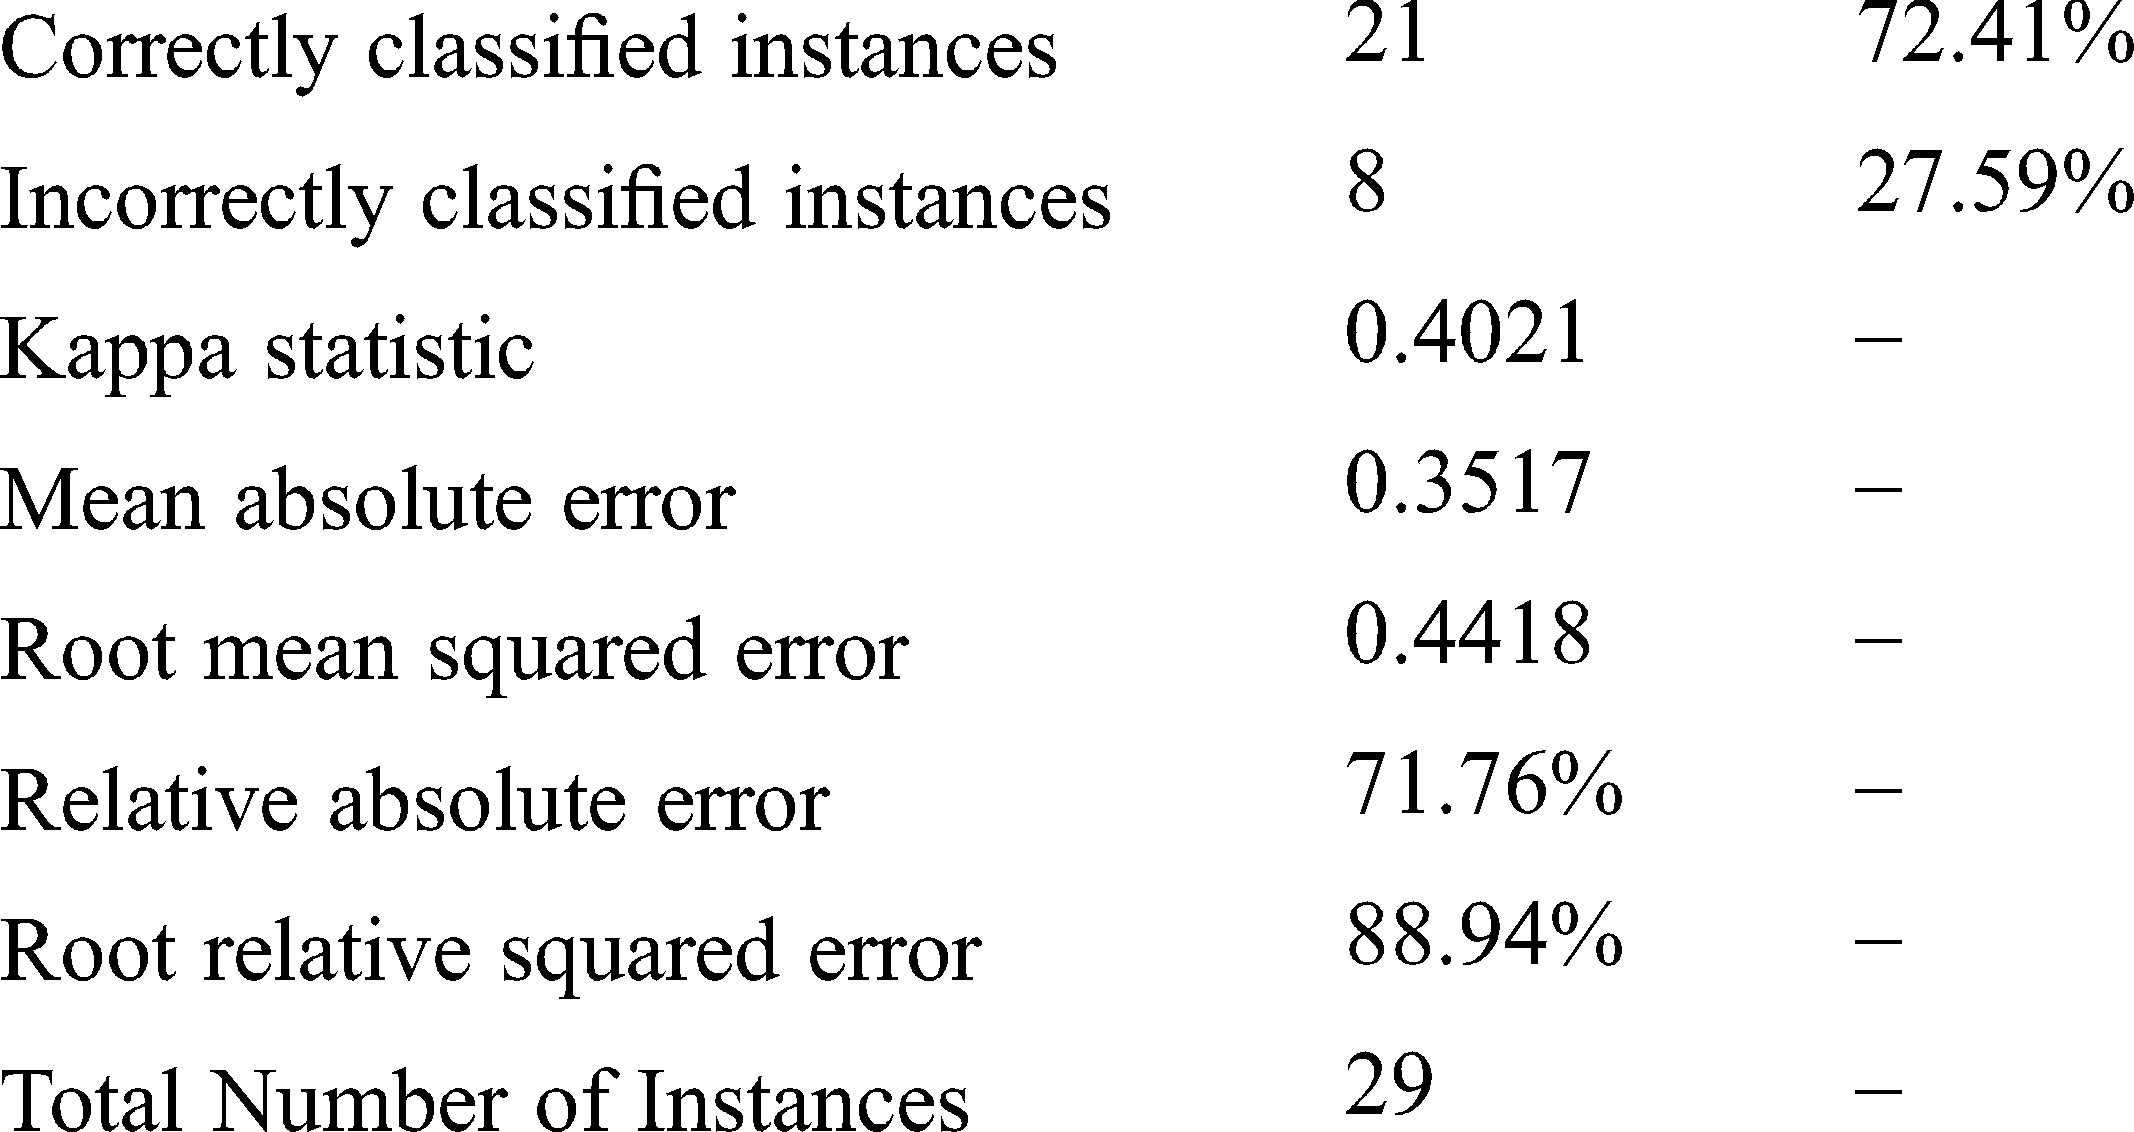
Random forest is a type of tree induction method for classification. A multitude of trees were formed while performing random forest classifications. According to the statistical phenomena, random forest and cross-validation would not be applied together. However, for simple confirmation in our research work, both are applied as a hybrid technology for errorless prediction. Fig. 2 represents the Threshold Curve and Fig. 3 depicts the Cost and Benifit curve and Fig. 4 represents the classification accuracy of the proposed system. From the results, the classification accuracy acheived is about 48.2759%.
Scheme: weka.classifiers.trees.RandomForest-I 10-K 0-S 1
Relation: modifiedLung Instances: 29, Attributes: 16
Attributes are GEN AGE C1 C2 C3 C4 C5 C6 C7 C8 C9 C10 C11 C12 C13 CLASS
C1-Smoking, C2-Yellow Fingers, C3-Anxiety, C4-Peer Pressure, C5-Chronic Disease, C6-Fatigue, C7-Allergy, C8-Wheezing, C9-Alcohol Consuming, C10-Coughing, C11-Shortness Of Breath, C12-Swallowing Difficulty, C13-Chest Pain.
Legends: Attributes and its corresponding strings
Test mode: 10-fold cross-validation
Trained dataset: Random forest of 10 trees, each constructed while considering 5 random features.
Out of bag error: 0.2414, Time taken to build model: 0.03 seconds corrected
Stratified cross-validation

Detailed Accuracy by Class
Weighted Avg. 0.724 0.342 0.729 0.724 0.711 0.728
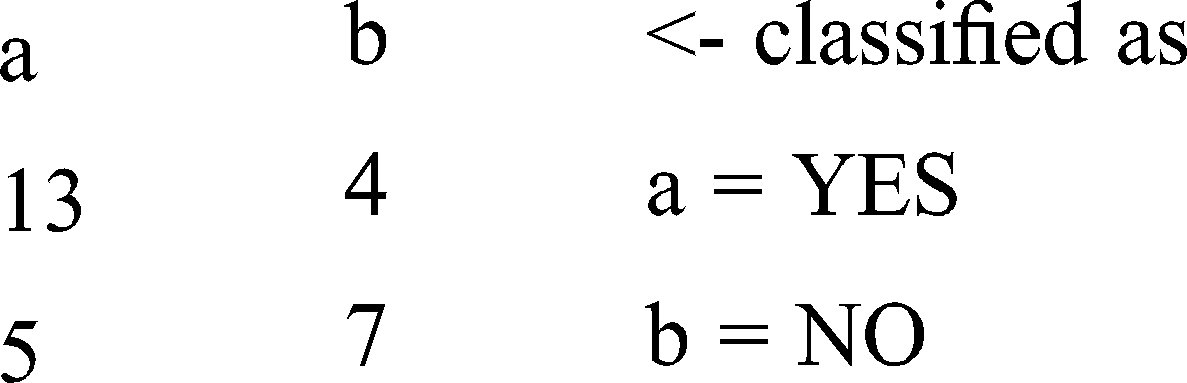
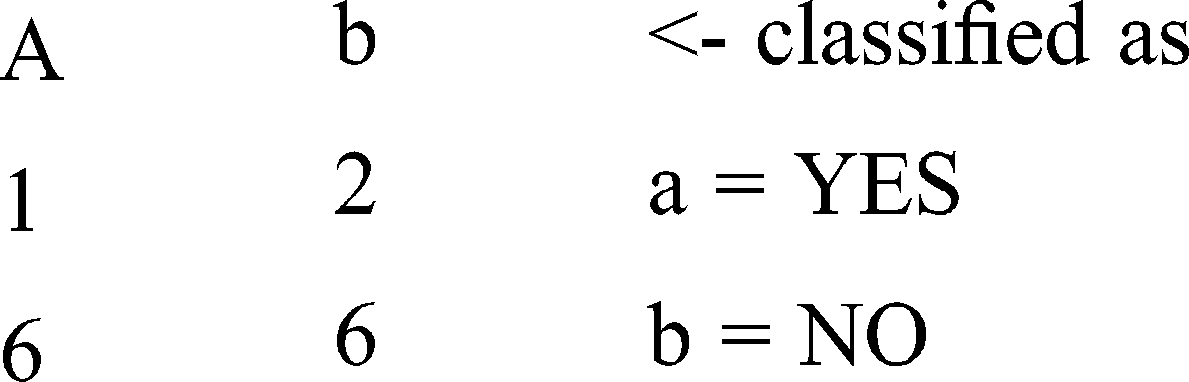
Confusion matrix will provide the real application of the prediction in terms of the segment of classes.
Confusion Matrix
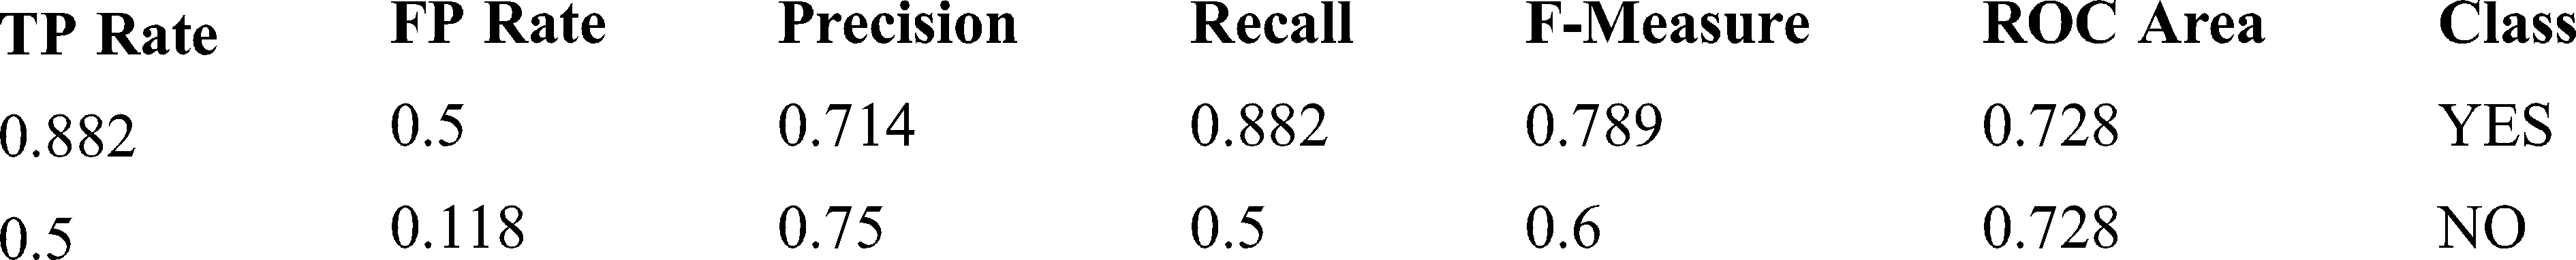
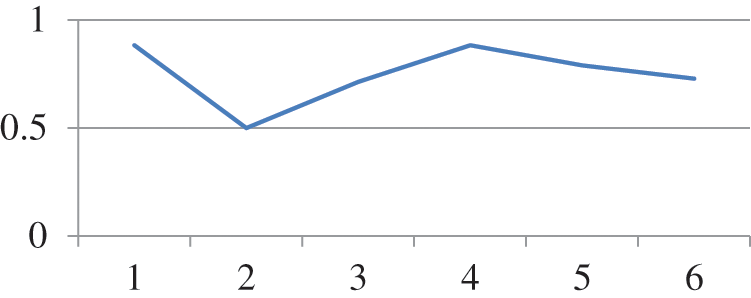
Figure 2: Threshold curve detailed accuracy by class
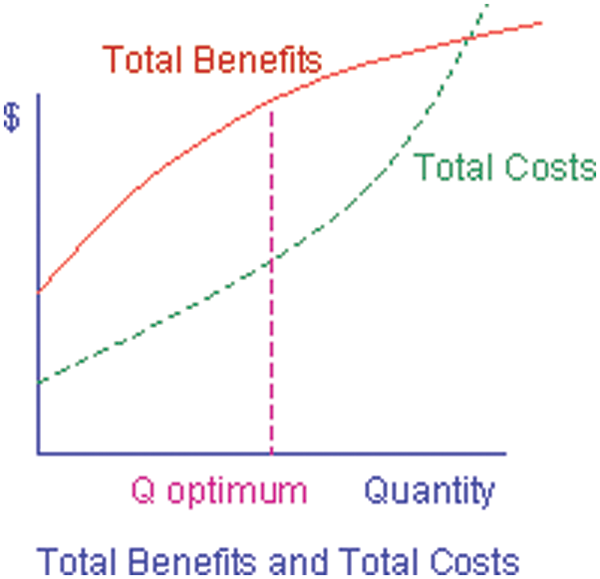
Figure 3: Cost and benefit curve
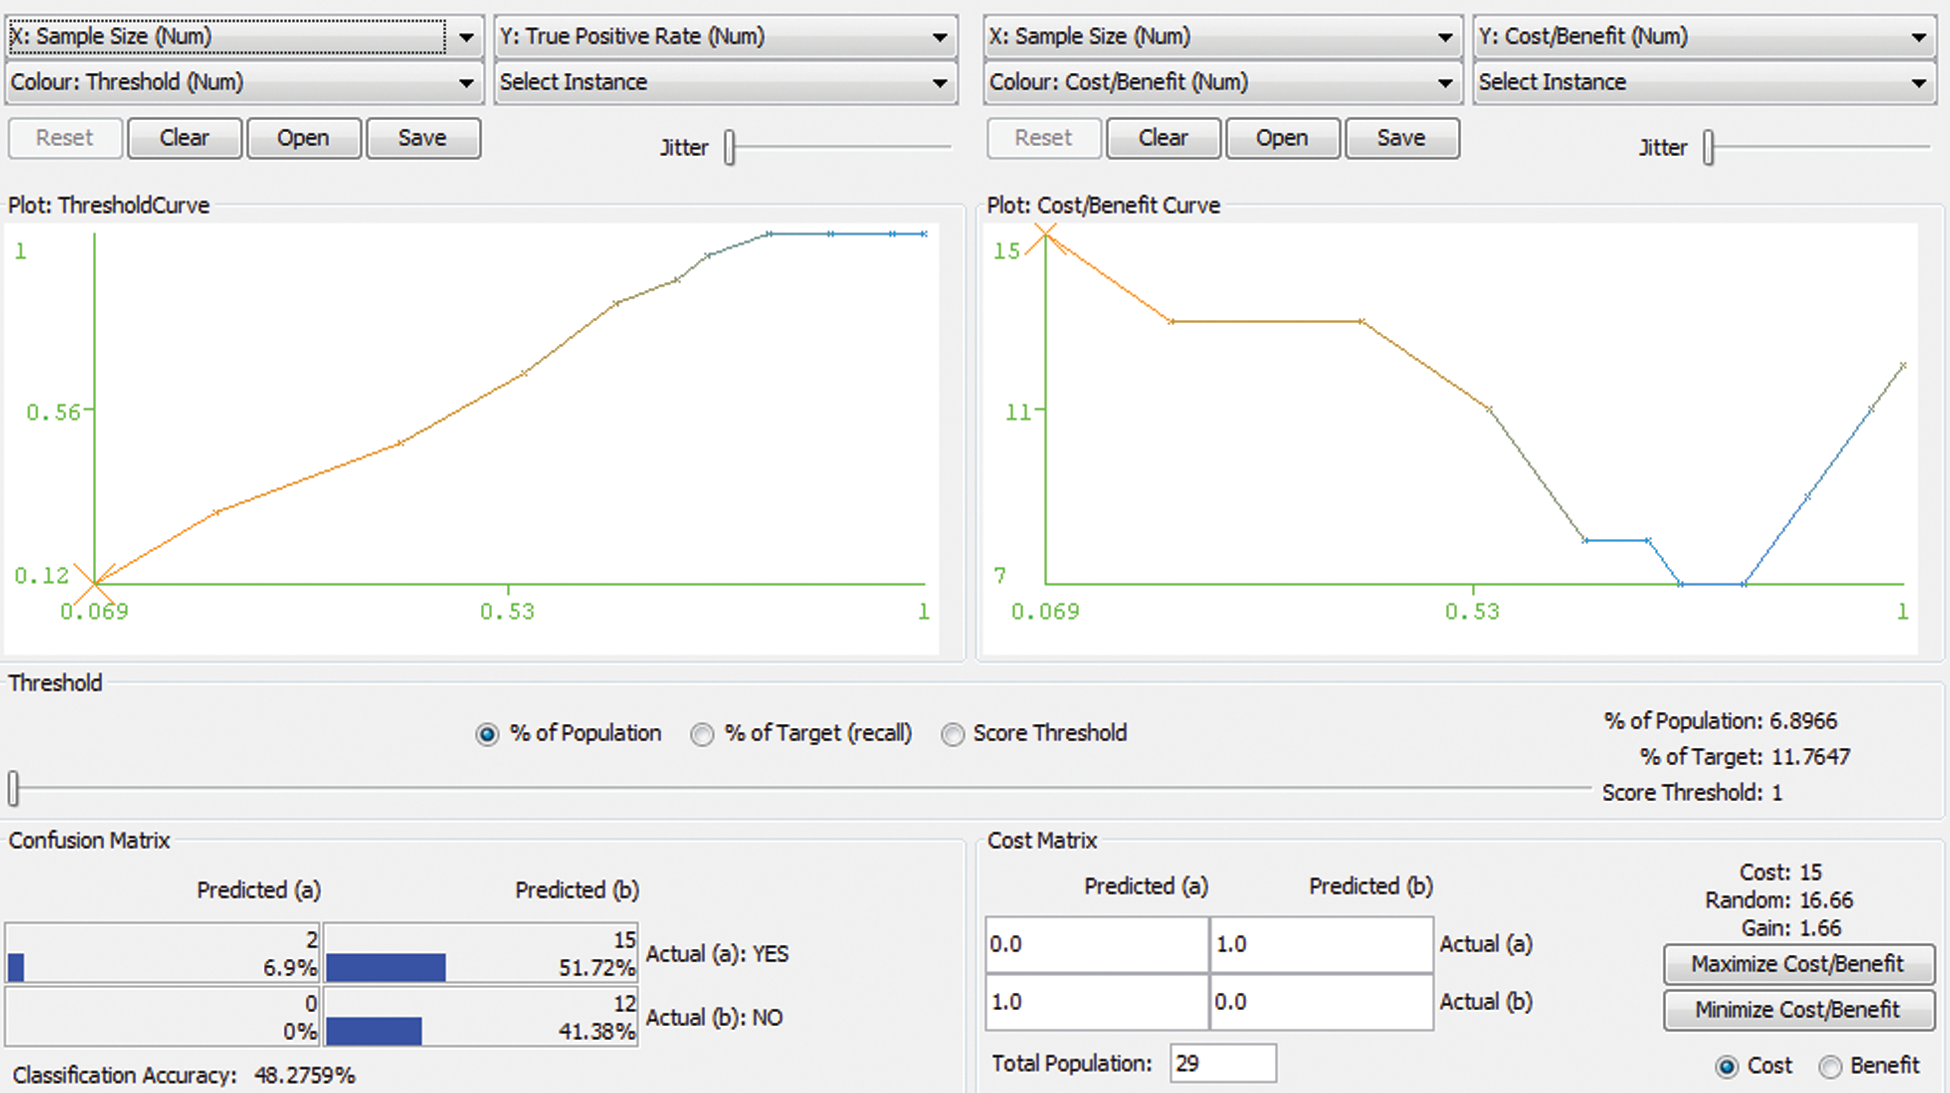
Figure 4: Classification Accuracy
Pattern: M 63 0.042 0.044 0.045 0.025 0.023 0.02 0.023 0.022 0.047 0.022 0.02 0.047 0.043
Result obtained : No
Pattern : F 51 0.042 0.044 0.045 0.05 0.023 0.041 0.047 0.022 0.023 0.022 0.039 0.047 0.022
Result obtained: YES
From the above patterns it is clear that the obtained results accurately matches due to their equal distributions.
From the above patterns it is clear that the obtained results accurately match due to their equal distributions.
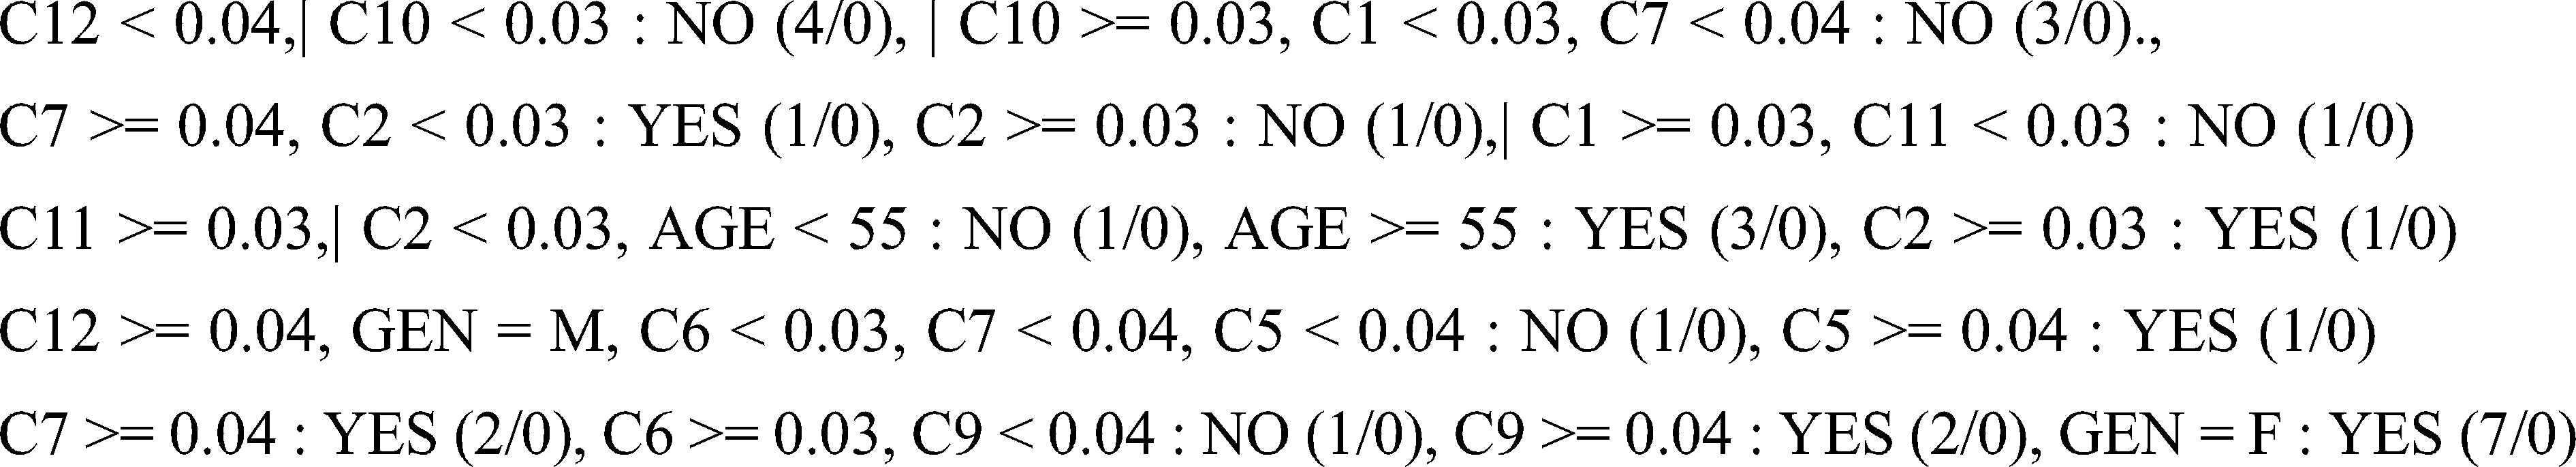
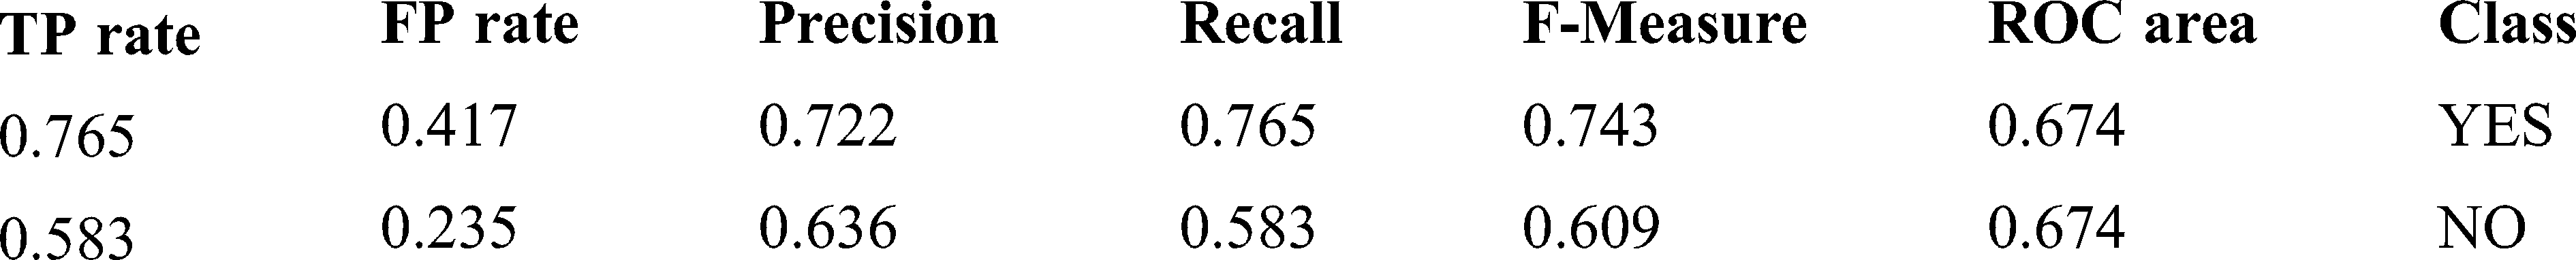
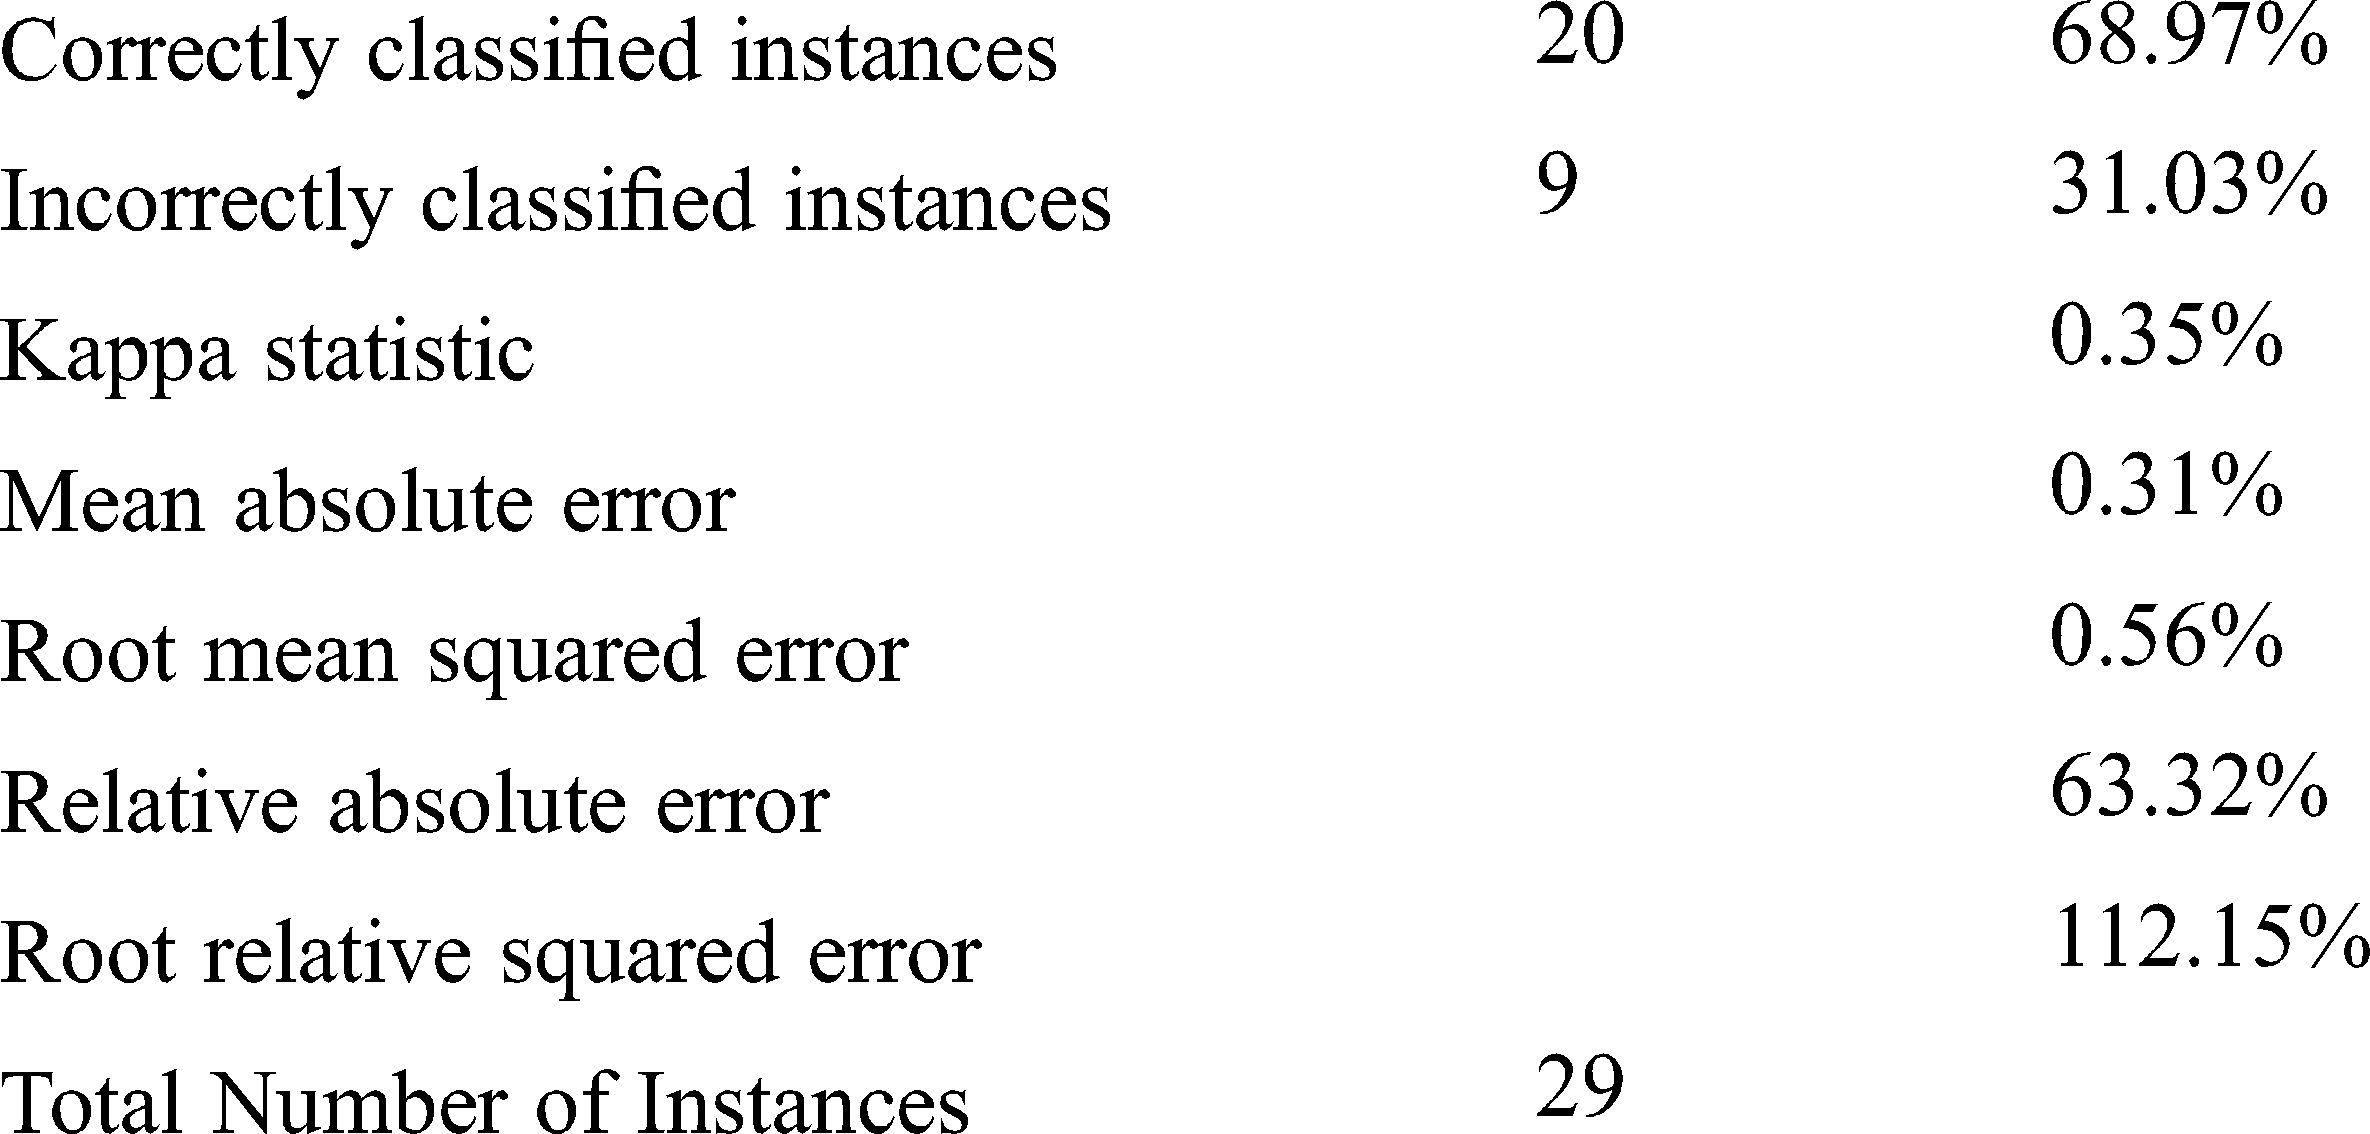
6.3 Methodology 3: Random Tree
Random tree forest is a legitimate classifier with roots and siblings in every layer. Identification and prediction can be understood easily because of their hierarchical structure. Leaf node is the class node, which aids in the prediction of patterns. The cross validation diagram shows in Fig. 5. The following statistical method’s result proves the theorem and provides accurate prediction.
Relation: modifiedLung
Instances: 29, Attributes: 16
Test mode: 10-fold cross-validation
Classifier model (full training set)
Size of the tree : 27, Time taken to build model: 0.01 s
Detailed Accuracy By Class
Weighted Average. 0.69 0.342 0.687 0.69 0.687 0.674
Confusion matrix will provide the real application of the prediction in terms of the segment of classes.
Stratified cross-validation
Confusion Matrix
Pattern: M 63 0.042 0.044 0.045 0.025 0.023 0.02 0.023 0.022 0.047 0.022 0.02 0.047 0.043
Result obtained : No
Pattern : F 51 0.042 0.044 0.045 0.05 0.023 0.041 0.047 0.022 0.023 0.022 0.039 0.047 0.022
Result obtained: YES
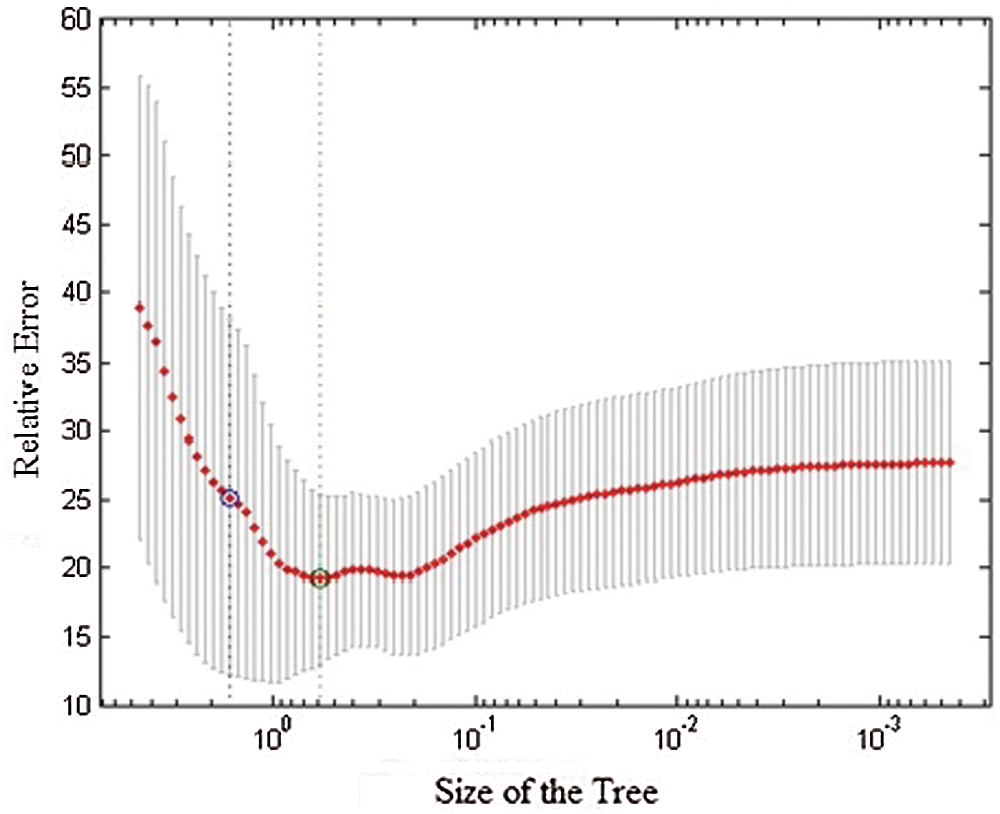
Figure 5: Cross validation diagram
In this study on the clinical evaluation of lung cancer, 4337 records are procured from the repository data world. The application of crisp ensemble modeling approaches such as random forest, cross-validation, and decision tree classifications are found to offer high-precision results, as demonstrated in the results and discussion sections. Among the classifier models, the ensemble classifier, cascading classifier, and concurrent classifier always result in good predictions of the incoming patterns. Reduction in the entropy levels is achieved due to the execution of appropriate preprocessing procedures. The results arrived were compared with the ensemble model, providing the predicted accuracy.
Acknowledgement: We thank LetPub (https://www.letpub.com) for its linguistic assistance during the preparation of this manuscript.
Funding Statement: The authors received no specific funding for this study.
Conflicts of Interest: The authors declare that they have no conflicts of interest to report regarding the present study.
1. S. Kalaivani, P. Chatterjee, S. Juyal and R. Gupta, “Lung cancer detection using digital image processing and artificial neural networks,” in 2017 Int. Conf. of Electronics, Communication and Aerospace Technology, Coimbatore, India, pp. 100–103, 2017. [Google Scholar]
2. T. Christopher and J. Jamerabanu, “Study of classification algorithm for lung cancer prediction,” International Journal of Innovative Science, Engineering & Technology, vol. 3, no. 2, pp. 2348–7968, 2016. [Google Scholar]
3. W. Wu, C. Parmar, P. Grossmann, J. Quackenbush, P. Lambin et al., “Exploratory study to identify radiomics classifiers for lung cancer histology,” Frontiers in Oncology, vol. 6, no. 71, pp. 1–11, 2016. [Google Scholar]
4. P. Petousis, S. X. Han, D. Aberle and A. A. Bui, “Prediction of lung cancer incidence on the low-dose computed tomography arm of the national lung screening trial: A dynamic bayesian network,” Artificial Intelligence in Medicine, vol. 72, pp. 42–55, 2016. [Google Scholar]
5. J. Gong, J. Y. Liu, L. J. Wang, B. Zheng and S. D. Nie, “Computer-aided detection of pulmonary nodules using dynamic self-adaptive template matching and a FLDA classifier,” PhysicaMedica, vol. 32, no. 12, pp. 1502–1509, 2016. [Google Scholar]
6. K. R. Pradeep and N. C. Naveen, “Lung cancer survivability prediction based on performance using classification techniques of support vector machines, C4.5 and naive bayes algorithms for healthcare analytics,” Procedia Computer Science, vol. 132, pp. 412–420, 2018. [Google Scholar]
7. A. K. Dubey, U. Guptaand and S. Jain, “Epidemiology of lung cancer and approaches for its prediction: A systematic review and analysis,” Chinese Journal of Cancer, vol. 35, no. 71, pp. 1–13, 2016. [Google Scholar]
8. S. W. Um, H. K. Kim, Y. Kim, B. B. Lee, D. Kim et al., “Bronchial biopsy specimen as a surrogate for DNA methylation analysis in inoperable lung cancer,” Clinical Epigenetics, vol. 9, no. 131, 2017. [Google Scholar]
9. R. Ranjani and C. Priya, “A fusion of image processing and neural networks for lung cancer detection using SVM in MATLAB,” International Journal of Pure and Applied Mathematics, vol. 119, no. 10, pp. 101–111, 2018. [Google Scholar]
10. N. Kureshi, S. S. R. Abidi and C. Blouin, “A predictive model for personalized therapeutic interventions in non-small cell lung cancer,” IEEE Journal of Biomedical and Health Informatics, vol. 20, no. 1, pp. 424–431, 2016. [Google Scholar]
11. M. Rashmi and U. K. Patil, “Cancer diagnosis using naive bayes classifiers,” International Journal of Recent Trends in Engineering & Research, vol. 2, no. 5, pp. 376–380, 2016. [Google Scholar]
12. N. Krishnaraj, P. Ezhilarasu and X. Z. Gao, “Hybrid soft computing approach for prediction of cancer in colon using microarray gene data,” Current Signal Transduction Therapy, vol. 11, no. 2, pp. 71–75, 2016. [Google Scholar]
13. T. Choudhury, V. Kumar, D. Nigam and B. Mandal, “Intelligent classification of lung & oral cancer through diverse data mining algorithms,” in Proc. 2016 Int. Conf. on Micro-Electronics and Telecommunication Engineering, Ghaziabad, India, pp. 133–138, 2016. [Google Scholar]
14. M. V. Dass, M. A. Rasheed and M. M. Ali, “Classification of lung cancer subtypes by data mining technique, ” in Proc. 2014 Int. Conf. on Control, Instrumentation, Energy and Communication. Calcutta, pp. 558–562, 2014. [Google Scholar]
15. A. T. Azar, H. H. Inbarani and K. R. Devi, “Improved dominance rough set-based classification system,” Neural Computing and Applications, vol. 28, no. 8, pp. 2231–2246, 2017. [Google Scholar]
16. P. Singh and N. Singh, “Intelligent approaches for prognosticating post-operative life expectancy in the lung cancer patients,” in Proc. 2017 Int. Conf. on Inventive Computing and Informatics, Coimbatore, pp. 844–848, 2017. [Google Scholar]
17. R. E. Naftchali and M. S. Abadeh, “A multi-layered incremental feature selection algorithm for adjuvant chemotherapy effectiveness/futileness assessment in non-small cell lung cancer,” Biocybernetics and Biomedical Engineering, vol. 37, no. 3, pp. 477–488, 2017. [Google Scholar]
18. B. Makond, K. J. Wang and K. M. Wang, “Probabilistic modeling of short survivability in patients with brain metastasis from lung cancer,” Computer Methods and Programs in Biomedicine, vol. 119, no. 3, pp. 142–162, 2015. [Google Scholar]
19. F. Hosseinzadeh, A. H. KayvanJoo, M. Ebrahimi and B. Goliaei, “Prediction of lung tumor types based on protein attributes by machine learning algorithms,” SpringerPlus, vol. 2, no. 238, pp. 1–14, 2013. [Google Scholar]
20. Y. Dong, H. Cao and Z. Liang, “A curated target gene pool assisting early disease prediction and patient-specific treatment for small cell lung cancer,” Journal of Computational Biology, vol. 25, no. 6, pp. 576–585, 2017. [Google Scholar]
21. J. R. F. Junior, M. K. Santos, F. E. G. Cipriano, A. T. Fabro and P. M. D. A. Marques, “Radiomics-based features for pattern recognition of lung cancer histopathology and metastases,” Computer Methods and Programs in Biomedicine, vol. 159, pp. 23–30, 2018. [Google Scholar]
 | This work is licensed under a Creative Commons Attribution 4.0 International License, which permits unrestricted use, distribution, and reproduction in any medium, provided the original work is properly cited. |