DOI:10.32604/iasc.2021.018635
| Intelligent Automation & Soft Computing DOI:10.32604/iasc.2021.018635 | |
| Article |
Color Contrast Enhancement on Pap Smear Images Using Statistical Analysis
1Faculty of Electronic Engineering Technology, Universiti Malaysia Perlis (UniMAP), Pauh Putra Campus, Arau, 02600, Malaysia
2Advanced Computing (AdvCOMP), Centre of Excellence, Universiti Malaysia Perlis (UniMAP), Pauh Putra Campus, Arau, 02600, Malaysia
3Faculty of Electrical Engineering Technology, Universiti Malaysia Perlis (UniMAP), Pauh Putra Campus, Arau, 02600, Malaysia
*Corresponding Author: Wan Azani Mustafa. Email: wanazani@unimap.edu.my
Received: 15 March 2021; Accepted: 20 April 2021
Abstract: In the conventional cervix cancer diagnosis, the Pap smear sample images are taken by using a microscope,causing the cells to be hazy and afflicted by unwanted noise. The captured microscopic images of Pap smear may suffer from some defects such as blurring or low contrasts. These problems can hide and obscure the important cervical cell morphologies, leading to the risk of false diagnosis. The quality and contrast of the Pap smear images are the primary keys that could affect the diagnosis’ accuracy. The paper's main objective is to propose the best contrast enhancement to eliminate contrast problems in images and correct them in color images to ensure smooth segmentation. In this paper, the median and standard deviation are used for the image's global and local data where the problem region is normalized by using a special proposed formula. The expected resulting image shows only the object (nuclei and cytoplasm), and a background without any noise. The results were compared with CLAHE, HE, and Gray World, and the performance was evaluated based on PSNR, RMSE, and MAE. Proposed method shows higher PSNR and RMSE value while lower value for MAE compared to other methods. This paper's main impact will help doctors in identifying the patient's disease, such as cervical cancer, based on a Pap smear analysis, and increase the accuracy percentages as compared to the conventional method.
Keywords: Color; contrast; pap smear; enhancement; image
The growing of abnormal cervix cells causes cervical cancer to occur in women’s cervix. These abnormal cells invade other tissues and organs such as the liver and lungs [1–3]. The risk of developing abnormal cells is associated with the infection of human papillomavirus (HPV). About 70% of all cervical cancer cases worldwide are caused by HPV types 16 and 18. Early cervical cancer symptoms are found in abnormal menstruation, irregular menstruation, heavy menstruation, weight loss, pelvic pain, and vaginal discomfort [4,5]. Cervical cancer screening is an early method to detect cervical cancer. Papanicolaou’s test, also known as the Pap smear test, is done to detect cancer or pre-cancer in the cervix [6–8]. During the test, the doctor will use a speculum to widen the vagina. Then, a soft brush will be used to collect few cells from the cervix. The sample cells are then sent to the laboratory. The microbiologist will apply unto the cells the Papanicolaou stain and proceed to detect abnormalities by analyzing them under a microscope [9]. The microscopic image sample risks blurring effects, noise, shadow, lighting, and artifacts problems. A microbiologist can only diagnose a microscopic observation. Thus, a time-consuming and inaccurate result may occur even with experienced hands. Correct diagnosis information is important to help a doctor analyse a patient’s condition [10].
Clinically, the identification of cervical cancer can be made by examining Pap smear samples taken from the uterine cervix. Two diagnosis methods can be performed on a mucus sample, namely, a diagnosis through microscopic and non-microscopic observation. Microscopic observation is a process to diagnose the sample using the microscope to identify the parasite’s presence. This method is the most economical and has become the standard method among microbiology experts. However, this method is limited, where microbiologists can only make the diagnosis. Observation using a microscope can also be difficult if the image is affected by blurring effects and unwanted artifacts. Methods to automatically detect diseases from microscopic images taken from the specimens have been proposed recently. These schemes’ performance depends greatly on the contrast between the objects of interest and the background (or the rest of the objects). The specimens are usually stained to highlight the objects of interest. However, the staining process does not always result in the same color for the objects of interest and the background, owing to the variations in the buffer’s pH. The performance of the automatic methods, as well as that of manual observation, can be improved if the variations induced due to staining are appropriately handled. It can be further improved if the contrast between the objects of interest and background is increased in addition to regular staining. In general, the test is performed by examining the cells using a microscope. While the Pap test undoubtedly facilitates diagnosis, it suffers from several weaknesses such as blurriness and the effects of unwanted noises, which may lead to false diagnosis. A few processing techniques such as contrast enhancement and image segmentation have been applied to the Pap smear image to overcome them [11].
One of the previous studies applied a moving k-means (MKM) clustering algorithm to segment the cervical cells and a linear contrast algorithm to enhance the contrast of the cell images. In order to address some of these problems, Isa [12] proposed two new contrast enhancement techniques, namely nonlinear bright and nonlinear dark contrast enhancement techniques. Garcia-Gonzalez et al. [13] proposed a combination of mean-shift filters based on mean-shift clustering over colour technique to improve the contrast of Pap smear sample images. They were successful in eliminating both noise and unnecessary detail from appearing on the image. Moreover, the edges are not fragmented, and the sharp changes in grey level are not smoothed except for those cases in which changes are best defined for a larger scale. Lin et al. found differences suggesting that equalization and Gaussian filter for noise reduction is more powerful.
The average value of coarseness calculation for each pixel is later used as a determining characteristic of reinforced object images. Previous researchers [14] implemented Bi-Histogram Equalization with Adaptive sigmoid function. There are three modules for this method which are histogram splitting, sigmoid transform creation, and mapping. Many authors applied Contrast Limited Adaptive Histogram Equalization (CLAHE) [15–18]. In the pre-processing step, Plissiti et al. [19] used CLAHE, and the global threshold is applied to the image to extract the background and get smooth regions of interest. HE has been used to increase the contrast between cells and the background [20]. The implemented Bi-group enhancement to discriminated the object pixels from other object pixels was studied by Mbaga et al. [21]. This method is applied to sharpen the contour of the nucleus from another object. The contrast between the nucleus and cytoplasm boundary is improved based on the pap smear cell image's pixel intensity.
In conclusion, medical image diagnosis is a big challenging task in the image processing field and analysis due mainly to the appearance of the noise, shadow, random background, overlapping objects, and illumination problem. Many researchers have been primarily concentrating on automated enhancement techniques in the past decades as they are more accurate and practical than conventional methods [22,23]. The sensitivity and correct diagnosis information are essential to help doctors/pathologists analyse the patient condition. Furthermore, the automated technique is a faster process to identify the patient disease compared to the conventional technique by using the microscope procedure.
First, all the processing was coded using MATLAB 2017 from Toshiba laptop (L50A) with processor Intel® Core™ i5-4200M CPU @ 2.50GHz. The cervical dataset experimented is from Herlev University Hospital, Denmark. The university has established a database and is used by many researchers worldwide for detection or classification purposes [24–26]. This database consists of seven cervical cell types, such as normal superficial, normal intermediate, columnar, mild dysplasia, moderate dysplasia, severe dysplasia, and carcinoma. All the images have different ratios, sizes, and resolutions. The method based on a combination of a mathematical statistic such as variance, standard deviation and mean pixels. By adjusting the median and standard deviation of a neighbourhood at each pixel, three groups will be detected; background, foreground, and problem region (contrast & luminosity). The problem region will be normalized by using a special proposed formula. The expected result image only shows the object (nuclei and cytoplasm) and background without any noise. The flow of the proposed method is illustrated in Fig. 1.
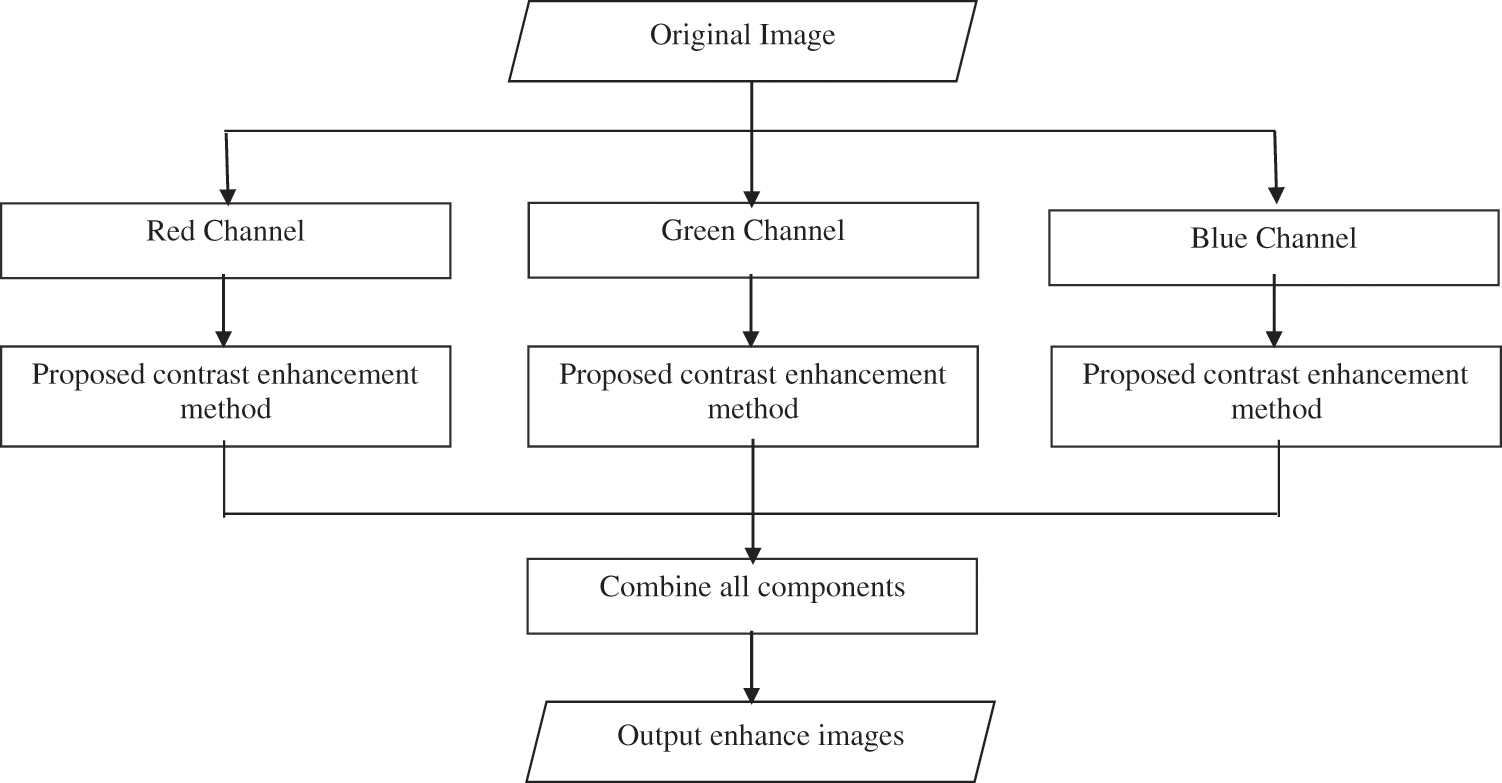
Figure 1: Flow chart of the proposed contrast enhancement method
There are 105 Pap smear images used in this study. The sample images are from the Herlev database, developed in Herlev University Hospital, Denmark. The database is under NiSIS, Nature-inspired Smart Information Systems (EU co-ordination action, contract 13569), with special relevance to the focus group Nature-Inspired Data Technology. It will thus be accessible on the Internet for anyone (http://fuzzy.iau.dtu.dk/download/smear2005). There are 917 Pap smear image samples, and they are all distributed unevenly in 7 different classes.
The original image is converted to an RGB color space. Red, green and blue are the three primary components in the RGB model. The image in all channels is enhanced by using the proposed contrast enhancement method.
2.2 Proposed Contrast Enhancement Method
The proposed contrast enhancement method was then applied to an image in the red, blue, and green channels. In the proposed method, median and standard deviation were used for global and local data images. Local standard deviation
The proposed method was carried out based on the following steps:
a. Calculate the local median and standard deviation by using a 3 × 3 windowing size.
b. Calculate the Global median and standard deviation.
c. The statistical condition is derived as Eq. (1) to detect the foreground region, background region, and problematic region.
where,
d. Calculate the optimal threshold value (k) by applying Otsu thresholding on the problematic region to separate the nucleus and problem (luminosity, noise, and contrast) region.
e. Apply threshold value (k) in Eq. (4) to obtain
where,
Based on this method, only a problematic region was enhanced, and the nucleus remained the same. After the proposed enhancement method was applied, all channels were combined in a single image.
There are 105 Pap smear images used in this study, with 15 images in every 7 different classes. The proposed method was compared with HE, CLAHE, and Gray World. Fig. 2 shows the resulting images after the segmentation method was applied. Based on the observation in Fig. 2, the HE, CLAHE, and Gray World images showed poor contrast and noise removal. This will affect the segmentation process. Compared to the original image and other methods, the proposed method was able to remove background noise and correct the contrast.
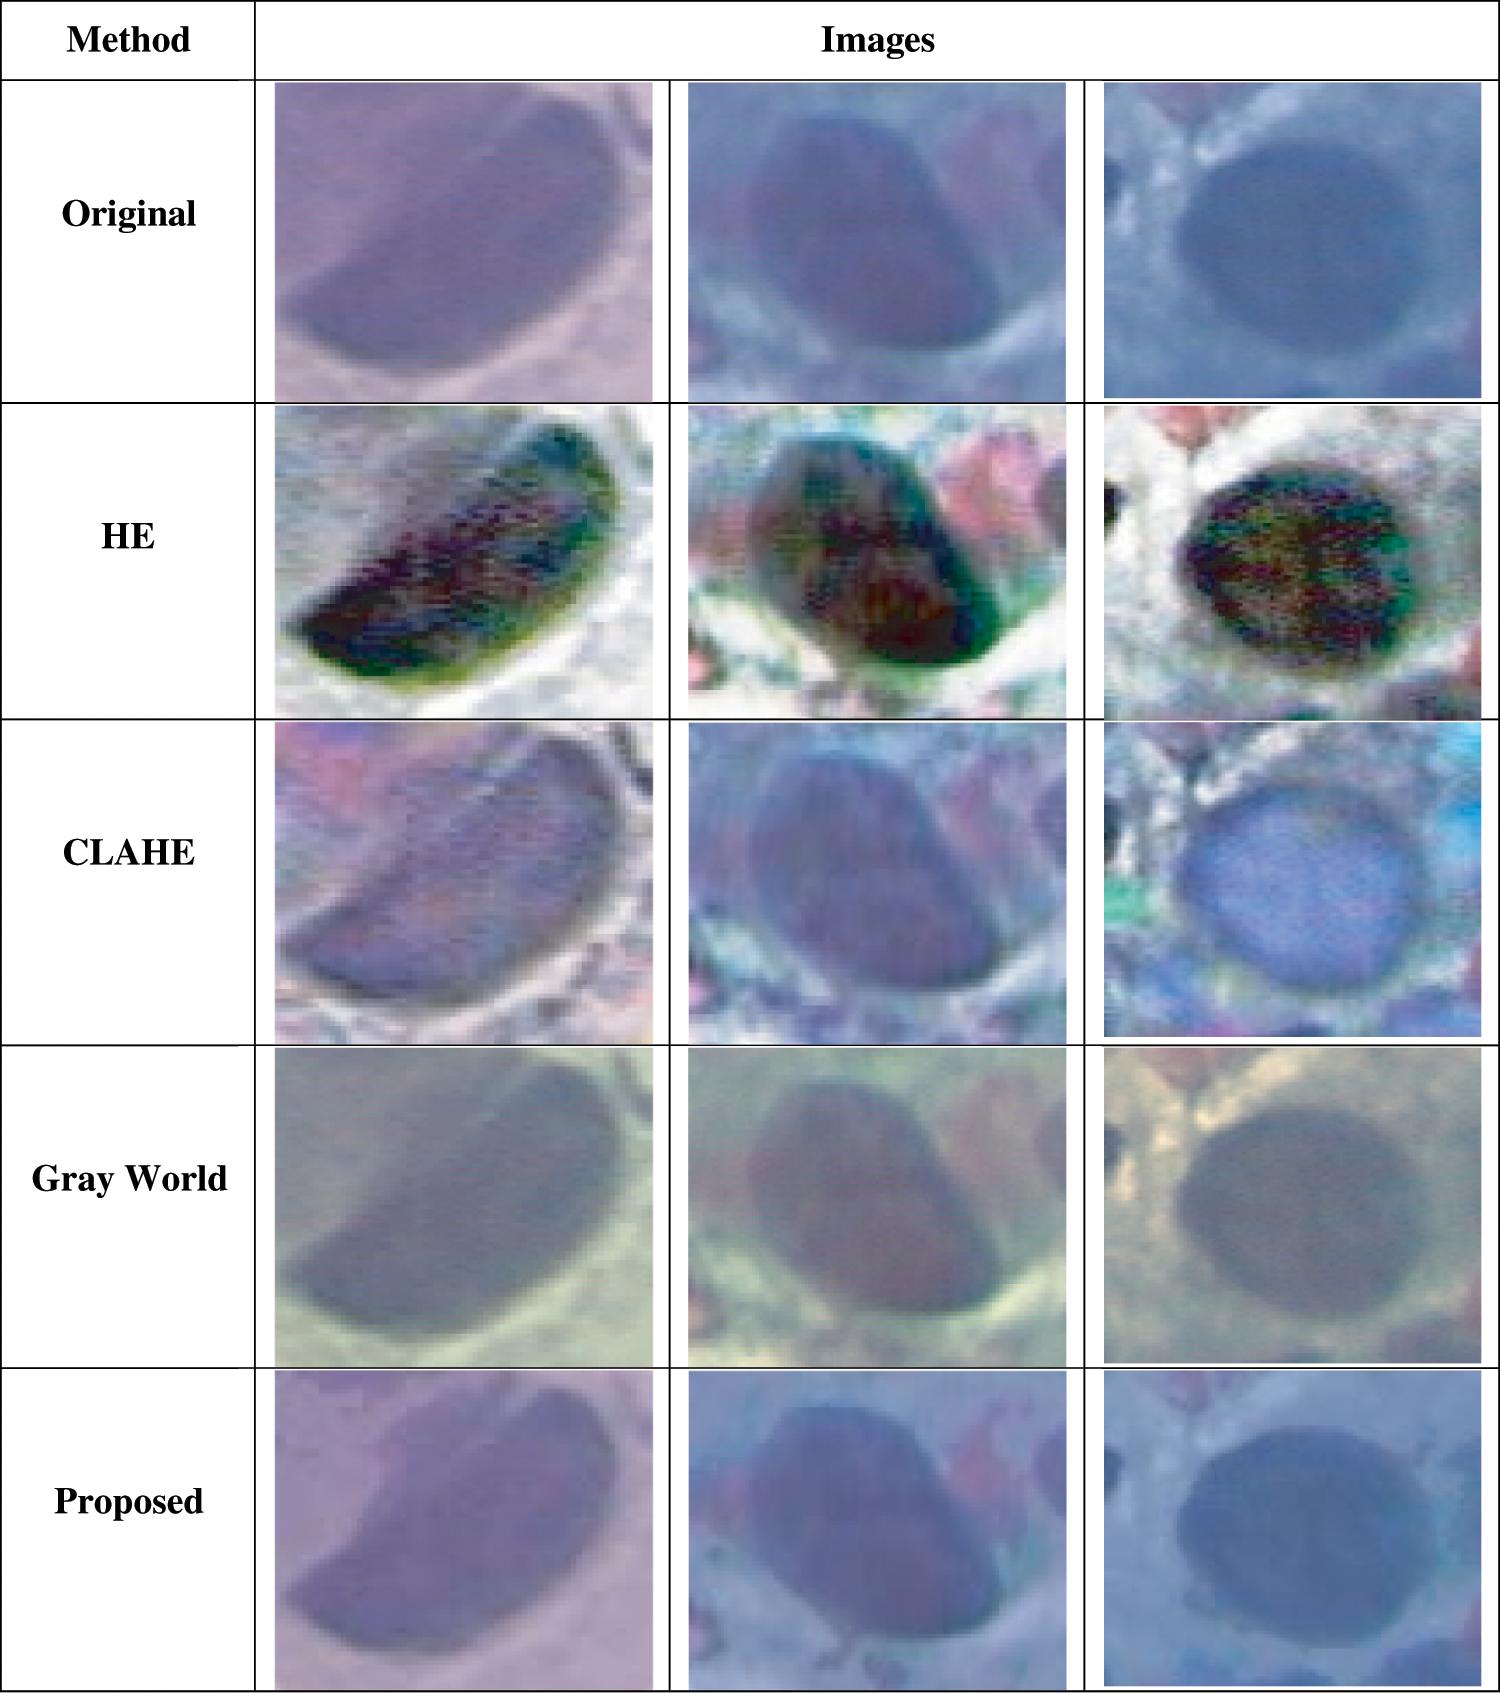
Figure 2: Comparison resulting in Pap smear images
A few quantitative analysis was conducted to determine the performance of each contrast enhancement method. PSNR, RMSE, and MAE were used to determine the performances and the efficacy of the proposed method. Peak-signal-to-noise-ratio (PSNR) was used to analyse the quality of the enhanced image [27]. The equation of PSNR is as follows
where the pixels are represented using 8 bits per sample, R = 255. R = 1 for the double-precision image.
Root-Mean-Square-Error (RMSE) evaluates the amount of change per pixel due to the processing [28]. The RMSE between the original image and the reconstructed image is given by equation below,
Mean-Absolute-Error (MAE) determines the differences between the original and enhanced image [29]. MAE used the same scale as the data being measured.
Tab. 1 shows the comparison of contrast enhancement methods based on RMSE, PSNR, and MAE. The proposed method had a higher PSNR (33.1856) and RMSE (11.6652) value while a lower value for MAE (1.7469). The higher the PSNR and RMSE value, the higher the image quality. The proposed method showed low-value MAE with 1.7469 compared to HE (35.9564), CLAHE (4.5445), and Gray World (21.6395). This shows less maximum absolute value between an original image and the enhanced image. Based on the results, the proposed method appeared to be more efficient to correct contrast and remove noise from background images than other contrast methods.

The early diagnosis of cervical cancer is using Pap smear screening. The Pap smear slide analysis is the most important task, while recognizing disease or condition is essential to provide the necessary treatment. Furthermore, for clinical research, the Pap smear diagnosis response to a treatment or medication must be observed or quantified. Microscope image is extensively used clinically for diagnosing Pap smear image. In the conventional method, by using microscopic to capture the sample image, the sample images will risk blurry effects, noise, shadow, lighting, and artifacts problem on the images of thin smears. The conventional method has risks that can cause inaccurate results because the diagnosis depends on human skills. This research aims to develop a contrast correction capable of improving the existing conventional enhancement. This technique is based on the statistical information from median and standard deviation value. This process also involves local and global techniques. The image will be processed on the 3 by 3 windowing size to get a better result. The Pap smear image will be divided into the background, foreground, and problematic regions (contrast and luminosity problem). However, only the problematic region will undergo enhancement process.
The enhancement technique that was built is also believed to help pathologists increase the accuracy of diagnosis. The results were compared with CLAHE, HE, and Gray World, and the performance was evaluated based on PSNR, RMSE, and MAE. As a result, the proposed method showed a good result when tested with 105 pap smear images.The proposed method had a higher PSNR and RMSE value while a lower value for MAE. Successful implementation of contrast enhancement and colour normalization techniques on Pap smear image can become a standard technique for diagnosing various microbiological infections such as Malaria and Tuberculosis.
Funding Statement: This work was supported by the Ministry of Higher Education Malaysia's funding under the Fundamental Research Grant Scheme (FRGS/1/2018/SKK13/UNIMAP/02/1).
Conflicts of Interest: The authors declare that they have no conflicts of interest to report regarding the present study.
1. A. Shetty and V. Shah, “Survey of cervical cancer prediction using machine learning: A comparative approach,” in 2018 9th Int. Conf. on Computing Communication and Networking Technologies, Bengaluru, India, pp. 1–6, 2018. [Google Scholar]
2. American Cancer Society, Tests for cervical cancer | diagnosed with cervical cancer. USA: American Cancer Society, Atlanta, Georgia, United States, 2016. [Google Scholar]
3. American Cancer Society, Cervical cancer what is cervical cancer?. USA: American Cancer Society, Atlanta, Georgia, United States, pp. 4–7,2016. [Google Scholar]
4. A. Halim, W. A. Mustafa, W. K. W. Ahmad, H. A. Rahim and H. Sakeran, “Nucleus detection on pap smear images for cervical cancer diagnosis : A review analysis,” Oncologie, vol. 23, no. 1, pp. 73–88, 2021. [Google Scholar]
5. WHO, Cervical cancer.WHO, Geneva, Switzerland, 2018. [Google Scholar]
6. N. Nahrawi, W. A. Mustafa and S. N. A. M. Kanafiah, “Knowledge of Human Papillomavirus (HPV) and cervical cancer among Malaysia residents: A review,” Sains Malaysiana, vol. 49, no. 7, pp. 1687–1695, 2020. [Google Scholar]
7. R. I. Shader, “The pap test and the pap smear,” Clinical Therapeutics, vol. 37, no. 1, pp. 1–3, 2015. [Google Scholar]
8. V. Miličić-Juhas, M. Perić, M. Pajtler, I. Prvulović and D. Čuržik, “Pap test - with or without vaginal smear?,” Collegium Antropologicum, vol. 34, no. 1, pp. 69–74, 2010. [Google Scholar]
9. A. K. Das, L. B. Mahanta, M. K. Kundu, M. Chowdhury and K. Bora, “Automated classification of pap smear images to detect cervical dysplasia,” Computer Methods and Programs in Biomedicine, vol. 138, pp. 31–47, 2016. [Google Scholar]
10. L. Z. Wei, W. A. Mustafa, M. A. Jamlos, S. Z. S. Idrus and M. H. Sahabudin, “Cervical cancer classification using image processing approach: A review,” IOP Conference Series: Materials Science and Engineering, vol. 917, pp. 1–9, 2020. [Google Scholar]
11. W. A. Mustafa, A. Halim and K. S. A. Rahman, “A narrative review: Classification of pap smear cell image for cervical cancer diagnosis,” Oncologie, vol. 22, no. 2, pp. 53–63, 2020. [Google Scholar]
12. N. A. M. Isa, N. Mustafa, K. Z. Zamli and M. Y. Mashor, “Improvement of contrast enhancement technique for cervical cell of pap smear images by reducing the effect of unwanted background information,” in Int. Conf. on Computing & Informatics, Kuala Lumpur, Malaysia, pp. 1–7, 2006. [Google Scholar]
13. D. Garcia-Gonzalez, M. Garcia-Silvente and E. Aguirre, “A multiscale algorithm for nuclei extraction in pap smear images,” Expert Systems with Applications, vol. 64, pp. 512–522, 2016. [Google Scholar]
14. P. B. Shanthi and K. S. Hareesha, “Comparative analysis of nucleus segmentation techniques for malignancy detection of pap smear cervical cells,” Journal of Computational Methods in Sciences and Engineering, vol. 19, no. 2, pp. 507–522, 2019. [Google Scholar]
15. W. William, A. Ware, A. H. Basaza-Ejiri and J. Obungoloch, “A pap-smear analysis tool (PAT) for detection of cervical cancer from pap-smear images,” BioMedical Engineering OnLine, vol. 18, no. 1, pp. 1–22, 2019. [Google Scholar]
16. R. Kurniawan, I. Muhimmah, A. Kurniawardhani and I. Indrayanti, “Segmentation of overlapping cervical cells in normal pap smear images using distance-metric and morphological operation,” Journal of Communication and Information Technology, vol. 11, no. 1, pp. 25, 2017. [Google Scholar]
17. A. Tareef, Y. Song, W. Cai, H. Huang, H. Chang et al., “Automatic segmentation of overlapping cervical smear cells based on local distinctive features and guided shape deformation,” Neurocomputing, vol. 221, pp. 94–107, 2017. [Google Scholar]
18. M. E. Plissiti, C. Nikou and A. Charchanti, “Automated detection of cell nuclei in pap smear images using morphological reconstruction and clustering,” IEEE Transactions on Information Technology in Biomedicine, vol. 15, no. 2, pp. 233–241, 2011. [Google Scholar]
19. M. E. Plissiti, C. Nikou and A. Charchanti, “Accurate localization of cell nuclei in pap smear images using gradient vector flow deformable models,” in BIOSIGNALS, 2010—Proc. of the 3rd Int. Conf. on Bio-inpsired Systems and Signal Processing, Valencia, Spain, pp. 284–289, 2010. [Google Scholar]
20. J. Su, X. Xu, Y. He and J. Song, “Automatic detection of cervical cancer cells by a two-level cascade classification system,” Analytical Cellular Pathology, vol. 2016, pp. 10–13, 2016. [Google Scholar]
21. A. HassanMbaga and P. ZhiJun, “Pap smear images classification for early detection of cervical cancer,” International Journal of Computer Applications, vol. 118, no. 7, pp. 10–16, 2015. [Google Scholar]
22. N. Nahrawi, W. A. Mustafa, S. N. A. M. Kanafiah, W. K. W. Ahmad, M. N. K. H. Rohani et al., “Nucleus detection on pap smear image using mathematical morphology approach,” Journal of Biomimetics, Biomaterials and Biomedical Engineering, vol. 49, pp. 53–61, 2021. [Google Scholar]
23. W. A. Mustafa and M. M. M. A. Kader, “A comparative study of automated segmentation methods for cell nucleus detection,” Malaysian Applied Biology Journal, vol. 47, no. 2, pp. 125–129, 2018. [Google Scholar]
24. B. Taha, J. Dias and N. Werghi, “Classification of cervical-cancer using pap-smear images: A convolutional neural network approach, ” in Communications in Computer and Information Science. vol. 723, pp. 261–272, 2017. [Google Scholar]
25. H. Bandyopadhyay and M. Nasipuri, “Segmentation of pap smear images for cervical cancer detection,” in 2020 IEEE Calcutta Conf., CALCON, 2020—Proceedings, Kolkata, India, pp. 30–33, 2020. [Google Scholar]
26. K. Kurnianingsih, K. H. S. Allehaibi, L. E. Nugroho, W. Widyawan and L. Lazuardi, “Segmentation and classification of cervical cells using deep learning,” IEEE Access, vol. 7, pp. 116925–116941, 2019. [Google Scholar]
27. J. A. Ojo, I. D. Solomon and S. A. Adeniran, “Contrast enhancement algorithm for colour images,” in Proc. Science and Information (SAI) Conf., London, United Kingdom, pp. 555–559, 2015. [Google Scholar]
28. M. D. Dileep and A. Sreenivasa Murthy, “A comparison between different colour image contrast enhancement algorithms,” Int. Conf. on Emerging Trends in Electrical and Computer Technology, Nagercoil, India, vol. 2, no. 1, pp. 708–712, 2011. [Google Scholar]
29. D. Asamoah, E. Ofori, S. Opoku and J. Danso, “Measuring the performance of image contrast enhancement technique,” International Journal of Computer Applications, vol. 181, no. 22, pp. 6–13, 2018. [Google Scholar]
 | This work is licensed under a Creative Commons Attribution 4.0 International License, which permits unrestricted use, distribution, and reproduction in any medium, provided the original work is properly cited. |