DOI:10.32604/iasc.2021.016555
| Intelligent Automation & Soft Computing DOI:10.32604/iasc.2021.016555 | |
| Article |
Emotional Analysis of Arabic Saudi Dialect Tweets Using a Supervised Learning Approach
Information Technology Department, College of Computer and Information Sciences, King Saud University, Riyadh, 11543, Saudi Arabia
*Corresponding Author: Heyam Al-Baity. Email: halbaity@ksu.edu.sa
Received: 05 January 2021; Accepted: 18 March 2021
Abstract: Social media sites produce a large amount of data and offer a highly competitive advantage for companies when they can benefit from and address data, as data provides a deeper understanding of clients and their needs. This understanding of clients helps in effectively making the correct decisions within the company, based on data obtained from social media websites. Thus, sentiment analysis has become a key tool for understanding that data. Sentiment analysis is a research area that focuses on analyzing people’s emotions and opinions to identify the polarity (e.g., positive or negative) of a given text. Since we need to analyze emotions and opinions more deeply, emotional analysis (EA) has emerged. This analysis means deeply categorizing words into emotional categories, such as anger, disgust, fear, joy, sadness and surprise, rather than positive or negative. Studies on EA field for the Arabic language are limited, and our research is a contribution to this area. We built a system that classifies the emotions of Arabic tweets (mainly Saudi-based tweets) under the appropriate emotional categories using a supervised machine learning (ML) approach. The six basic emotion categories are anger, disgust, fear, joy, sadness and surprise. The multinomial naïve bayes (MNB), support vector machine (SVM) and logistic regression classifiers were used as the classification methods. A comprehensive comparison between these classifiers was performed in terms of accuracy, precision, recall and F-measure. Saudi tweets were collected and used as the dataset. A corpus of Saudi dialect tweets was created from this dataset as part of this study. The experimental results indicate that SVM and logistic regression achieved the best results, with an overall accuracy of 73.39%.
Keywords: emotion analysis; machine learning; Arabic tweets; MNB; SVM; logistic regression; microblogging
Social media websites have developed significantly in recent years and have become an important source of information. These sites provide an opportunity for people around the world to communicate and share information. The vast majority of data available from the large real-world social network can be used to determine people’s feelings about a product, service, or personality. From a business perspective, social media websites are an important resource for measuring consumer satisfaction or dissatisfaction with a product or service. In addition, understanding public opinion can help enhance decision-making [1].
Microblogging is one of the most popular forms of social media that enables individuals to share their thoughts and discuss various topics. As such, it is considered a rich source of emotional data. Twitter, a social microblogging service that is widely used in Arab societies, currently plays a particularly important role in assessing public opinion in various fields [2]. Several applied studies are underway in this field, which have attracted the interest of researchers in developing automated models to analyze emotions through tweets. However, most tweets currently being analyzed by researchers are in the English language [3].
Emotions are a primary focus in many disciplines, including philosophy, psychology, social sciences, sociology, and even economics. The classification of emotions into categories or classes is a difficult undertaking that has captured the attention of many researchers throughout history. Paul Ekman, a leading psychologist, created a list, entitled “Ekman’s list,” of six basic emotions: anger, disgust, fear, joy, sadness, and surprise [4]. Detecting the emotions in a text as a practice has increased in popularity, as researchers came to understand textual information, not only as a record of occasions or facts but also as an outlet for emotional expression. For this reason, texts have become a useful source of data for sentiment and emotional analysis (EA). EA is used in marketing, customer service, psychology, human–computer interaction (HCI), and other areas [5].
Recent research has been motivated by the possibility of detecting emotions of various classes (rather than simply positive or negative sentiments) in texts. There has been limited research focusing on EA in the Arabic language, and especially in the Saudi dialect. However, it is hypothesized that the EA of Arabic tweets will have a significant effect on various Saudi Arabian economic, scientific, and social sectors. For business, emotional data is a strategic marketing tool that helps to get to know the customer and develop a quality product. For health care, it can be used to understand patients’ emotions in order to improve the patient experience. For government, it can provide an overview of people’s emotions regarding certain topics. These examples of its broad application demonstrate why EA is so powerful [6].
Its versatility and potential benefits have made EA classification very attractive to researchers. In the literature, a variety of methods have been proposed to address the problem of classifying emotions in different languages. However, EA classification for the Arabic language is still a new problem—one that remains open to more thorough investigation. To the best of our knowledge, no existing work has been performed in this field with Arabic textual content-based information retrieved from Twitter (mainly Saudi-based tweets). In this study, we will build a system to detect the emotional underpinnings of Saudi dialect tweets and classify them into appropriate emotional categories using a supervised machine learning (ML) approach. Our classification was influenced by the aforementioned six basic emotion categories: anger, disgust, fear, joy, sadness, and surprise. Furthermore, a new dataset of Saudi dialect tweets will be collected to expand the corpus of these tweets. This corpus will then be subjected to the proposed emotional classification model.
The classification of texts in general as positive or negative is the focal point of setiment analysis (SA), and another progression of it, while perceiving the specific emotion expressed in the text, is the undertaking of EA. Therefore, in certain contexts, EA is more suitable than a polarity SA. In a sentiment classification, the categories, such as positive and negative, are the poles, whereas in an emotion classification the categories are broader and may include happiness, relief, pleasantness, fear, sadness, and anger.
The paper is organized as follows: In Section 2, we present an overview of previous works related to solving the problem of the classification of emotions. Section 3 provides a detailed description of our approach, and Section 4 details the results. Section 5 presents the discussion. Finally, the conclusion and future work are explained in Section 6.
Currently, the automatic detection of feelings and emotions is utilized by numerous applications in various fields, including security informatics, e-learning, humor detection, and targeted advertising, among others. Many applications center around social media. Twitter is currently an abundant source of individual opinions on a variety of topics—so abundant, in fact, that researchers are interested in developing an automated EA tailored specifically to Twitter. However, most current research focuses on English [3]. Also, two different methods could be used to solve the EA problem. The first is the lexicon-based method, whereas the second is the ML method. Therefore, in our review of the literature, we divided previous related studies into two main sections: EA in text and EA in emoticons.
2.1 Emotional Analysis in Text
The focal point in a study proposed by Al’abed et al. [7] was to address the EA problem for Arabic text composed primarily in modern standard Arabic with the occasional use of dialectical Arabic (DA). They created a lexicon-based approach for the EA of Arabic text. For this purpose, they consulted an existing emotion lexicon called the National Research Council word–emotion association lexicon (also called EmoLex) and established their own lexicon-based tool. This lexicon was initially developed for the English language and contained 14,182 terms. It was later translated into over 20 additional languages, including Arabic, by Google Translate using Google’s in-house dataset. As a lexicon-based approach, the tool for the emotion detection of Arabic text must begin with a lexicon (dictionary) of terms, relevant to at least one emotion. EmoLex contained various terms representing no feelings. Finally, the result revealed that Al’abed et al.’s lexicon-based approach was effective, with an accuracy rate of 89.7% [7]. According to Wani et al. [8], within the constraints of the client information accessible on Facebook, in recognizing the feelings of netizens in conflict and non-conflict areas, individuals living in serene areas are less negative than those living in conflict areas. Plutchik’s eight fundamental emotions method was applied to a set of Facebook posts with the help of two users’ source accounts, with one user living in Kashmir (conflict area) and the other in Delhi (non-conflict area). In addition, a new emotion dictionary called MoodBook was created to decide the emotional state of a user based on the EmoLex and Empath lexicons. There is another approach proposed by El Ghoary et al. [9] for six basic emotions using children’s stories as their dataset. The authors found that approximately 65% of the six emotions could be detected in Arabic emotional sentences [9].
2.1.2 Machine Learning Approach
The objective behind a study proposed by Alsmearat et al. [10] was to determine whether female writers are more emotional than male writers. They concentrated on Arabic articles to study gender identification. They employed NB, decision tree (DT), SVMs, and K-nearest neighbor classifiers in their approach. For the feature extraction and selection, they used the bag of words (BOW) model and term frequency-inverse document frequency (tf-idf) as a weighting technique. The results showed no evidence for identifying gender through emotional text [10].
Tocoglu et al. [11] used a dataset of Turkish texts called “TREMO,” and classified emotional data into six categories: happiness, fear, anger, sadness, disgust, and surprise. Their dataset was compiled by surveying 4,709 individuals and was composed of 27,350 entries. Five thousand individuals participated in the survey, which involved analyzing the six emotions. This approach employed complement naïve Bayes (CNB), random forest (RF), DT C4.5 (J48), and an updated version of SVM. For feature extraction and selection, they used mutual information (MI) and tf-idf as a weighting scheme in the vector space model. According to their experiments, SVM was the preferred classifier, and the results indicated that the proven dataset was more effective than the trained, non-proven one [11].
Yang et al. [12] used SVM and conditional random field (CRF) as their methodologies to analyze a corporate web blog. Emotions were examined based on written words, which also indicated the emotional level. For feature selection, they used emotion keywords as features. The research revealed that CRF surpassed SVM in terms of accuracy [12].
Vo et al. [13] concentrated on the earthquakes in Tokyo, Japan and individuals’ reactions on social media in the aftermath of these natural disasters, especially the mental aspects. The dataset consisted of 110,715 tweets posted only on the days of the earthquakes or aftershocks. They classified the tweets into six emotions: calmness, unpleasantness, sadness, anxiety, fear, and relief. For the classification process, they used SVMs, NB, MNB, DT (J48) and maximum entropy (MaxEnt). For feature extraction and selection, they used emoticons, BOW, N-grams and stop words. The results revealed that the MNB model delivered the most accurate results among the remaining classifiers [13].
Balabantaray et al. [14] focused on the use of Twitter for EA. They employed the SVM algorithm to classify the emotions in users’ posts: happiness, sadness, anger, disgust, surprise, and fear. They used the Stanford Penn bank Part-of-Speech Tagger (POS-Tagger), emoticons, and WordNet-Affect emotion lexicons for feature extraction and selection. The SVM showed an accuracy of 73.24% [14].
Nagarsekar et al. [15] performed in-depth analyses. Two different ML algorithms, namely MNB and SVM, were applied to three different collections of data from Twitter. Afterward, the results were examined. For feature extraction, they used the bag-of-features framework. The results revealed that the MNB classifier achieved more accurate results than SVM with an accuracy of 82.73% [15].
Using data from a variety of sources, including blogs, works of fiction, and news headlines, Chaffar et al. [16] identified the following six emotions: anger, disgust, fear, happiness, sadness, and surprise. They compared the performance of three classifiers (DT (J48), NB, and SVM) to identify the best classification model for the EA of text. The feature selection techniques, BOW, and N-grams were the SVMs that outperformed the other indicators [16].
Abdul-Mageed et al. [17] used a deep learning algorithm to identify the 24 fine-grained types of emotions proposed by Robert Plutchik. They compiled a large dataset of English tweets called “EmoNet” and then developed deep learning models using a gated recurrent neural network (GRNN). It is a modern variation of recurrent neural networks used specifically for modeling sequential information. Next, they expanded the classification to Plutchik’s eight basic emotions: joy, trust, fear, surprise, sadness, anticipation, anger, and disgust. The results revealed an average accuracy of 87.58% for the 24 types of emotions. In addition, GRNNs using Plutchik’s eight basic emotions achieved 95.68% accuracy—outperforming those that used the 24 types of emotion.
2.2 Emotional Analysis in Emoticons
Emoticons, short for “emotion icons,” are images consisting of symbols, including punctuation marks. They are used in instant messages, emails, and other written forms to express a specific emotion [18]. Hussien et al. [19] focused on the problem of emotion detection using emoticons in Arabic tweets using a supervised approach in which the classifier was first trained using a labeled dataset, and the training dataset was manually annotated. The objective was to propose an automated annotation approach to the training data based on the use of emojis. A dataset of emojis in Arabic tweets was compiled, and four basic emotional categories were applied: joy, anger, disgust, and sadness. The dataset contained 134,194 Arabic tweets that focused on the four categories. SVM and MNB were used as the two ML classifiers for these experiments. They used BOW and tf-idf as feature extraction and selection techniques, respectively. The results demonstrated that the proposed automated annotation approach was superior to the manual labeling approach.
Taking into account these related studies, it is evident that the majority of the recent research has focused on different foreign languages, few of which have utilized Arabic tweet texts for EA using the ML approach. We believe that ours is the first study to analyze emotions using the ML approach with data composed entirely of Arabic - Saudi dialect tweets.
The proposed system includes five stages: data collection, data preprocessing, feature extraction, feature selection, classification and evaluation. Fig. 1 depicts an overview of the proposed system.
We could access the data (tweets) available on Twitter through the Twitter API, which is how Twitter provides access to data stored on the site. Two datasets were used in this study; both were made up of public Twitter data extracted through the Twitter API. The first dataset was collected with the help of the Saudi Telecom Company (STC) in order to obtain a large number of tweets. To create our second dataset, a pool of tweets was gathered from a hashtag keyword search, utilizing the Twitter Streaming API. A list of words and expressions for each emotional class was aggregated, and the keyword-based search was applied to create a dataset with ready-to-use classes. Also, the data was collected randomly and in Arabic. To retrieve Arabic tweets, “lang:ar” was used. We filtered the tweets by user location to identify Saudi tweets, and various Saudi regions were considered. The collected dataset contained significant noise. For that reason, a data preprocessing step was required.
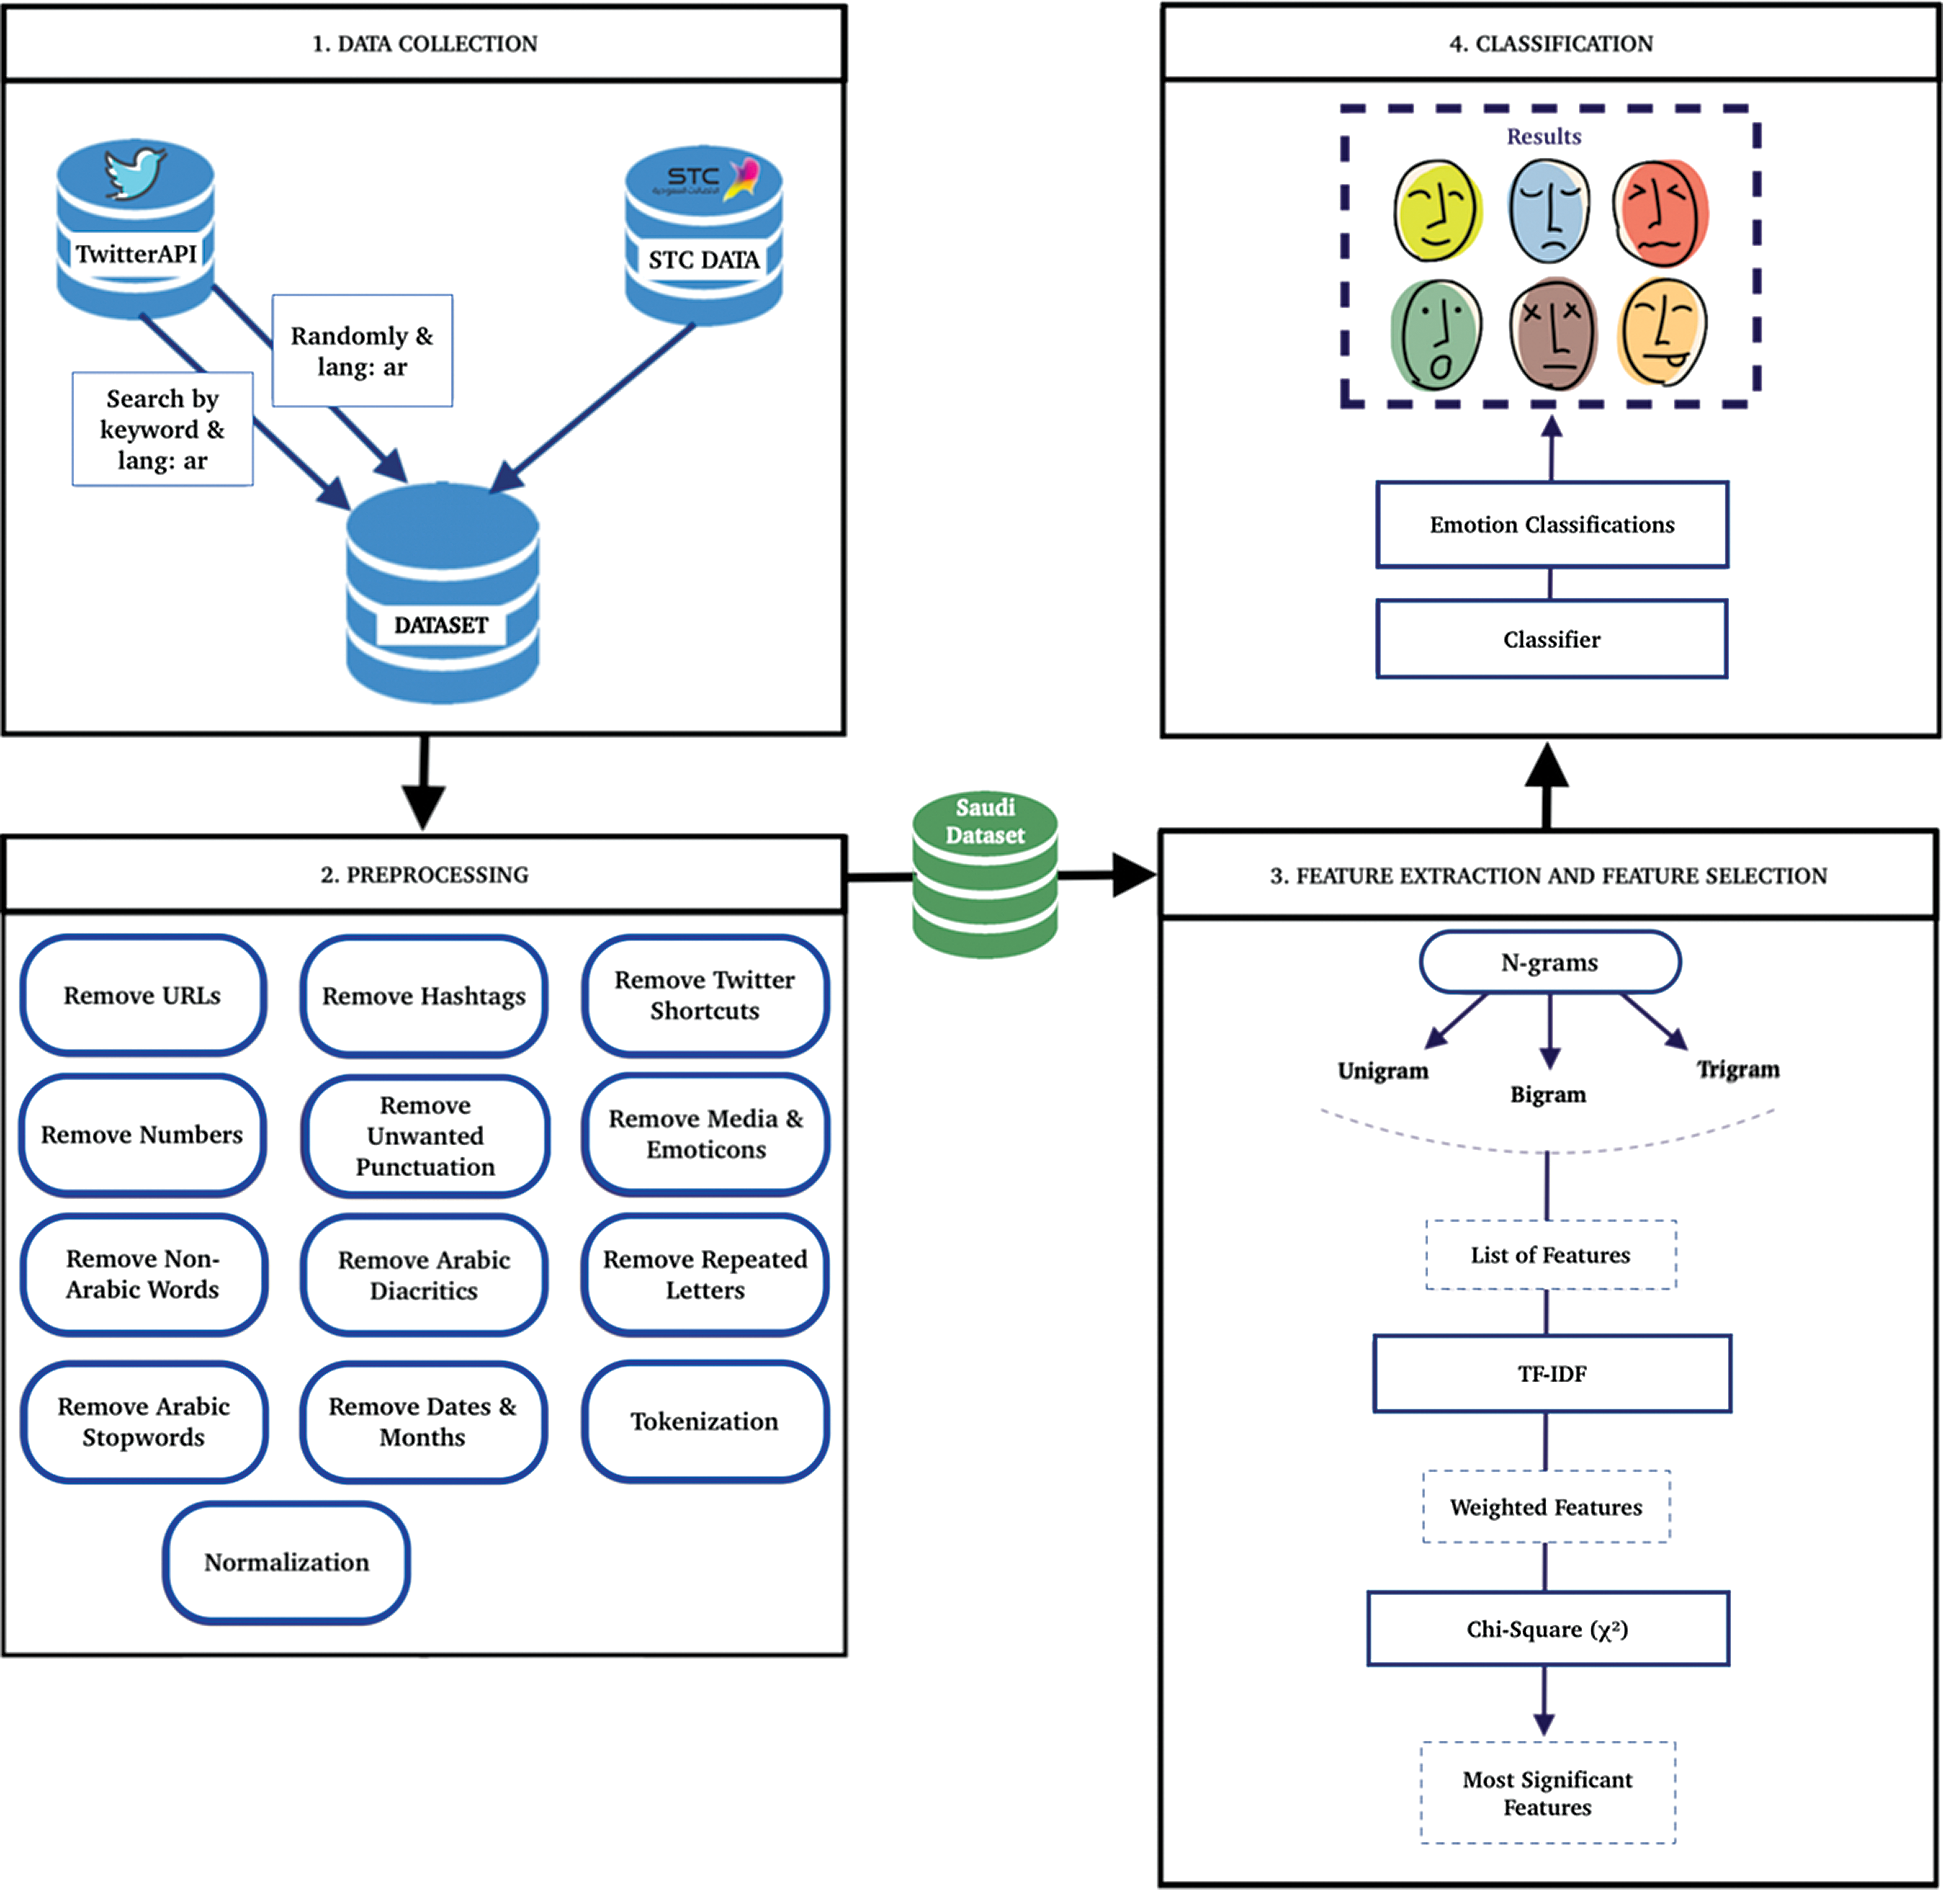
Figure 1: Overview of the system
The total number of tweets in the first dataset was 13,425. After the data preprocessing step, a number of tweets from the pool were randomly chosen for each emotion class, to form the dataset. There were 619 tweets in the anger class, 218 tweets in the disgust class, 191 tweets in the fear class, 971 tweets in the joy class, 522 tweets in the sadness class, and 331 tweets in the surprise class.
The dataset categories needed to be balanced to prevent any bias induced by skewed data. The balancing dataset could be obtained using hashtags of emotion-associated words, as well as using Arabic words as keywords to extract tweets. Multiple queries used groups of terms as Arabic keywords, which were used in the search query to collect tweets, as described in Tab. 1. This approach was effective for the fear and disgust classes, as it was difficult to find tweets expressing fear and disgust by sampling randomly. Using this approach, 8,536 tweets were collected. As such, the previous dataset was balanced by adding 159 tweets in the anger class, 621 tweets in the disgust class, 543 tweets in the fear class, 272 tweets in the sadness class and 702 tweets in the surprise class; these results served as a second dataset. The same data preprocessing steps described in Section 4.2 were also applied to these tweets. We combined our collected dataset (keywords dataset) with the previous dataset (collected by STC) to generate our new Saudi tweets corpus, which resulted in a corpus of 5,149 tweets out of 21,961 tweets. The collected tweets were filtered using Saudi Arabia’s geo-location system in the period between Dec. 15, 2018 and Mar. 13, 2019.We combined our collected dataset (keywords dataset) with the previous dataset (collected by STC) to generate our new Saudi tweets corpus, which resulted in a corpus of 5,149 tweets out of 21,961 tweets. The collected tweets were filtered by Saudi Arabia’s geo-location between the period of 15/Dec/2018 to 13/Mar/2019.
Table 1: Arabic keywords used in the search query to collect tweets

During the labeling stage, retweeted tweets; tweets including URLs; tweets including non-Arabic words; advertisement tweets; tweets including Quranic verses, prayers or prophet sayings; tweets including more than one clear emotion; and tweets including any other dialect (e.g., Egyptian) were all excluded from the dataset. The total number of collected tweets is listed in Tab. 2, which presents the data distribution (classes) and number of tweets in each class.
Table 2: Number of tweets in each emotion class

The words were not checked grammatically, and each group of letters that did not contain any white space characters was considered a word. The generated Saudi tweet corpus conclusively contained a total of 5,149 tweets for the entire dataset, which were manually labeled with the following emotion classes: anger, disgust, fear, joy, sadness and surprise.
The processing of data retrieved from Twitter involved cleaning and preparing the text for the classification process. Data preprocessing involved several steps, arranged as follows:
All tweets are limited to 280 characters in length. They may contain considerable noise and information that is irrelevant to the EA tasks, such as URLs, ads, links, email addresses, pictures or other media, and the presence of many words that do not affect the general meaning of the text or sentence. In addition, a Twitter user may mention another user by utilizing the format (@<username>) in a tweet. Retaining such information in the tweets would further complicate the problem of classification. Removing it is part of preprocessing. It is important to polish and process the data before starting the classification, as this streamlines the performance of the classifier and accelerates the classification process. In doing so, the outcome of the analysis will be more accurate. The tweets were processed using the Python programming language for NLP tasks—Python can deal with Arabic texts because it supports UTF-8 Unicode. It features some NLP techniques for analyzing Arabic text using the natural language toolkit (NLTK). The overall process of data preprocessing and cleaning included the following: removing URLs, hashtag symbols (#), Twitter shortcuts, such as <@username>, Retweet (RT), and reply, retweets and duplicate tweets, numbers in the text because they do not affect the direction of emotion, unwanted punctuation and special characters, media and emoticons, non-Arabic words, repeated letters, for example, “هلااا” would be “هلا”, Arabic diacritics (Harakat), Arabic stop words, such as “على,” "من,” "ال,”"في”, dates and months from the tweets.
For all tweets, the previous steps were executed.
Next, additional processing steps were performed on the tweets through NLTK for NLP tasks. These tasks were normalization and tokenization. Normalization means converting a list of words to a more uniform sequence, for example, changing the “آ،أ،إ” into “ا” and “أنا” to ”انا” After the normalization step, “الله” would be “اله,” but we accepted the loss of a small number of tweets removed by this rule, despite the effect their retention would have on the outcome.
The collected dataset or corpus was then manually annotated by human experts. This corpus has to be annotated first by people who had mastered the Saudi dialect before it could be utilized for training the proposed classifiers. The annotators usually added their own comments and notes to facilitate machine learning.
The process of extracting tweets from the datasets (the STC dataset and keywords dataset) was conducted in two phases. First, we completed a manual inspection of the datasets and found that we could not choose tweets randomly. We needed to extract those that included emotions so as not to confuse the annotators. After manually inspecting 21,961 tweets, 5,149 of them were found to be eligible for inclusion in the dataset. In this study, we proposed a six-way classification of emotion: anger, disgust, fear, joy, sadness, and surprise. As such, the same labels were used for annotation. We also included one more label, “none,” to be used in situations in which the annotator could not identify the emotion of the tweet.
The annotation process was carried out by two annotators who were Saudi native speakers. To annotate this dataset, the annotators used Ekman’s list of emotion classes (anger, disgust, fear, joy, sadness, and surprise) and the “none” term. If the two annotators disagreed on a tweet, it was flagged and a third annotator decided the final emotion. We found that 89% of the tweets were classified by the two annotators in agreement, whereas 11% of them were classified by the third annotator. Furthermore, 41 of the tweets were classified as “none” and were excluded.
After completing the previous tasks, the dataset contained 5,108 tweets. The number of tweets in each emotion class after the annotation process is illustrated in Tab. 3 and by the bar graph in Fig. 2. The Arabic - Saudi tweet corpus was then clean and ready for the next step: feature extraction and selection.
Table 3: Number of tweets in emotion classes after annotation

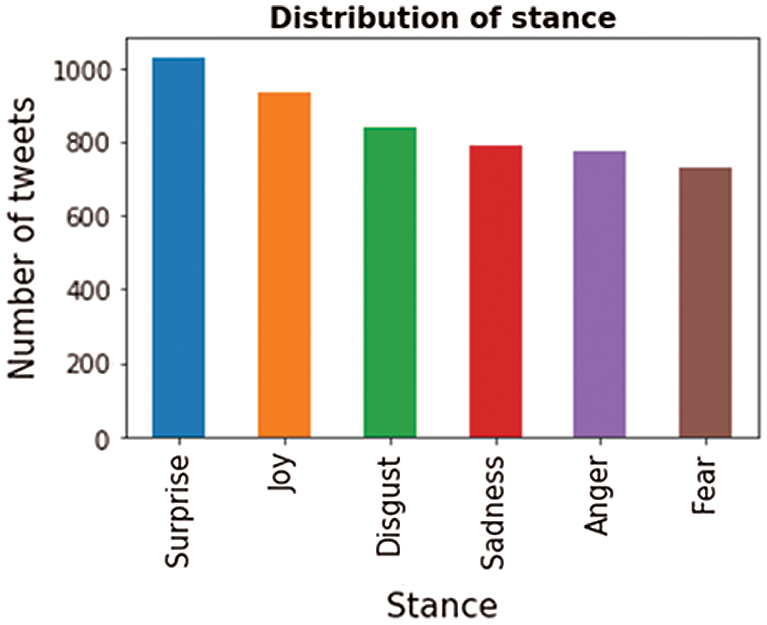
Figure 2: Arabic - Saudi tweet corpus bar chart
3.3 Feature Extraction and Feature Selection
An N-gram model is employed for feature extraction [20]. It considers the tokens as sequences of words with fixed lengths that preserve some ordering to represent the text as a vector of features. The purpose of N-grams is to consider tokens as pairs, triplets, or other combinations. Unigram (1-gram) represents tokens (one word), bigram (2-gram) signifies token pairs, and so on. The statistics of the Saudi tweet corpus are illustrated in Tab. 4.
Table 4: Statistics of Arabic - Saudi tweet corpus

Word frequencies can be calculated in N-grams, and the importance of a word in a document is the term frequency-inverse document frequency (tf-idf). This is a numerical statistic value that describes the importance of a word to a tweet in a corpus (tweets), and it is used as a weighting factor. Its value increases proportionally to the number of times a word appears in a document. When a term frequently appears in tweets that belong to a certain category, the more likely it is to appear in that category. Term frequency refers to the number of times a term appears in a document, whereas inverse document frequency determines how much information the word conveys. The tf-idf algorithm was calculated to generate the feature scores.
Calculating word frequency did not impact the emotion classification process. Therefore, we must reduce these features and select only the significant ones to improve the predictive accuracy. The chi-square statistical (X2) technique was employed in our study to identify the most significant features and remove the others. This technique was chosen for its superiority over other algorithms, such as information gain and MI [21]. The chi-square technique was performed with the Python programming language. When the relevant training dataset was fed into the feature selection algorithm, the chi-square (X2) was calculated for each feature. These features were sorted in incremental order based on the chi-square (X2) scores, and the top-ranking k-features were selected (k is the method parameter that indicates how many features to select).
4 Experimental Setup and Results
The experiments were performed on our Saudi tweet corpus. The aim was to classify tweets into one of the six basic emotion classes: anger, disgust, fear, joy, sadness, and surprise. In the beginning, the classifiers were trained on the labeled dataset; then, the performance of these classifiers was measured and evaluated based on the following metrics: accuracy, precision, recall, and F-measure. The accuracy was prioritized over the other metrics as it was the percentage of tweets that were correctly categorized out of all of the tweets. MNB, SVM, and logistic regression classifiers were employed in our experiments. These classifiers were selected because of their ability to classify texts [22]. Python programming language is used to implement the classification models.
Because the effect of the features in the training model is commonly found in a combination of these features, we started with all of the features and then completed a backward selection. This process allowed us to perform experiments to determine the impact of the features. Each set of features was tested, and the change in the classifier’s performance was observed. First, all the features were ranked and only the most significant features were selected. The rest were removed using chi-square (X2). We tested eight sets of features {all features; 800; 1,200; 2,500; 3,600; 5,000; 7,000; 8,500}. Next, the classification process was evaluated and compared using the percentage split technique, which we used to split the data into 70% training and 30% testing. In all of the experiments, the tf-idf algorithm was employed as the weighting factor. Because the feature space was large, the chi-square technique was used to select the most significant features from the feature set.
4.1 Multinomial Naïve Bayes (MNB) Classifier Experiments
The accuracy results of the MNB classifier, based on the number features used in the classification process, are presented in Tab. 5–7 for unigrams, bigrams, and trigrams, respectively. It is obvious that using the tf-idf weighting algorithm produced better accuracy results in terms of accuracy than using all distinct words (17,278 features) for all of the unigram cases with the MNB classifier. For this classifier, the best accuracy result was 73.32%, which was obtained with a 3,600-feature unigram. Tab. 8. lists the precision, recall, and F-measure results for this model’s best result.
Table 5: MNB classification results for unigrams

Table 6: MNB classification results for bigrams
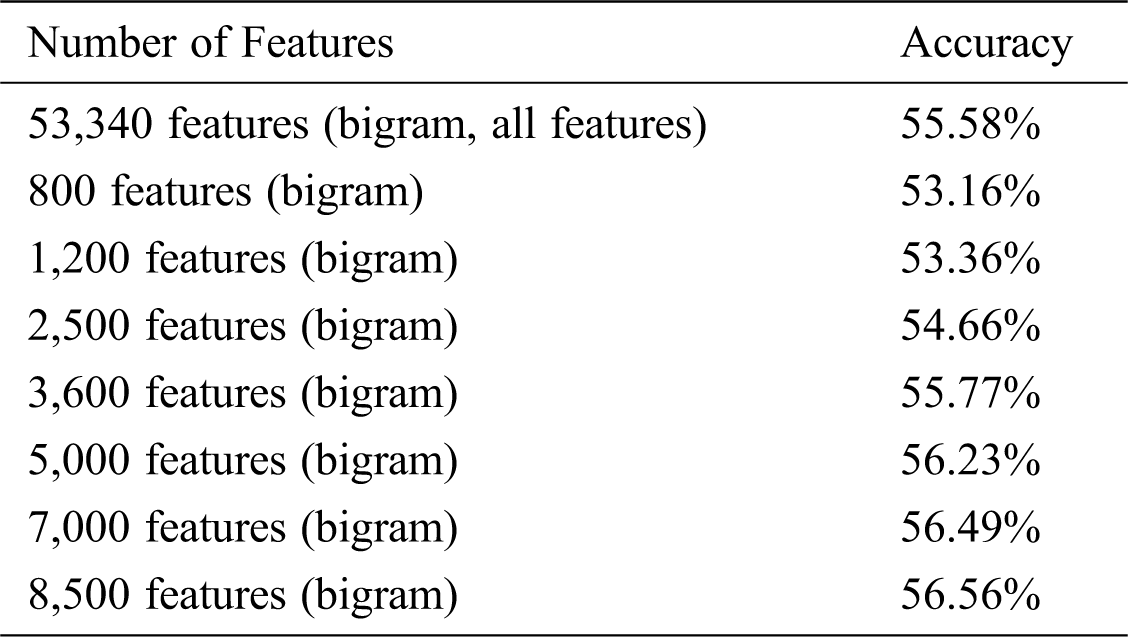
Table 7: MNB classification results for trigrams
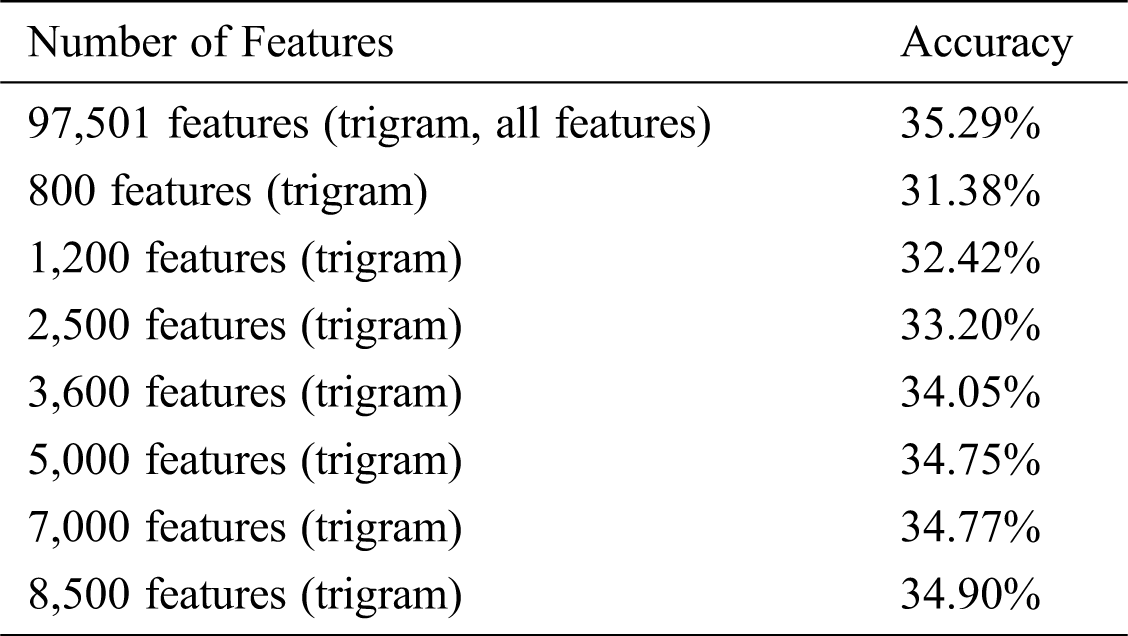
Table 8: MNB results by class (3,600 features, unigram)
4.2 Support Vector Machine (SVM) Classifier Experiments
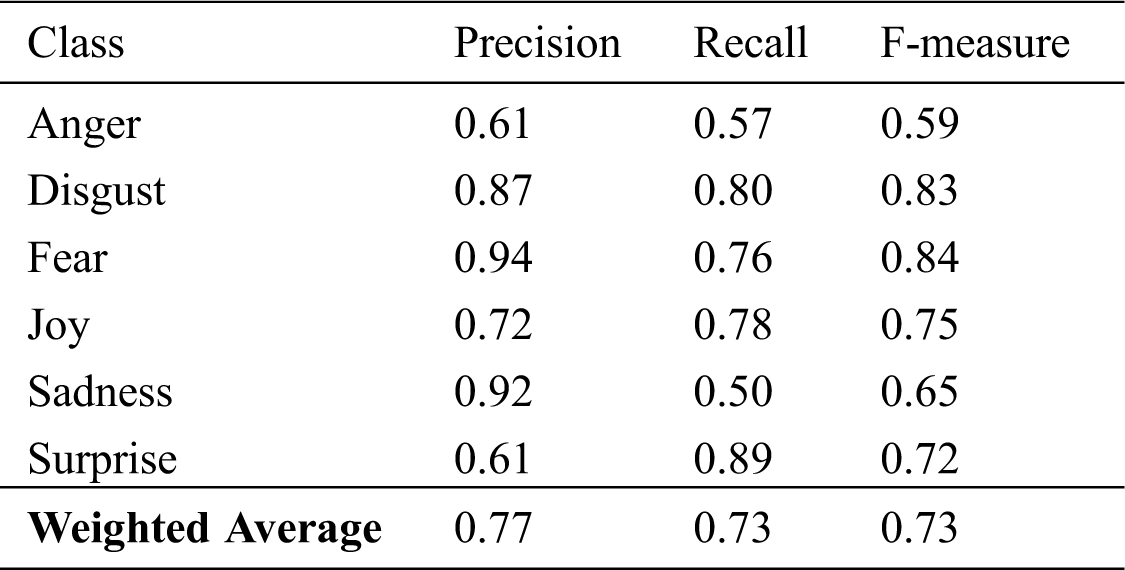
The accuracy values of the SVM classifier are presented in Tab. 9–11 for unigrams, bigrams, and trigrams, respectively. As displayed in the tables, the best accuracy result of the SVM classifier was achieved with a 8,500-feature unigram. The highest accuracy accomplished was 73.39%. Details of other metrics are listed in Tab. 12.
Table 9: SVM classification results for unigrams
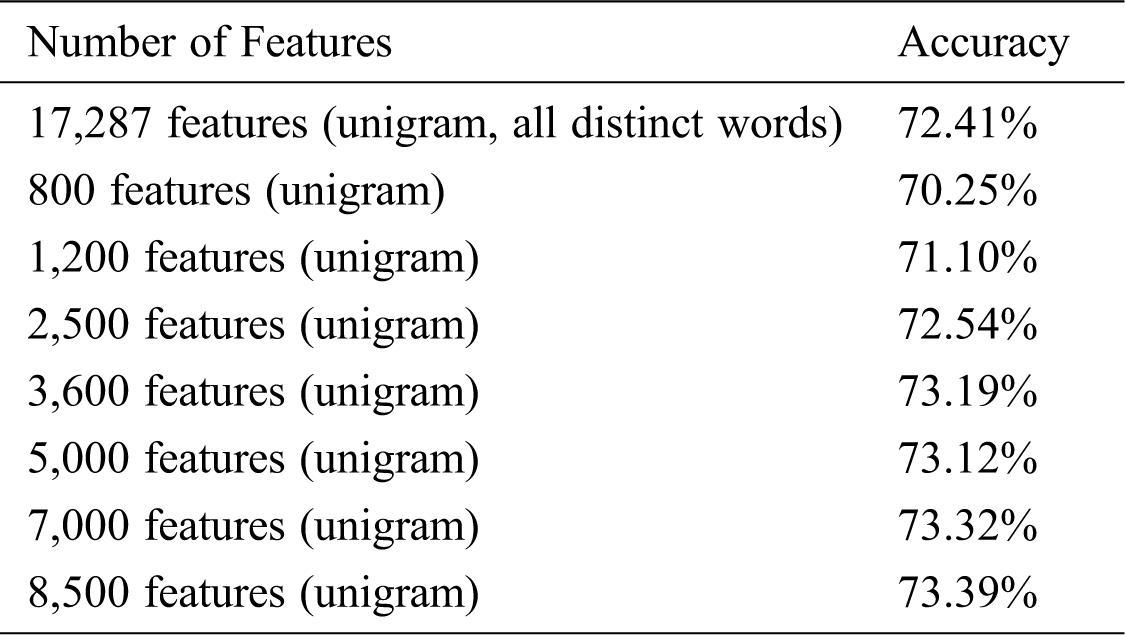
Table 10: SVM classification results for bigrams

Table 11: SVM classification results for trigrams

Table 12: SVM results by class (8,500 features, unigram)

4.3 Logistic Regression Classifier Experiments
The values of the accuracy of the Logistic Regression classifier are displayed in Tabs. 13–15 for unigrams, bigrams, and trigrams respectively. It can be seen that the best accuracy value of 73.39% was obtained with 5,000 and 8,500-feature unigrams. Results of other metrics are shown in Tabs. 16 and 17.
Table 13: Logistic Regression classification results for unigrams
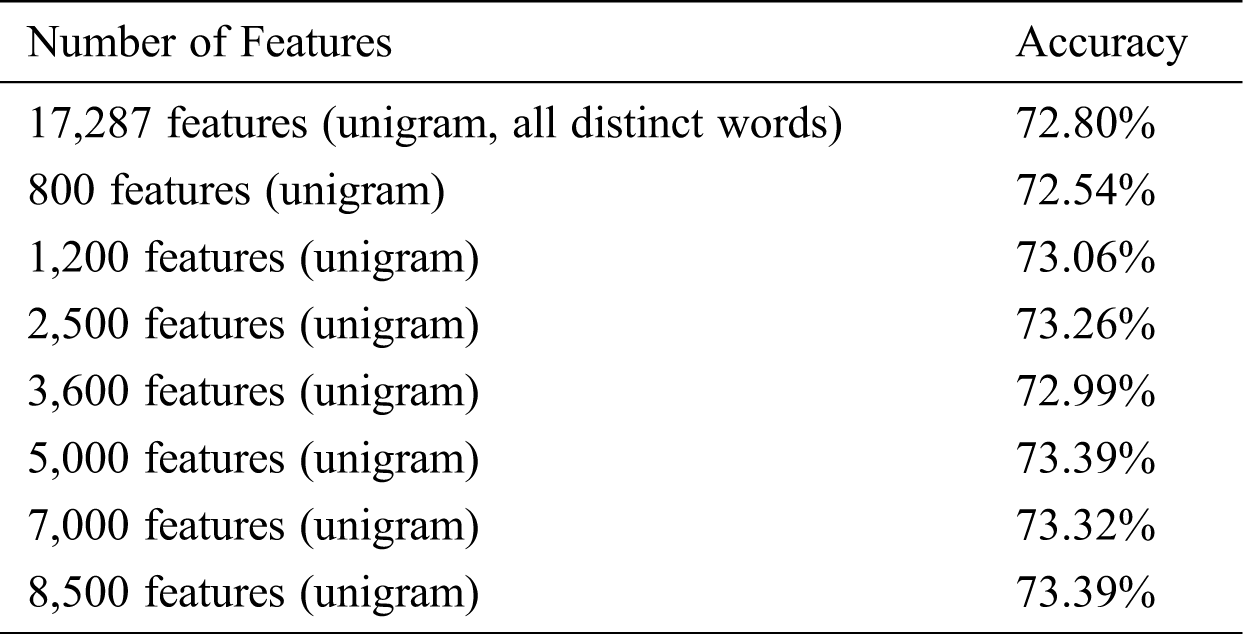
Table 14: Logistic Regression classification results for bigrams
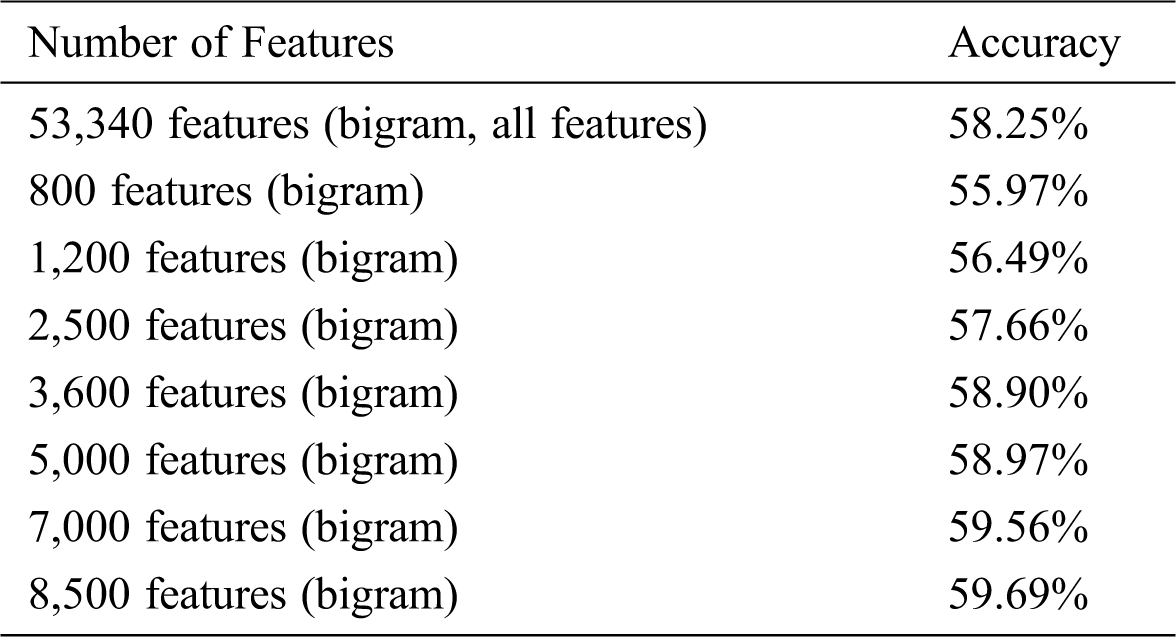
Table 15: Logistic Regression classification results for trigrams
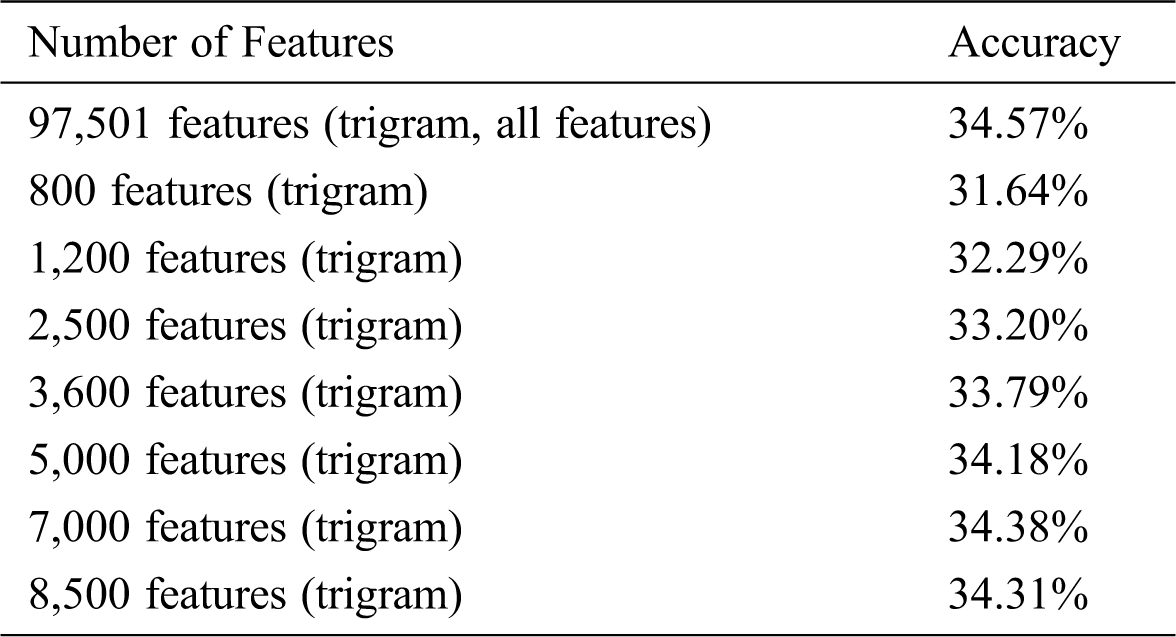
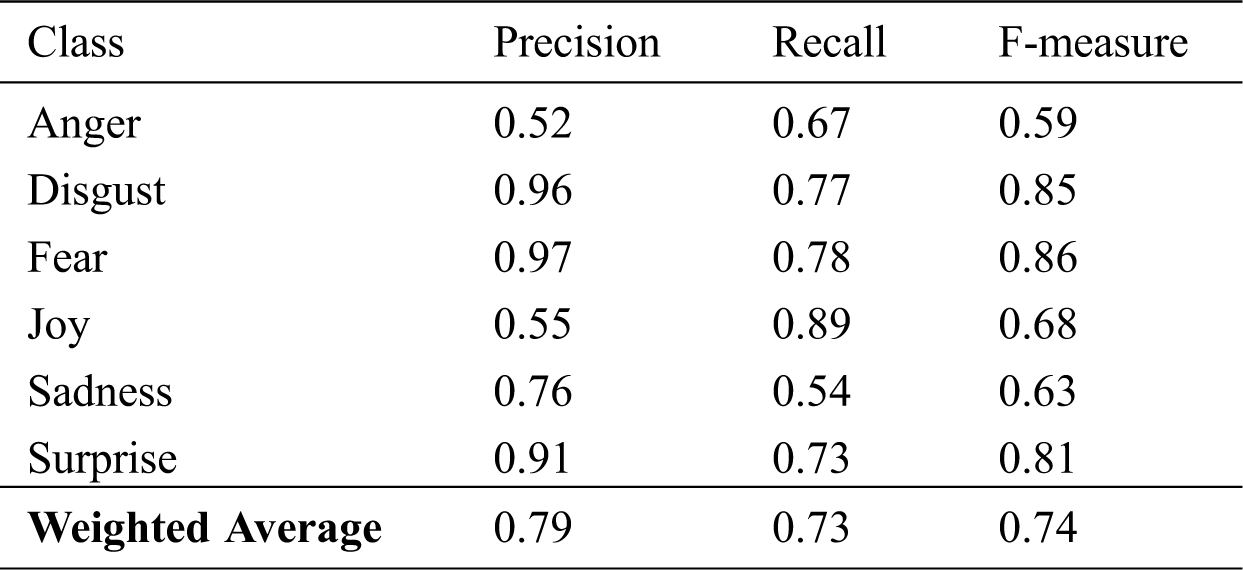
Table 16: Logistic Regression algorithm results by class (5,000 features, unigram)
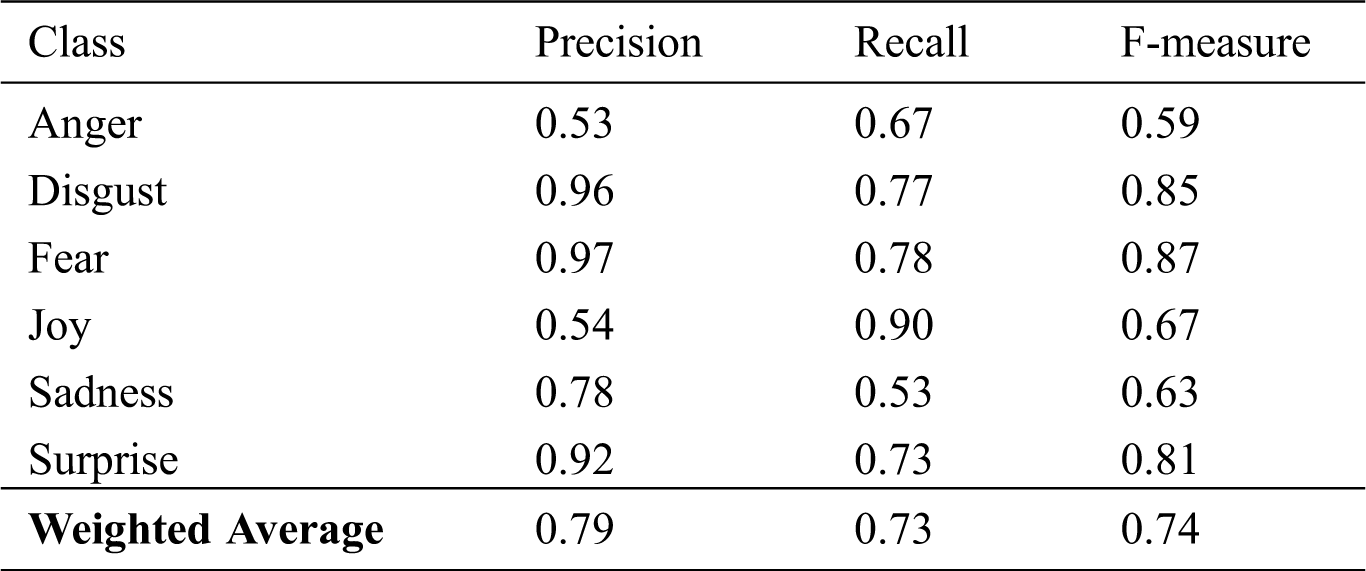
Table 17: Logistic Regression algorithm results by class (8,500 features, unigram)
It is important to notice that, compared with the previous results, the highest accuracy achieved for each classifier was 73.32% for MNB, 73.39% for SVM, and 73.39% for logistic regression. Fig. 3 presents the accuracy of the three proposed classifiers. As illustrated by the bar graph, the logistic regression and SVM classifiers have similar performance and, in terms of accuracy, outperformed the MNB classifier in most cases. They obtained the best accuracies with the 8,500-feature unigram, tf-idf, and chi-square for SVM classifier, and with the 5,000- and 8,500-feature unigram, tf-idf, and chi-square for the logistic regression classifier. 73.39% is regarded as a good accuracy result for emotion classification with six emotion classes [23].
As demonstrated in Tabs. 7, 11, and 15, the unigram outperformed the other N-gram models in all cases in terms of accuracy. Because tweets are short in length, the N-grams become more unique with an increase in N. Therefore, the performance of all classifiers with bigrams and trigrams declined.
Furthermore, the evaluation metrics (precision, recall, and F-measure) for all of the classifiers are presented in Fig. 4. As illustrated in the figure, SVM and logistic regression have higher precision values than MNB, meaning that SVM and logistic regression classifiers can only identify the relevant instances in a dataset better than MNB. The recall value is the same for all the classifiers, indicating that all of them can find all of the relevant instances in a dataset (how many words with emotion were rated as emotional). For the F-measure, SVM and logistic regression have the highest values.
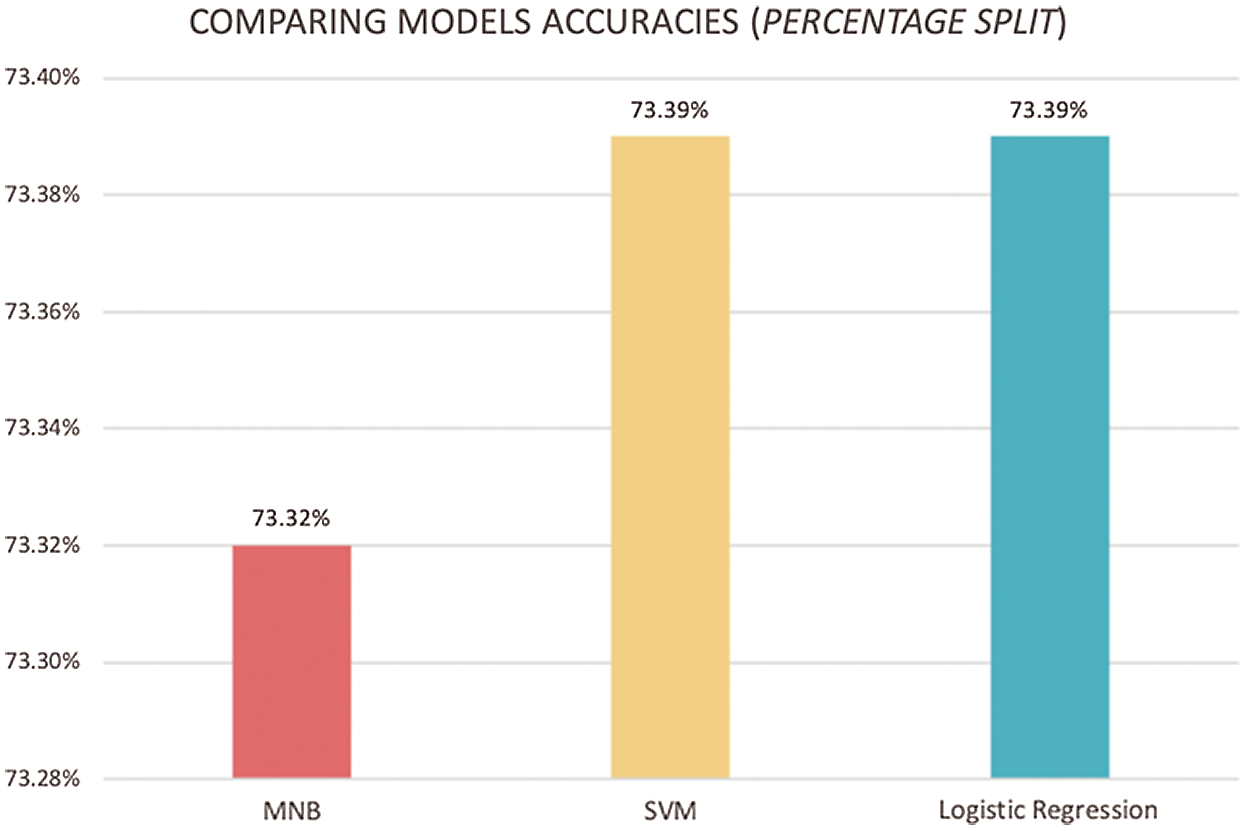
Figure 3: Comparison of classification accuracy of the models
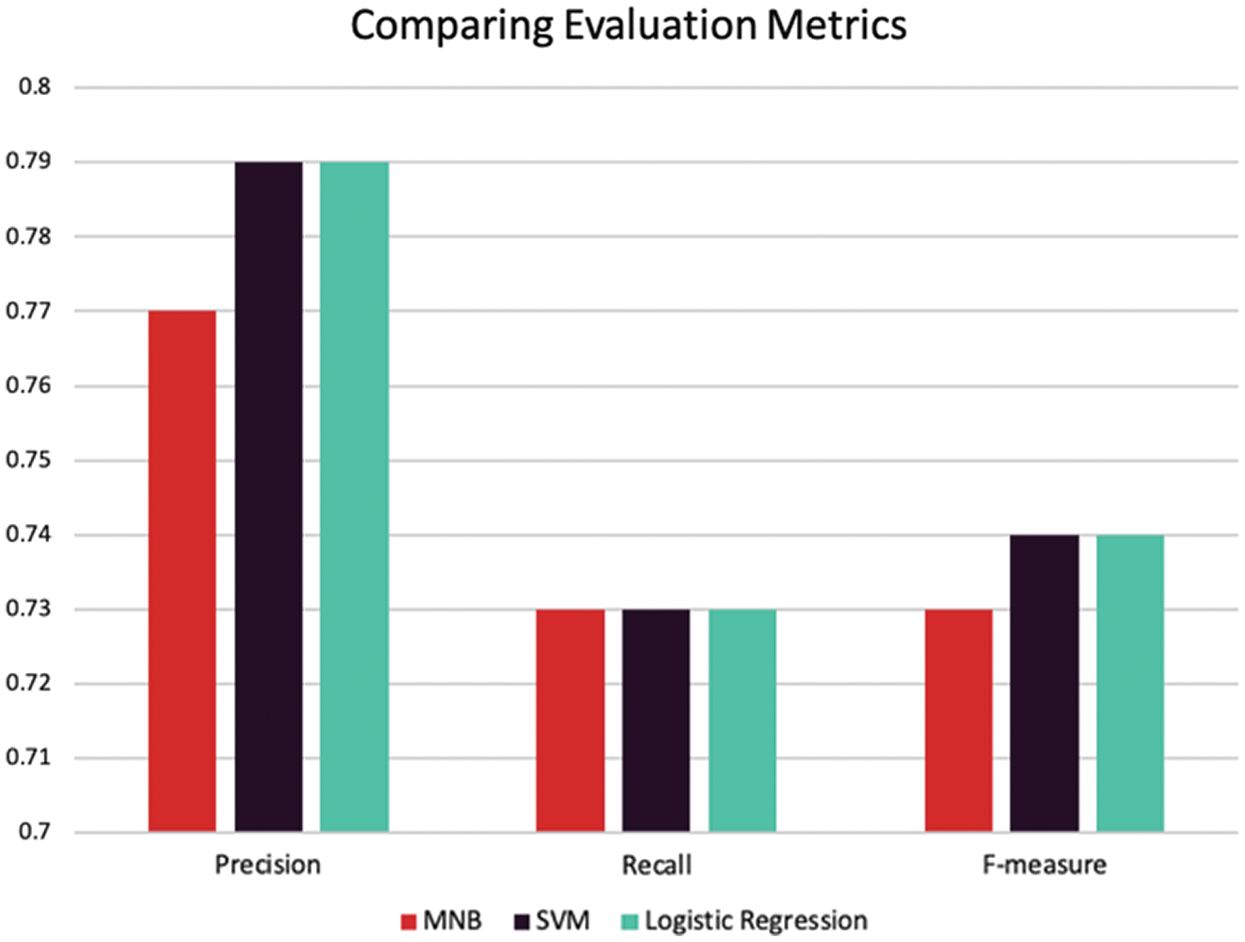
Figure 4: Comparison of the models based on the evaluation metrics
In addition, the feature set that included {800} features led to lower accuracy than when using all of the features. On the other hand, the feature sets that included {1,200; 2,500; 3,600; 5,000; 7,000; and 8,500} increased the classifier performance and enhanced emotion classification in most cases. Fig. 5 shows the highest and lowest performing features for each classifier. It can be observed from Fig. 5 that increasing the number of features did not always lead to an increase in accuracy, as was seen with the MNB classifier. Moreover, the extraction of useful and significant features is a crucial step. The chi-square was proven to obtain the most significant features that best represented the class distinctions. The number of features that should be used depends on the dataset size.
The confusion matrix for the best cases of the SVM and logistic regression classifiers are listed in Tabs. 18–20, respectively. According to the confusion matrix of the SVM classifier in Tab. 18, the highest confusion occurs between the surprise and anger classes; 58 of the surprise class items are labeled as the anger class. There is no confusion between joy and disgust classes, between sadness and fear, or between surprise and fear. Fig. 6 presents more clearly the SVM confusion matrix.
As can be seen from the confusion matrix of Logistic Regression with 5,000 features in Tab. 19, the highest confusion occurs between sadness and joy.78 of the sadness class items were classified as the joy class. It is also be noticed that there is no confusion between fear and surprise, between joy and disgust, or between sadness and fear.
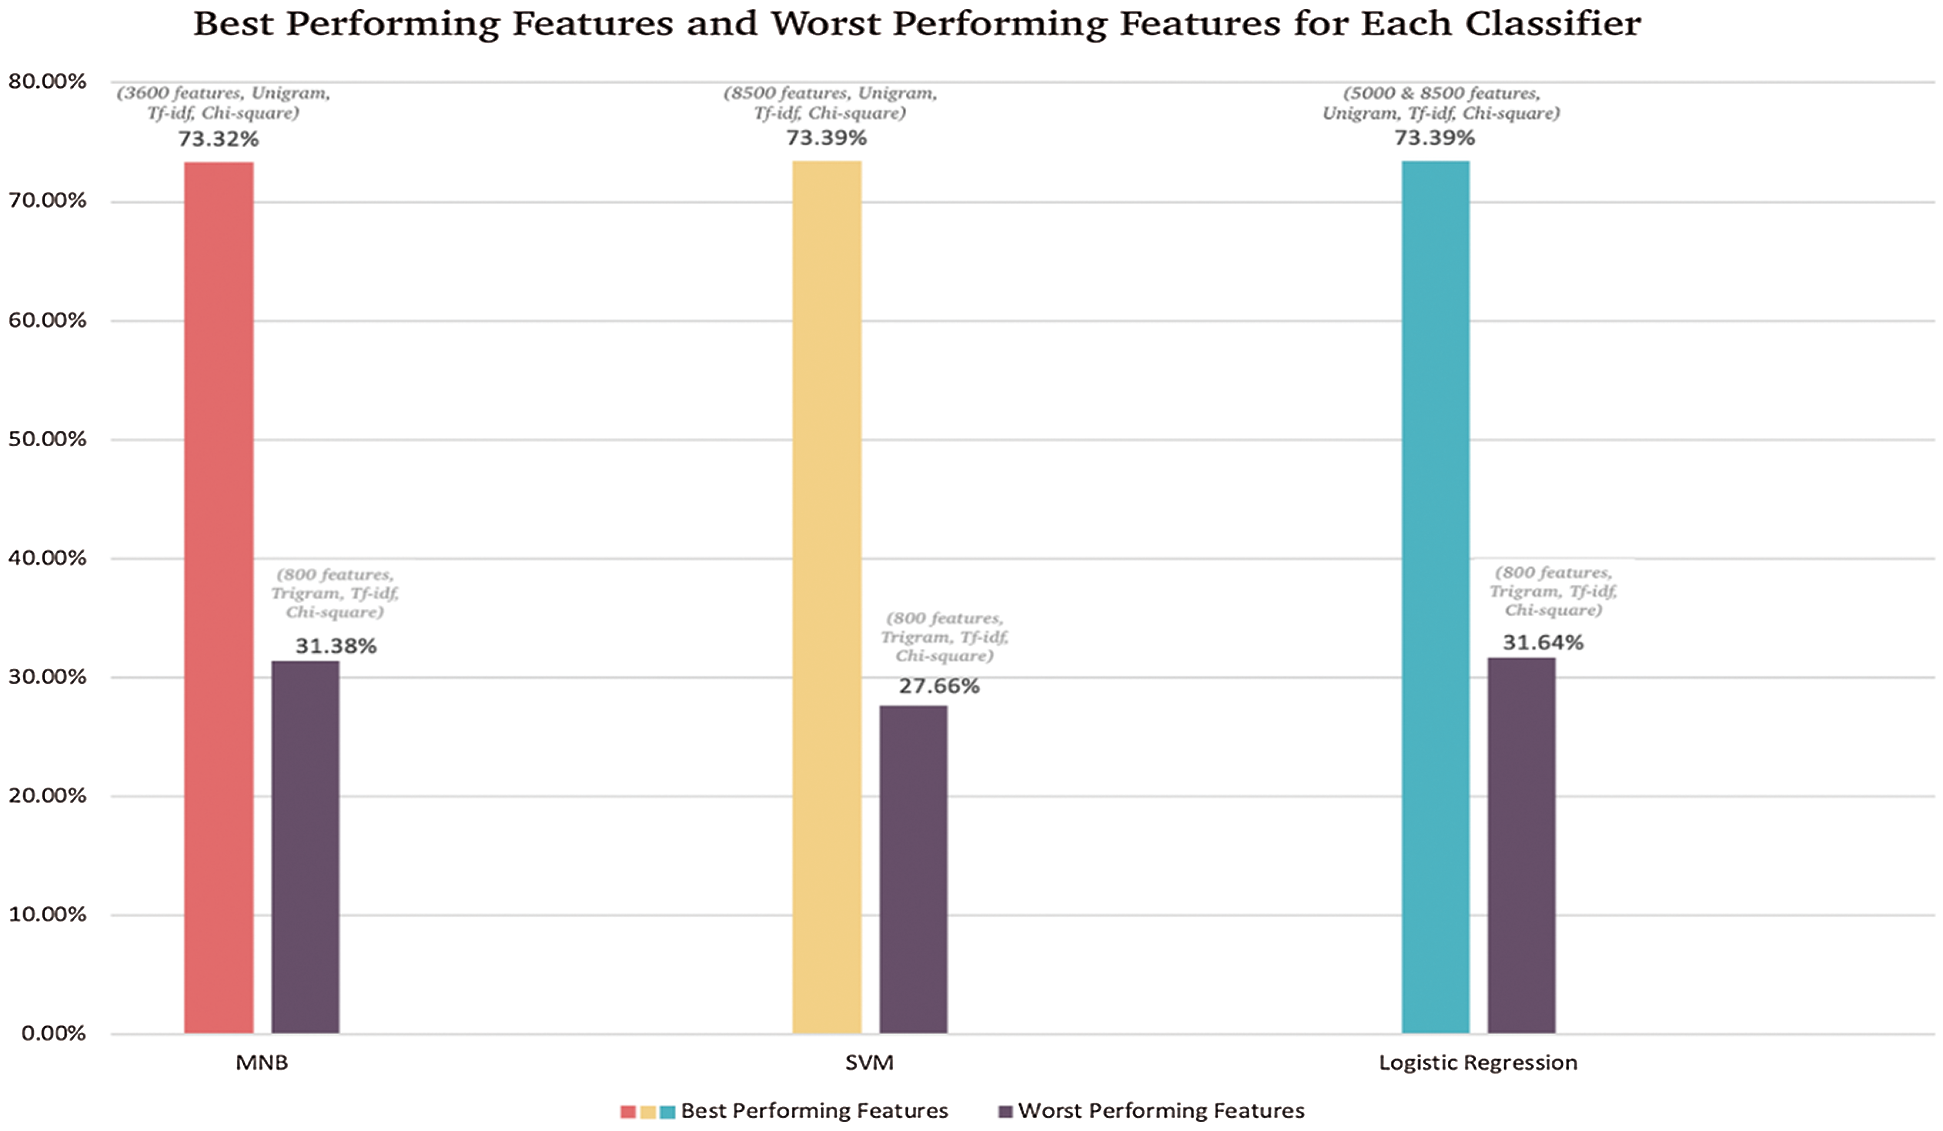
Figure 5: The best and worst performing features for each classifier
Table 18: Confusion matrix of SVM classifier with unigram (tf-idf, chi-square, 8,500 features)
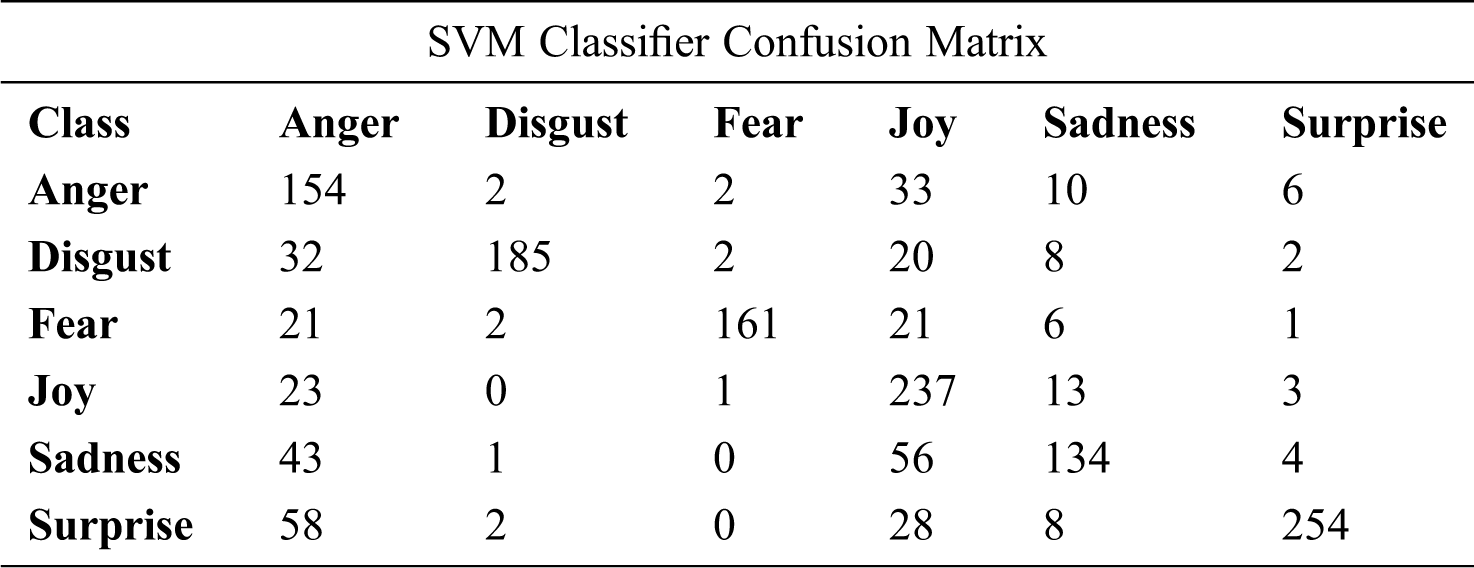
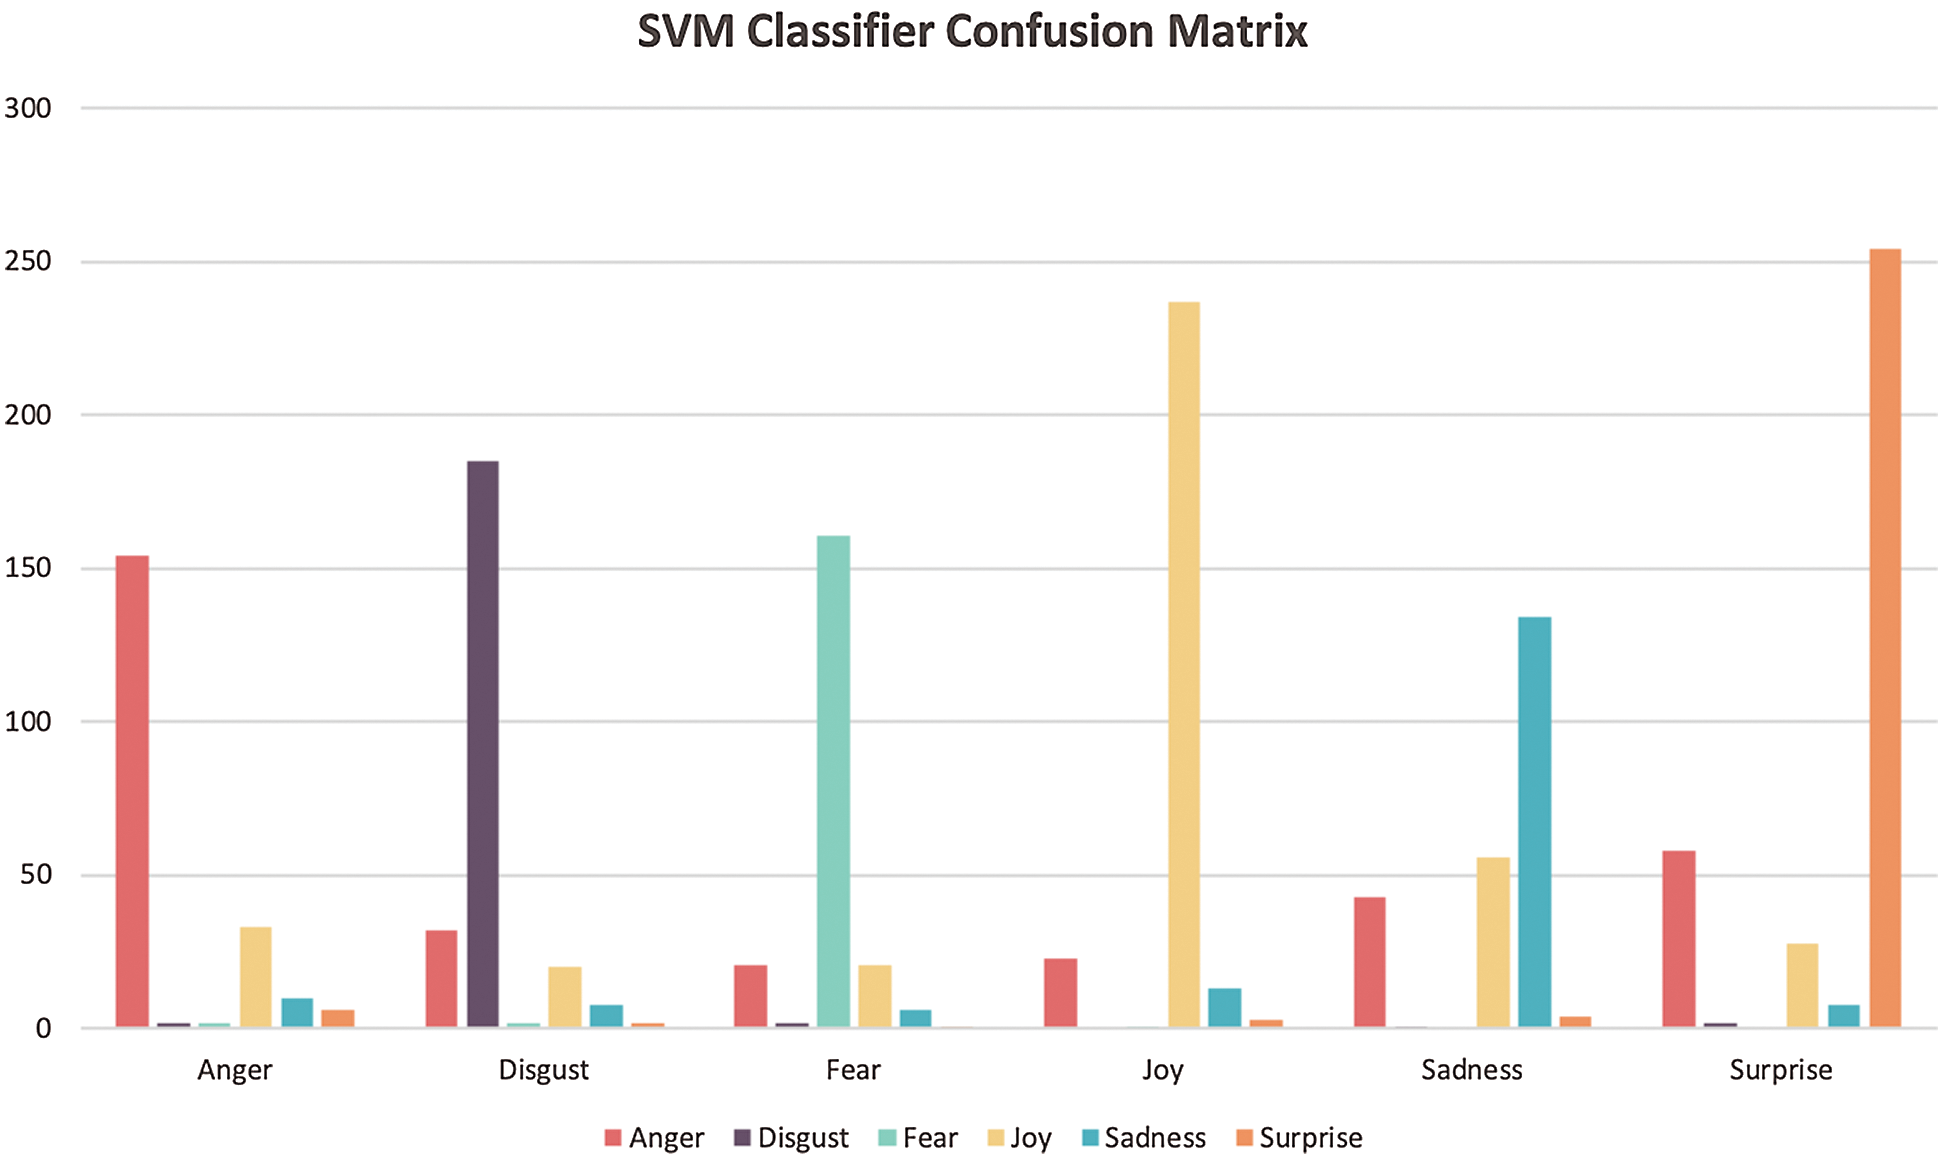
Figure 6: SVM confusion matrix
Table 19: The confusion matrix o Logistic Regression with unigram (tf-idf, chi-square, 5,000 features)

Based on the confusion matrix of Logistic Regression with 8500 features presented in Tab. 20 and Fig. 7, there is no confusion between anger and disgust, between joy and disgust or between sadness and fear. However, 70 of the sadness class items were labeled as the joy class.
Table 20: The confusion matrix of Logistic Regression with unigram (tf-idf, chi-square, 8,500 features)
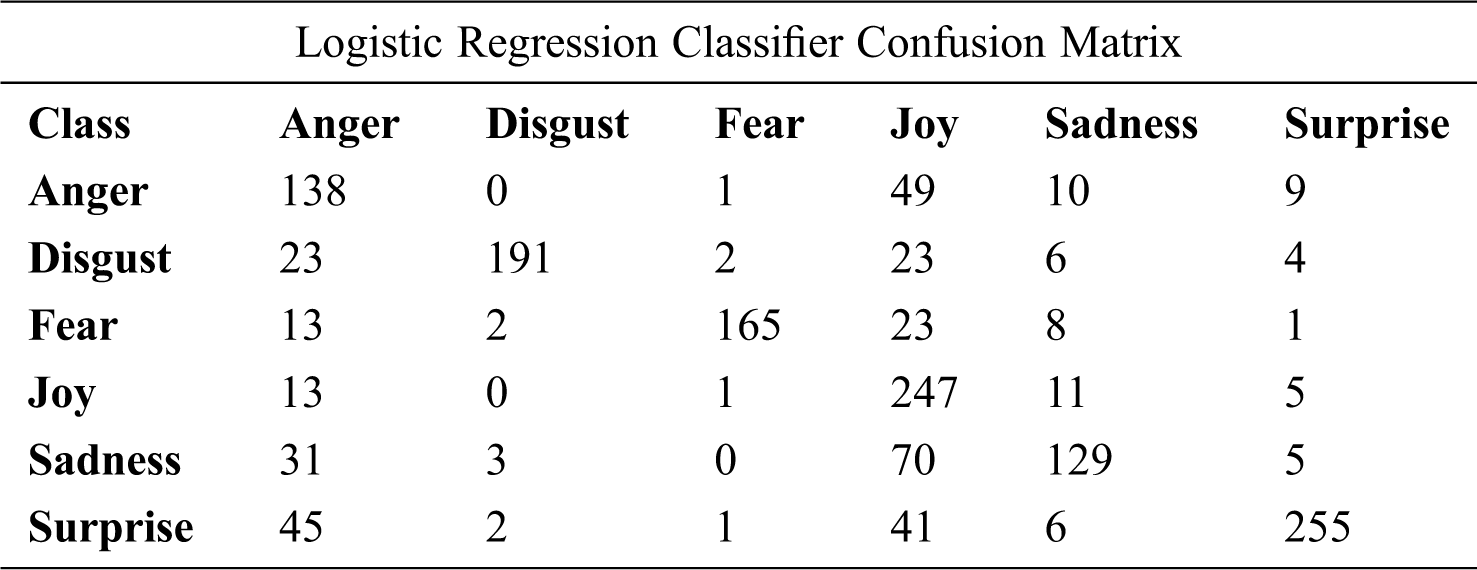
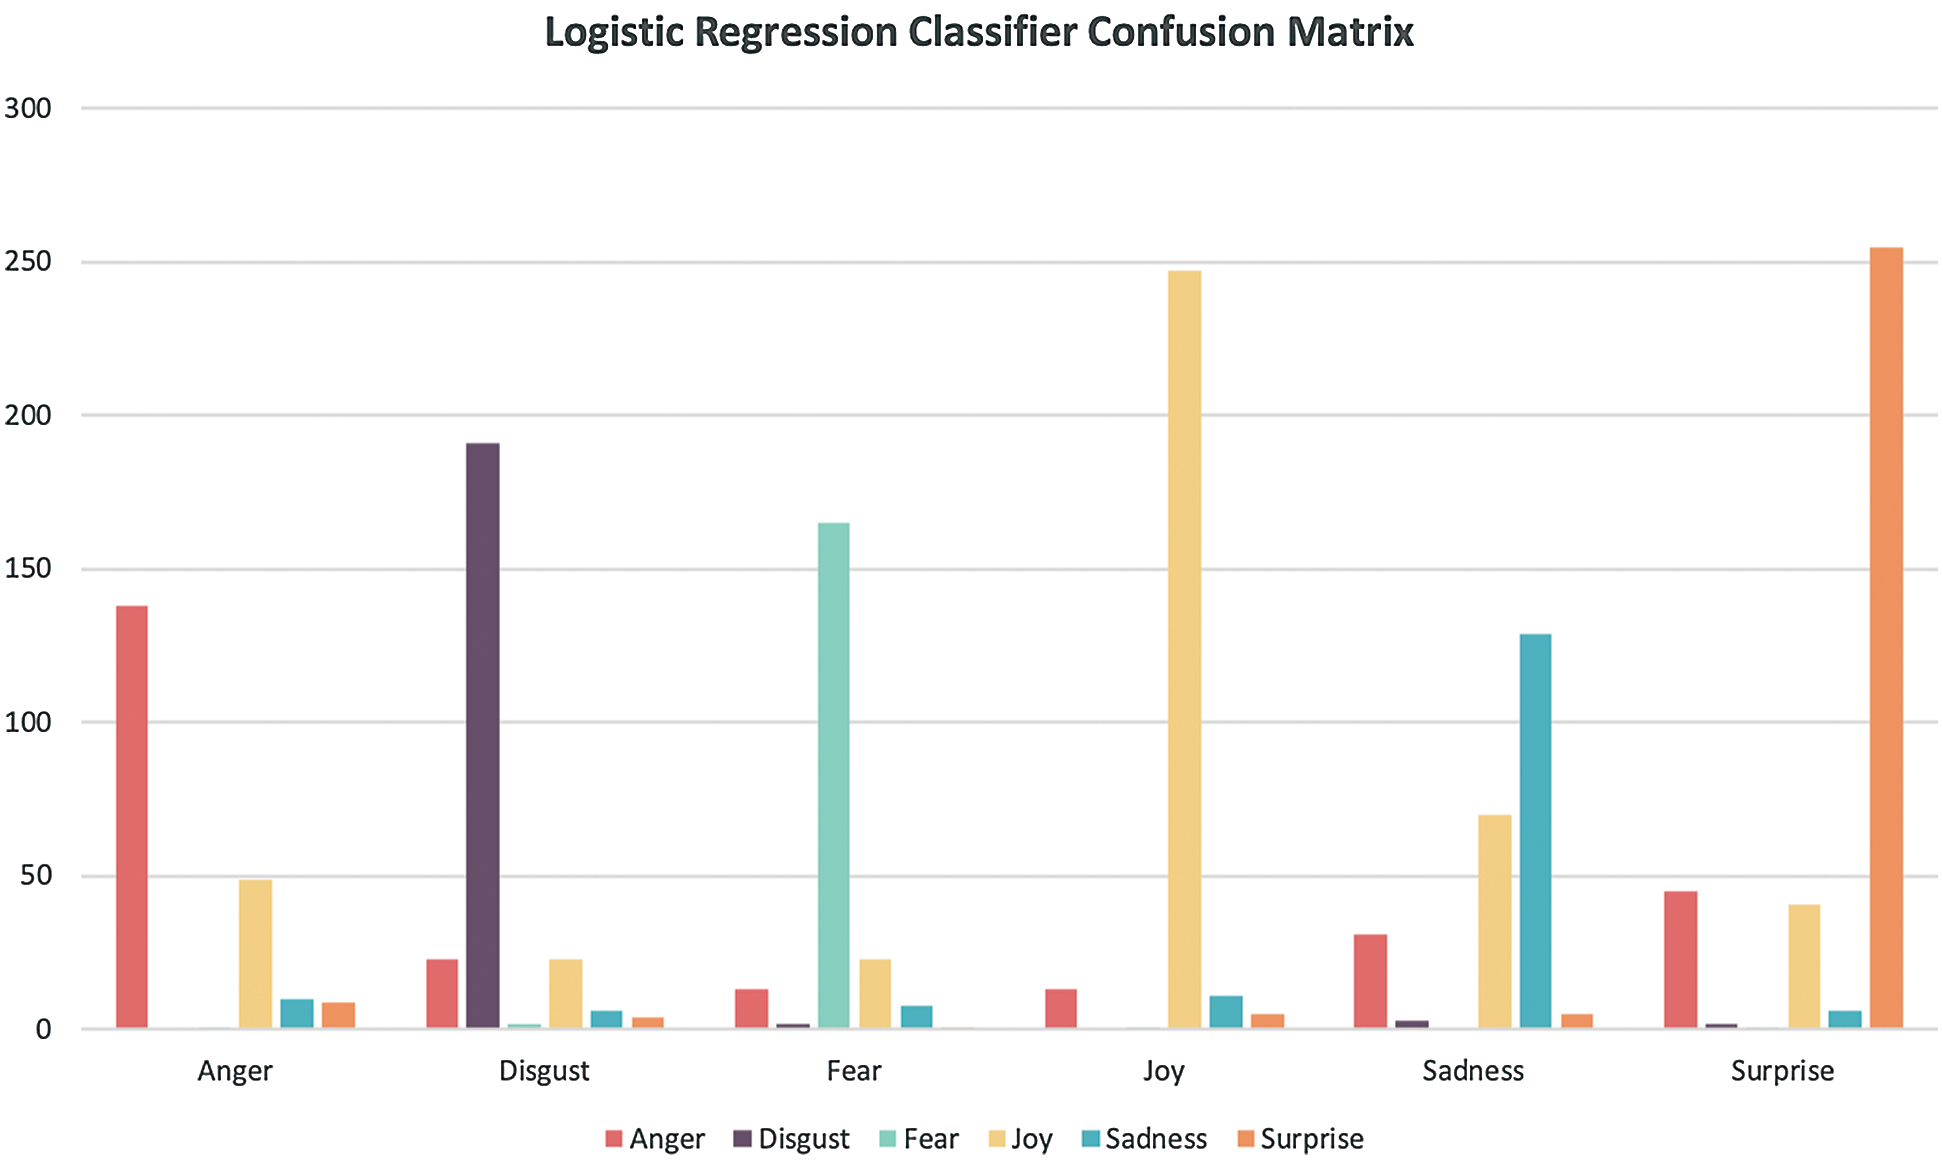
Figure 7: Logistic Regression confusion matrix
The main goal of our study is to develop an efficient and accurate model for analyzing the emotions of Arabic tweets by making it capable of handling the Saudi DA using supervised ML algorithms. In addition, a new dataset of Arabic - Saudi dialect tweets was collected to build our corpus of Saudi dialect tweets. This new dataset is utilized for the emotion classification in this study. Due to the complexity of the Arabic language, a data preprocessing step was required. Different classification methods were employed—MNB, SVM and logistic regression—to classify the Saudi tweets into six emotion classes: anger, disgust, fear, joy, sadness and surprise. Both SVM and logistic regression produced the highest accuracy of 73.39%.
For future work, we would aim to use deep learning with word embeddings since word embeddings can be used as pre-trained vector representations of words and are useful when training any corpus without the need for human annotation. In addition, an enhanced technique for handling repeated characters is needed. Furthermore, we plan to increase the emotion classes and use Plutchik’s wheel of emotions [24], which includes eight emotion classes rather than six. Finally, we would aim to increase the dataset size to contain more diverse data from different dialects, as the current dataset only contains Saudi dialect tweets.
Acknowledgement: The authors would like to acknowledge the Researchers Supporting Project Number (RSP-2020/287), King Saud University, Riyadh, Saudi Arabia for their support in this work.
Funding Statement: The authors received no specific funding for this study.
Conflicts of Interest: The authors declare that they have no conflicts of interest to report regarding the present study.
1. M. Hobley, “Public opinion can play a positive role in policy making,” Date accessed: 05/02/2020. https://www.theguardian.com/public-leaders-network/2012/sep/03/public-opinion-influence-policy. [Google Scholar]
2. What is a microblog, Date accessed: 07/03/2020. https://sproutsocial.com/glossary/microblog/. [Google Scholar]
3. L. Gohil and D. Patel, “Multilabel classification for emotion analysis of multilingual tweets,” International Journal of Innovative Technology and Exploring Engineering (IJITEE), vol. 9, no. 1, pp. 4453–4457, 2019. [Google Scholar]
4. M. D. Robinson, E. R. Watkins and E. Harmon-Jones, “Cognition and emotion: An introduction, ” in Handbook of cognition and emotion, M. D. Robinson, E. R. Watkins, E. Harmen-Jones, New York, NY: Guildford Press, pp. 3–18, 2013. [Google Scholar]
5. R. Romana, I. Tajul and Md. A. Humayan, “Detecting emotion from text and emoticon,” London Journal of Research in Computer Science and Technology, vol. 17, no. 3, pp. 9–13, 2017. [Google Scholar]
6. M. K. Elhadad, K. F. Li and F. Gebali, “Sentiment analysis of Arabic and English tweets,” in Workshops of the Int. Conf. on Advanced Information Networking and Applications, pp. 334–348, 2019. [Google Scholar]
7. M. Al-A'abed and M. Al-Ayyoub, “A lexicon-based approach for emotion analysis of Arabic social media content,” in The Int. Computer Sciences and Informatics Conf. (ICSIC2016. [Google Scholar]
8. M. A. Wani, N. Agarwal, S. Jabin and S. Z. Hussain, “User emotion analysis in conflicting versus non-conflicting regions using online social networks,” Telematics and Informatics, vol. 35, no. 8, pp. 2326–2336, 2018. [Google Scholar]
9. A. F. El Gohary, T. I. Sultan, M. A. Hana and M. M. El Dosoky, “A computational approach for analyzing and detecting emotions in Arabic text,” International Journal of Engineering Research and Applications (IJERA), vol. 3, pp. 100–107, 2013. [Google Scholar]
10. K. Alsmearat, M. Shehab, M. Al-Ayyoub, R. Al-Shalabi and G. Kanaan, “Emotion analysis of Arabic articles and its impact on identifying the author's gender,” in 2015 IEEE/ACS 12th Int. Conf. of Computer Systems and Applications (AICCSApp. 1–6, 2015. [Google Scholar]
11. M. A. Tocoglu and A. Alpkocak, “TREMO: A dataset for emotion analysis in Turkish,” Journal of Information Science, vol. 44, no. 6, pp. 848–860, 2018. [Google Scholar]
12. C. Yang, K. H. Lin and H. H. Chen, “Emotion classification using web blog corpora,” in IEEE/WIC/ACM Int. Conf. on Web Intelligence (WI’07pp. 275–278, 2007. [Google Scholar]
13. B. K. Vo and N. I. Collier, “Twitter emotion analysis in earthquake situations,” International Journal of Computational Linguistics and Applications, vol. 4, no. 1, pp. 159–173, 2013. [Google Scholar]
14. R. C. Balabantaray, M. Mohammad and N. Sharma, “Multi-class twitter emotion classification: A new approach,” International Journal of Applied Information Systems, vol. 4, no. 1, pp. 48–53, 2012. [Google Scholar]
15. U. Nagarsekar, A. Mhapsekar, P. Kulkarni and D. R. Kalbande, “Emotion detection from the SMS of the internet,” in 2013 IEEE Recent Advances in Intelligent Computational Systems (RAICSIEEE, pp. 316–321, 2013. [Google Scholar]
16. S. Chaffar and D. Inkpen, “Using a heterogeneous dataset for emotion analysis in text,” in Canadian Conference on Artificial Intelligence, pp. 62–67, 2011. [Google Scholar]
17. M. Abdul-Mageed and L. Ungar, “EmoNet: Fine-grained emotion detection with gated recurrent neural networks,” in Proc. of the 55th Annual Meeting of the Association for Computational Linguistics, (1: Long Paperspp. 718–728, 2017. [Google Scholar]
18. Q. Bai, Q. Dan, Z. Mu and M. Yang, “A systematic review of emoji: Current research and future perspectives,” Frontiers in Psychology, vol. 10, pp. 117, 2019. [Google Scholar]
19. W. A. Hussien, Y. M. Tashtoush, M. Al-Ayyoub and M. N. Al-Kabi, “Are emoticons good enough to train emotion classifiers of Arabic tweets,” in 2016 7th Int. Conf. on Computer Science and Information Technology (CSITpp. 1–6, 2016. [Google Scholar]
20. H. Xie, J. Li and H. Xue, “A survey of dimensionality reduction techniques based on random projection,” arXiv preprint arXiv: 1706. 04371, 2017. [Google Scholar]
21. C. Largeron, C. Moulin and M. Géry, “Entropy based feature selection for text categorization,” in Proc. of the 2011 ACM Sym. on Applied Computing, SAC ’11, New York, NY, USA, pp. 924–928, 2011. [Google Scholar]
22. J. Hartmann, J. Huppertz, C. Schamp and M. Heitmann, “Comparing automated text classification methods,” International Journal of Research in Marketing, vol. 36, no. 1, pp. 20–38, 2019. [Google Scholar]
23. N. Alswaidan and M. E. B. Menai, “A survey of state-of-the-art approaches for emotion recognition in text,” Knowledge and Information Systems, vol. 62, no. 8, pp. 2937–2987, 2020. [Google Scholar]
24. S. Wang, A. Maoliniyazi, X. Wu and X. Meng, “Emo2Vec: Learning emotional embeddings via multi-emotion category,” ACM Transactions on Internet Technology (TOIT), vol. 20, no. 2, pp. 1–17, 2020. [Google Scholar]
 | This work is licensed under a Creative Commons Attribution 4.0 International License, which permits unrestricted use, distribution, and reproduction in any medium, provided the original work is properly cited. |