DOI:10.32604/iasc.2021.017714
| Intelligent Automation & Soft Computing DOI:10.32604/iasc.2021.017714 | |
| Article |
A Rock-fall Early Warning System Based on Logistic Regression Model
1Department of Computer Science, College of Science, King Khalid University, Muhayil, 63772, Saudi Arabia
2Department of Information System, College of Science, King Khalid University, Muhayil, 63772, Saudi Arabia
3Faculty of Engineering, Department of Electrical Engineering, Dongola University, Dongola, 41129, Sudan
4Department of Management Information System, College of Business, King Khalid University, Abba, 61421, Saudi Arabia
*Corresponding Author: Mohammed Abaker. Email: moadam@kku.edu.sa
Received: 05 February 2021; Accepted: 08 March 2021
Abstract: The rock-fall is a natural hazard that results in many economic damages and human losses annually, and thus proactive policies to prevent rock-fall hazard are needed. Such policies require predicting the rock-fall occurrence and deciding to alert the road users at the appropriate time. Thus, this study develops a rock-fall early warning system based on logistic regression model. In this system, the logistic regression model is used to predict the rock-fall occurrence. The decision-making algorithm is used to classify the hazard levels and delivers early warning action. This study adopts two criteria to evaluate the system predictive performance, including overall prediction accuracy measures based on a confusion matrix and the area under a receiver operating characteristic curve (AUC). The results show that the correct prediction accuracy was approximately 79.9%, and the area under the curve (AUC) was 0.85 during the model training. During the validation process, the overall accuracy is 81.0%, and (AUC) is 0.90. The result indicates that this system has high predictive power, strong robustness, and stable performance. That confirms the usefulness of a logistic regression model for predicting a rock-fall occurrence probability.
Keywords: Logistic regression; rock-fall; prediction; early warning system
Rock-falls are among the most important natural hazards described as rocks detached from a steep slope and fall because of many external stimuli triggers, such as intense rainfall and hydrological reasons [1]. This phenomenon is a critical hazard in mountainous areas of the Kingdom of Saudi Arabia [2,3]. It occurs widely in regions with steep terrain and threatens road safety by damage and disruption in transportation roads that pass through such corridors. Several approaches have been made to reduce the rock-fall hazard through detection or to monitor the rock-fall event. The seismic sensor was used to detect the rock-fall events by monitoring the seismic signals caused by falling rocks [4,5]. However, these techniques unable to locate the fall. Furthermore, (Terrestrial Laser Scanner) has been used to detect changes occurring on the surface and detect individual rock events [6]. Besides [7], proposed a semiautomatic method, in which three-dimensional terrain was reconstructed to obtain the geometry of the unstable rocks and define the location of rock-fall source areas. A few camera-based rock-fall monitoring techniques were found in the literature. The camera has outperformed many technologies, even the (Terrestrial Laser Scanner), regarding its ability to track multiple rocks in real-time. In Fantini et al. [8], an artificial Intelligence Camera Prototype was used for monitoring and track the fallen rocks in real-time. Most of the above methods cannot predict the rock-fall event before it occurred. Hence these methods respond after the (rock-fall occurrence) caused harm on the roads. Additional factors increase the risk, such as the high falling speed and slow response of the vehicle’s driver. The rock-falls may not be stopped or controlled; however, its risk can be reduced by building a decision assistance system to predict possible rock-falls or classifying rock-falls prone areas for planning and management. Therefore, the prediction of rock-fall is required to put proactive policies to prevent or mitigate rock-fall. Recently, with the rapid development of machine learning technology, the application of logistic regression in predicting the rock-fall hazard has drawn much attention. Little studies were done on rock-fall susceptibility mapping based on logistic regression technology [9,10]. Susceptibility maps are useful in assisting planners and engineers in estimating and managing rock-falls later. The existing rock-fall susceptibility map methods are inefficient in preventing or mitigating the rock-fall events in real-time because of the susceptibility map generated from the historical data concerning a specific site. To our knowledge, no study has proposed an intelligent safety system able to reduce the falling rock’s risk in real-time by informing road users.
Therefore, this study aims to develop an intelligent early warning system based logistic regression model that guarantees to overcome the limitations of existing technologies and make the roads safer. The warning system predicts rock-fall events and provides an early warning to prevent the rock-fall risk. This system integrates prediction-model, sensors, and the decision-making algorithm. This study’s importance and originality contribute to research on transportation safety by providing a scalable open system platform.
The paper’s remaining part is organized as follows: Section 2 presents the methodology strategy used to develop and validate the (Intelligent Warning System). Section 3 illustrates the (logistic regression model) development and validation. Section 4 discusses the results and concludes this paper.
This section describes the methodology strategy used to develop and validate the (A Rock-fall Early Warning System). In addition to the hardware and software used in system implementation.
This section describes the methodology strategy used to develop and validate the (Early Warning System). The approach applied was completed in four steps Fig. 1. First, rock-fall incident data were collected and prepared for the analysis and variables selection phase. Then, the (logistic regression process) was used to model the impact of independent variables (rock-fall influencing factors) on the dependent variable (occurrence of rock-fall). Next, the model validated by the receiver operating characteristic ROC curve and its overall performance evaluated. The model was developed and evaluated using SPSS V.22 software. After, the decision-making algorithm was developed. Finally, the intelligent warning system platform was assembled.

Figure 1: Methodological flowchart used in this study
2.2 Data Collection and Preparation
The rock-fall historical data are a crucial factor in predict future incidents. Two of the most sites affected by rock-fall accidents were detected and accepted as a study area in this study. Two methods were used to define the rock-fall locations, such as inventory reports and field surveys. The historical data of landslides and its associated weather information databases were obtained from three sources: (Geological Hazards Research Center), (KSA Civil Defense) and (General Authority of Meteorology and Environmental Protection). A total of 75 rock-fall accidents were reported from January 2015 to December 2018, and for each rock-fall accident, stored the date of occurrence, location, and weather data. In order to insert a non-rock-fall case in the data set, the time duration was divided into 192 equal samples period. Then, the value one assigned to the samples period in which rocks occurred; otherwise, assigned zero.
For analysis purposes, the rock-fall inventory data randomly split into two separate subsets: A training data set 65% (134 samples with 54 rock-falls), and a testing data set 35% (58 samples with 21 rock-falls). The training data set was used for generating rock-fall models, and the testing data set was used for the model validation. Four variables were extracted during analyzing the inventory data, one dependent variable (event of rock-fall), and three independent variables (Rainfall-rate, temperature-variation, and slope-angle). Three influencing factors were considered in analyzing rock-fall occurrence based on the available data and literature review [11,12]. These factors include weather factors (Rainfall-rate, Temperature-variations), and spatial factor (slope-angle). The Rainfall-rate is a significant triggering factor of rock-fall [13]. Due to the geological formation of mountains in the study area, which consists of debris layers, boulders, and small rocks, the intense rainfalls moving debris layers, and leading to rock displacement and falling. The temperature variations have a direct effect on the stability of the rocks. The cyclical changes in temperature cause expansion and contract in rock surfaces, which leads to deformation or cracks of the rocks [14]. The slope angle has a direct effect on rock-fall susceptibility. The larger the slope angle, the less stable the rocks [15].
2.3 Rock-fall Prediction Model Development
2.3.1 Logistic Regression Model
In developing the prediction model, logistic regression was used. The logistic regression is a statistical analysis method useful for predicting the presence or absence of outcome based on predictor variables’ values. The advantage of logistic regression is that the variables can be continuous or discrete, or any combination of both types, and the data does not demand a normal distribution [16]. In this study, a rock-fall event was used as a dependent variable (binary) representing the event occurring or not occurring of rock-fall by values of 0 and 1. The logistic regression technique yields coefficients for each independent variable based on data derived from samples taken from the training dataset of 134 samples (65% of rock-fall inventory). These coefficients serve as weights in a mathematical function, which can be used in the decision-making algorithm to generate a probability of rock-fall occurrence and its risk level. The logistic regression function that defines the probability of rock-fall occurrence expressed as follows in Eq. (1).
where p(x) is the probability of rock-fall occurrence, β0 is a constant representing the intercept of model, βi (i = 1, 2, …., n) represents the coefficients of the model, and xi (i = 1, 2, …, n) are the independent variables. The constant β0 and the coefficients βi computed using maximum likelihood estimation [17]. The computation was performed based on the values of the independent variables and the condition of the dependent variable.
2.3.2 Logistic Regression Model Validation Technique
The model efficiency upon predicting rock-fall events was verified using 35% of the rock-fall inventory data. In this study, two validation methods were used, the area under a receiver operating characteristic (ROC) curve (AUC), and overall prediction performance measures based on a confusion matrix. The area under the ROC curve (AUC) was used to determine the models’ ability to correctly predict the rock-fall occurrence. The resulting ROC analysis is a graphical curve represents the relationship between sensitivity and specificity [18]. The area under the ROC curve (AUC) summarized the curve’s information, it used to identify the model performance, and its value is between 0 and 1.0 [19].
The decision-making algorithm was developed to compute the occurrence probability of rock-fall, classifying the hazard level, and generating a warning action. The following steps show how the presented algorithm determines a rock-fall hazard level and to takes the appropriate decision.

2.5 Early Warning System Implementation
Fig. 2 shows a block diagram of the proposed system. It describes the hardware elements relations and their functionality. The center part of this graph shows a minicomputer (Raspberry Pi v3) used for performs system computations. This single-board computer equipped with USB ports, digital ports, and analog ports allows sensors and other devices to be connected.
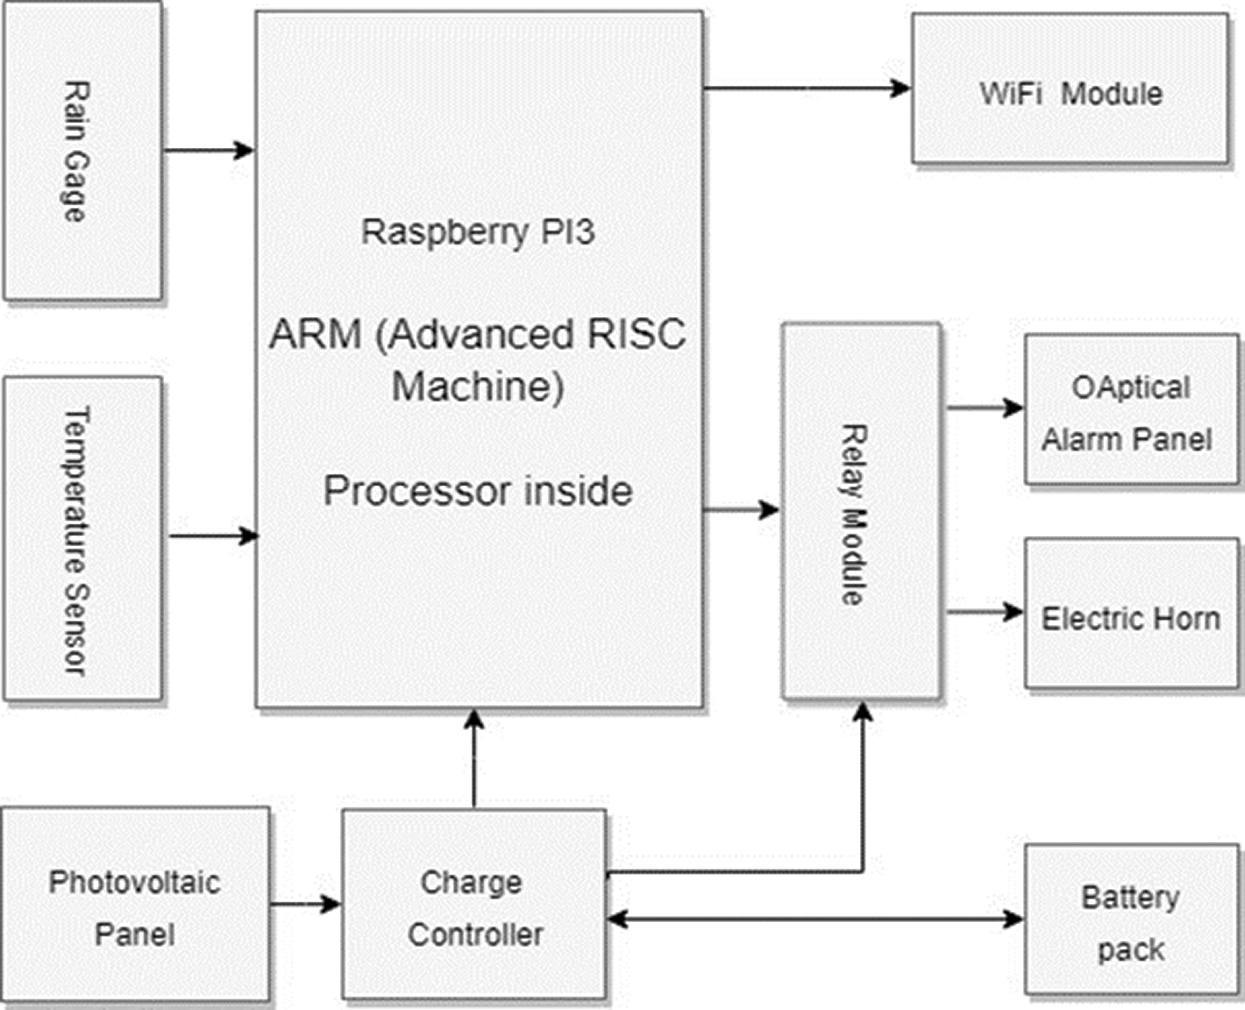
Figure 2: Proposed system block diagram
This diagram’s left part shows a temperature sensor and rain gage. The temperature sensor is used to collect the surrounding air temperature every two seconds (0.5 Hz sampling rate) and spits out a digital signal. The rain gage is tipping-bucket rain gauges used to measure the instantaneous rainfall with a resolution of 0.1 mm per tip, and one bucket tips generate one electronic signal (pulse).
Its right part consists of four devices: light alarm panel, relay module, electric horn, and WIFI module. The (light alarm panel) is a 24 × 24 cm frame contains a high light intensity RGB LED matrix. This panel displays the hazard light alarm in three different colors (green, yellow, and red) when each color depends on the specific hazard level. The relay module consists of an on-board photoelectric coupler with photoelectric isolating anti-interference ability. It assists the (Raspberry Pi) to drive the electric horn and optical panel through general-purpose input/output (GPIO) pins.
The bottom part of this graph shows the power system used to ensure electrical power delivery throughout the day; it consists of three parts, a photovoltaic panel, a battery pack, and an intelligent solar charge controller. The photovoltaic panel converts photo power into electrical energy. The battery pack is a back-up power supply for the system during hours of darkness. The intelligent solar charge controller used to supply the system and recharge the battery.
Raspbian Stretch (GNU/Linux 9.1) was used as the operating system. The main program consisted of Python (version3.5) scripts it compiled on-board with dedicated compilers (Python Multiprocessing Module) was used to improving system response and computation performance. This module utilizes the four cores of the (ARM Processor) to work in parallel. The statistical analysis was performed using SPSS software (version 22).
2.6 Early Warning System Platform Installation
The warning system platform is (stand-alone solar-powered) installed in a vertical metal-stand with a height of 240 cm carries the main system case, light alarm panel, photovoltaic panel, and rain gage (Fig. 3).

Figure 3: Early warning system platform
2.7 Overall System Performance Evaluation
In this study, the system capability in distinguishes between falling occurrence and nun occurrence was evaluated by overall system performance (sensitivity, specificity, and accuracy). The confusion matrix was used to calculate overall system performance [20]. The first measure is Sensitivity. It reflects the model’s ability to predict the rock-fall event correctly, which calculated as:
The second measure is Specificity, was used to calculate the system’s ability to confirm the absence of a rock-fall event, which defined as
The third measure is accuracy, which reflects the accuracy of the system in detecting the rock-fall event, and defined as:
Where true positive (TP) (means all events were truly detected), false negative (FN) ( means some events were occur , but not detected), true negative (TN) ( means events were absent, and the system reports absent event), and false positive (FP) (event absent, system reports as present).
3.1 Logistic Regression Model Development
During the development of a logistic regression model, SPSS V.22 software was used to establish the rock-fall occurrence to rock-fall influencing factors relationships. The result is the model parameters and their significant probability (Tab. 1).
Table 1: Parameters of the logistic regression model

From the data in Tab. 1, it is apparent that the standard error (Std-Error) values were less than 0.5, which were considered low, and therefore show how close the predictions are to the eventual outcomes. Another parameter that appeared in Tab. 1 is the significance probability. This parameter confirms the independent variables that have a significant influence on a rock-fall. If the significant probability is less than 0.05, that means the independent variable is statistically significant in rock-fall [21]. Results indicated that slope-angle, rainfall-rate, and temperature-variation with the significant probability values in a range of (0.010 to 0.030), were statistically influence on rock-fall occurrence. Thus, the three independent variables (slope-angle, rainfall-rate, and temperature-variation) were included in the model. The logistic regression model was constructed based on the three useful independent variables and their parameters. After adding variables to the model, the result is present as follows:
where p(x) = probability of rock-fall occurrence
x1 = slope- angle (degree) (range 20–60)
x2 = rainfall rate (mmh-1) (range 0–46)
x3 = temperature-variation (°C) (range 0–21)
The probability of rock-fall occurrence was calculated using the above logistic regression coefficients, its value ranges from (0.014) to (0.951).
The rock-fall hazard Levels were obtained by quantifying the (rock-fall occurrence probabilities) into three individual hazard Levels. These Levels were derived based on probabilities of rock-fall occurrence histogram (as shown in Fig. 4). The histogram’s left side, which is specified by the range from 0.0 to 0.4, contains only 12.9% of rock-fall cases, is classified as (low hazard level). The histogram medium, specified by the range from 0.4 to 0.7, contains 26% of rock-fall cases, classified as (medium hazard level). The histogram’s right side, specified by the range from 0.7 to 1.0, contains 61% of rock-fall cases and is classified as (high hazard level). The results were listed in Tab. 2.

Figure 4: Histogram of the rock-fall occurrence probability
Table 2: The three Hazard (level) of the rock-fall

3.3 Logistic Regression Model Validation
Validation of the (logistic regression model) has considered the most crucial task in determining the model efficiency upon predicting rock-fall events. There are many possibilities to validate this model. In this research, we used two validation methods, the area under a receiver operating characteristic (ROC) curve (AUC) and overall prediction performance measures based on a confusion matrix.
3.3.1 Receiver Operating Characteristic (ROC) Curve
The area under the ROC curve (AUC) was used to assess the model’s ability to predict the rock-fall occurrence correctly. Two data sets (training and validation data set) were separately analyzed to confirm the model’s validity toward all available data. The results were plotted in two ROC curves (see Figs. 5 and 6).

Figure 5: The ROC curve (for training data set)

Figure 6: The ROC curve (for validation data set)
For the training and validation data set, their AUC values are 0.853 and 0.903, respectively (Tab. 3). It indicates that the model under both data sets has high prediction capabilities. Therefore, the computed logistic regression model is representative of rock-fall activity with high certainty. The statistical significance value (0.000) means no significant difference between the predicted and observed value.
Table 3: All cases of the (AUC)

For more model validation, the areas under the ROC curves (AUC) individually recalculated for the three variables (slope-angle, rainfall-rate, and temperature-variation) see Fig. 7. The obtained values were (0.802), (0.815), and (0.635) respectively (Tab. 3). Accordingly, all variables were effective.

Figure 7: The ROC curve (for the three variables)
3.3.2 Overall System Performance Evaluation
Tab. 4 shows the resulting confusion matrix created for both the training and testing. The confusion matrix was used to calculate sensitivity, specificity, and accuracy.
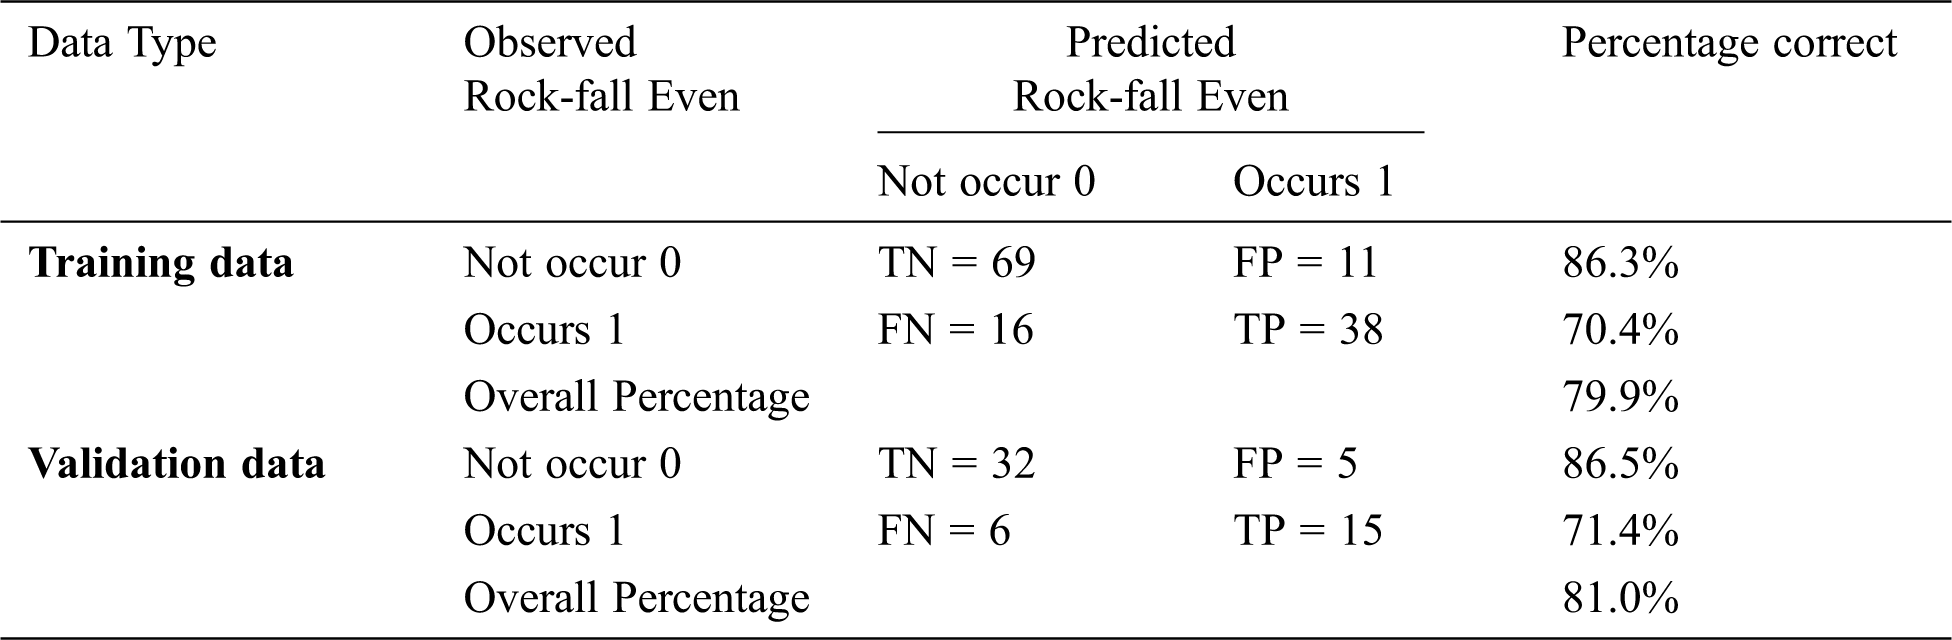
Tab. 4 shows that the proposed method’s average sensitivity when using training and validation data is 70.4% and 71.4%, respectively. That means, even for the lowest levels of sensitivity, only 29.6% of the rock-fall events were not detected correctly. The proposed method’s average specificity is about 86.3% and 86.5%, respectively, which means the system has a high ability to disregard fake events. The accuracy of 79.9% and 81.0% for the training and validation data indicates the goodness and stability of the logistic regression model.
This study aimed to develop an intelligent warning system for reducing rock-fall hazard along a mountainous road in the Kingdom of Saudi Arabia. This system was created to replace conventional inefficient warning signs with a new one more dynamic in providing Light and sound alert about the upcoming rock-fall hazard before occurrence. The proposed system fuses various sensors with the (logistic regression model) in a warning system. This system is capable of predicting the rock-fall in the study area, in addition to performing a decision-making algorithm for classifying the hazard into three levels (low, medium, and high) and delivers warning action.
The database used to construct this system has been mentioned in Section 2.2, and it contains four variables, one dependent variable (event of rock-fall) and three independent variables (Rainfall rate, temperature variation, and slope angle). The data samples were divided into two independent data sets 65% as a training data set, whose purpose is to train the prediction model, and 35% as testing data set to validate it. The logistic regression model was applied to link the impact of independent variables (rock-fall trigger factors) on the dependent variable (occurrence of rock-fall).
The logistic regression process results were the model coefficients and extra statistics parameters, as shown in Tab. 1. The standard error of model coefficients was between 0.132 and 0.421; these low standard error values explain how close predictions to the eventual outcomes. The (Wald statistics) parameter assesses the significance probability for all independent variables’ coefficient (β). The obtained significant probability values in a range of (0.010 to 0.030) since all significant probability values were less than 0.050; it indicates the independent variables have statistically significant effects on rock-fall occurrence. Regarding the obtained statistical results its indicate good model fitting. Thus, the three independent variables (slope angle, rainfall rate, and temperature variation) had included in the model. The model’s predictive abilities had evaluated by some performance metrics such as the area under the ROC curve (AUC), sensitivity, specificity, and accuracy. During the model training and validation, the area under the curve (AUC) in ROC values Figs. 5 and 6 was approximately 0.853 and 0.903, respectively. Toward more investigation, the areas under the curves (AUC) were recalculated individually for all independent variables. The obtained results were slope angle (0.802), rainfall rate (0.815), and temperature variation (0.635). So, all variables in the rock-fall prediction model effective. The average sensitivity during the model training and validation is 70.4% and 71.4%, respectively, means that even for the lowest levels of sensitivity, only 29.6% of the rock-fall events not detected correctly. It indicates that the system has slightly good sensitivity in the prediction of the rock-fall. The average specificity during the model training and validation is 86.3% and 86.5%, respectively, which means the system has a high ability to recognize fake events. The logistic regression model’s overall prediction accuracy is 79.9% and 81.0%, respectively, during the model training and validation. It indicates the goodness and stability of the logistic regression model.
To this end, the values of (AUC), sensitivity, precision, and accuracy confirms that the logistic regression model is accurate for both the training and validation data sets. Therefore, the computed logistic regression model accurately represents the relationships between the selected parameters and potential (rock-fall) occurrence. It ensures that the final model can predict (occurrence of rock-fall) in the study area correctly; this qualifies it as an essential part of the warning system. When installing this warning system on the roadside, it will help the driver become notably more hassle-free; thus, enhancing traffic safety.
Some limitations still exist in this study. One limitation is the proposed method not perfect in determining the exact moment of the rocks falls, so future effort to consider the short-term prediction of rocks fall event. Further work is required to enhance the predictive model by using additional variables (rocks-vibration) and (debris-movement). The additional variables can be extracted from (a phenomenon before the occurrence of rock-fall) using (computer vision algorithms).
Acknowledgement: The authors extend their appreciation to the Deanship of Scientific Research at King Khalid University for funding this work through General Research Project under grant number (project/Design and Implementation of Intelligent System for Monitoring and Forecasting Rock Falls to Enhance Traffic Safety/number 110/2019).
Funding Statement: The authors express their appreciation to the Deanship of Scientific Research at King Khalid University for funding this work through General Research Project under grant number (110 /2019).
Conflicts of Interest: The authors declare that they have no conflicts of interest to report regarding the present study.
1. B. T. Pham, A. Shirzadi, H. Shahabi, E. Omidvar, S. K. Singh et al., “Landslide susceptibility assessment by novel hybrid machine learning algorithms,” Susceptibility, vol. 11, no. 16, pp. 1–25, 2019. [Google Scholar]
2. A. M. Youssef, B. Pradhan, M. Al-Kathery, G. D. Bathrellos and H. D. Skilodimou, “Assessment of rockfall hazard at Al-Noor Mountain, Makkah city (Saudi Arabia) using spatio-temporal remote sensing data and field investigation,” African Earth Sciences, vol. 101, no. 1, pp. 309–321, 2015. [Google Scholar]
3. P. Asteriou and G. Tsiambaos, “Empirical model for predicting rockfall trajectory direction,” Rock Mechanics and Rock Engineering, vol. 49, no. 3, pp. 927–941, 2016. [Google Scholar]
4. M. Walter, C. Arnhardt and M. Joswig, “Seismic monitoring of rockfalls, slide quakes, and fissure development at the Super-Sauze mudslide, French Alps,” Engineering Geology, vol. 128, no. 2, pp. 12–22, 2012. [Google Scholar]
5. M. Dietze, S. Mohadjer, J. M. Turowski, T. A. Ehlers and N. Hovius, “Seismic monitoring of small alpine rockfalls—Validity, precision and limitations,” Earth Surface Dynamics, vol. 5, no. 4, pp. 653–668, 2017. [Google Scholar]
6. Y. Admassu, “Digital surface model-aided quantitative geologic rockfall rating system (QG-RRS),” Environmental and Engineering Geoscience, vol. 25, no. 4, pp. 255–271, 2019. [Google Scholar]
7. K. Sassa, B. Tiwari, K. F. Liu, M. McSavene, A. Strom et al., “Landslide dynamics: ISDR-ICL landslide interactive teaching tools,” Landslide Dynamics, vol. 2, no. 3, pp. 1–835, 2018. [Google Scholar]
8. A. Fantini, M. Fiorucci and S. Martino, “Rock falls impacting railway tracks: Detection analysis through an artificial intelligence camera prototype,” Wireless Communications and Mobile Computing, vol. 2017, no. 5, pp. 1–11, 2017. [Google Scholar]
9. A. Shirzadi, L. Saro, O. H. Joo and K. Chapi, “A GIS-based logistic regression model in rock-fall susceptibility mapping along a mountainous road: Salavat Abad case study, Kurdistan, Iran,” Natural Hazards, vol. 64, no. 2, pp. 1639–1656, 2012. [Google Scholar]
10. P. Frattini, G. Crosta, A. Carrara and F. Agliardi, “Assessment of rockfall susceptibility by integrating statistical and physically-based approaches,” Geomorphology, vol. 94, no. 3–4, pp. 419–437, 2008. [Google Scholar]
11. A. Delonca, Y. Gunzburger and T. Verdel, “Statistical correlation between meteorological and rockfall databases,” Natural Hazards and Earth System Sciences, vol. 14, no. 8, pp. 1953–1964, 2014. [Google Scholar]
12. F. Sandersen, S. Bakkehøi, E. Hestnes and K. Lied, “The influence of meteorological factors on the initiation of debris flows, rockfalls, rockslides and rockmass stability,” Publikasjon-Norges Geotekniske Institutt, vol. 201, pp. 97–114, 1997. [Google Scholar]
13. M. Berti, M. L. V. Martina, S. Franceschini, S. Pignone, A. Simoni et al., “Probabilistic rainfall thresholds for landslide occurrence using a Bayesian approach,” Journal of Geophysical Research Earth Surface, vol. 117, no. 4, pp. 1–20, 2012. [Google Scholar]
14. B. D. Collins and G. M. Stock, “Rockfall triggering by cyclic thermal stressing of exfoliation fractures,” Nature Geoscience, vol. 9, no. 5, pp. 395–400, 2016. [Google Scholar]
15. A. Shirzadi, K. Chapi, H. Shahabi, K. Solaimani, A. Kavian et al., “Rock fall susceptibility assessment along a mountainous road: An evaluation of bivariate statistic, analytical hierarchy process and frequency ratio,” Environmental Earth Sciences, vol. 76, no. 4, pp. 152, 2017. [Google Scholar]
16. S. Lee, “Application of logistic regression model and its validation for landslide susceptibility mapping using GIS and remote sensing data,” International Journal of Remote Sensing, vol. 26, no. 7, pp. 1477–1491, 2005. [Google Scholar]
17. G. L. Tian, Y. Liu and M. L. Tang, “Logistic regression analysis of non-randomized response data collected by the parallel model in sensitive surveys,” Australian & New Zealand Journal of Statistics, vol. 61, no. 2, pp. 134–151, 2019. [Google Scholar]
18. D. Faraggi and B. Reiser, “Estimation of the area under the ROC curve,” Statistics in Medicine, vol. 21, no. 20, pp. 3093–3106, 2002. [Google Scholar]
19. T. Daskivich, M. Luu, B. Noah, G. Fuller, J. Anger et al., “Differences in online consumer ratings of health care providers across medical, surgical, and allied health specialties: Observational study of 212,933 providers,” Journal of Medical Internet Research, vol. 20, no. 5, pp. 29–36, 2018. [Google Scholar]
20. G. Zeng, “On the confusion matrix in credit scoring and its analytical properties,” Communications in Statistics-Theory and Methods, vol. 49, no. 9, pp. 2080–2093, 2020. [Google Scholar]
21. N. Tu, O. Aydin and A. Kawasaki, “Landslide susceptibility mapping of the Sera River Basin using logistic regression model,” Natural Hazards, vol. 85, no. 3, pp. 1323–1346, 2017. [Google Scholar]
 | This work is licensed under a Creative Commons Attribution 4.0 International License, which permits unrestricted use, distribution, and reproduction in any medium, provided the original work is properly cited. |