DOI:10.32604/iasc.2021.014661
| Intelligent Automation & Soft Computing DOI:10.32604/iasc.2021.014661 | |
| Article |
Analysis of Roadside Accident Severity on Rural and Urban Roadways
1Department of Transportation Engineering, Shandong University of Technology, Zibo, 255000, China
2Department of Transportation Planning and Management, Southeast University, Nanjing, 211189, China
3Center for Urban Transportation Research, University of South Florida, Tampa, 33620, USA
*Corresponding Author: Yongqing Guo. Email: yongqing.guo@sdut.edu.cn
Received: 06 October 2020; Accepted: 09 February 2021
Abstract: The differences in traffic accident severity between urban and rural areas have been widely studied, but conclusions are still limited. To explore the factors influencing the occurrence of roadside accidents in urban and rural areas, 3735 roadside traffic accidents from 2017 to 2019 were analyzed. Fourteen variables from the aspects of driver, vehicle, driving environment, and other influencing factors were selected to establish a Bayesian binary logit model of roadside crashes. The deviance information criterion and receiver operating characteristic curve were used to test the goodness of fit for the traffic crash model. The results show that: (1) the Bayesian binary logit regression model well fits the traffic crash data, and the goodness of fit for sub-models based on separate urban and rural data is better than when based on all data (urban and rural); (2) 10 variables have a significant influence on the extent of roadside crash severity in the two areas, with different impacts; (3) drunk driving increases the probabilities of fatal traffic accidents by 10.8% and 16.4% in urban and rural areas, respectively; (4) the probabilities of fatality caused by traffic accidents involving trucks are 4.6% and 9.8% higher than those without trucks in urban and rural areas, respectively. The findings of this study can provide a theoretical foundation for traffic safety administration to formulate relevant policies or strategies in order to reduce the severity of roadside accidents.
Keywords: Traffic safety; roadside crashes; binary logit model; Bayesian estimation; injury severity
Roadside crashes are accidents in which a vehicle deviates from the traffic lane and enters the road shoulder or the area outside the shoulder. The vehicle collides with guardrails, vehicles, pedestrians, or other obstacles. They also involve other accidents such as rollovers and fallings. According to the statistics, 31.7% of all vehicle traffic accidents were roadside accidents in 2017. Injuries and fatalities in accounted for 32.65% and 33.16% of the respective totals for all accidents [1].
Scholars have made great progress identifying influencing factors and their effects on traffic accidents [2,3]. It has been found that factors such as driver’s behavior, weather, time period, and vehicle type have a stable internal correlation with the occurrence and severity of traffic accidents [4,5]. For example, Ahmed et al. [6] found that their severity involving trucks is 2.3 times that without trucks on state highways. Zhai et al. [7] analyzed traffic accidents in Hong Kong, and found that the variables of time segments and weather have a significant impact on occurrence and severity. The probability of serious crashes is normally lower at 10:00 a.m. to 4:00 p.m. than at night (7:00 p.m.–6:59 a.m.).
There are significant differences between urban and rural areas in regards to highway mileage, road grade, car ownership, traffic volume, and number of car accidents [8]. Hence, researchers pay attention to those characteristic differences [9,10]. Most studies have focused on models that explore the factors that influence the type and severity of car crashes [11–14]. (Theofilatos et al. [11] produced a comprehensive overview of the methodological approaches and relevant factors.)
Numerous studies have used real-world accident data in urban or rural areas to investigate factors affecting road safety [15]. Xie et al. [16] analyzed the correlation between the severity of a single-vehicle crash and the influencing factors. It was found that the eight variables representing driver’s age (more than 65 years old), drunk driving, seatbelt use, poor light conditions, speeding behavior, collision fixed object, overturned, and falling, are closely related to the severity of the driver’s injury. Among these variables, wearing a seat belt can lessen severity, while the other seven variables can greatly increase the probability of serious traffic accidents. The proportions of cars and light non-passenger automobiles in the traffic flow have a significant impact on the probability of traffic accidents without casualties. And the proportion of heavy trucks has no significant influence. However, for traffic accidents without injuries, the proportion of light non-passenger automobiles is a significant factor, and the proportions of cars and heavy trucks are not significant factors [17].
The impacts of factors on accident severity between urban and rural areas has also been explored. For example, Al-Bdairi and Hernandez [18] compared the impacts of factors on the severity of urban and rural truck crashes, and found no clear difference in the impacts of seatbelt use and fatigue driving. It was also found that female drivers are more likely to be involved in non-incapacitating injuries on rural roads [19]. Khorashadi et al. [20] found that exceeding the speed limit increases the probability of fatal traffic accidents in rural areas, but has no significant impact in urban areas.
However, due to sample sizes, differences in driving styles [21], and the discrete characteristics of accident occurrence, current accident analysis models are only appropriate for certain countries and regions, and are difficult to transfer across them [22,23]. Shew et al. [24] established an accident prediction model based on the accident data of U.S. Highway 101 in California, and tested the prediction accuracy using I-880 highway accident data. The results show that under the same false-alarm rate, the difference between the two datasets in prediction accuracy is as high as 15%. Therefore, systematic research of the relationship between roadside traffic accident severity and explanatory factors (urban and rural roadways) in China is necessary.
To summarize, by not considering the differences between the two regions, many accident analysis models achieve low accuracy in a wide range of applications. More attention should be paid to the differences of influence factors on roadside crash severity between urban and rural regions. This study uses traffic accident data in urban and rural areas of Shandong, China, to identify the differences of influence factors on roadside traffic accident severity in the two regions and develop appropriate accident analysis models.
The occurrence and severity of traffic accidents are closely related to the factors of humans, vehicles, roads, and the environment [25,26]. Human factors include driver attributes (e.g., gender, age, mood), drunk driving, the use of safety measures such as seat belts and helmets, and drowsy driving. Vehicle-related factors include the number of involved vehicles, vehicle type (e.g., truck, two-wheeled vehicle) and vehicle performance (e.g., braking distance). Road-related factors include road surface conditions. The driving environment includes weather conditions and visibility. Other factors include the time and location of an accident. To simplify the model, the factors of driver emotion and vehicle performance are not included in this study.
Traffic accident data for this study were from Shandong province in 2017–2019, as provided by the Shandong Department of Transportation (SDOT). This study explores the influencing factors on the probability of roadside accidents in urban and rural areas, and the differences of the probability of fatal roadside accidents between urban and rural areas under different factors. Thus crashes occurring in urban and rural areas were reserved, and others, such as in suburbs, were removed by manual screening, to obtain a total of 2664 crashes in urban areas and 1071 in rural areas. All the model variables were encoded and transformed to categorical variables. For example, according to the worst injury severity in an accident, its severity was transformed to a dichotomous variable, coded as 1 if someone was killed (on-the-spot or within seven days), and 0 otherwise. The injury severity of the ith roadside crash was selected as a response variable (yi). A single-vehicle accident was coded as 0, and a multiple-vehicle accident as 1.
Considering that two-wheeled motorcycles and electric bicycles have similar characteristics in traffic accidents (e.g., they cannot provide necessary protection for passengers), they are both classified as two-wheeled vehicles; if one of these is involved in an accident, the code (which is shown in Tab. 1) is 1, and otherwise the code is 0. Three-wheeled motorcycles are excluded due to scant data (less than 1% of the accident data). Accidents caused by motor vehicles are coded as 0, and those caused by other types of vehicles as 1. Due to the low proportion of gale, snowfall, and rainfall, these weather types are combined into non-clear weather and coded as 1, and sunny weather is coded as 0. Data regarding seat belt use are based on two aspects: (1) in accidents with casualties, whether the most seriously injured person used a safety belt; and (2) in accidents without casualties, whether the driver used a seat belt. The code is 0 for using a seat belt, and 1 for not using one. A total of 14 factors were selected as independent variables (xi). The variable coding and descriptions are shown in Tab. 1.
Table 1: Variable coding and descriptions
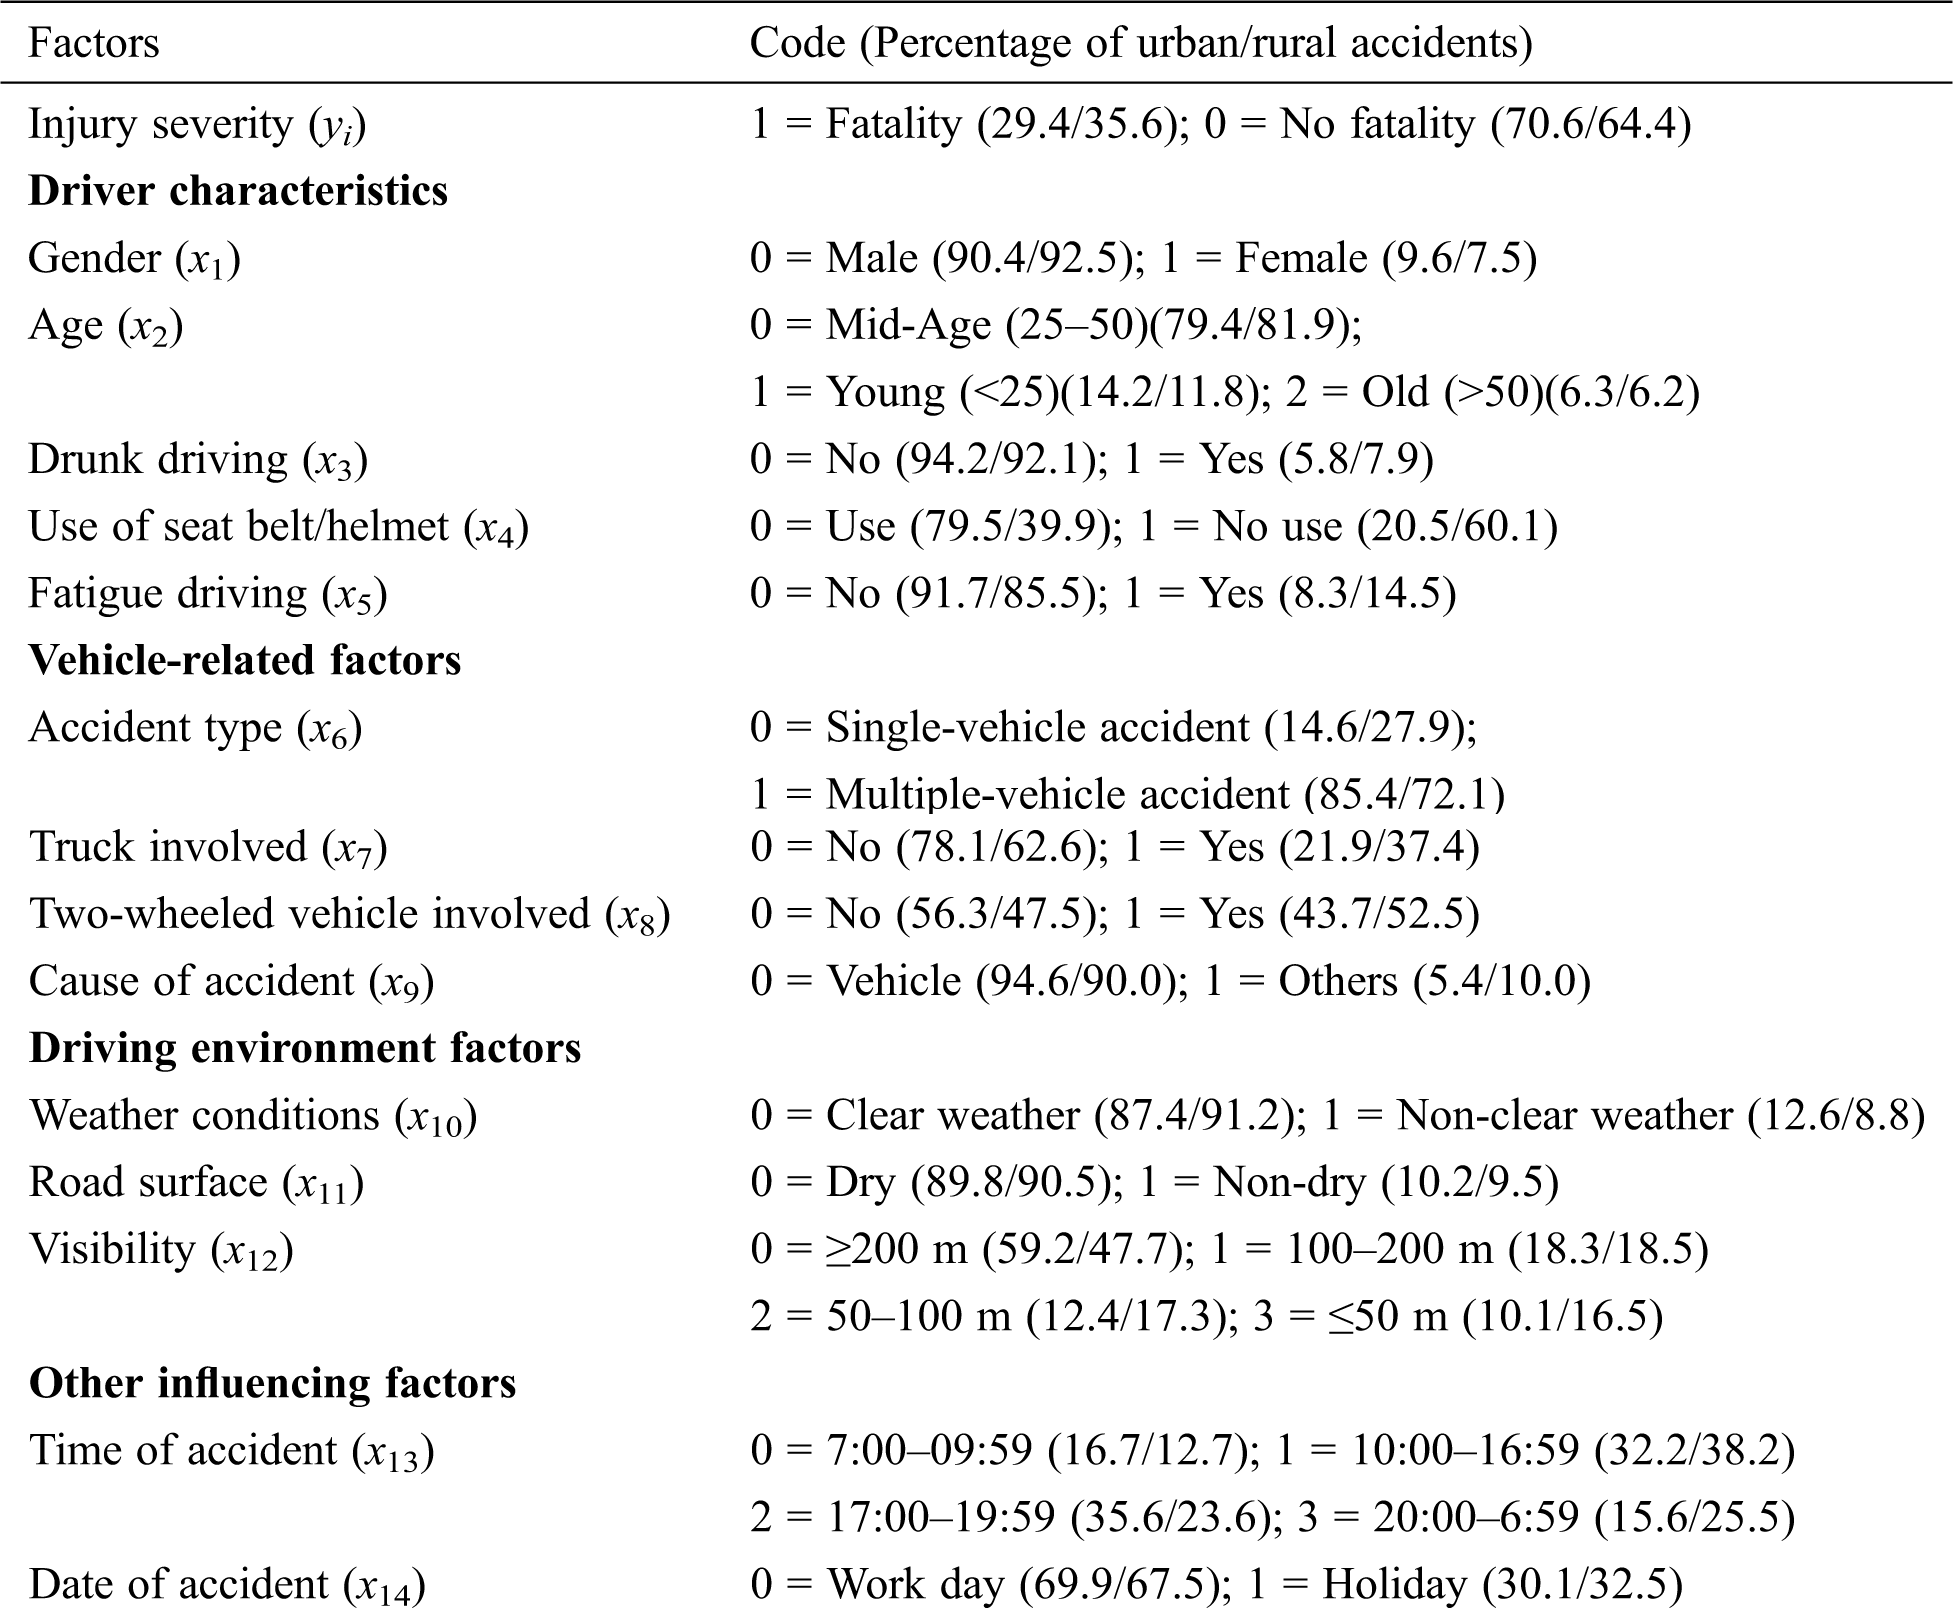
As shown in Tab. 1, there are twice as many roadside accidents in urban areas as in rural areas, due to traffic volume. But the proportion of fatal accidents is higher in rural areas (35.6%) than in urban areas (29.4%). The proportion of fatalities caused by drunk driving, non-use of seat belts/helmets, and fatigue driving are 7.9%, 60%, and 14%, respectively, all higher than in urban areas.
The proportion of single-vehicle roadside accidents is higher in rural areas (27.9%) than in urban areas (14.6%). This may be due to the poor road conditions in rural areas, resulting in roadside crashes due to an object falling from the roadside, hitting a fixed object alongside the road, or poor vision. The proportions of roadside crashes involving trucks and two-wheeled vehicles are 37.4% and 52.5%, respectively, in rural areas, which are higher than in urban areas. The proportions of roadside crashes in non-clear weather and with non-dry road surface conditions are 12.6% and 10.2%, respectively, in urban areas, which are higher than in rural areas. People in urban regions might be less likely to change their trip plans in bad weather (e.g., rainfall, snow, and wind) due to choices of transport modes [27]. There is no clear difference between urban and rural regions in the impact of other factors on roadside accidents, such as visibility, location, and date. The proportion of accidents decreases gradually with decreased visibility.
The proportion of accidents is lower on holidays than on work days. The percentage of accidents on holidays is higher in rural districts than in urban districts. The proportion of accidents in the morning and evening is higher in urban areas than in rural areas, but the proportion of accidents through the night is higher in rural areas. This is probably because of poor lighting on many rural roads [28].
3.1 Binary Logit Regression Model
The logit model is considered a generalized linear regression model. The response variables are converted to the logit function, which improves the applicability and fitting performance of the model. Suppose that response variable yi (injury severity) has outcome yi = 1 (fatality) or yi = 0 (no fatality) with respective probabilities pi and 1-pi. The logit function relates the explanatory variables to the probability of an outcome yi = 1. When the value of the independent variable xi is given, the probability of event yi = 1 is determined by
where β0 and βk are the intercept and coefficient, respectively, of the regression model; xki is the kth independent variable in accident i; and
3.2 Bayesian Estimation of Model
Bayesian analysis defines the unknown parameters as random variables. The posterior distribution of parameters is obtained as [29]
where
The prior information is expressed by a prior distribution of parameters in Bayesian analysis. The prior distribution includes the informative prior distributions and uniform priors or non-informative priors. And the posterior distribution of parameters is directly affected by the prior distribution. This research uses uniform priors following a normal distribution. The initial values of each parameter are estimated by maximum likelihood. The standard deviation of the normal prior distribution for the coefficients is
The joint density function of β0, β1, …, βn is
Then the posterior distribution of parameter β0, β1, …, βn can be expressed as
Considering the complexity of the posterior distribution for parameter β0, β1, …, βn under a normal distribution, it would be difficult to obtain the analytical solution by the high-dimensional integral. Therefore, Markov chain Monte Carlo (MCMC) simulation is applied when the Bayesian method is used to calibrate model parameters [31].
3.3 Goodness of Fit Test for Model
3.3.1 Receiver Operating Characteristic Curve
The receiver operating characteristic (ROC) curve is often used to test the fitting performance of a binary response model (event = 1, non-event = 0) [32]. The range for the threshold of the ROC value is 0 to 1. If the predicted probability exceeds the threshold, then the model classifies the observations as events (fatal accidents), and otherwise they are classified as non-events (non-fatal accidents). Model fitting performance is usually described by sensitivity and 1-specificity. In the predicted positive classes, sensitivity is the proportion of actual positive instances to all positives, and 1-specificity is the ratio of actual negative instances to all negatives.
The ROC curve shows the relationship between sensitivity and 1-specificity under different thresholds. The area of the graph formed by the curve, (1, 0) and (1, 1) on the X-axis is represented by the area under curve (AUC) value. The value of AUC ranges from 0 to 1. AUC can also directly evaluate model fitting. The larger the value the better the model fits. Model fitting accuracy is higher as AUC approaches 1.
3.3.2 Deviation Information Criterion
The deviance information criterion (DIC) comprehensively evaluates the goodness of fit and complexity of a Bayesian model, and is used to compare the advantages of different models [33]. Although it is difficult to determine the key factors affecting DIC, a larger value connotes a better model. It is calculated as
Where
If the difference of the DIC values of two models is more than 5, then it can be considered that the model with smaller DIC has better fitting performance. If the difference is less than 5, then the DIC value cannot be used as the only index to judge the fitting performance of the model.
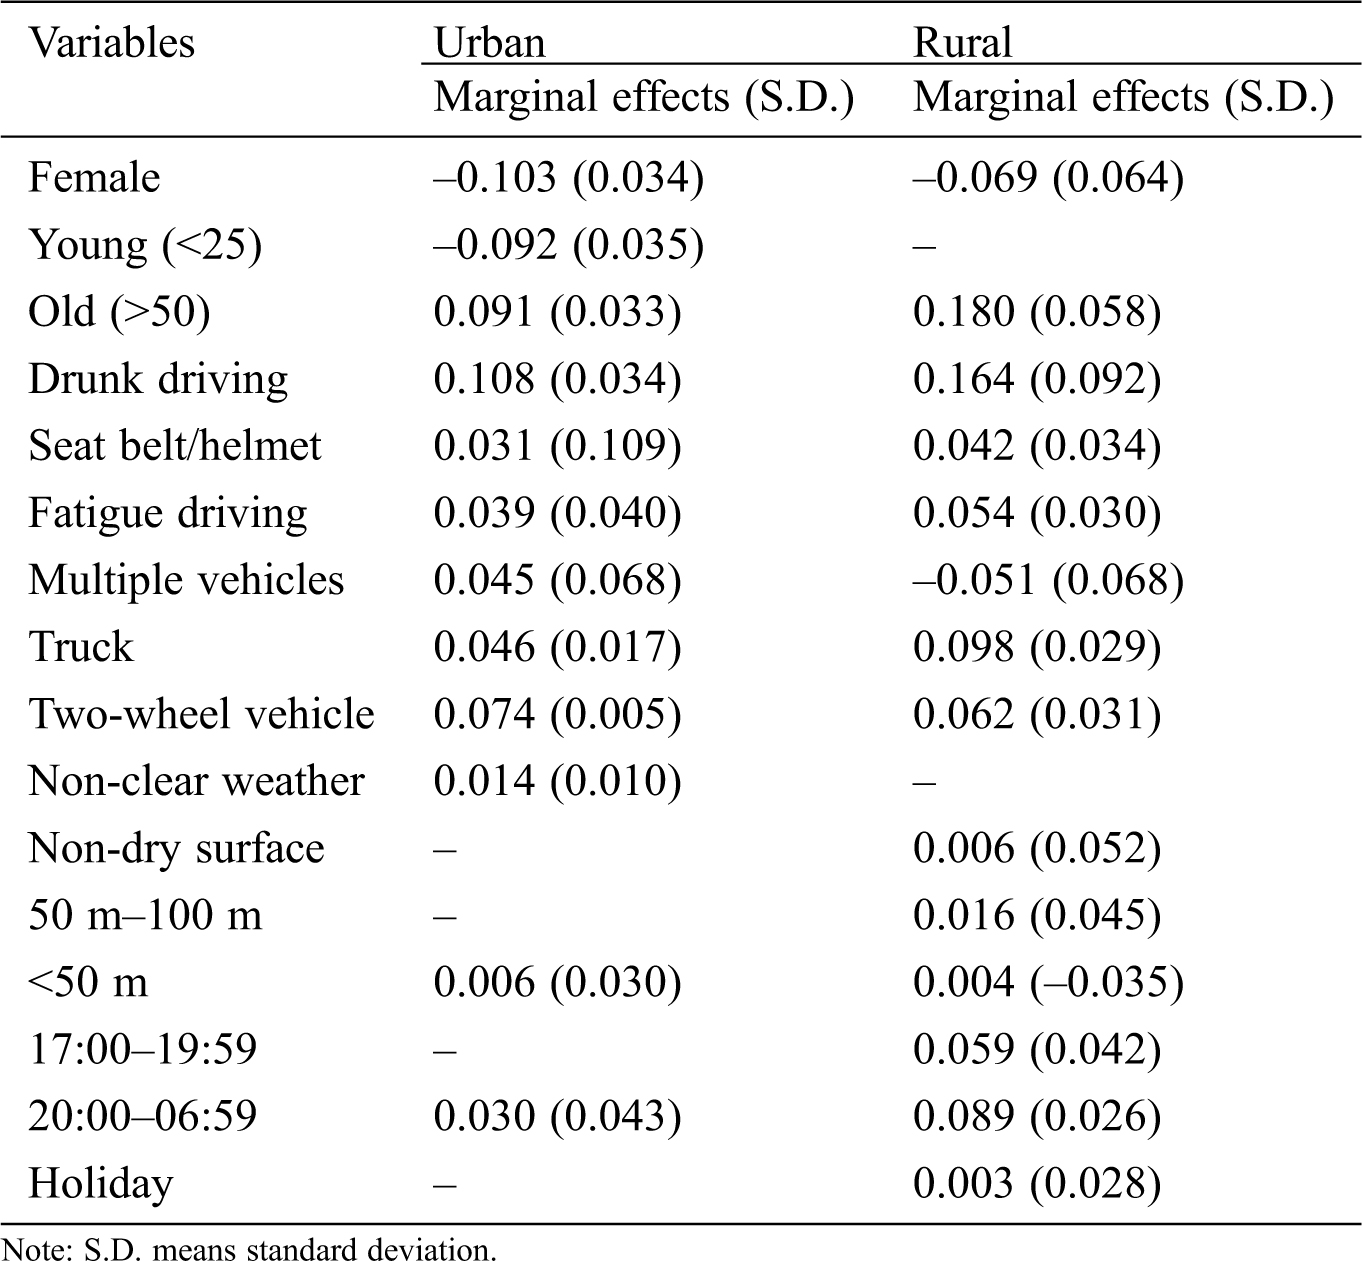
We calculate the average marginal effect of factors that have a significant influence on the severity of accidents. This is used for quantitative analysis of the change of a dependent variable when an independent variable changes. Since all independent variables in the model have been converted to dummy variables, the marginal effect is determined as
where
4.1 Model Parameter Estimation
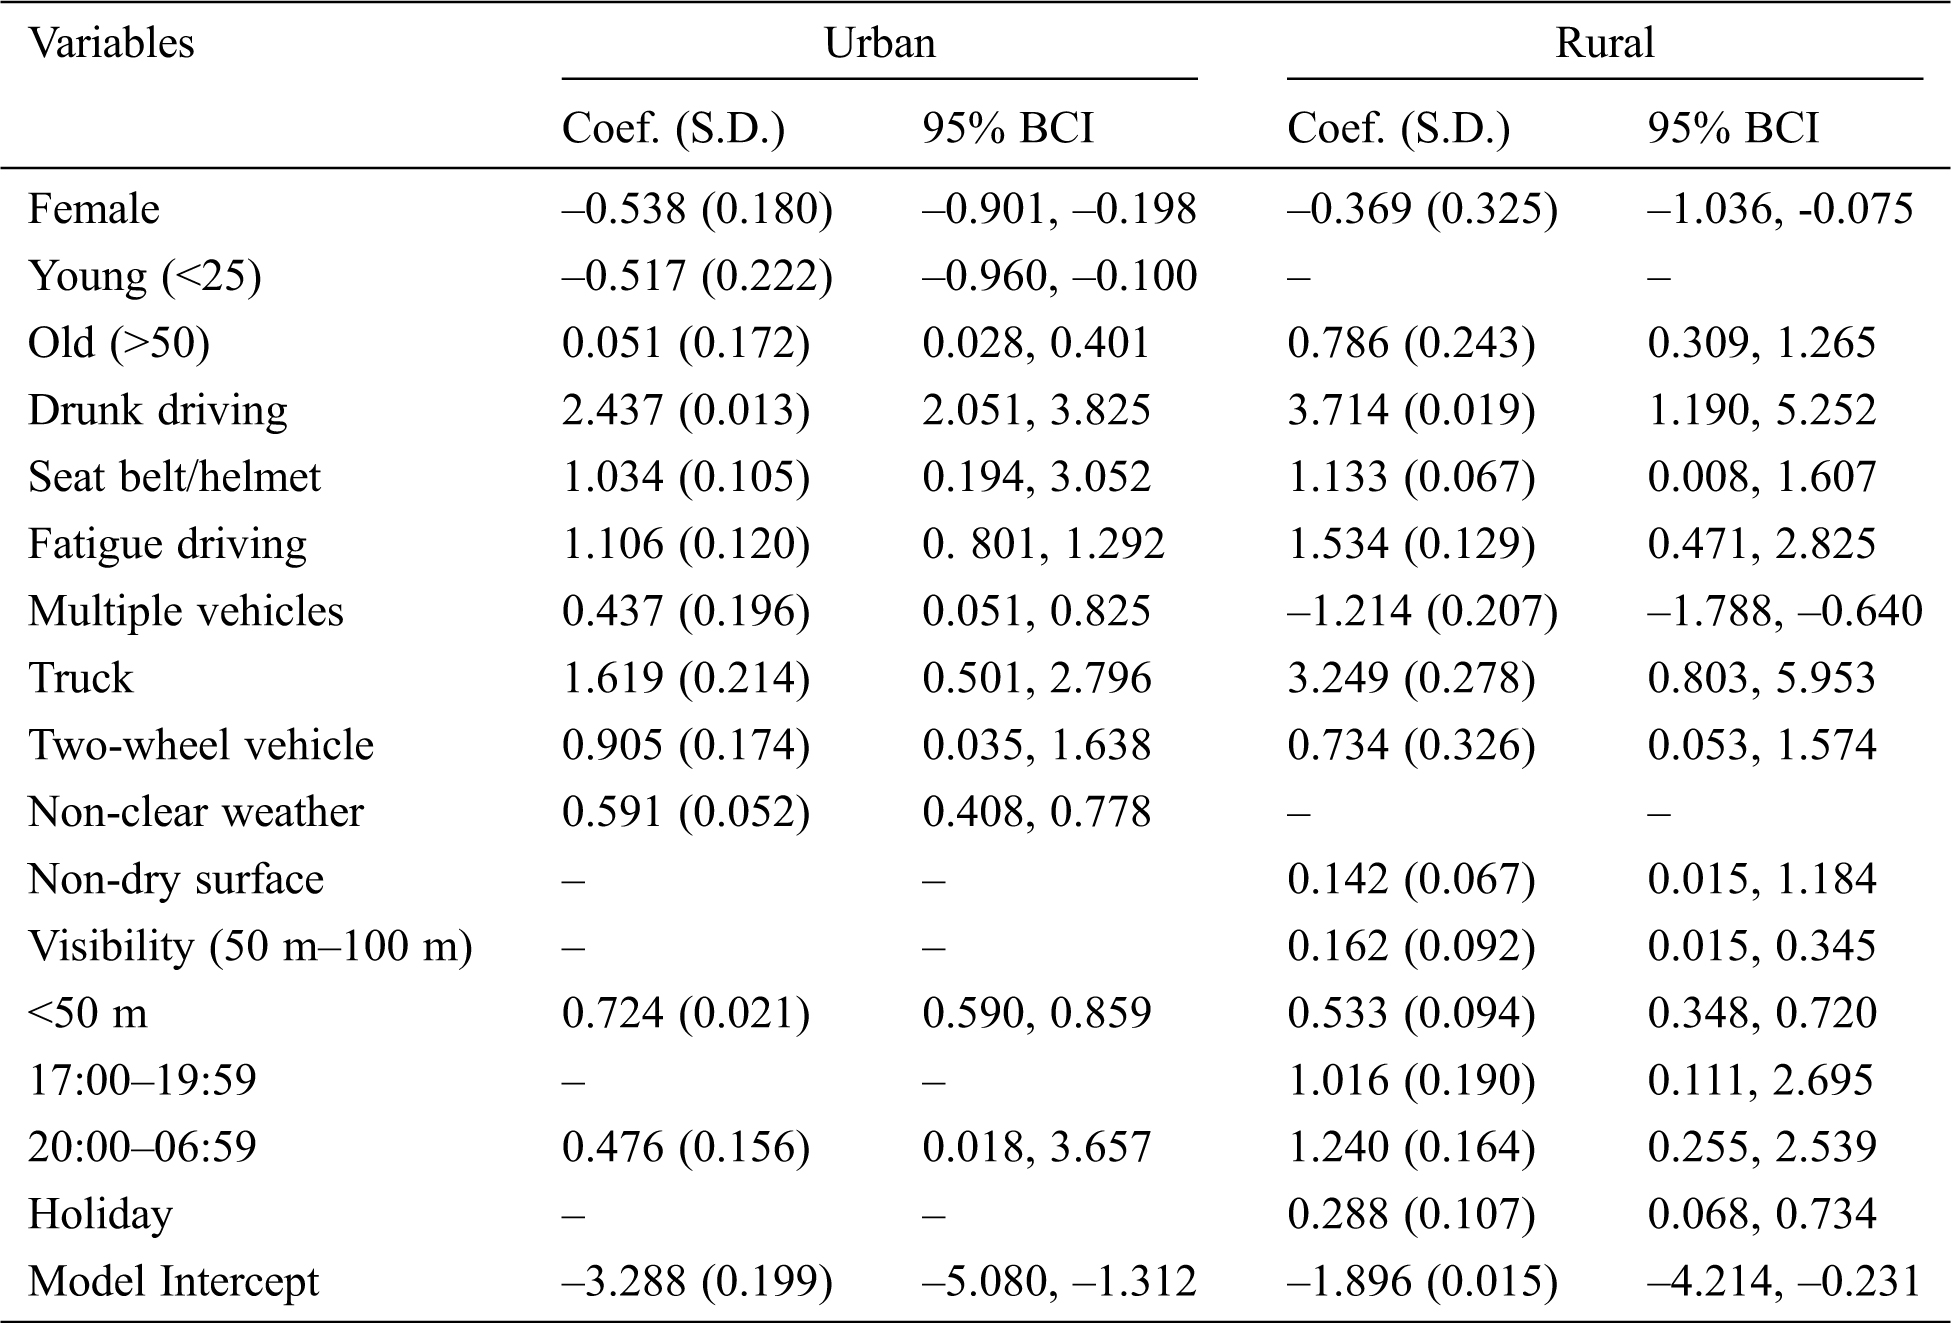
Model parameters were estimated using the Bayesian algorithm in Stata 16.0 software. Considering the complexity of the model, three MCMC chains were constructed for Bayesian inference. Each chain was iterated 20,000 times, and the historical graph and Brooks-Gelman-Rubin (BGR) values of the iterated chain for all parameters were used to check for reasonable convergence of the model. When the iterative historical graph of a model parameter shows no strong periodicity and the BGR is less than 1.2, model convergence occurs. The autocorrelation function of model parameters was tested to ensure that they were independent and identically distributed (IID). When the autocorrelation curve of the parameters quickly decreases to 0 and remains stable, the parameters can be considered to meet IID requirements. The length of the chain was detected by the Raftery–Lewis diagnostic based on the specific quantile of the parameter distribution [34]. The model reached convergence after about 3,000 iterations, hence the first 3,000 iterations were removed as a “burn-in” period to ensure the reasonable estimation of parameters by the MCMC algorithm. The BLRM calibration parameters are shown in Tab. 2. The 95% Bayesian credible interval (95% BCI) was used to examine the significance of variables [35]. If the 95% BCI does not contain zero, then the variable is considered significant. Otherwise, it is not significant, and should be removed from the model.
Table 2: Estimates of model parameters
It should be noted that the model coefficients can indicate positive or negative correlation between independent and dependent variables, but they cannot quantify the influence of factors on accident levels. Therefore, the marginal effects of all independent variables with significant influence were calculated to directly show the influence of factors on the severity of roadside accidents. The marginal effects of model parameters are shown in Tab. 3.
Table 3: Average marginal effects of significant variables
The following can be seen from Tab. 2: (a) The significant influencing factors identified by urban and rural models are not consistent. Factors of the urban model, such as non-dry pavement, visibility distance of 50 m–100 m, time of 17:00–19:59, and holiday, are not significant; factors of inclement weather and young drivers in rural accidents are not significant, and other factors are significant. (b) Different coefficients in the urban and rural binary logit models indicate that the same factor has different effects on the severity of roadside crashes in these areas. (c) The regression coefficient of multi-vehicle accidents in the urban model is positive, but it is negative in rural areas. This indicates that the death probability of multi-vehicle roadside crashes is lower in rural areas than in urban areas. (d) In terms of the influence on the probability of roadside fatal accidents, drunk driving and truck-involved are the two most important factors, and their impacts are more significant in rural areas than in urban areas.
The goodness of fit tests of the roadside crash analysis model for urban and rural traffic accidents are shown in Tab. 4. DIC values are lower in rural and urban sub-models (1466.691 in rural areas and 3248.076 in urban areas) than in the models with all data (4772.946). The combined DIC value for the two sub-models is 4714.767, which is lower than that of the overall model by 58.179. Regarding the ROC test, the AUC values for urban and rural areas are 0.798 and 0.797, respectively, which exceed that of the overall model (0.654). The fitting test results of DIC and ROC show that classifying traffic accident data according to urban or rural attributes can significantly improve the fitting accuracy of the model.
Table 4: Goodness of fit tests

According to the results of the Bayesian binary logit model, it was found that factors have different influences, and the same factor has different influences in urban and rural areas on the probability of a fatal roadside crash.
Twelve factors are significantly correlated with the accident severity of the roadside accident analysis model for urban areas, including drunk driving, the use of seatbelt/helmet, fatigue driving, number of vehicles involved, truck involved, two-wheeled vehicle involved, weather, visibility (less than 50 m), and time of occurrence (20:00–6:59). Fourteen factors are significantly correlated with the severity of roadside crashes in the model for rural areas, including driver gender, driver age (old), drunk driving, use of seat belts/helmet, fatigue driving, number of vehicles involved, truck involved, two-wheeled vehicle involved, road surface conditions, visibility (50 m–100 m, less than 50 m), time of occurrence, and holiday. Ten variables have an influence on the severity of roadside accidents in both rural and urban areas. The variables of road surface condition, visibility distance (50 m–100 m), time (20:00–6:59), and holiday have a great impact on roadside crashes only in rural areas, and the variables of weather and driver age (young) has a large effect on the severity of roadside crashes only in urban areas. We analyze the model factors from four aspects.
(1) Driver characteristics
Gender has a significant impact on the severity of urban and rural roadside accidents. Female drivers are less likely than males to be involved in fatal roadside accidents, with probabilities 10.3% less on urban roads and 6.9% on rural roads. Gender has a significant impact on the severity of various types of accidents. Wu et al. [36] found female drivers more likely to be injured in single-vehicle traffic accidents. Male drivers were found more likely to be seriously injured in multi-vehicle traffic accidents [37,38].
The probability of fatal injuries for young drivers (less than 25 years old) is 9.2% less than that of drivers 25–50 years of age in roadside accidents in urban areas, and the probabilities of urban and rural fatal injuries of old drivers (50 years old or older) are respectively 9.1% and 18% greater. This is consistent with the findings of previous studies [36]. Old drivers usually need more reaction time in case of emergency, and are more likely to suffer serious injuries in traffic accidents.
The results show that drunk driving increases the probability of fatal roadside crashes in urban and rural areas by 10.8% and 16.4%, respectively. This is consistent with other research [39]. When a driver is under the influence of alcohol, the severity of traffic accidents will increase significantly. Drunk driving can disrupt cognitive judgment and operational ability, and prolong reaction time. Thus, it is almost impossible for drunk drivers to correctly judge distance and driving speed. Driver safety education and law enforcement can help reduce the severity of roadside accidents. In addition, more attention should be paid to the development of an advanced vehicle identification system that can automatically monitor blood-alcohol concentration and driving status in real time. Automatic driving takeover or warning measures can be implemented to reduce or prevent risky behavior due to drunk driving when abnormal or risky operations are detected.
The research results show that non-use of seat belts/helmets increases the probability of fatal roadside crashes in urban and rural areas by 3.1% and 4.2%, respectively. It is noticed that increasing trends of urban and rural regions are approximately the same. This result is reasonable because it is widely accepted that the use of seat belts can significantly reduce the degree of injury to passengers [40].
Fatigue driving is not uncommon, especially among those who transport goods or passengers over long distances. They can easily feel exhausted after driving a long time, with serious consequences [41]. Previous studies have found that under the influence of fatigue or disease, drivers are more likely to commit major driving errors, which may increase the probability of serious traffic accidents [42,43]. Our results show that fatigue driving increases the probability of fatal roadside crashes in urban and rural areas by 3.9% and 5.4%, respectively. This slightly higher effect in rural areas may occur because traffic control measures in rural areas are relatively weak, and the traffic flow is small. Drivers can easily drive carelessly at high speeds, and are more likely to be engaged in serious roadside accidents when tired.
By comparing driver factors that have a significant influence on serious roadside traffic accidents on urban and rural roads, it was found that the factors of gender, age (old drivers), drunk driving, use of seat belt/helmet, and fatigue driving have a strong influence on the severity of roadside crashes in both regions. This indicates that driver factors are significantly correlated with the severity of roadside traffic collisions. The marginal effects of old drivers, drunk driving, use of seatbelt/helmet, and fatigue driving are greater in rural areas, which suggests that with the influence of the four factors, fatal roadside crashes are more likely to occur in rural areas. This may be due to poor road conditions, less organized traffic environments, lack of road safety awareness, and less effectual police enforcement.
(2) Vehicle characteristics
The probability of death in multiple-vehicle roadside crashes is 4.5% higher than in single-vehicle roadside accidents in urban areas. In rural areas, the probability of death in multiple-vehicle roadside accidents is 5.1% lower than in single-vehicle roadside accidents. Serious collisions are more likely to occur in multiple-vehicle accidents than in single-vehicle accidents in urban areas, and it is the opposite in rural areas. This is because surface conditions and auxiliary facilities of urban roads are pretty good, and most single-vehicle roadside accidents involve minor scratches and no injuries. Many rural roads have pavement in poor condition, and vehicles are prone to be involved in serious roadside accidents, such as by running into a ditch or sliding into a river. Thus, death is more likely in single-vehicle roadside accidents than in multiple-vehicle roadside accidents in rural areas.
The involvement of a truck often leads to fatalities in roadside accidents. The death rates in urban and rural regions are respectively 4.6% and 9.8% higher in truck-involved roadside accidents than without trucks. This suggests that vehicle crash deaths are more likely to occur in roadside traffic accidents involving trucks, and the casualty probabilities of roadside crashes involving trucks are higher in rural areas than in urban areas. It could therefore be said that the factor of truck involvement has a significant impact on the severity of roadside accidents in both areas. This is consistent with previous research [44]. Truck-involved crashes usually cause high mortality, which has always been a focus of attention in the field of road safety. Our study confirms that the factor of truck involvement has a significant impact on the severity of urban and rural roadside accidents. Measures should be taken to solve these problems, such as the development of advanced vehicle control systems and improvement of the vision range of truck drivers.
The death rates of urban and rural regions are 7.4% and 6.3% higher in accidents involving two-wheeled vehicles than in those not involving two-wheeled vehicles. Motorcycles and bicycles increase the probability of fatal traffic accidents by 5–10 times [45]. This may be because safety measures to protect two-wheeled vehicles are relatively weak [46,47], and drivers of two-wheeled vehicles are more likely to die from severe physical injury. Moreover, traffic crashes involving two-wheeled carts occur more commonly on rural roads, due to lack of safety awareness and less-organized traffic environments that increase the probability of serious accidents.
(3) Driving environment characteristics
The regression coefficient of the weather factor in urban areas is positive, which shows that serious roadside traffic accidents in urban areas are more likely to occur in adverse weather than in sunny weather (the marginal effect is 1.4%). In addition, the impact of severe weather on the severity of the accident is nonlinear, thanks to the comprehensive effect of various factors. For example, the impact of rainfall on the severity of single-vehicle accidents is related to the rainfall intensity, wind speed, use of seat belt, driver’s gender, road type, and other factors [48].
The influence of road surface condition on the severity of roadside crashes is not significant in urban areas; however it is statistically significant in rural areas. Islam et al. [37] drew the same conclusion, that the wet road surface is significant in the severity of crashes in rural accidents, but not in urban accidents. In rural areas, the probability of fatal traffic accidents is 0.6% higher on non-dry surfaces than on dry surfaces. This may be due to the low road grade and poor road conditions in rural areas, so serious traffic accidents are more likely to occur on wet roads.
Visibility of 50 m–100 m has no significant effect on the occurrence of fatal roadside crashes in urban areas, but the significant effect appears in rural areas. Compared with visibility above 200 m, the probability of fatal roadside crashes increases by 1.6% with the visibility distance of 50 m–100 m in rural areas, and by 0.6% and 0.4% with the visibility distance of less than 50 m in urban and rural areas, respectively. This shows that the worse the visibility the higher the probability of serious roadside crashes. The reason for this may be that drivers need long times to respond in case of emergency in low-visibility environments. This result is consistent with the findings of previous studies [49].
(4) Other influencing factors
Using the morning (7:00–09:59) as the reference period, the evening period (17:00–19:59) has no significant impact on the occurrence of serious roadside crashes in urban areas, but a significant influence on rural accidents, where fatal accidents are 5.9% more likely to occur. Compared to the reference period, the probabilities of serious roadside traffic crashes in urban and rural areas increase by 3.0% and 8.9%, respectively, in the period from night to early morning (20:00–09:59), which is consistent with Champahom et al. [50]. Chen et al. [51] found that rear-end collisions in darkness increase fatality risks due to poor vision and less effective traffic management. Traffic volume is high and the light is good during the day. Drivers can put on the brake in time when they recognize dangerous situations. In addition, low traffic volume and dim light at night make detection of serious accidents difficult, which can limit the timely provision of medical care, aggravating the severity of an accident.
Taking non-holiday as a reference, holiday has no significant impact on serious roadside crashes in urban areas. The probability of a fatal roadside accident is 0.3% higher on a holiday in a village. This is because many people in rural communities return home for holidays, which increases traffic volumes.
Through analyzing the probability models of fatal roadside crashes in urban and rural areas, it can be seen that there is a difference between them, and the influence of different explanatory variables on the probability of fatal roadside crashes is heterogeneous. For example, factors with no significant influence on the occurrence of fatal roadside crashes in urban areas (e.g., dry road, holiday, visibility of 50 m–100 m, and time period 17:00–19:59), have a great effect on those in the countryside. The variable of severe weather has no clear influence on the probability of fatal roadside traffic accidents in rural areas, but it does in urban areas. Therefore, different measures should be adopted to accommodate the differences between urban and rural areas to effectively reduce fatal accidents.
(1) From the four aspects of driver, motor vehicle, road, and driving environment, 14 factors were selected to analyze the influence of variables on the severity of roadside crashes in urban and rural areas. Based on real-world traffic accidents in urban and rural areas of Shandong province, the binary logit regression model was established using Bayesian parameter estimation. The results show that the factors of driver age, visibility, time period, road surface condition, holiday, and weather have different effects on fatal crashes in rural and urban areas, and nine factors have different effects on serious traffic accidents.
The influence of young drivers and non-clear weather on the severity of roadside crashes is not significant in rural areas, but is statistically significant for roadside traffic collisions in urban areas. Some factors, e.g., non-dry road surface, visibility of 50 m–100 m, the evening period (17:00–19:59), and holiday, have no significant impact on the occurrence of serious roadside crashes in urban areas, but they have a significant impact on the severity of rural roadside accidents. The influence of different factors on the severity of roadside crashes shows diversity between urban and rural areas, and effective strategies should be developed based on these differences. In addition, 10 variables have a significant impact on the severity of roadside crashes in both urban and rural areas.
(2) Comparing the influence on the severity of roadside crashes in urban areas, nine factors can be expressed in descending order, as follows: drunk driving, female drivers, young drivers, old drivers, two-wheeled vehicles involved, trucks involved, multiple vehicles, fatigue driving, the use of seat belts/helmets, the time period from night to early morning (20:00–06:59), non-clear weather, two-wheel vehicles involved, visibility less than 50 m, weather conditions, the time period from night to early morning (20:00–06:59), the number of vehicles involved in the accident. Comparing the influence on the severity of traffic accidents in rural areas, 14 factors can be expressed in descending order as follows: old drivers, drunk driving, trucks involved, the time period from night to early morning (20:00–06:59), female drivers, two-wheeled vehicles involved, fatigue driving, use of safety belt/helmet, number of vehicles involved, the evening time period (17:00–19:59), visibility of 50 m–100 m, road surface condition, two-wheeled vehicles involved, number of vehicles involved, visibility less than 50 m, holidays, visibility of 50 m–100 m, road surface condition. Among them, the number of vehicles involved in an accident has a different impact in urban and rural areas. The percentage of severe injuries and death in urban areas is higher in multi-vehicle accidents than in single-vehicle accidents, while the opposite is true in rural areas.
(3) More broadly, this study recognizes the differences between urban and rural roadside accidents to obtain a deeper understanding of the influencing factors for road traffic crashes. The findings can help the Department of Transportation of China to take differentiated and targeted measures to effectively prevent and reduce urban and rural traffic accidents, especially those that are serious or fatal. A high-accuracy predictive model commonly needs large amounts of information. Hence a promising direction for future work would be to obtain a dataset with detailed information such as specific types of two-wheeled vehicles (e.g., motorcycle, motorized cycle, pedal cycle), drivers’ socioeconomic attributes, and environmental characteristics.
Acknowledgement: This study was supported by SDOT (Shandong Department of Transportation). We thank LetPub for its linguistic assistance during the preparation of this manuscript.
Funding Statement: This study was supported by the NSFC (National Natural Science Foundation of China) (Grant No. 71901134, 71871057), the NSFDYS (National Science Fund for Distinguished Young Scholars) (Grant No. 51925801), the NSFSP (Natural Science Foundation of Shandong Province) (Grant No. ZR2018BF024), the KRDZ (Key Research and Development of Zibo) (Grant No. 2019ZBXC515) and the JPSF (Jiangsu Postdoctoral Science Foundation) (Grant No. 2018K118C).
Conflicts of Interest: The authors declare there is no conflict of interest.
1. Management Bureau of Ministry of Public Security, Road traffic accident statistics’ annual report of PRC, 2017, Beijing: Traffic Management Bureau of Ministry of Public Security, 2018. [Google Scholar]
2. C. Xu, Y. Yang, S. Jin, Z. Qu and L. Hou, “Potential risk and its influencing factors for separated bicycle paths,” Accident Analysis & Prevention, vol. 87, pp. 59–67, 2016. [Google Scholar]
3. D. Ma, X. Luo, S. Jin, W. Guo and D. Wang, “Estimating maximum queue length for traffic lane groups using travel times from video-imaging data,” IEEE Intelligent Transportation Systems Magazine, vol. 10, pp. 123–134, 2018. [Google Scholar]
4. F. Malin, I. Norros and S. Innamaa, “Accident risk of road and weather conditions on different road types,” Accident Analysis & Prevention, vol. 122, pp. 181–188, 2019. [Google Scholar]
5. S. Shen, M. H. Benedetti, S. Zhao, L. Wei and M. Zhu, “Comparing distance and time as driving exposure measures to evaluate fatal crash risk ratios,” Accident Analysis & Prevention, vol. 142, pp. 105576, 2020. [Google Scholar]
6. M. M. Ahmed, R. Franke, K. Ksaibati and D. S. Shinstine, “Effects of truck traffic on crash injury severity on rural highways in Wyoming using Bayesian binary logit models,” Accident Analysis & Prevention, vol. 117, pp. 106–113, 2018. [Google Scholar]
7. X. Zhai, H. Huang, N. N. Sze, Z. Song and K. K. Hon, “Diagnostic analysis of the effects of weather condition on pedestrian crash severity,” Accident Analysis & Prevention, vol. 122, pp. 318–324, 2019. [Google Scholar]
8. D. Xu, C. Wei, P. Peng, Q. Xuan and H. Guo, “GE-GAN: A novel deep learning framework for road traffic state estimation,” Transportation Research Part C: Emerging Technologies, vol. 117, pp. 102635, 2020. [Google Scholar]
9. R. Zhang, Z. He, H. Wang, F. You and K. Li, “Study on self-tuning type friction control for developing main-servo loop integrated chassis control system,” IEEE Access, vol. 5, pp. 6649–6660, 2017. [Google Scholar]
10. X. Kong, F. Xia, J. Li, M. Hou, M. Li et al., “A shared bus profiling scheme for smart cities based on heterogeneous mobile crowdsourced data,” IEEE Transactions on Industrial Informatics, vol. 16, pp. 1436–1444, 2020. [Google Scholar]
11. A. Theofilatos and G. Yannis, “A review of the effect of traffic and weather characteristics on road safety,” Accident Analysis & Prevention, vol. 72, pp. 244–256, 2014. [Google Scholar]
12. H. Xiong, X. Zhu and R. Zhang, “Energy recovery strategy numerical simulation for dual axle drive pure electric vehicle based on motor loss model and big data calculation,” Complexity, vol. 2018, pp. 4071743, 2018. [Google Scholar]
13. D. Ma, X. Song and P. Li, “Daily traffic flow forecasting through a contextual convolutional recurrent neural network modeling inter-and intra-day traffic patterns,” IEEE Transactions on Intelligent Transportation Systems, vol. 99, pp. 2973279, 2020. [Google Scholar]
14. M. Zhou, Y. Yu and X. Qu, “Development of an efficient driving strategy for connected and automated vehicles at signalized intersections: A reinforcement learning approach,” IEEE Transactions on Intelligent Transportation Systems, vol. 21, pp. 433–443, 2019. [Google Scholar]
15. X. Kong, X. Liu, B. Jedari, M. Li, L. Wan et al., “Mobile crowdsourcing in smart cities: Technologies, applications, and future challenges,” IEEE Internet of Things Journal, vol. 6, pp. 8095–8113, 2019. [Google Scholar]
16. Y. Xie, K. Zhao and N. Huynh, “Analysis of driver injury severity in rural single-vehicle crashes,” Accident Analysis & Prevention, vol. 47, pp. 36–44, 2012. [Google Scholar]
17. E. Ayati and E. Abbasi, “Investigation on the role of traffic volume in accidents on urban highways,” Journal of Safety Research, vol. 42, pp. 209–214, 2011. [Google Scholar]
18. N. S. S. Al-Bdairi and S. Hernandez, “Comparison of contributing factors for injury severity of large truck drivers in run-off–road crashes on rural and urban roadways: Accounting for unobserved heterogeneity,” International Journal of Transportation Science and Technology, vol. 9, pp. 116–127, 2020. [Google Scholar]
19. A. K. Yadav and N. R. Velaga, “Alcohol-impaired driving in rural and urban road environments: Effect on speeding behaviour and crash probabilities,” Accident Analysis & Prevention, vol. 140, pp. 105512, 2020. [Google Scholar]
20. A. Khorashadi, D. Niemeier, V. Shankar and F. Mannering, “Differences in rural and urban driver-injury severities in accidents involving large-trucks: An exploratory analysis,” Accident Analysis & Prevention, vol. 37, pp. 910–921, 2005. [Google Scholar]
21. D. Ma, X. Luo, S. Jin, D. Wang, W. Guo et al., “Lane-based saturation degree estimation for signalized intersections using travel time data,” IEEE Intelligent Transportation Systems Magazine, vol. 9, pp. 136–148, 2017. [Google Scholar]
22. Z. Ning, P. Dong, X. Wang, M. S. Obaidat and Y. Li, “When deep reinforcement learning meets 5G-enabled vehicular networks: A distributed offloading framework for traffic big data,” IEEE Transactions on Industrial Informatics, vol. 16, pp. 1352–1361, 2020. [Google Scholar]
23. X. Qu, Y. Yu, M. Zhou, C. Lin and X. Wang, “Jointly dampening traffic oscillations and improving energy consumption with electric, connected and automated vehicles: A reinforcement learning based approach,” Applied Energy, vol. 257, pp. 114030, 2019. [Google Scholar]
24. C. Shew, A. Pande and C. Nuworsoo, “Transferability and robustness of real-time freeway crash risk assessment,” Journal of Safety Research, vol. 46, pp. 83–90, 2013. [Google Scholar]
25. P. Savolainen and F. Mannering, “Probabilistic models of motorcyclists’ injury severities in single- and multi-vehicle crashes,” Accident Analysis & Prevention, vol. 39, pp. 955–963, 2007. [Google Scholar]
26. X. Sun, H. Zhang, W. Meng, R. Zhang, K. Li et al., “Primary resonance analysis and vibration suppression for the harmonically excited nonlinear suspension system using a pair of symmetric viscoelastic buffers,” Nonlinear Dynamics, vol. 94, pp. 1243–1265, 2018. [Google Scholar]
27. L. Yang, G. Zheng and X. Zhu, “Cross-nested logit model for the joint choice of residential location, travel mode, and departure time,” Habitat International, vol. 38, pp. 157–166, 2013. [Google Scholar]
28. Z. Chen and W. Fan, “A multinomial logit model of pedestrian-vehicle crash severity in North Carolina,” International Journal of Transportation Science and Technology, vol. 8, pp. 43–52, 2019. [Google Scholar]
29. Y. Guo, T. Sayed and M. Essa, “Real-time conflict-based Bayesian Tobit models for safety evaluation of signalized intersections,” Accident Analysis & Prevention, vol. 144, pp. 105660, 2020. [Google Scholar]
30. M. S. Shaheed, K. Gkritza, A. L. Carriquiry and S. L. Hallmark, “Analysis of occupant injury severity in winter weather crashes: A fully Bayesian multivariate approach,” Analytic Methods in Accident Research, vol. 11, pp. 33–47, 2016. [Google Scholar]
31. Y. Guo, M. Essa, T. Sayed, M. M. Haque and S. Washington, “A comparison between simulated and field-measured conflicts for safety assessment of signalized intersections in Australia,” Transportation Research Part C: Emerging Technologies, vol. 101, pp. 96–110, 2019. [Google Scholar]
32. C. Xu, W. Wang, P. Liu, R. Guo and Z. Li, “Using the Bayesian updating approach to improve the spatial and temporal transferability of real-time crash risk prediction models,” Transportation Research Part C: Emerging Technologies, vol. 38, pp. 167–176, 2014. [Google Scholar]
33. Y. Guo, Z. Li, P. Liu and Y. Wu, “Modeling correlation and heterogeneity in crash rates by collision types using full bayesian random parameters multivariate Tobit model,” Accident Analysis & Prevention, vol. 128, pp. 164–174, 2019. [Google Scholar]
34. K. Matsuo, M. Sugihara, M. Yamazaki, Y. Mimura, J. Yang et al., “Hierarchical Bayesian modeling to evaluate the impacts of intelligent speed adaptation considering individuals’ usual speeding tendencies: A correlated random parameters approach,” Analytic Methods in Accident Research, vol. 27, pp. 100125, 2020. [Google Scholar]
35. Z. Li, X. Chen, Y. Ci, C. Chen and G. Zhang, “A hierarchical Bayesian spatiotemporal random parameters approach for alcohol/drug impaired-driving crash frequency analysis,” Analytic Methods in Accident Research, vol. 21, pp. 44–61, 2019. [Google Scholar]
36. Q. Wu, G. Zhang, X. Zhu, X. C. Liu and R. Tarefder, “Analysis of driver injury severity in single-vehicle crashes on rural and urban roadways,” Accident Analysis & Prevention, vol. 94, pp. 35–45, 2016. [Google Scholar]
37. S. Islam, S. L. Jones and D. Dye, “Comprehensive analysis of single– and multi-vehicle large truck at-fault crashes on rural and urban roadways in Alabama,” Accident Analysis & Prevention, vol. 67, pp. 148–158, 2014. [Google Scholar]
38. K. Landay, D. Wood, P. D. Harms, B. Ferrell and S. Nambisan, “Relationships between personality facets and accident involvement among truck drivers,” Journal of Research in Personality, vol. 84, pp. 103889, 2020. [Google Scholar]
39. Q. Wu, F. Chen, G. Zhang, X. C. Liu, H. Wang et al., “Mixed logit model-based driver injury severity investigations in single– and multi-vehicle crashes on rural two-lane highways,” Accident Analysis & Prevention, vol. 72, pp. 105–115, 2014. [Google Scholar]
40. C. Chen, G. Zhang, R. Tarefder, J. Ma, H. Wei et al., “A multinomial logit model-Bayesian network hybrid approach for driver injury severity analyses in rear-end crashes,” Accident Analysis & Prevention, vol. 80, pp. 76–88, 2015. [Google Scholar]
41. F. Chen and S. Chen, “Injury severities of truck drivers in single– and multi-vehicle accidents on rural highways,” Accident Analysis & Prevention, vol. 43, pp. 1677–1688, 2011. [Google Scholar]
42. A. Behnood, A. M. Roshandeh and F. L. Mannering, “Latent class analysis of the effects of age, gender, and alcohol consumption on driver-injury severities,” Analytic Methods in Accident Research, vol. 3–4, pp. 56–91, 2014. [Google Scholar]
43. G. Fountas and P. C. Anastasopoulos, “Analysis of accident injury-severity outcomes: The zero-inflated hierarchical ordered probit model with correlated disturbances,” Analytic Methods in Accident Research, vol. 20, pp. 30–45, 2018. [Google Scholar]
44. L. Y. Chang and F. Mannering, “Analysis of injury severity and vehicle occupancy in truck– and non-truck–involved accidents,” Accident Analysis & Prevention, vol. 31, pp. 579–592, 1999. [Google Scholar]
45. H. B. Weiss, S. Kaplan and C. G. Prato, “Analysis of factors associated with injury severity in crashes involving young New Zealand drivers,” Accident Analysis & Prevention, vol. 65, pp. 142–155, 2014. [Google Scholar]
46. D. J. Fagnant and K. M. Kockelman, “Motorcycle use in the United States: Crash experiences, safety perspectives, and countermeasures,” Journal of Transportation Safety & Security, vol. 7, pp. 20–39, 2015. [Google Scholar]
47. S. M. Rifaat, R. Tay and A. D. Barros, “Severity of motorcycle crashes in Calgary,” Accident Analysis & Prevention, vol. 49, pp. 44–49, 2012. [Google Scholar]
48. S. Jung, X. Qin and D. A. Noyce, “Rainfall effect on single-vehicle crash severities using polychotomous response models,” Accident Analysis & Prevention, vol. 42, pp. 213–224, 2010. [Google Scholar]
49. M. S. B. Shaheed, K. Gkritza, W. Zhang and Z. Hans, “A mixed logit analysis of two-vehicle crash severities involving a motorcycle,” Accident Analysis & Prevention, vol. 61, pp. 119–128, 2013. [Google Scholar]
50. T. Champahom, S. Jomnonkwao, D. Watthanaklang, A. Karoonsoontawong, V. Chatpattananan et al., “Applying hierarchical logistic models to compare urban and rural roadway modeling of severity of rear-end vehicular crashes,” Accident Analysis & Prevention, vol. 141, pp. 105537, 2020. [Google Scholar]
51. C. Chen, G. Zhang, J. Yang, J. C. Milton and A. D. Alcántara, “An explanatory analysis of driver injury severity in rear-end crashes using a decision table/Naive Bayes(DTNB) hybrid classifier,” Accident Analysis & Prevention, vol. 90, pp. 95–107, 2016. [Google Scholar]
 | This work is licensed under a Creative Commons Attribution 4.0 International License, which permits unrestricted use, distribution, and reproduction in any medium, provided the original work is properly cited. |