DOI:10.32604/iasc.2021.016558
| Intelligent Automation & Soft Computing DOI:10.32604/iasc.2021.016558 | |
| Article |
Earth Fault Management for Smart Grids Interconnecting Sustainable Wind Generation
Electrical Engineering Department, College of Engineering, Taif University, 21944, Taif, Saudi Arabia
*Corresponding Author: Nagy I. Elkalashy. Email: n.elkalashy@tu.edu.sa
Received: 05 January 2021; Accepted: 17 February 2021
Abstract: In this study, the active traveling-wave fault location function is incorporated into the management of earth faults for smart unearthed and compensated distribution networks associated with distributed renewable generation. Unearthed and compensated networks are implemented mainly to attain service continuity, specifically during earth faults. This advantage is valued for service continuity of grid-interconnected renewable resources. However, overcurrent-based fault indicators are not efficient in indicating the fault path in these distribution networks. Accordingly, in this study, the active traveling-wave fault location is complemented using distributed Rogowski coil-based fault passage indicators. Active traveling waves are injected by switching the neutral point of unearthed and compensated networks using a thyristor. This method has the advantage of creating traveling waves even though the faulted feeder is in service. In addition, a wind energy conversion system based on a doubly-fed induction generator is interconnected. Distributed Rogowski coil fault passive indicators (FPIs) are suggested over the distribution network specifically at the lateral busbars to achieve fault management using active traveling waves. A practical suburban 20-kV compensated distribution network is simulated using ATP/EMTP. Results confirm an effective fault management process using active traveling waves in combination with distributed Rogowski coils as FPIs in the compensated distribution network. The network can continuously attain and interconnect distributed renewable resources sustainably during the earth fault period.
Keywords: fault management; compensated distribution networks; Rogowski coils; traveling-wave fault location; wind distributed generation
Power networks are subject to transients generated due to either external sources, such as lightning, or internal ones, such as switching and faults. These transients are traveling-surge propagating, regardless of whether the network is conventional or smart, where the reflection and transmission traveling-wave rules are applied. Furthermore, faults represent the main source of transients in electrical distribution networks. These faults can be located using the two common main types of fault location determination algorithms, namely, impedance fault location algorithms [1–3] and traveling-wave fault location algorithms [4–6]. However, impedance-based fault location algorithms are affected by distributed generation units, which hinder the accuracy of estimates of fault distance. In addition, they are not efficient in locating earth faults in compensated and unearthed networks. In contrast, traveling-wave algorithms accurately determine fault distance with high accuracy. When dealing with traveling surges, the network is unearthed, or the earth fault current in the network is compensated, even if the network is interconnected with distributed generators. Therefore, the traveling-wave fault location technique may represent a very important stage of the fault management processes, as proposed in this study.
Traveling-wave fault location algorithms are implemented by processing active or passive surges. However, passive surges rapidly diminish just after the fault event. Accordingly, active traveling waves present interesting considerations in determining fault locations in distribution networks. Furthermore, the active traveling waves compared with the passive traveling waves proposed in this study are expected to be incorporated in the fault management of a smart grid.
Self-healing approaches to fault isolation and system restoration depend mainly on the accurate fault selectivity function. To save time and cost, an automated fault management strategy is applied instead of the traditional one [7–10]. References [9,10] introduced a fast and reliable control strategy to isolate faulty sections. For judicious decision-making and optimum control monitoring during the fault management process, smart agents must be installed in power systems [11,12]. Reference [13] reported a review of intelligent agents. All stages of fault management must be implemented precisely. However, the introduced fault selectivity functions are focused on monitoring the distributed fundamental current directions; this concept is not appropriate for earth fault selectivity in unearthed and compensated networks. In addition, use of fundamental current directionality in distributed generation in distribution networks poses more challenges to fault selectivity (the faulted section estimation). The reason for this is that fault selectivity (estimating the faulted section) in distribution networks should be estimated using current measurements, particularly at the laterals, where voltage measurements cannot help indicate the fault direction. Therefore, to obtain flexible and reliable fault management, reliable techniques must be proposed to exactly assign the fault location with zero percent error in fault distance estimation.
Use of traditional current transformers with a high number of devices makes it expensive to implement fault management in smart grids and is unreliable in distributed generation. However, Rogowski coils are cheaper, and their design is suitable for monitoring surges in current waveforms while discarding the fundamental component and harmonics. Similarly, traveling-wave techniques (specifically the active type) are recommended over fundamental current evaluation, particularly for network-connected distributed generation units [14,15].
In this study, fault distance estimation using active traveling waves is incorporated into fault management, where the transient currents are measured using sensitive Rogowski coils as fault passive indicators distributed in a compensated distribution network. The active traveling waves are generated by switching the neutral of the compensated distribution network and measuring surges in the zero and aerial modes to estimate the switching instant and extract the reflected surge from the fault discontinuity, respectively, as presented in Elkalashy et al. [16]. However, fault location is based on voltage transients, which are not appropriate for determining the faulted section, due to distribution network laterals. In the present study, distributed Rogowski coils are exploited to extract active transients in current waveforms to consequently indicate the fault point and then the faulted section. The latter is determined using the active traveling-wave function incorporated in the fault management process. That is, measurements of the distributed Rogowski coils through the directionality of the measured transient currents are evaluated. At each lateraling busbar, the time difference between the first-arriving surges of the zero and aerial modes created due to neutral switching is used to estimate the fault distance, thereby finding the faulted section with the aid of transient directionality. A 20-kV compensated distribution network is simulated using ATPDraw, and distributed generation is represented by a wind-driven, doubly-fed induction generator (DFIG). The results confirm that the fault section is successfully estimated using the active traveling waves created by neutral switching and extracted by distributed Rogowski coils.
The main contribution of this study is that it proposes new fault management rules. For the first time, Rogowski coils are distributed on a smart grid to implement the fault selectivity function based on active traveling waves. The key advantage of the proposed fault management is its applicability to earth faults in unearthed and compensated networks and to sustainable interconnection of distributed wind generation. Accordingly, the advantages of the active traveling waves generated using the thyristor-based neutral switching concept and the sustainability of wind farm interconnection are ascertained during earth faults in smart grids.
2 Simulated Network and Utilized Active Traveling-Wave Techniques
2.1 Compensated Distribution Network
Fig. 1 shows the 20-kV distribution network, a compensated earth fault network. An advantage of the compensated feeders is that the earth fault currents can be zero, as they are compensated using the Peterson coil connected at the neutral point. Accordingly, the service continues during earth faults. Although earth fault detection is accomplished by monitoring the neutral voltage, fault point estimation is challenging; the fault point should be indicated during the fault period, as accomplished in this study. The active traveling-wave concept is utilized and incorporated using distributed Rogowski coils to locate the faulted section.
As shown in Fig. 1, the network had five feeders with a total length of 352 km [16]. The faulted feeder was assumed as a heterogeneous feeder with overhead and underground cable sections. Elkalashy et al. [16] reported representation parameters for overhead and underground cables. This distribution network was simulated using the ATP/EMTP program, where ATPDraw served as the user interface. As shown in Fig. 1, connection of the neutral switching mechanism to create active traveling waves is included in the system. Elkalashy et al. [16] introduced neutral switching, which is generally used when the faulted feeder is in service during the earth fault period. This notion is appropriate with compensated networks.
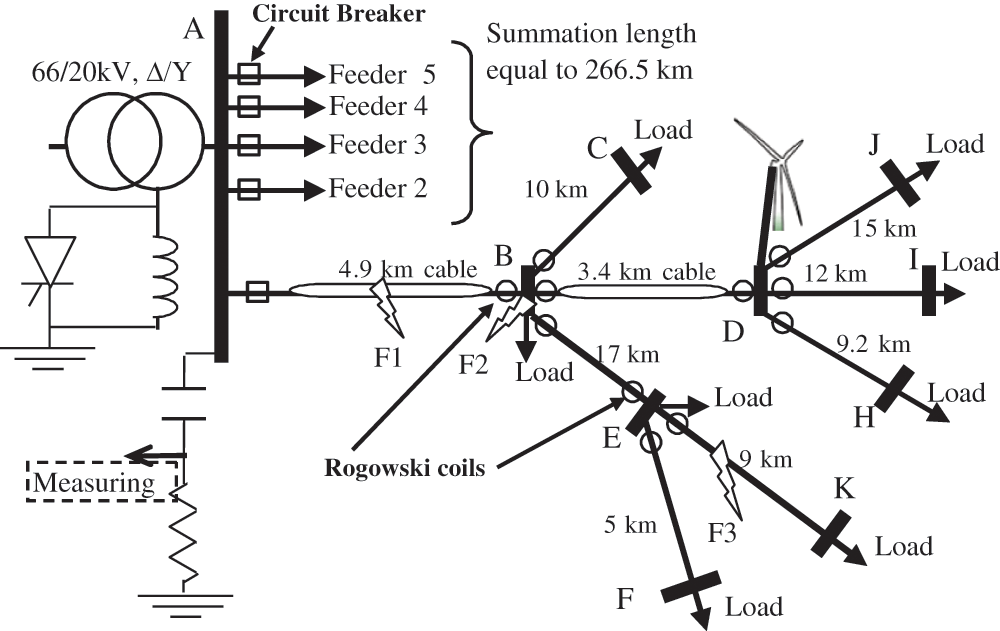
Figure 1: Typical suburban compensated distribution feeder involving Rogowski coils and wind turbine
At the main busbar, the active traveling waves of the voltage waveforms were used to estimate the fault distance. Accordingly, the R-C branch was utilized as a transducer to capture the voltage traveling waves at busbar A. The transducer parameters are 0.01 μF capacitor and 100 Ω resistor [16]. However, the voltage traveling surges at busbars B, D, and E did not help estimate fault direction and the faulted section. Current traveling waves could be helpful in this task. Accordingly, the Rogowski coils were assumed as distributed in the distribution feeder as shown in Fig. 1. The distributed Rogowski coils were installed at the branches of the main busbars B, D, and E. However, coils were not installed at the end busbars, such as busbars C, J, I, H, F, and K, because the current reflection coefficient is approximately negative 1 at these busbars; accordingly, the Rogowski coils captured no traveling surge, due to the considered active traveling waves. The DFIG, Rogowski coil, active neutral switching traveling waves, and the concept of utilized traveling-wave fault location distributed at the main busbars are discussed below.
Recently, many energy conversion systems have been tested at wind farms, which depend mainly on wind turbines and electric machines associated with electric power devices. Practically, there are several energy conversion systems for delivering wind energy into power networks, such as the switched reluctance generator, self-excited induction generator (SEIG), and DFIG. Generally, the induction machine has well-known electric applications, unlike the reluctance machine. However, additional reactive power compensation systems must be associated with SEIG installation for wind applications. Accordingly, the DFIG is preferred as it has the further advantage of synchronous machine operation with a grid interconnection. Furthermore, the DFIG facilitates obtaining the maximum energy under conditions of variable wind speed while achieving controllability of active and reactive power interconnected with electric power grids [17].
The DFIG is constructed from a wound rotor induction machine, where the stator and rotor windings are dynamically fed, as shown in Fig. 2a. The machine stator windings are directly connected to the grid voltages through a power transformer. However, the rotor windings are interacted with the grid using two sequential converters called a rotor side converter and a grid side converter. The DFIG is efficiently controlled under sub-synchronous and super-synchronous speeds by controlling these two converters via the availability of bidirectional power transfer. Accordingly, the variable speed wind operations of the DFIG are ascertained. The mathematical model of the induction machine is summarized in Seta [18], and Tab. 1 shows the machine parameters. Seta [18] presented a detailed model and representation of the 5-MW DFIG and implemented these using the ATPDraw program. This ATPDraw representation of the DFIG is available at no cost in the ATPDraw examples [19]. Accordingly, the ATPDraw circuit of the 5-MW DFIG shown in Fig. 2b is paired with the compensated distribution network under study, as shown in Fig. 1. The wind generation conversion system, based on the 690-V, 5-MW DFIG, is interconnected with the distribution network using a 0.690/20-kV power transformer of connection delta/star unearthed to conserve the earth fault compensation functions installed at the neutral of the main power transformer using the Peterson coil.
Table 1: Induction machine parameters simulated and reported in Seta [18]
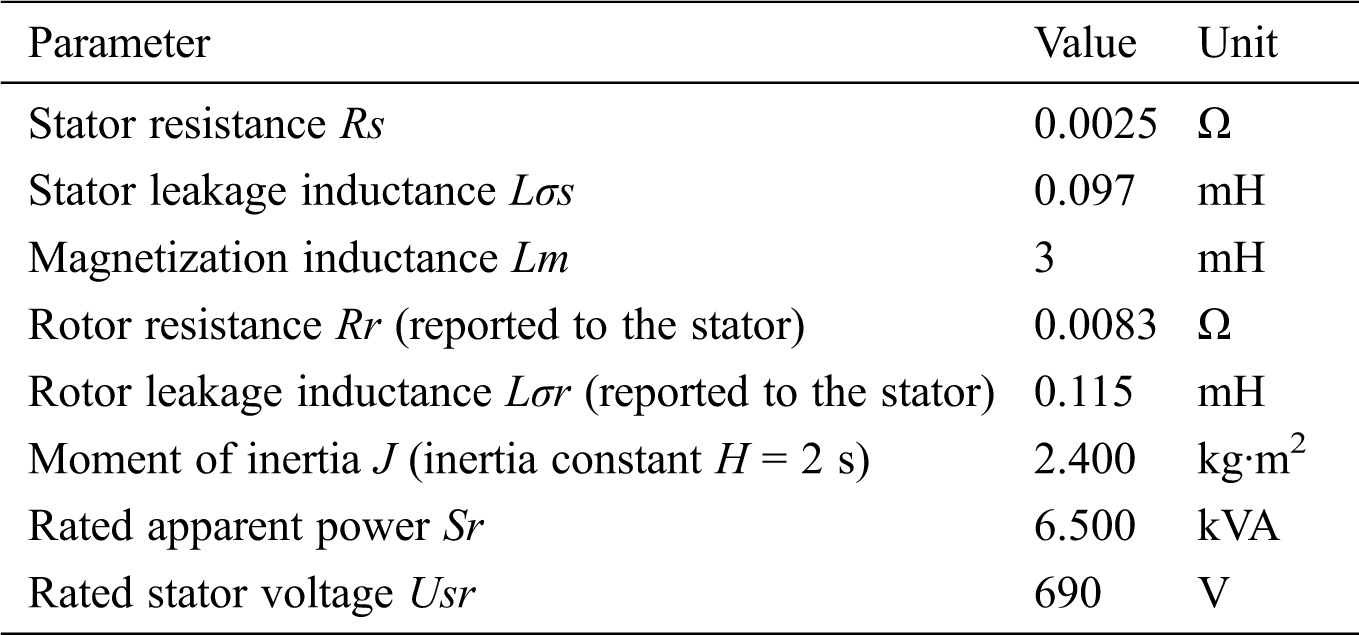
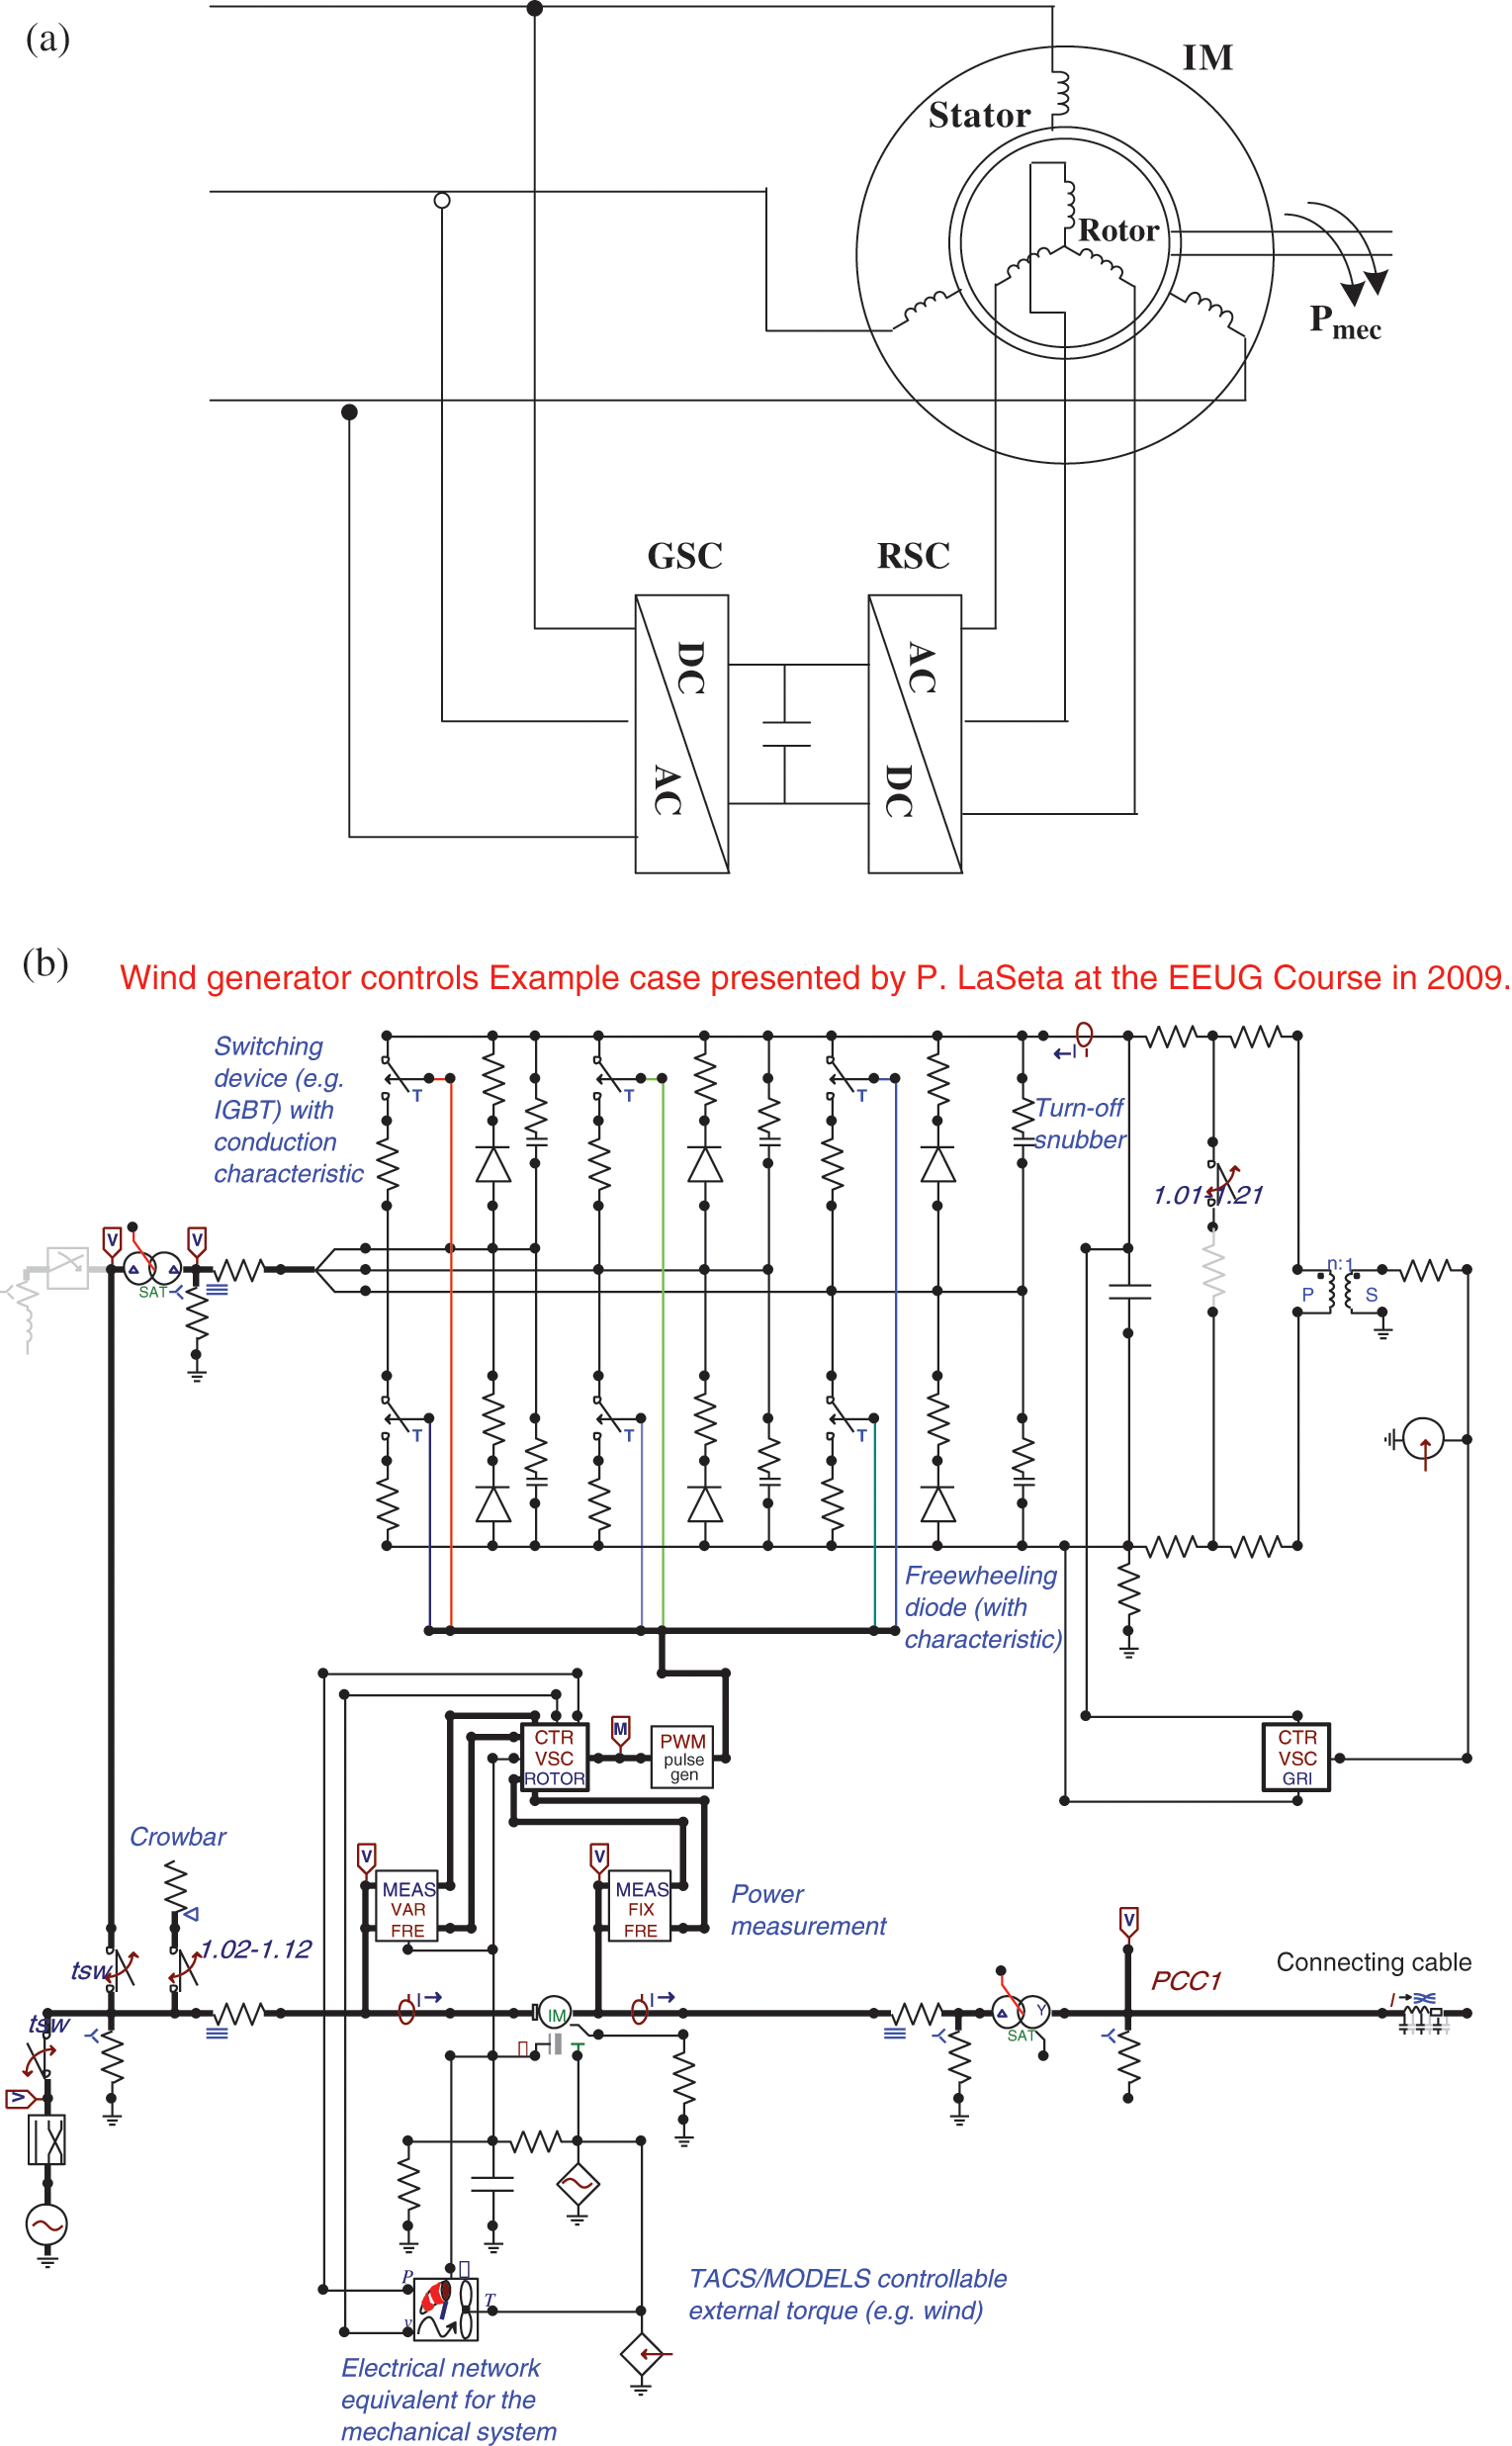
Figure 2: DFIG. a) Generation construction and b) ATPDraw circuit
The Rogowski coil is a well-known transducer for high voltage applications, specifically at high frequencies. Moreover, the Rogowski coil is wound with a toroidal shape (with N turns and cross-section A) on a nonmagnetic core clipped around the current-carrying conductor i(t). Its output voltage is proportional to the derivative of the current i(t) as:
where Mc is the mutual inductance between the current-carrying conductor and the Rogowski coil. The Rogowski coil is used to measure current with wide bandwidths. In addition, the use of electronic devices facilitates the application to the measurement of low amplitude currents [20] with several advantages, including excellent transient response, no dissipated power, ease of use, and low cost [21]. Accordingly, the Rogowski coil is a superior choice for numerous applications specific to smart grids.
To investigate the performance of the Rogowski coil in traveling-wave applications, its accurate modeling is extremely important. This modeling can be categorized as models based on frequency measurements [22], lumped models [23,24], and distributed models [25]. The proposed fault management depends on traveling waves that are high-frequency transients in the range of frequencies higher than 1 MHz. The Rogowski coil is carefully selected from the coils group presented in Rohani et al. [26], where the resonance frequency of this coil is 3.4 MHz. Accordingly, this Rogowski coil is found appropriate for monitoring traveling-wave surges due to faults. Moreover, the rectangular shape of the Rogowski coil presented in Rohani et al. [26] is recommended due to its high sensitivity. This coil was modeled using the measured lumped parameters resistance R1 = 0.1922 Ω, inductance L1 = 2.5 μH, and capacitance C1 = 41.21 pF including the calculated mutual inductance Mc = 4.6825 μH. Fig. 3 depicts the simulated ATPDraw circuit of the Rogowski coil. The current coupling into the Rogowski coil turns is implemented in ATPDraw using a probe for passing the transient current information to the transient analyses control system (TACS). The mutual inductance and current derivatives are implemented using a simple derivative transfer function in TACS to control the voltage source energizing the Rogowski coil equivalent circuit (resistance R1, inductance L1, and capacitance C1). Finally, terminal resistance is represented. This Rogowski coil is repeated at laterals of busbars B, D, and E.
As shown in Fig. 1, the distribution networks are of heterogeneous type. However, the Rogowski coils are distributed to monitor the traveling waves caused by faults, which are common, and not partial discharge. Moreover, the proposed fault management function depends on the aerial-mode calculation, described in the following subsection. Accordingly, the traveling waves incorporated in each phase current are objectively monitored using the Rogowski coil, where the Rogowski coil is installed for each phase of either the overhead lines or underground cables. For overhead lines, installing the Rogowski coils is straightforward. For underground cables, the Rogowski coils are installed at the network laterals where the cable terminals are above ground, to connect to the load transformers or the line section.
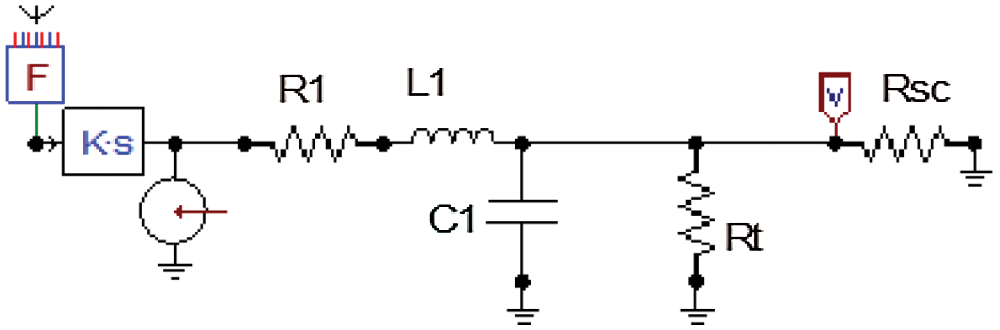
Figure 3: ATPDraw circuit of the distributed Rogowski coils
2.4 Neutral Switching Traveling Waves
Neutral switching traveling waves were used to estimate the fault distance in unearthed and compensated distribution networks [16]. As shown in Fig. 1, the neutral point was switched using a thyristor at the peak of the neutral voltage to create the highest traveling surge. Accordingly, traveling waves were created equally in each phase and traveled through the feeder. The traveling of three equal surges in the three phases produced the Clarke representation-based aerial and zero modes as follows [27]:
where the created surges va, vb, and vc are created equally at the instant of neutral switching. Accordingly, the α-mode value in (1) is zero, although surges were created and traveled through the faulted feeder. However, traveling-wave discontinuity is observed at the fault point, which reflected a surge that accordingly appeared in the α-mode. Therefore, fault distance can be estimated by monitoring the first arrival surge in the calculated aerial mode after the neutral switching instant, which can indicate fault distance df by:
where c is the propagation speed of the traveling wave; Δt is the time difference between the reflected fault surge and the neutral switching instant; t0 is the stamped instant of neutral switching executed by triggering the thyristor (Fig. 1); and ts is the stamped instant of the arrived reflected fault surge using α-mode waveform. Additional details on fault location performance using active traveling waves created by neutral switching were reported in Elkalashy et al. [16]. One of the advantages of these techniques is that the traveling-wave creation instant is controlled and well known. For neutral switching traveling-wave creation, the neutral switching instant can be estimated using the zero-mode waveform as the switching surges effectively attained in the zero mode, as in (2). By contrast, the fault-reflected surge is directly estimated using the aerial-mode waveform (α-mode of Clarke components). Accordingly, the time difference between surges extracted from aerial- and zero-mode waveforms represent Δt in (4).
2.5 Incorporating Rogowski Coil and Active Traveling Waves in the Fault Selectivity Function
Starting from the faulted feeder, the measuring transducers at busbar A serve to monitor the voltage waveforms, as shown in Fig. 1. The reasoning behind using voltage transducers is that no traveling wave exists in the current waveforms when only the faulted feeder is connected at busbar A. In other words, at least two feeders exist, where one of them is healthy and connected at busbar A for current traveling-wave availability in the faulted feeder. However, the traveling waves in the voltage waveforms can be monitored at busbar A, regardless of the connected feeder, with lower values at a higher number of connected parallel feeders at busbar A.
If the voltage transducers are used and installed at busbar A to extract the traveling surges and to estimate fault distance, then the voltage waveforms cannot support estimation of the fault direction at the lateral busbars, such as busbars B, D, and E. However, the current transient waveforms should be investigated at the lateral busbars for fault direction estimation. For an example considering fault case F3 as depicted in Fig. 1, the estimated fault distance is determined by the traveling waves using (4). However, faulted section EK could not be determined. Therefore, transient current directionality at lateral busbars B and E remains to be evaluated, with the aid of the proposed allocated Rogowski coils around these busbars. At busbar B, the fault direction estimation is implemented in the direction of section BE. Furthermore, the fault distance can be updated from busbar B using the measurements of Rogowski coils installed at busbar B. The estimated distance from busbar B is also based on the time difference between the first surges in the aerial- and zero-mode waveforms concerning the neutral switching using, however, the distributed Rogowski coils measurements. This result is evaluated using test cases in Section 4, particularly declaration of fault case F3. Therefore, a communication system should exist between the primary and secondary substations, specifically at lateral busbars, such as busbars B, D, and E for the faulted feeder under study. This is accomplished by assuming agents at these substations. The fault management process based on active traveling-wave incorporation is discussed below.
3 Proposed Fault Management Control Using Active Traveling Waves
To reduce outage times of electrical distribution systems due to fault events and maintenance, a reliable fault management strategy is applied. The concerns of fault diagnosis, fault localization (simultaneous handling of different faults), fault isolation (automatic isolation after fault localization), and finally system restoration occur within a short time. These tasks are implemented using suitable controls and with the aid of the communications system incorporated in the smart system of the electric grid. Fault management represents intelligent dynamic merging of all these concerns. Based on the repair time of the faulted section, system restoration is accomplished quickly with replacement equipment.
Implementation of the proposed fault management control depends on the presence of distributed agents in the distribution network. An installed agent is assumed at each lateral busbar (secondary substation), such as the agents at busbars B, D, and E shown in Fig. 4. The agent is a microprocessor-based intelligent system that can receive messages, analyze information, take actions such as evaluating measurements, provide decisions such as estimating the fault direction, and implement actions such as updating corresponding agents at primary or secondary substations [9]. Bidirectional direct communication is also assumed to be available between the agent at the primary substation and each distributed agent through the faulted feeder, as shown in Fig. 4 [10]. Furthermore, bidirectional communication exists between agents at substations B and D and between substations B and E. Accordingly, the fault management procedure is activated when a fault is detected. The fault management process is then implemented using the active traveling waves of the neutral switching. However, the faulted section isolation process differs with regard to the traveling-wave creation method. Although faulted section estimation occurs when the distribution network is in service, the faulted feeder is isolated considering the available distributed breakers. Then, the determined switches are opened to disconnect the faulted section.
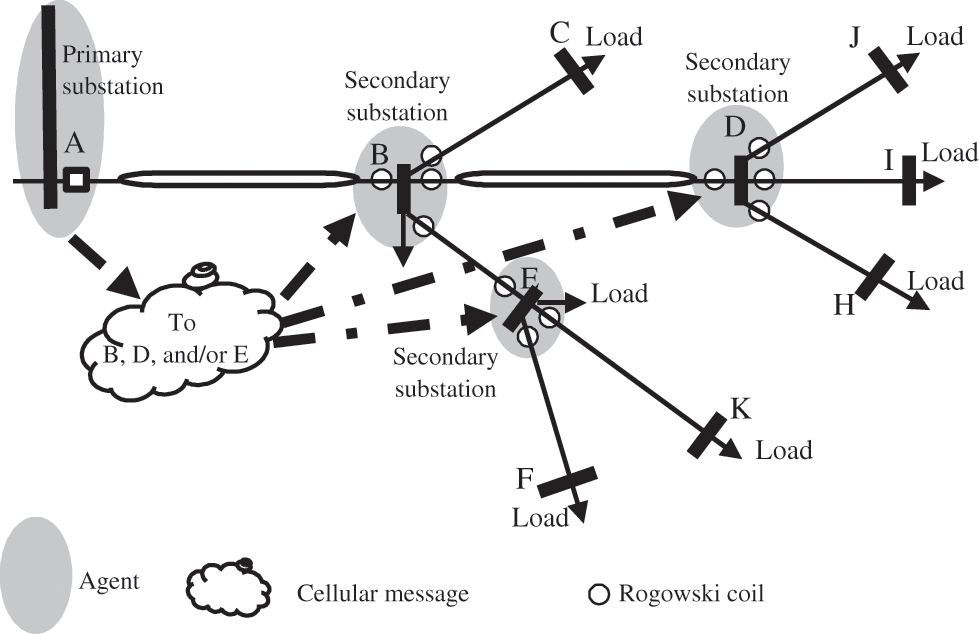
Figure 4: Schematic of autonomous agent-based control
3.1 Substation Agent Activities
Fault management activities involve two concepts of substation agents, that is, the agent at the primary substation and that at the secondary one. As several secondary substations exist, the secondary substation agent is repeated to cover the distribution network. Primary substation agent activities are discussed as follows and as shown in Fig. 5a:
1. Send an initiation message to agents at lateral busbars B, D, and E to wait and record the corresponding active traveling waves.
2. Create active traveling waves in either of the neutral switching events for the in-service faulted feeder.
3. Record the time stamp of the first traveling wave monitored in aerial- and zero-mode waveforms.
4. Calculate the fault distance df.
5. Estimate the faulted section AB if the estimated fault distance is within section AB length.
6. Send a message to the agent of the secondary substation at busbar B if the estimated fault distance is close to or greater than section AB length (LAB) to investigate the measurements of its Rogowski coils, calculate the time difference, estimate the fault distance, and evaluate fault directionality as illustrated in Section 4.
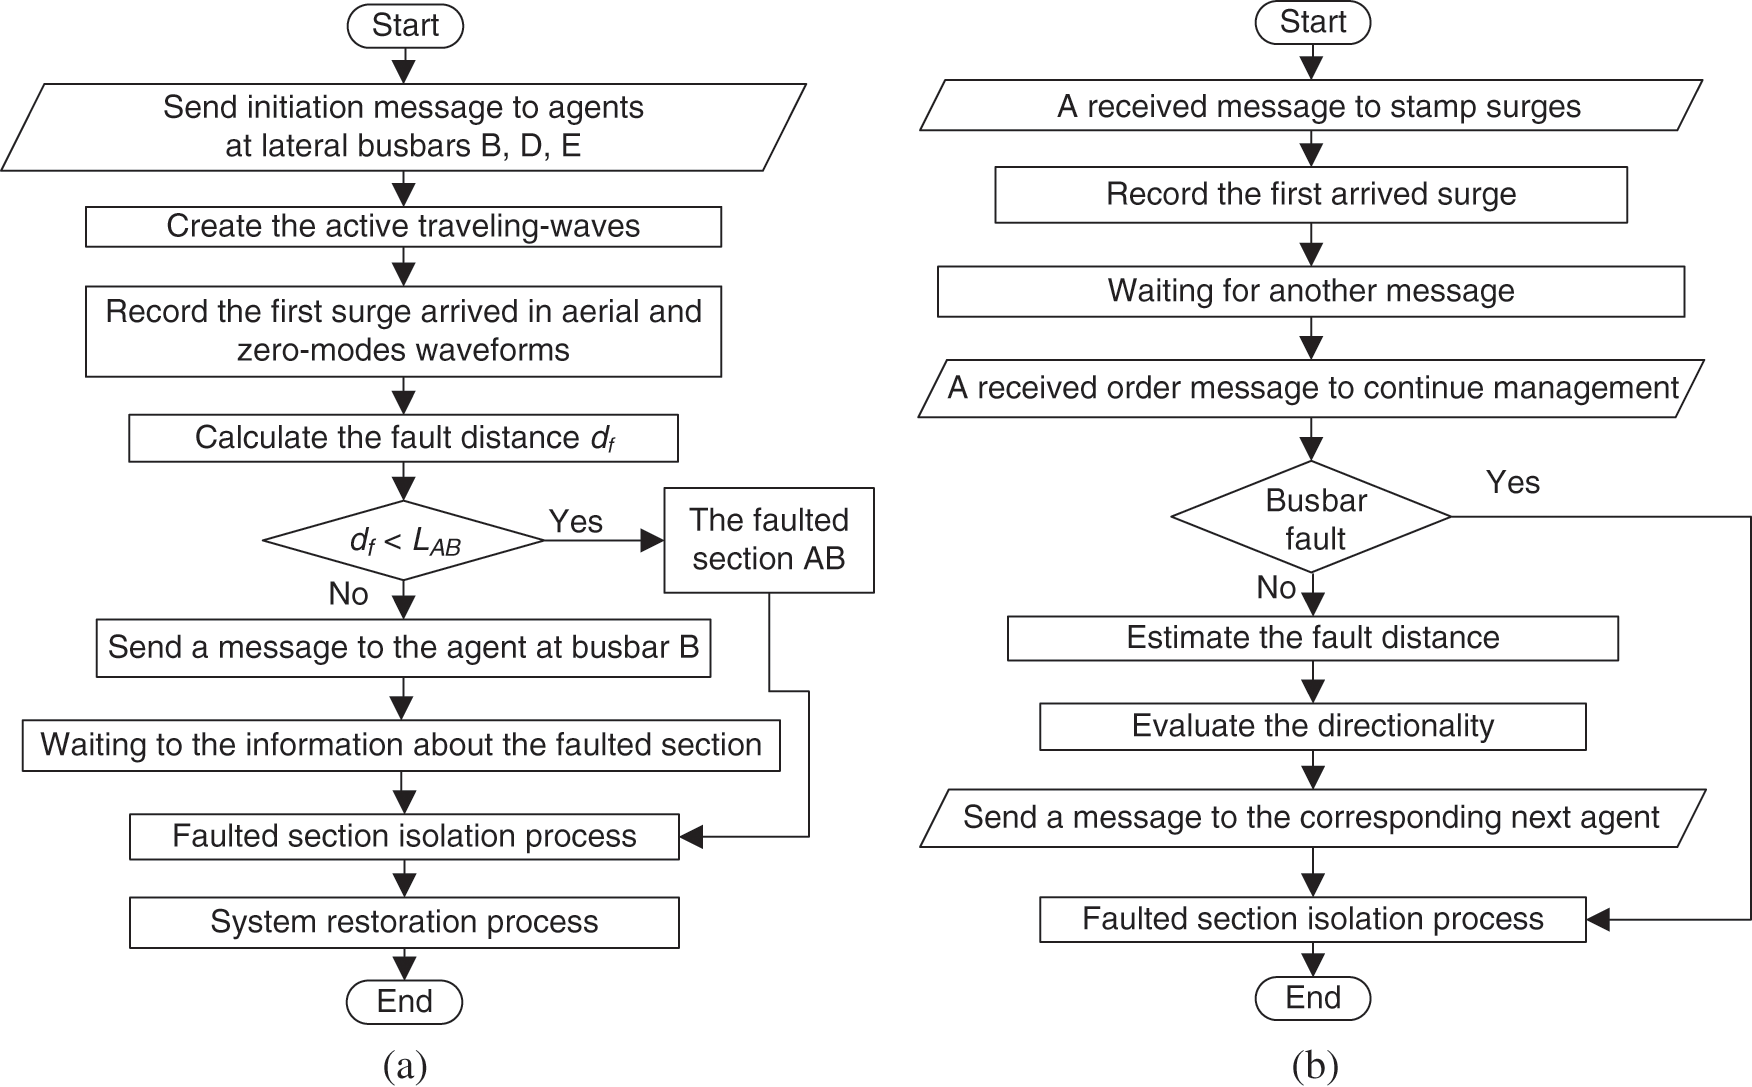
Figure 5: Agent activities during fault management. a) Primary substation using voltage traveling-waves, and b) Secondary substation using Rogowski coil measurements
Fig. 5b shows the secondary substation agent activities in the fault management process, in which the agent at secondary substation B is considered as an example:
1. Send an upstream message to wait and record the corresponding transients due to neutral switching.
2. Record the first arrival surges in aerial and zero modes.
3. Wait for another upstream message to either open the switch if the faulted section is AB or further evaluate using the recorded data if the fault is not in section AB.
4. If the message is to evaluate the measurements, estimate the fault conditions in either busbar or downstream fault.
5. If the fault is at the first busbar, inform the primary substation.
6. If the fault occurs downstream, estimate the fault distance and then the fault direction.
7. Under the estimated fault condition, communicate with the corresponding substation agent.
3.2 Management Procedure Overview for Fault Cases
The fault management procedure expected for any fault in the first section AB is easily recognized. However, the fault management procedure for faulted busbar B (fault case F2), as an example, needs further declaration as follows:
1. The first message is sent from the primary substation to all agents to wait for the traveling waves.
2. As the traveling waves are created and the fault distance estimation is close to the busbar B location, the second message is sent to the agent at busbar B to evaluate its measurements.
3. The agent at busbar B finds a zero difference time between zero and aerial modes, and the transient directionality confirms that the fault is at busbar B.
The management procedure for faulted section EK (fault case F3) is as follows:
1. Send initiation messages to activate the feeder agents.
2. As the estimated fault distance using the active traveling waves at the primary substation is greater than the length of section AB, a message is sent from the primary substation to the agent at substation B to evaluate its Rogowski coil measurements to estimate the fault direction and fault distance from busbar B.
3. As the estimated fault direction at busbar B is in the direction of section BE and the estimated fault distance is greater than the length of section BE, a message is sent from substation B to substation E to evaluate the measurements of the Rogowski coils at busbar E to determine fault direction and distance.
4. As the estimated fault direction using the measurements at busbar E is at section EK and the estimated fault distance is within section EK, fault management then concerns the suitable isolation procedure.
4 Evaluation of Transient Features Extracted by Distributed Rogowski Coils
4.1 Fault Case F1 at 2.5 km in Section AB
Assuming a fault case at 2.5 km and considering the active traveling-wave concepts (neutral switching), Fig. 6 shows the corresponding performance of measuring the aerial- and zero-mode waveforms through the RC transducer branch. In Fig. 6, the zero mode appears at the instant of neutral switching at 1 ms, whereas the reflected fault surge is extracted using the aerial mode at 1.0332 ms. Accordingly, the time difference is 0.0332 ms, which is converted to fault distance using (2), that df = 0.0332 × 150.7/2 = 2.501 km, where cable propagation speed 150.7 km/ms is estimated using the cable parameters simulated via the line/cable constant model. Thus, the fault is in the first section, and the remote switches at busbars A and B are operated to disconnect the faulted section AB when the feeder is unenergized.
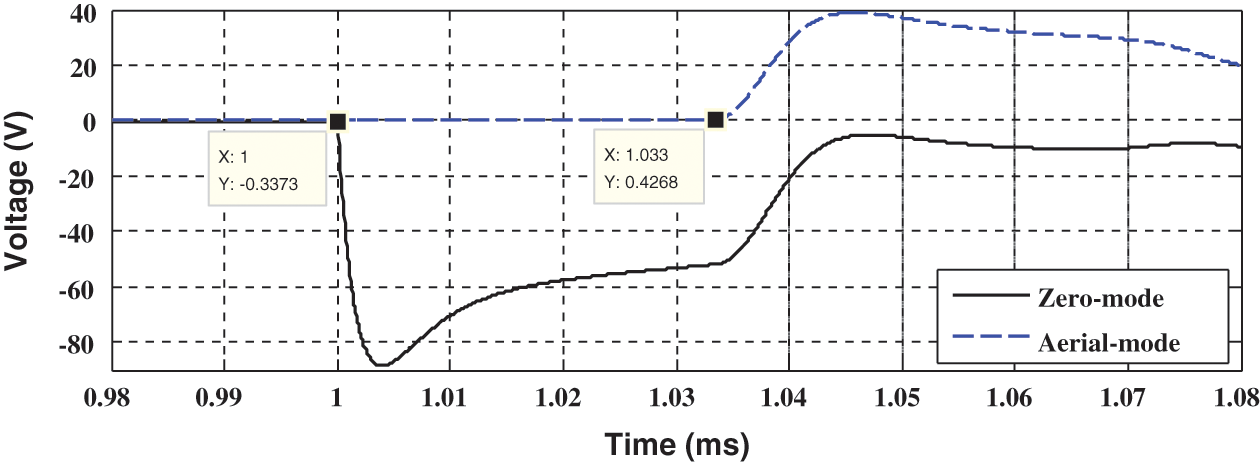
Figure 6: Performance for fault distance 2.5 km using aerial and zero modes over the RC-monitored voltages (Δt = 0.0332 ms)
4.2 Fault Case at 4.9-km Busbar B
For the fault case at busbar B (4.9 km), Fig. 7 shows the performance of aerial and zero modes measured through the RC transducer branch, where the surge arrives after 0.0653 ms. We convert this time difference into distance, df = 0.0653 × 150.7/2 = 4.92 km, which means the fault is close to busbar B. However, confirmation of fault location is attained from the Rogowski coil measurements at busbar B, as shown in Fig. 8. In Fig. 8a, the aerial and zero modes are instantaneously measured using the Rogowski coils, and it is ensured that the fault is at busbar B. Furthermore, the results presented in Fig. 8b show the same directionality of the downstream Rogowski coil outputs, which are in the opposite direction to the upstream Rogowski coil. This method ensures that the fault is at busbar B from the Rogowski coil waveforms in Figs. 8a and 8b, and the output voltages are recognizable values with multiple voltages for neutral switching. Therefore, noise has a negligible effect on these measurements regardless of Rogowski coil application for partial discharge.
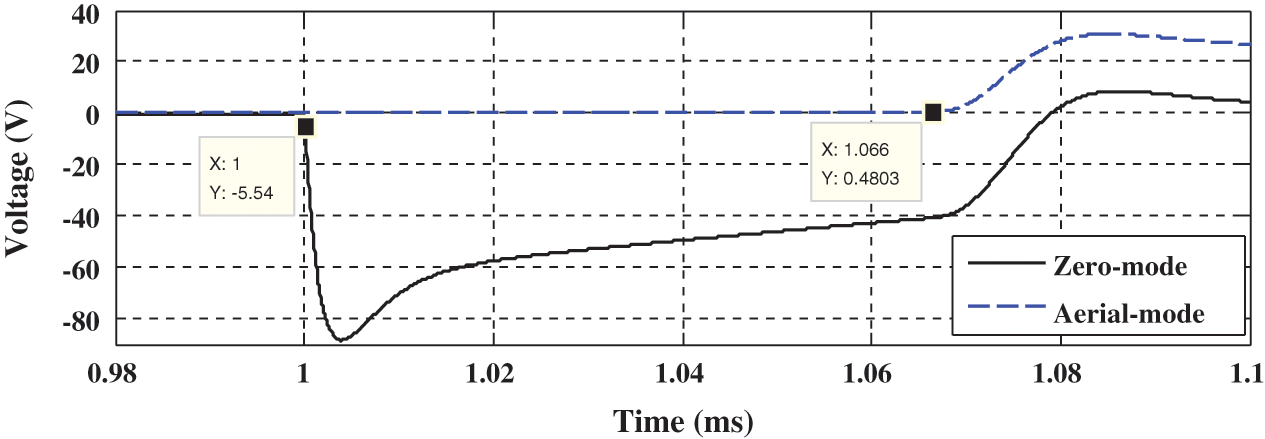
Figure 7: Performance for fault distance 4.9 km at busbar B using aerial and zero modes over the RC monitored voltages (Δt = 0.0653 ms)
4.3 Fault Case at 26.9 km in Section EK
Fig. 9 shows the performance of aerial and zero modes measured through the RC transducer branch, where the surge arrives after 0.2187 ms. This result indicates that the fault is after busbar B. Fig. 10a shows the aerial and zero modes, which are measured using upstream Rogowski coils installed at the substation B agent (Rogowski coil at the end of section AB). The difference time between the aerial and zero modes is 0.1574 ms. The advantage of this time difference is that it is measured with no additional time synchronization.
Fig. 10b depicts the corresponding performance when directionality is evaluated for the Rogowski coil output at branches connected at lateral busbar B. In this figure, the directionality of the aerial mode for neutral switching is utilized. The fault is in the direction of branch BE, as the same directionality is attained between the reference Rogowski coil output and the fault direction coil output. However, the time difference computed in Fig. 10a indicates that the fault is behind busbar E. Accordingly, the next evaluation is of the measurements at busbar E.
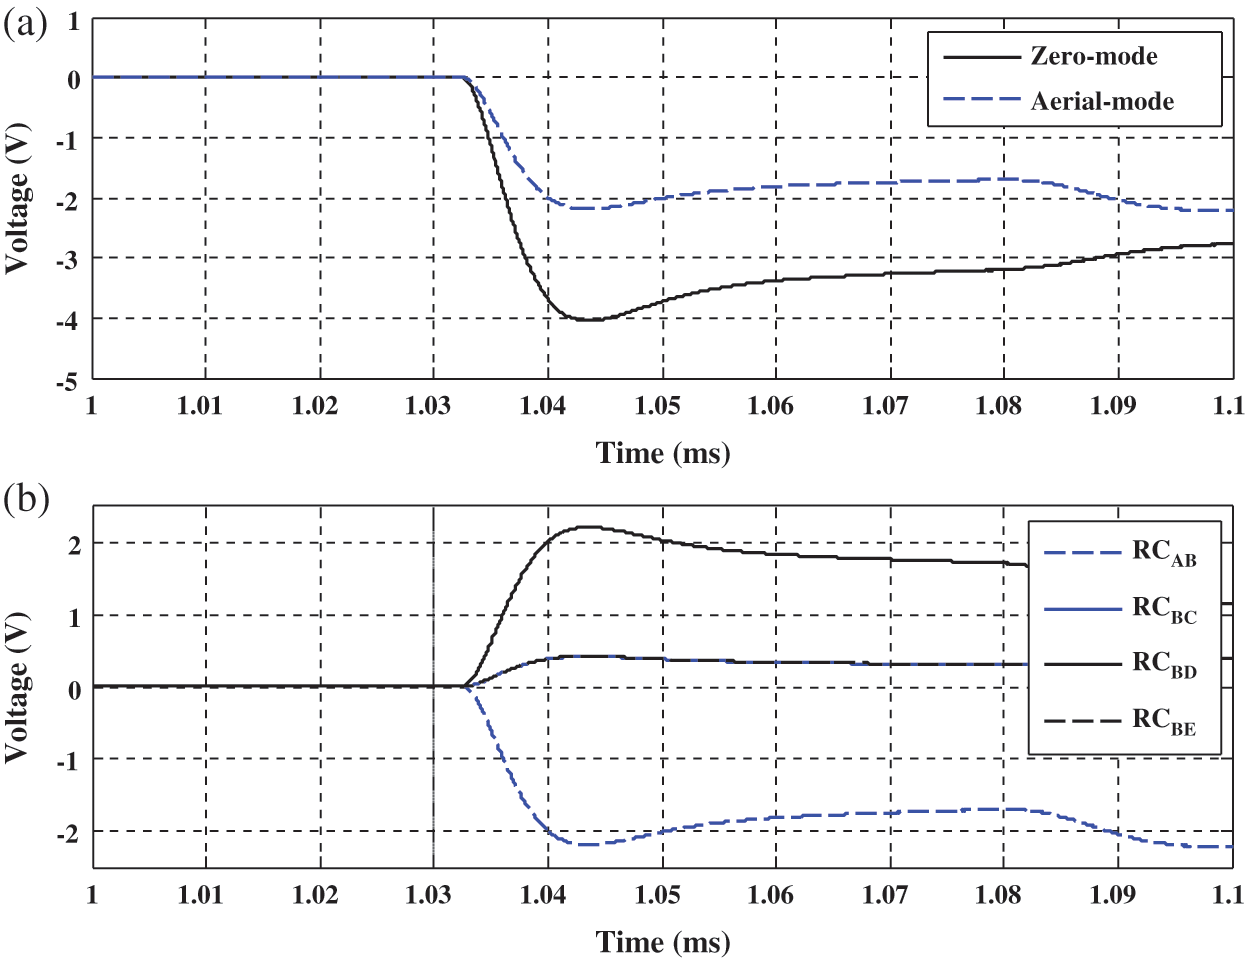
Figure 8: Rogowski coils at faulted busbar B. a) Aerial and zero modes over the Rogowski coil at faulted busbar B (at the end of section AB), where Δt = zero ms and b) Directionality evaluation of Rogowski coils at faulted busbar B
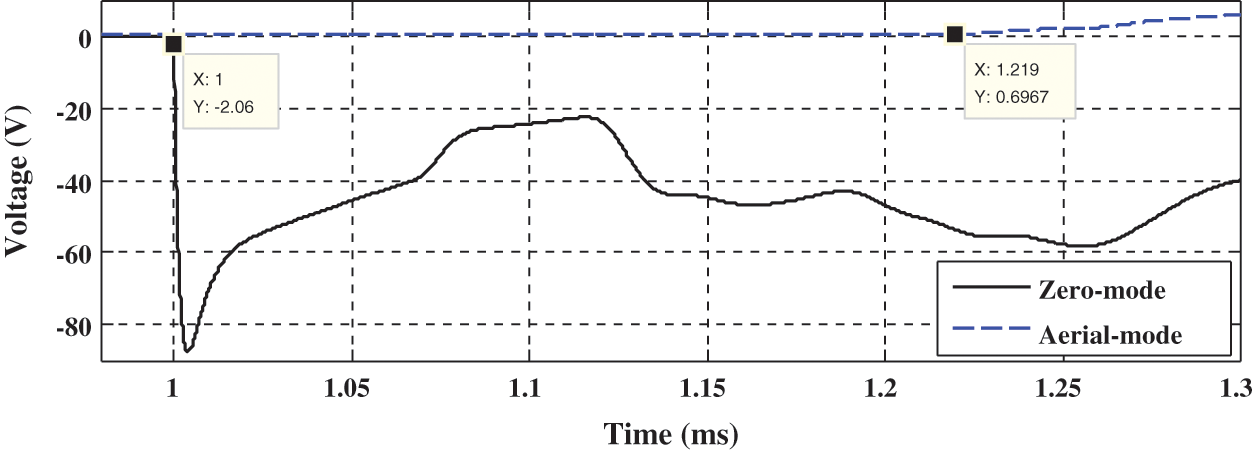
Figure 9: Aerial and zero modes over the RC-monitored voltage for fault distance 26.9 km (Δt = 0.2187 ms)
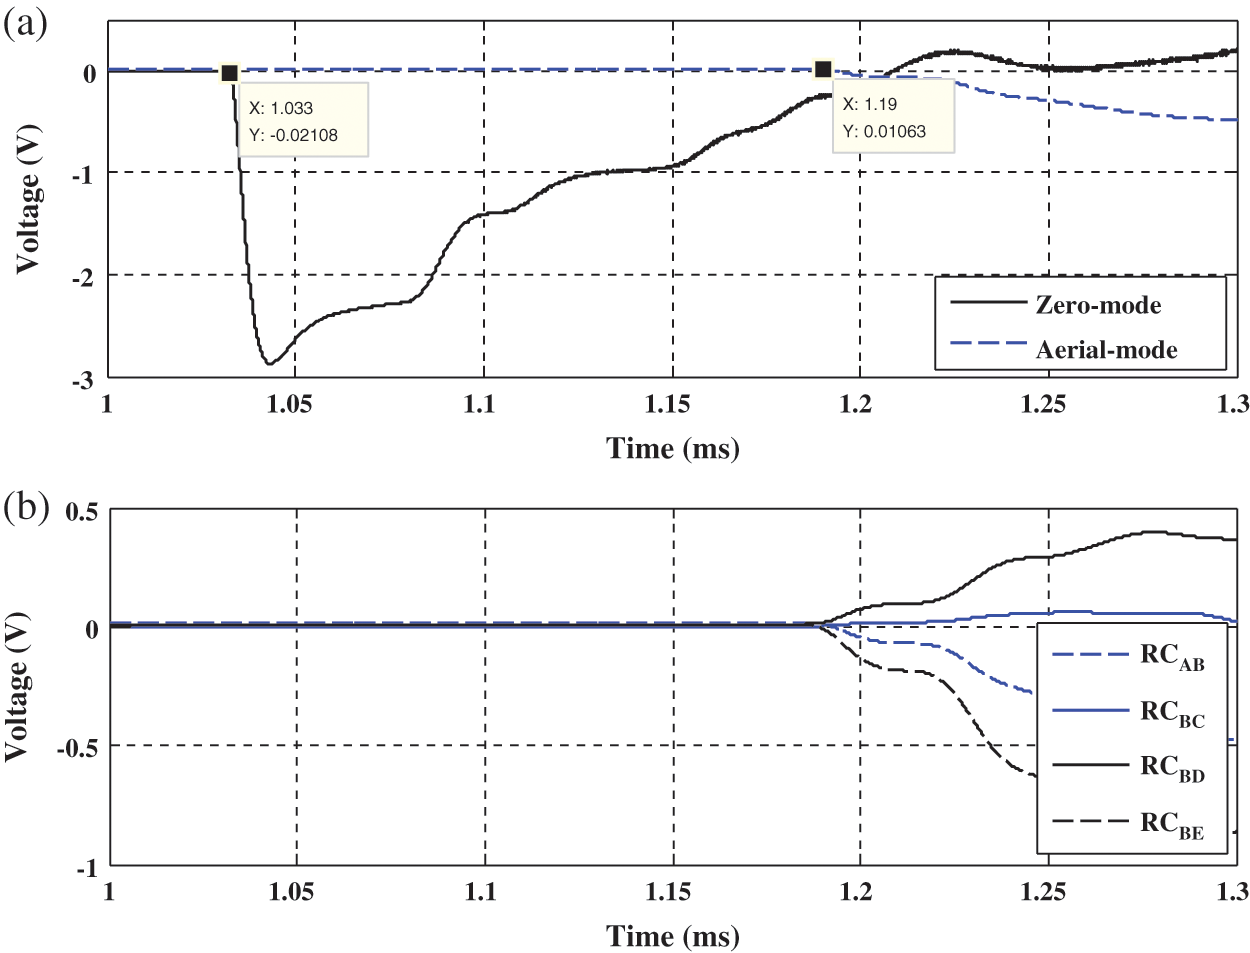
Figure 10: Rogowski coils measurements at busbar B for fault distance 26.9 km. a) Aerial and zero modes over the Rogowski coil at busbar B (at the end of section AB) for fault distance 26.9 km (Δt = 1.1899−1.0325 = 0.1574 ms) and b) Directionality evaluation of Rogowski coils
Fig. 11a shows the aerial and zero modes of the Rogowski coil installed at the end of section BE. From the results shown in this figure, a time difference of 0.0343 ms is observed, which ensures that the fault is after busbar E. Fig. 11b depicts the directionality evaluations of the Rogowski coils installed close to busbar E. The results confirm that the fault is in the direction of section EK. Considering the time difference between the aerial and zero modes as depicted in Fig. 10a, the fault distance is df-E = 0.0343 × 294.2/2 = 5.042 km from busbar E. Accordingly, the remote switches of section EK can be opened after disconnecting the feeder to implement the fault management process.
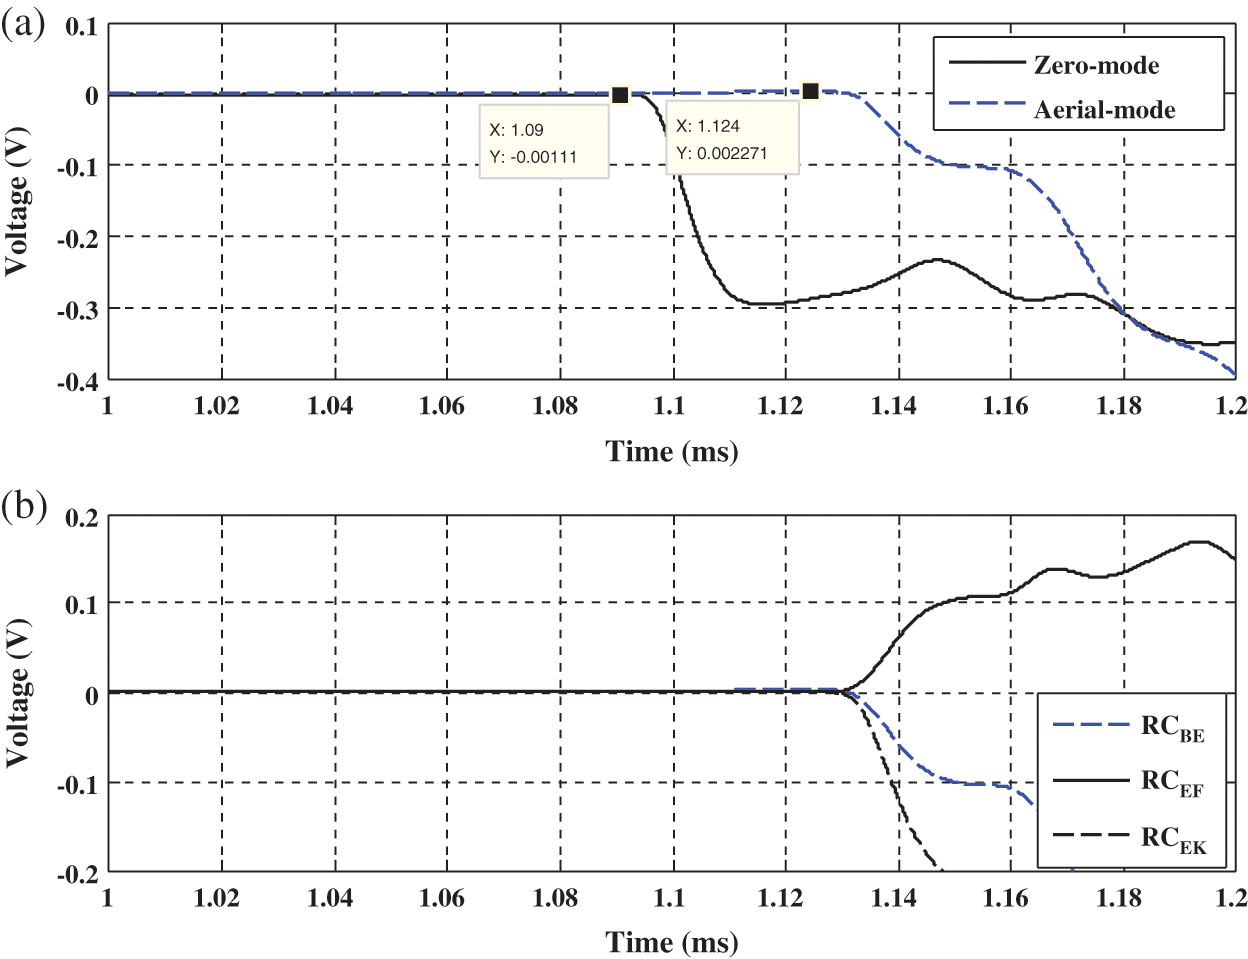
Figure 11: Rogowski coils measurements at busbar E for fault distance 26.9 km. a) Aerial and zero modes over the Rogowski coil at busbar E (at the end of section BE) (Δt = 1.1238−1.0895 = 0.0343 ms) and b) Directionality evaluation of Rogowski coils at busbar E
In this study, the active traveling-wave fault location is incorporated into fault management in smart distribution networks associated with a wind-driven distributed generation unit (DFIG). In addition, distributed agents are considered. Traveling-wave surges are extracted using distributed Rogowski coils. The results confirm the applicability of using Rogowski coils for traveling-wave applications in fault location determination and for fault management in smart distribution grids. Rectangular-shape Rogowski coils are used, where the output voltages are recognizable. Concerning the active traveling waves created by neutral switching, the faulted section is successfully estimated using the Rogowski coils, and fault management is then implemented using the distributed measurements of the active traveling waves with the advantage of utilizing the first active surge monitored in aerial and zero modes. From performance evaluation, the zero mode calculated from the Rogowski coil outputs of the three phases can be used to estimate the active traveling-wave starting instant. On the contrary, the aerial mode could be used to estimate the arrival surge from the fault point. Accordingly, the time difference between the zero and aerial modes can be applied to estimate the fault distance from the measuring busbar. By comparing the estimated fault distance and section length, a faulted section estimation can be obtained. Furthermore, fault directionality is attained using the Rogowski coil outputs. The results confirm the efficiency of the proposed fault management procedure for compensated distribution networks associated with distributed generation units.
Acknowledgement: This study was funded by the Deanship of Scientific Research, Taif University, KSA [Research project number 1-441-99]. The first author is grateful for discussions with Professor Matti Lehtonen, Aalto University. The authors also thank LetPub (www.letpub.com) for its linguistic assistance during the preparation of this manuscript.
Funding Statement: This study was funded by the Deanship of Scientific Research, Taif University, KSA [Research project number 1-441-99].
Conflicts of Interest: The authors declare that they have no conflicts of interest to report regarding the present study.
1. T. P. S. Bains, T. S. Sidhu, Z. Xu, I. Voloh and M. R. D. Zadeh. (2018). “Impedance-based fault location algorithm for ground faults in series-capacitor-compensated transmission lines,” IEEE Transactions on Power Delivery, vol. 33, no. 1, pp. 189–199. [Google Scholar]
2. T. P. S. Bains and M. R. D. Zadeh. (2016). “Supplementary impedance-based fault-location algorithm for series-compensated lines,” IEEE Transactions on Power Delivery, vol. 31, no. 1, pp. 334–342. [Google Scholar]
3. K. Jia, T. Bi, Z. Ren, D. W. P. Thomas and M. Sumner. (2018). “High frequency impedance based fault location in distribution system with DGs,” IEEE Transactions on Smart Grid, vol. 9, no. 2, pp. 807–816. [Google Scholar]
4. E. R. Sanseverino, V. L. Vigni, A. D. Stefano and R. Candela. (2019). “A two-end traveling wave fault location system for MV cables,” IEEE Transactions on Industry Applications, vol. 55, no. 2, pp. 1180–1188. [Google Scholar]
5. R. Benato, S. D. Sessa, M. Poli, C. Quaciari and G. Rinzo. (2018). “An online travelling wave fault location method for unearthed-operated high-voltage overhead line grids,” IEEE Transactions on Power Delivery, vol. 33, no. 6, pp. 2776–2785. [Google Scholar]
6. O. Naidu and A. K. Pradhan. (2019). “A traveling wave-based fault location method using unsynchronized current measurements,” IEEE Transactions on Power Delivery, vol. 34, no. 2, pp. 505–513. [Google Scholar]
7. D. S. Popovic and E. E. Boskov. (2008). “Advanced fault management as a part of smart grid solution,” in CIRED Seminar 2008: SmartGrids for Distribution, IET, 23–24 June 2008, Frankfurt, Germany, pp. 1–4. [Google Scholar]
8. M. Lehtonen, A. Matsinen, E. Antila and J. Kuru. (2000). “An advanced model for automatic fault management in distribution networks,” in 2000 IEEE Power Engineering Society Winter Meeting. Conference Proceedings (Cat. No.00CH37077IEEE, 23–27 Jan. 2000, Singapore, vol. 3, pp. 1900–1904. [Google Scholar]
9. M. M. Nordman and M. Lehtonen. (2005). “An agent concept for managing electrical distribution networks,” IEEE Transactions on Power Delivery, vol. 20, no. 2, pp. 696–703. [Google Scholar]
10. N. G. Tarhuni, N. I. Elkalashy, T. A. Kawady and M. Lehtonen. (2015). “Autonomous control strategy for fault management in distribution networks,” Electric Power Systems Research, vol. 121, pp. 252–259. [Google Scholar]
11. J. S. Dominguez, A. J. C. Junior, D. S. Dominguez, D. Frias and S. M. Iglesias. (2015). “Using a multi-agent system for monitoring indicators of quality of service in power distribution networks,” IEEE Latin America Transactions, vol. 13, no. 4, pp. 1048–1054. [Google Scholar]
12. M. S. Rahman, N. Isherwood and A. M. T. Oo. (2018). “Multi-agent based coordinated protection systems for distribution feeder fault diagnosis and reconfiguration,” International Journal of Electrical Power & Energy Systems, vol. 97, no. 4, pp. 106–119. [Google Scholar]
13. F. H. Malik and M. Lehtonen. (2016). “A review: Agents in smart grids,” Electric Power Systems Research, vol. 131, no. 1, pp. 71–79. [Google Scholar]
14. N. I. Elkalashy and M. Lehtonen. (2014). “Decentralized earth fault selectivity using transient front slopes for unearthed MV networks,” International Journal of Electrical Power & Energy Systems, vol. 63, no. 4, pp. 908–916. [Google Scholar]
15. N. I. Elkalashy, T. A. Kawady, M. G. Ashmawy and M. Lehtonen. (2016). “Transient selectivity for enhancing autonomous fault management in unearthed distribution networks with DFIG-based distributed generations,” Electric Power Systems Research, vol. 140, pp. 568–579. [Google Scholar]
16. N. I. Elkalashy, N. A. Sabiha and M. Lehtonen. (2015). “Earth fault distance estimation using active traveling waves in energized-compensated MV networks,” IEEE Transactions on Power Delivery, vol. 30, no. 2, pp. 836–843. [Google Scholar]
17. M. I. Mosaad, A. Abu-Siada and M. F. El-Naggar. (2019). “Application of superconductors to improve the performance of DFIG-based WECS,” IEEE Access, vol. 7, pp. 103760–103769. [Google Scholar]
18. P. L. Seta. (2009). “Modeling and control of wind turbines based on Doubly-Fed Induction Generators (DFIG),” in EEUG Course, European EMTP-ATP Conference, TU Delft, The Netherlands, , 26-28 October. [Google Scholar]
19. H. H. L. Prickler. (2002). ATPDraw Users’ Manual. SINTEF TR F5680. [Google Scholar]
20. L. Kojovic. (2002). “PCB Rogowski coils benefit relay protection,” IEEE Computer Applications in Power, vol. 15, no. 3, pp. 50–53. [Google Scholar]
21. I. A. Metwally. (2010). “Self-integrating Rogowski coil for high-impulse current measurement,” IEEE Transactions on Instrumentation and Measurement, vol. 59, no. 2, pp. 353–360. [Google Scholar]
22. M. H. Samimi, A. Mahari, M. A. Farahnakian and H. Mohseni. (2015). “The Rogowski coil principles and applications: A review,” IEEE Sensors Journal, vol. 15, no. 2, pp. 651–658. [Google Scholar]
23. M. Shafiq, L. Kutt, M. Lehtonen, T. Nieminen and M. Hashmi. (2013). “Parameters identification and modeling of high-frequency current transducer for partial discharge measurements,” IEEE Sensors Journal, vol. 13, no. 3, pp. 1081–1091. [Google Scholar]
24. G. M. Hashmi, M. Lehtonen and M. Nordman. (2011). “Calibration of on-line partial discharge measuring system using Rogowski coil in covered-conductor overhead distribution networks,” IET Science, Measurement & Technology, vol. 5, no. 1, pp. 5–13. [Google Scholar]
25. V. Dubickas and H. Edin. (2007). “High-frequency model of the rogowski coil with a small number of turns,” IEEE Transactions on Instrumentation and Measurement, vol. 56, no. 6, pp. 2284–2288. [Google Scholar]
26. M. N. K. H. Rohani, C. C. Yii, M. Isa, S. I. S. Hassan, B. Ismail et al. (2016). , “Geometrical shapes impact on the performance of ABS-based coreless inductive sensors for PD measurement in HV power cables,” IEEE Sensors Journal, vol. 16, no. 17, pp. 6625–6632. [Google Scholar]
27. E. Clarke. (1943). Circuit analysis of AC power systems, Vol. I, Symmetrical and related components. New York. John Wiley & Sons, Inc., London, Chapman & Hall, Limited. [Google Scholar]
 | This work is licensed under a Creative Commons Attribution 4.0 International License, which permits unrestricted use, distribution, and reproduction in any medium, provided the original work is properly cited. |