DOI:10.32604/iasc.2021.016933
| Intelligent Automation & Soft Computing DOI:10.32604/iasc.2021.016933 | |
| Article |
A Learning-based Static Malware Detection System with Integrated Feature
1School of Computer and Software, Nanjing University of Information Science and Technology, Nanjing, 210044, China
2Jiangsu Engineering Center of Network Monitoring, Engineering Research Center of Digital Forensics, Ministry of Education, Nanjing, 210044, China
3Department of Internet and Multimedia Engineering, Konkuk University, Seoul, 05029, Korea
*Corresponding Author: Zhiguo Chen. Email: chenzhiguo@nuist.edu.cn
Received: 01 January 2021; Accepted: 08 February 2021
Abstract: The rapid growth of malware poses a significant threat to the security of computer systems. Analysts now need to examine thousands of malware samples daily. It has become a challenging task to determine whether a program is a benign program or malware. Making accurate decisions about the program is crucial for anti-malware products. Precise malware detection techniques have become a popular issue in computer security. Traditional malware detection uses signature-based strategies, which are the most widespread method used in commercial anti-malware software. This method works well against known malware but cannot detect new malware. To overcome the deficiency of the signature-based approach, we proposed a static malware detection system using data mining techniques to identify known and unknown malware by comparing the malware and benign programs’ profiles with real-time response with low false-positive ratio. The proposed system includes a sample labeling module, a feature extraction module, a pre-processing module, and a decision module. The sample labeling module used the VirusTotal to correctly label the collected samples. The feature extraction module statically extracts a set of header information, section entropy, APIs, and section opcode n-grams. The pre-processing module is primarily based on the PCA algorithm used to reduce the dimensionality of the features, thus reducing the overhead costs of computation. The decision module uses various machine-learning algorithms such as K-Nearest Neighbors (KNN), Decision Tree (DT), Gradient Boosting Decision Tree (GBDT), and Extreme Gradient Boosting (XGBoost) to build the detection model for judging whether the program is a benign program or malware. The experimental results indicate our proposed system can achieve 99.56% detection accuracy and 99.55% f1-score on the extracted 79 features using the XGBoost algorithm, and it has the potential for real-time large-scale malware detection tasks.
Keywords: Static analysis; malware detection; machine learning; computer security; principal component analysis
The malicious executable (Malware) such as spyware, Trojans, viruses, worms, etc., are computer programs designed to compromise the machine, steal or damage sensitive information without the user’s permission has become a severe threat to the security of computer systems. The total number of malware has increased from 28.84 million in 2010 to 677.66 million in 2020. The tread is also true that in 2019, 131,449,325 new malware samples were discovered. Recognizing the exponential growth of new malware is a critical challenge in malware detection, and security systems should respond to it.
Many companies and scholars have proposed various malware detection techniques, and malware detection systems using these techniques are broadly classified into two categories: signature-based detection and anomaly-based detection [1]. Signature-based detection techniques use the knowledge of known malware and benign programs to inspect whether the program is malicious. If an unknown program that does not match any signatures appears, the program may not be detected using the signature-based technique. Meanwhile, to identify new programs, signature-based detection approaches need frequently update signatures. The anomaly-based detection technique differs from the signature-based detection technique, which is used to detect known and unknown malware by using the characteristics of the malware itself. If a new program is close to the characteristics of malicious programs, then the program will be treated as malware. Anomaly detection suffers from low detection and high false-positive rates, and it incurs substantial time and memory overhead. Anomaly-based malware detection typically uses data mining and machine learning techniques such as decision tree (DT), Gradient Boosting Decision Tree (GBDT) and K-Nearest Neighbors (KNN), etc., to learn the characteristics of the program. These techniques utilize different features of malware and benign programs such as opcode instruction [2–13], binary [14–18], APIs [14,17,19–25], and PE header information [15,20–23,26–27], etc. to build a classification system to classify a given sample is a malware or benign program.
This paper introduces a data mining approach to detect malware based on integrated features. These features include header information, information entropy, and API as well as opcode n-grams, which are described in Section 3.2. The aforementioned integrated features are extracted from the malware and benign programs before its execution. Our detection system can identify the malware as quickly as possible before infection, with a high degree of accuracy and a lower degree of time overhead. We extract the features using the pefile and distorm3 and then the feature reduction is used for data pre-processing to improve the detection efficiency. Finally, four machine learning algorithms, K-Nearest Neighbors (KNN), Decision Tree (DT), Gradient Boosting Decision Tree (GBDT), and XGBoost, are utilized to verify the performance of our proposed system by using the train-test method. The proposed system compares with the raw and integrated feature set as well as the existing work which employs different kinds of features. The results of the comparison show that our approach can efficiently detect malware with the XGBoost algorithm, reaching a remarkable classification accuracy of 99.56% and a f1-score of 99.55% for detecting known and unknown malware. Compared to other state-of-the-art systems that use hundreds or thousands of features, this system uses 79 features, reduces detection time to 1.54 s per file and improves detection accuracy which has the potential to be used for real-time large-scale malware detection tasks.
Our proposed system addressed malware detection challenges, such as:
a. Based on observations from extensive experiments conducted on real malware and benign programs, we proposed an integrated feature set for malware analysis, which could improve the performance of the malware detection system. The experimental results show that the proposed learning-based system attains high accuracy and f1_scores, even for completely new and previously unseen malware. It also has the potential for real-time analysis.
b. We optimized the runtime of malware detection by adopting the PCA algorithm to reduce unimportant information like relevant and redundant features, retain the main elements and the structure of the original data, providing a trade-off between accuracy and the number of features for the malware detection system. The use of a limited amount of features compared to other state-of-the-art systems so that the method has the potential to be used in large-scale malware detection tasks in real-time.
c. We have adopted XGBoost, the winning solution in machine learning challenges hosted at Kaggle for malware detection. We first proposed and adopted the XGBoost algorithm for detecting malware based on Portable Executable files.
d. Most malware uses PE files that a computer can interpret and execute to infect an operating system. Thousands of distinct features need to be extracted to identify the malware. Our system provides an application to parse the features, including PE header information, section opcode n-grams, APIs, and section entropy of a program and hence the ability for real-time automatic malware detection.
e. We also contributed by proposing to use the section-flag ‘IMAGE_SCN_MEM_EXECUTE’ to extract the opcode instead of extracting the entire opcode from the file. The results of the comparison indicate that the section opcode can achieve better classification performance than the entire opcode. Hence, section opcode should be preferred over the entire opcode for malware classification applications.
The rest of this paper is organized as follows: Section 2 surveys related work, while Section 3 introduces the architecture of our proposed system and discusses the details of different features of the proposed system. The experimental results and analysis are provided in Section 4. Section 5 compares our proposed system with the existing work. Finally, in Section 6, we conclude this work and discuss the proposed system.
Static analysis is a method of examining a computer program without executing it. Hence, the malware could not detect that it was being analyzed, and no possibility of infecting the endpoint system. It also scrutinizes the “genes” of the file, rather than their current behavior, which can be changed or delayed at an unexpected time to evade dynamic analysis. In addition, static analysis is relatively effective and can be performed within a reasonable period. These benefits make static analysis appropriate for detecting malware in anti-malware products. However, the static malware detection system suffers from low detection and high false-positive rates. To overcome this drawback, most existing systems combine many types of features, which incurs substantial time and memory overhead. Therefore, finding an appropriate balance between accuracy and time overhead is a real challenge for constructing a static malware detection system.
The static feature extraction approach used in Schultz et al. [14] extracts a set of static features like the Dynamic Link Library (DLL), strings, API functions, and byte sequence for data-mining-based malware classification. The authors used the RIPPER, Naive Bayes, and Multi-Naive Bayes algorithms on a standardized dataset that includes 3,265 malware and 1,001 benign programs to build a detection system. The proposed system can claim a 97.76% accuracy for the Multi-Naive Bayes classifier with byte sequence. The byte sequences, which extract n-byte sequences from an executable file also result in high accuracy [16–18,28]. Siddiqui et al. [29] presented a novel idea of automatically identifying critical opcode sequences that can classify malicious and benign programs using machine learning techniques such as Logistic Regression, Artificial Neural Networks, and Decision Tree. The evaluation demonstrated that it attained an accuracy level greater than 98.4%. In 2010, Walenstein et al. [15] used a static method that extracted information from the PE header and binary n-grams of the body to distinguish benign and malicious files. Shabtai et al. [30] used the opcode for detecting unknown malware. After extracting the opcode n-gram patterns, they computed the normalized term frequency (TF) and TF Inverse Document Frequency (TF-IDF) for the opcode patterns of each file as features. They then used 8 different classifiers to evaluate their proposed methodology. The results of the evaluation indicate that the system can achieve a high level of accuracy of 96% and a TPR greater than 0.95%. Ding et al. [19] presented a malware detection system based on Objective-oriented association (OOA) mining with APIs. They used document frequency and information gain to select the top 1,000 APIs from 6,181 obtained APIs. The system achieved 91.2% accuracy and a detection rate of 97.3%. Santos et al. [9] used opcode sequences as features for malware detection. They use Mutual Information [31] to measure the weight based on opcode frequency in malware and benign programs. The Weighted Term Frequency (WTF) was computed by the Term Frequency and the calculated weight. Finally, the defined WTF is treated as features to train and test with four different machine learning classifiers. This approach achieved a detection rate of 96% and a false positive rate of 0.05% across an experimental dataset of 1,000 malware and 1,000 benign samples, respectively. In 2013, Baldangombo et al. [20] used the data mining techniques such as Information Gain, Principal Component Analysis, and three classifiers: SVM, J48, and Naïve Bayes to build a static malware detection system. Their experiment shows that the combination of PE header information and API functions (346 features) with the J48 classifier achieved a detection rate of 99.6% and an accuracy of 99%. Bai et al. [21] proposed a malware detection system based on analyzing PE file structural features. They use CfsSubsetEval and WrapperSubsetEval approach to select features and evaluate their system using four different machine learning classifiers. The proposed framework could achieve an accuracy of 99.1%. Markel et al. [22] presented two Boolean features related to entropy and were used to detect malware. HighEntropy and LowEntropy are true if any section of the corresponding PE file has entropy greater than 7 and less than 1, respectively. Their experimental results proved that the entropy is very useful and highly distinguishable between malware and benign programs and yielded an f-score of 72.46% with this single feature. Ahmadi et al. [17] proposed a learning-based system that aggregates multiple features such as binary n-gram, metadata, entropy, API, opcode, etc., to classify malware into its corresponding families. The extracted 1,804 features were experimented with eXtreme Gradient Boosting (XGBoost) and achieved a very high accuracy rate of 99.77%. Belaoued et al. [23] introduced an efficient malware detection system based on the analysis of APIs and PE features from the PE-optional header. They use the chi-square (KHI2) measure for feature selection and Phi (φ) measure for feature reduction. Finally, the B-J48 classifier with 311 features achieves a detection rate of 98.17% and a false alarm rate of 4.76% over an experimental dataset of 552 samples. Kumar et al. [26] presented a technique that used the combination of portable executable header field raw values and derived values to detect malware. These features are trained and tested with different machine learning algorithms such as Decision Tree, Random Forest, KNN, Logistic Regression, Linear Discriminant Analysis, and Naive Bayes. Evaluation results indicate that the evaluated system achieves a high accuracy level of 98% with the top 15 selected features. In 2018, we proposed a static malware detection system based on a heterogeneous information network [27], which uses the extracted API Calls Flow Graph and forms a fusion feature vector with PE header information to distinguish malware from benign software. Experimental results show that the detection rate of our system can reach 98.25%. Recently, Ding et al. [12] adopted a deep belief network (DBN) based on assembly file opcode sequences to design a static malware detection scheme. Experimental results show that the DBN model has a detection rate of nearly 96.5%. Hashemi et al. [13] proposed a malware detection system based on micro-patterns within the executable files. The system converts the executable file’s binary sequence into digital images, then extracts visual features from the constructed digital images, and finally uses the texture image classification method to detect malware. The results show that the detection rate can reach 95.23%.
Considering the observations mentioned above, we created an integrated feature set by combining a set of features containing opcode 2-gram, API list, section entropy, and header information from the PE samples. We validated the testing dataset, which did not appear in the training dataset. The experimental result indicates the integrated features can effectively improve the performance of the malware detection system.
3 Proposed Static Malware Detection System
3.1 The Overall Process of Static Malware Detection System
In this chapter, we will describe the architecture of our proposed static malware detection system. Our proposed detection system is attempting to improve the performance of malware detection using our extracted intergraded features with data mining techniques. This system comprises four main modules: (1) Sample labeling, (2) Raw feature extraction, (3) Pre-processing (feature reduction), and (4) Detection that as illustrated in Fig. 1. Sample labeling: For labeling our collected programs, we used VirusTotal, an online service providing free malware scanning for individual files. Raw feature extraction: Extract our collected programs’ features and store them into the mongo database for future analysis. Pre-processing: Utilize the PCA to select the minimum number of informative features to reduce the feature space and time overhead of the training and testing phase. Decision: Use new data items to train and test our detection system.
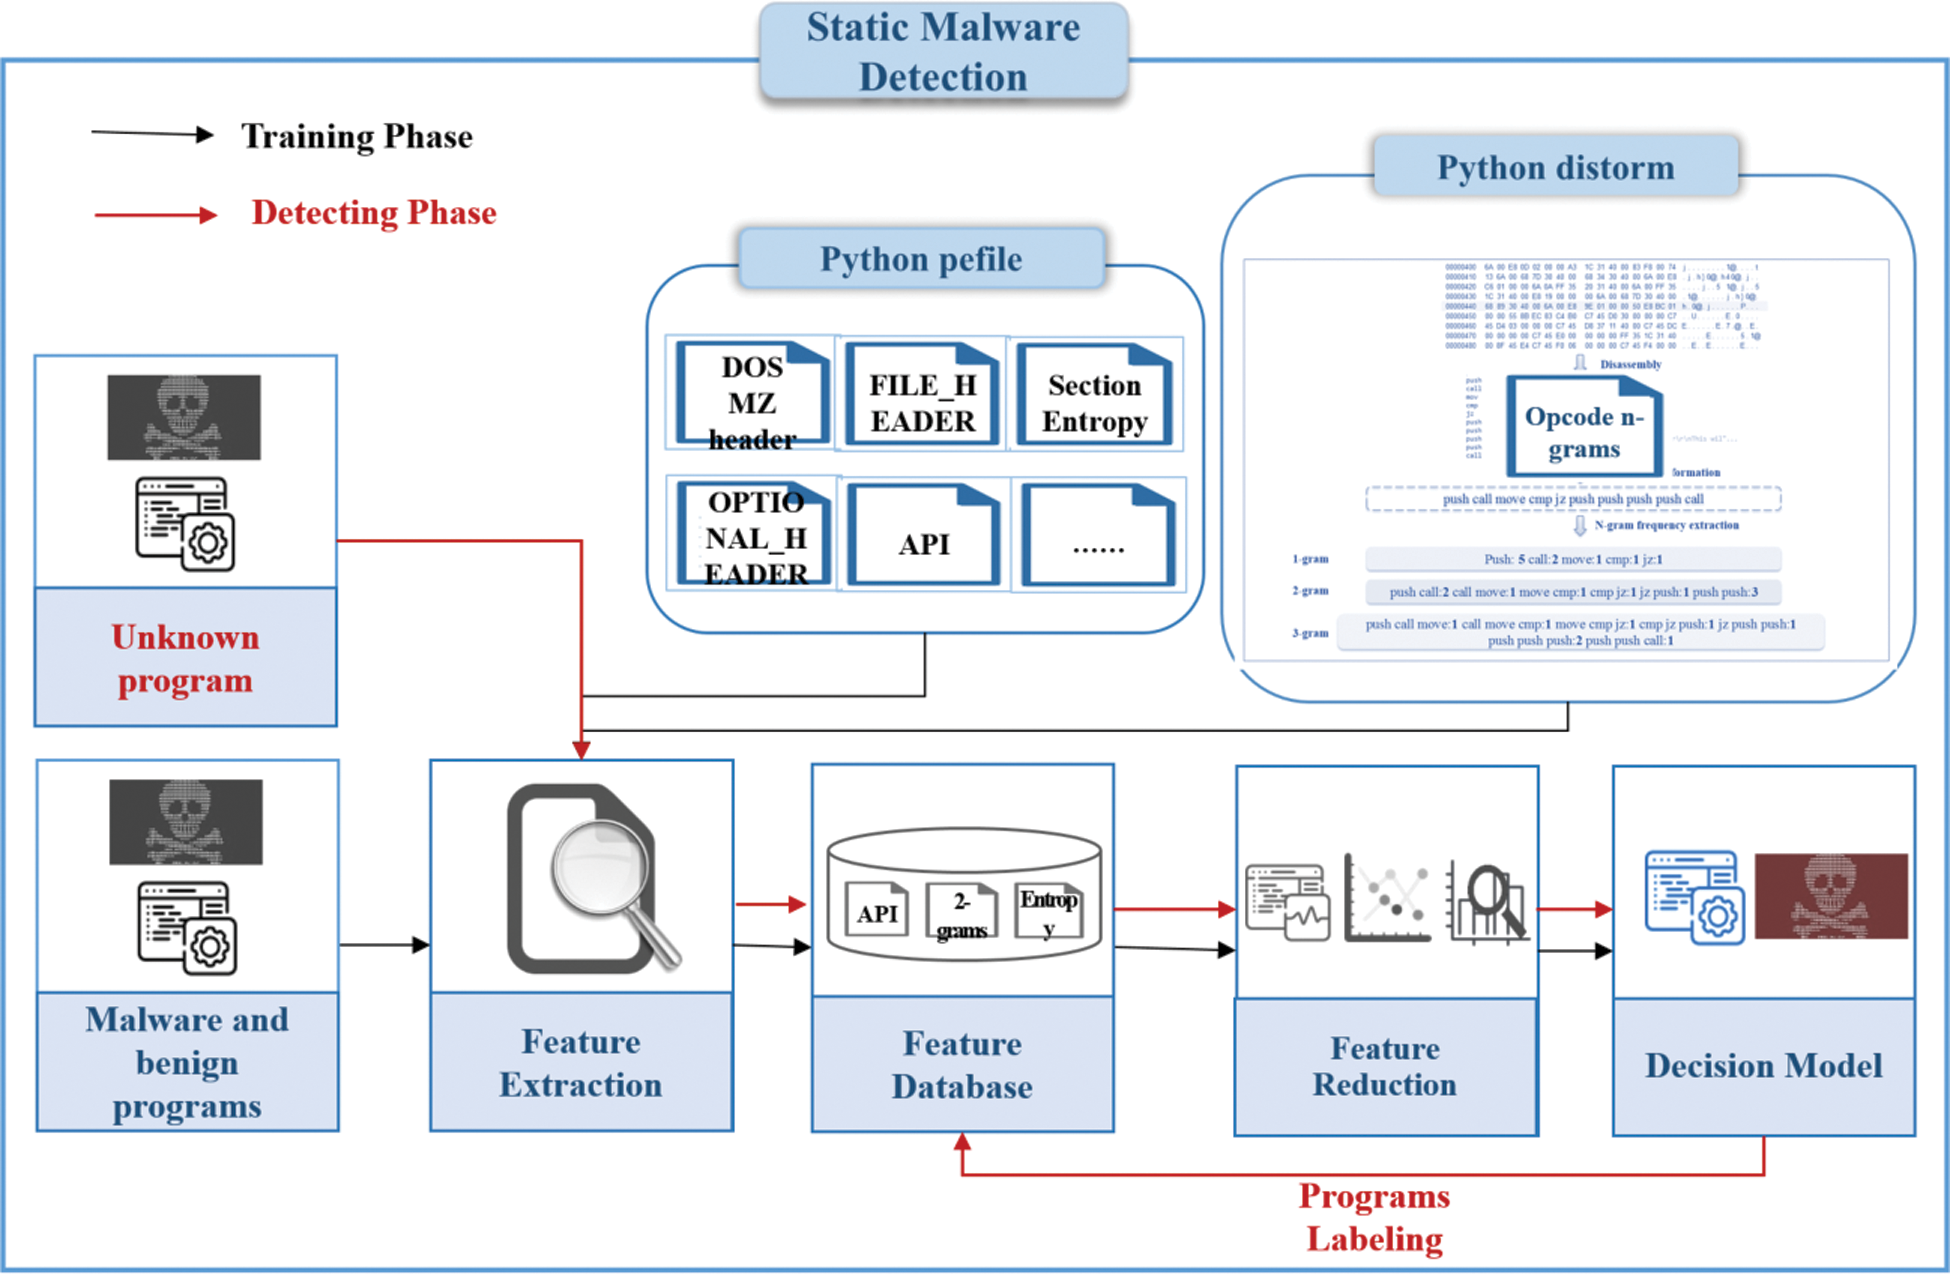
Figure 1: The overall process of our proposed system
3.2 Feature Extraction for Malware Detection
3.2.1 Header Information Extraction
The Portable Executable (PE) format is a file format used in 32-bit and 64-bit versions of Microsoft Windows operating systems for executables, object code, DLLs, FON files, etc. The PE format is a data structure that encapsulates the information necessary for the Windows OS loader to manage the executable code. Much information indicating the characteristics of the PE file and has been successfully used as static features to build a malware detection system [15,20–23].
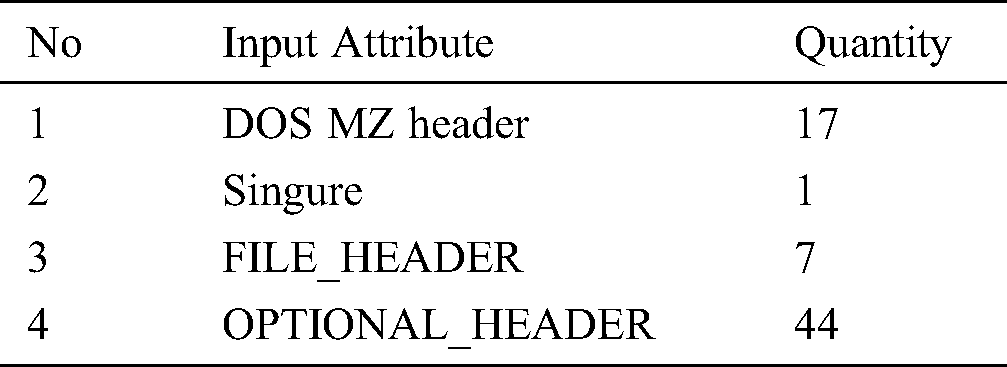
The pefile is a python module that reads PE files. This module can parse and edit the information contained in the PE as well as all the section’s details and data. We used the pefile to extract the 69 different features from the PE header. These features were demonstrated in Yonts [32] that have the potential for distinguishing between malware and benign programs and are summarized in Tab. 1.
Table 1: List of features extracted from PE files
Application Programming Interface (API) calls were widely used for constructing malware detection systems [19,24,33–36] since the Windows-based application uses the application programming interface to interact with the operating system to reflect the functional levels of a program. Therefore, we focus on extracting and analyzing the API, including imported and exported APIs to understand the behavior of the program. The optional header structure contains a data directory, which is an array of 16 IMAGE_DATA_DIRECTORY structures. IMAGE_DIRECTORY_ENTRY_IMPORT is one structure of this directory containing its relative virtual address and size. The relative address points to an import table containing a series of IMAGE_IMPORT_DESCRIPTOR structures; each structure contains information about the imported DLL and the location of the imported API. The field ‘OriginalFirstThunk’ of the IMAGE_IMPORT_DESCRIPTOR contains a relative virtual address points to an INT (import name table). The INT is an array of function pointers pointing to the IMAGE_IMPORT_BY_NAME structures that contain the actual imported APIs. In the same way, the exported APIs can be extracted by analyzing another structure—IMAGE_DIRECTORY_ENTRY_EXPORT of the data directory as mentioned above.
To extract the APIs from the PE file, we also use the pefile module, which can easily extract the imported and exported APIs. Therefore, we have obtained 44,068 unique APIs from a set of 2,016 samples for future analysis based on API extraction.
3.2.3 Section Entropy Extraction
Some modern malware or malicious packers try to add a new section of PE with ‘fake code’ such as inserting zero bytes or adding some meaningless or randomized bytes into the section. Meanwhile, the trend is also true: the malware section is usually divided into several small sections or modified into un-standard names. In 2012, Yonts [32] also proved that the entropy could be very helpful and highly distinguishable in these sections. Later on, the authors in Refs. [17,37–40] also demonstrated the availability of entropy. Therefore, the entropy of each section, including the standard and un-standard of the PE is calculated and treated as features. Entropy can be defined as a measure of randomness and it is calculated on the byte-level representation of each section in the program. The meaning of entropy is to measure how disordered the bytes are in each section as a value between 0 and 8. The get_entropy() method of the pefile can be used to calculate each file’s section entropy. This measurement of entropy is given by Shannon and defined as follows:

where  denotes the frequency of byte in the corresponding section. As shown in the formula, when the entropy value is close to 0, we can say this section is orderly. On the contrary, if the value is close to 8, the section is random.
3.2.4 Opcode N-gram Sequences Extraction
An opcode (abbreviated from the operation code) is the operation in the instruction set that specifies the operation to be performed. Thus, opcode n-gram sequences reflect short behavioral patterns and implicitly capture some underlying program semantics. Various approaches have used opcode sequences to improve the performance of malware detection [15,29]. To understand the characteristics of the executable file, we used a python module-distorm3 to extract the sequence of opcode from each file. Opcode n-grams were extracted where each n-gram was composed of n consecutive opcode in the assembly representation of a given sample.
Most researchers extract the entire opcode of the file for constructing opcode n-grams. We find that some sections like .data, .edata, .idata, etc., contain a lot of useless opcode such as DB, DW, DD, DQ, DT, DDQ, DO and aligns, etc., which are not useful to identify malware. The session .text in a PE file is the blocks that contain the actual machine instructions which make up the program. Usually, the execution code is stored in a section called .text. However, many malware creators change this section name to avoid being detected. We use the most notable item-section flag stored in the section header to identify the actual execution code’s location. The section flag in the characteristics field of the section header indicates the characteristics of its corresponding section. We extracted the section that had the section flag named ‘IMAGE_SCN_MEM_EXECUTE’. This flag indicates that the section can be executed as code. Meanwhile, the section header also contains other information about the corresponding section. Especially, the ‘SizeOfRawData’ field indicates the size of the section and the ‘PointerToRawData’ field indicates the start position of the section. According to the above-mentioned information, the related section’s opcode can be easily extracted.
To characterize the contents of the n-gram, we move a fixed-length window over the extracted opcode sequence, where the n-gram is a subsequence of length n at each position. In this work, we construct feature sets composed of frequencies of occurrence at 1, 2, and 3-grams. Although the vector space induced by the program for 1-grams only has 793 unique features in our experiment. However, most of the common operations that can be used for malicious purposes require more than one machine code operation, and a small value of n will fail to detect complex malicious blocks of operations. Consequently, we also extracted and utilized the opcode 2-grams and 3-grams sequences as features to compare the individual opcode.
For constructing opcode n-grams sequences of a program that contains m instruction. We define the program as a set of ordered opcode I, an opcode sequence f is a subsequence of opcode within the executable file.
Consider the consecutive opcode (I = push; call; move; cmp; jz; push; push; push; push; call). The sequence of length 2 can be generated as f1 = push; call;, f2 = call; move;, f3 = move; cmp;, f4 = cmp; jz;, f5 = jz; push;, f6 = push; push;. The frequencies of occurrence were treated as the value of feature f. Using a program containing m instruction can comprise at most (m–n+1) distinct n-grams. Consequently, the feature space induced by the program exhibits a huge dimension. A set of 2,016 samples easily exceeds over 70,000 unique 2-grams, 1,550,000 3-grams. Hence, the dimensionality of features will be over 70,000 and 1,550,000, respectively. High dimensional features may lead to a complex classification model and may also affect time overhead. Therefore, the feature reduction phase was adopted and described in the next section.
3.3 Feature Selection and Reduction
In general, the performance of a detection system also depends on the quality of the feature sets. The irrelevant and redundant features of the feature sets may lead to a complex classification model and affect the time overhead. Therefore, feature selection and reduction are significant phases for reducing the dimensionality and selecting informative features, which are best for discriminating between malware and benign programs [41]. The advantages of the principal component analysis algorithm are that it can reduce unimportant information like relevant and redundant attributes, retain the main elements and structure of the original and represent the data in a simple format [42,43]. Therefore, to reduce the complexity of the classification model and improve the time performance, we adopt the PCA algorithm to process our collected features before building the detection system.
To perform the experiments, we used different learning algorithms provided by scikit-learn, a Python-based machine learning tool, which has implemented many well-recognized data mining algorithms. It is used to build and test the performance of different classifiers, including training and testing phases. We select algorithms with different theoretical approaches such as K-Nearest Neighbors (KNN), Decision Tree (DT) [44], Gradient Boosting Decision Tree (GBDT) [45], and XGBoost [46] to build the detection system.
All the algorithms mentioned above are trained and tested with various configurations and different feature sets described in Section 3.2. These learning algorithms are utilized for training classifiers. The unseen benign and malicious program in the testing set will be classified by these classifiers to judge the file as either malware or benign program.
4 Experiment Results and Evaluations
To assess the performance of our proposed detection system, we used two different datasets to test: a malware dataset and a benign program dataset. The malware samples used in previous work were detected as benign programs by several antivirus products, and some programs also duplicated files. To avoid distortion of the detection system, we directly collect programs, delete duplicate files, and use an online service to verify the class label of each program. We used VirusTotal, an online service providing free malware scanning for individual files for labeling our collected programs. VirusTotal aggregates over 50 different antivirus products such as AhnLab-V3, BitDefender, Kaspersky, Symantec, etc., and provides an online scan engine to verify the class label of each program present in the dataset. We use the VirusTotal API to upload all of our collected samples and verify that the program is malicious when all antivirus products identify the program as malware. We were also labeling 1,069 programs such as multimedia tools, games, viewers, Microsoft Office, developer tools, etc., as benign programs if all antivirus products identified the program as benign. Finally, we collected 1000 malicious samples and 1,069 benign samples and can confirm that the programs were labeled correctly.
4.2 Experiment Results and Evaluations
We extract the opcode sequence representation of each program sample into two datasets with different opcode sequence lengths 1, 2, and 3. The reason for not extracting more opcode sequence lengths is that the massive number of features obtained would impact the speed of extraction and the underlying complexity of machine learning-based classifiers.
4.2.1 Comparison of ACC with Section Opcode and Entire Opcode
Experiment 1. As described in Section 3.2.4, we use the most notable item-section flag stored in the section header to identify the actual execution code’s location. The section flag in the characteristics field of the section header indicates the characteristics of its corresponding section. We extracted the section that had the section flag ‘IMAGE_SCN_MEM_EXECUTE’. This flag indicates the section can be executed as code.
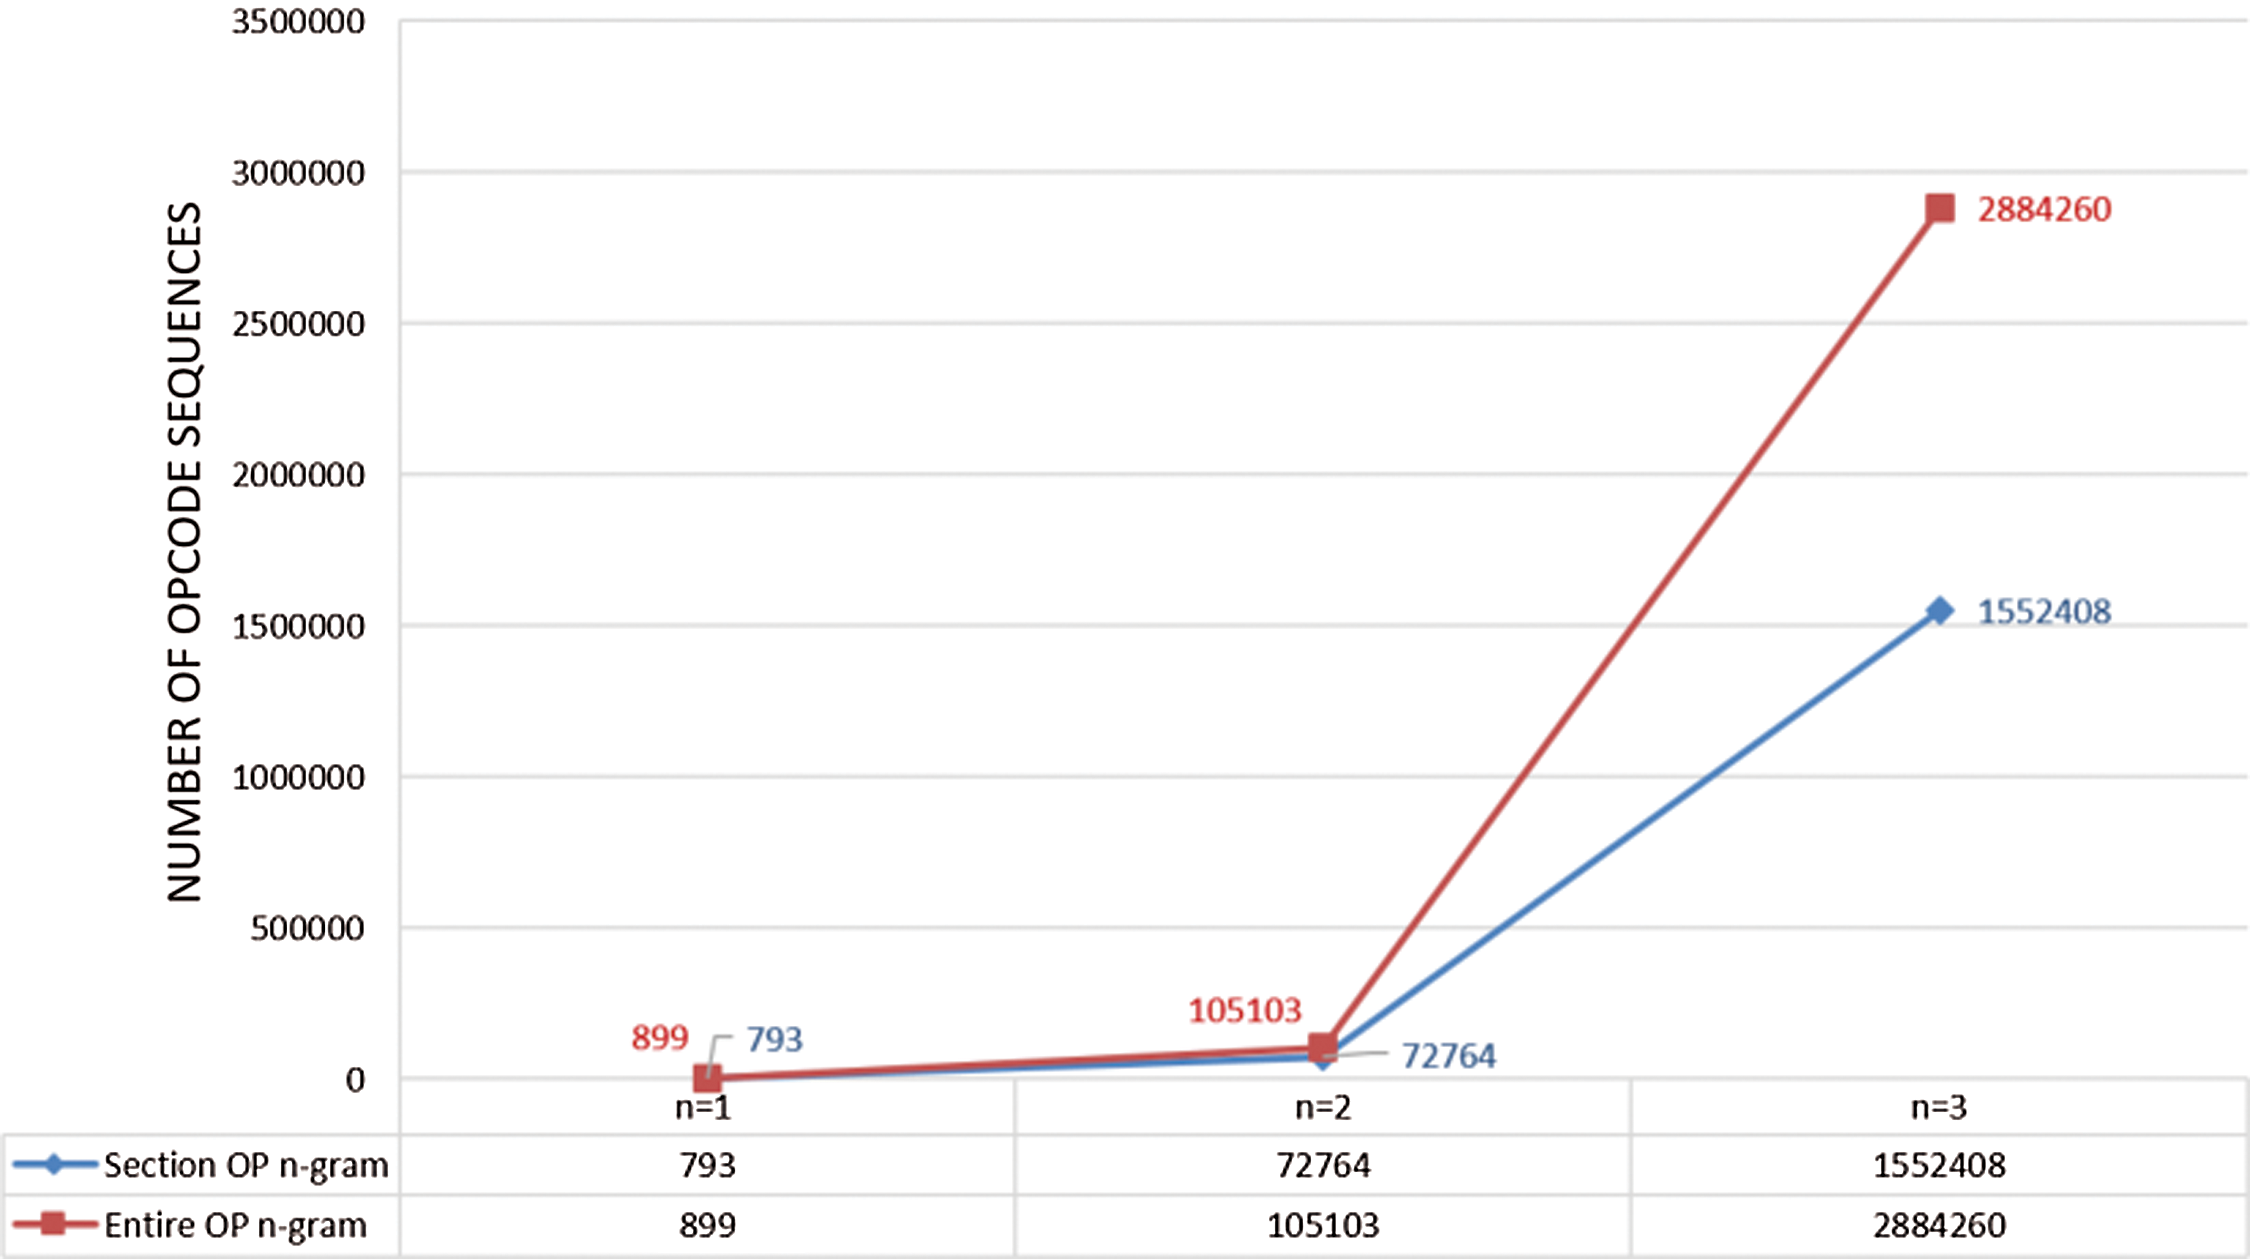
Figure 2: The number of features for different opcode sequence lengths
To test this flag’s reliability, we also extracted the entire opcode of the file for comparison. As shown in Fig. 2, the number of different opcode sequences increases exponentially with the length of the opcode sequence. For n = 1 we obtained 793 different sequences, 72,764 for n = 2 and 1,552,408 different opcode sequences for n = 3 when using the section flag. For the entire opcode of the file, we obtained 899 different sequences for n = 1; 105,103 for n = 2; 2,884,260 different opcode sequences for n = 3.
As shown in Fig. 3, nearly every classifier yielded results with accuracies higher than 89.75% using the opcode feature set. It demonstrates that opcode is adequate for distinguishing between benign programs and malware. Since most common operations that can be used for malicious purposes require more than one machine code operation, the individual opcode is not very effective compared to opcode 2-grams.
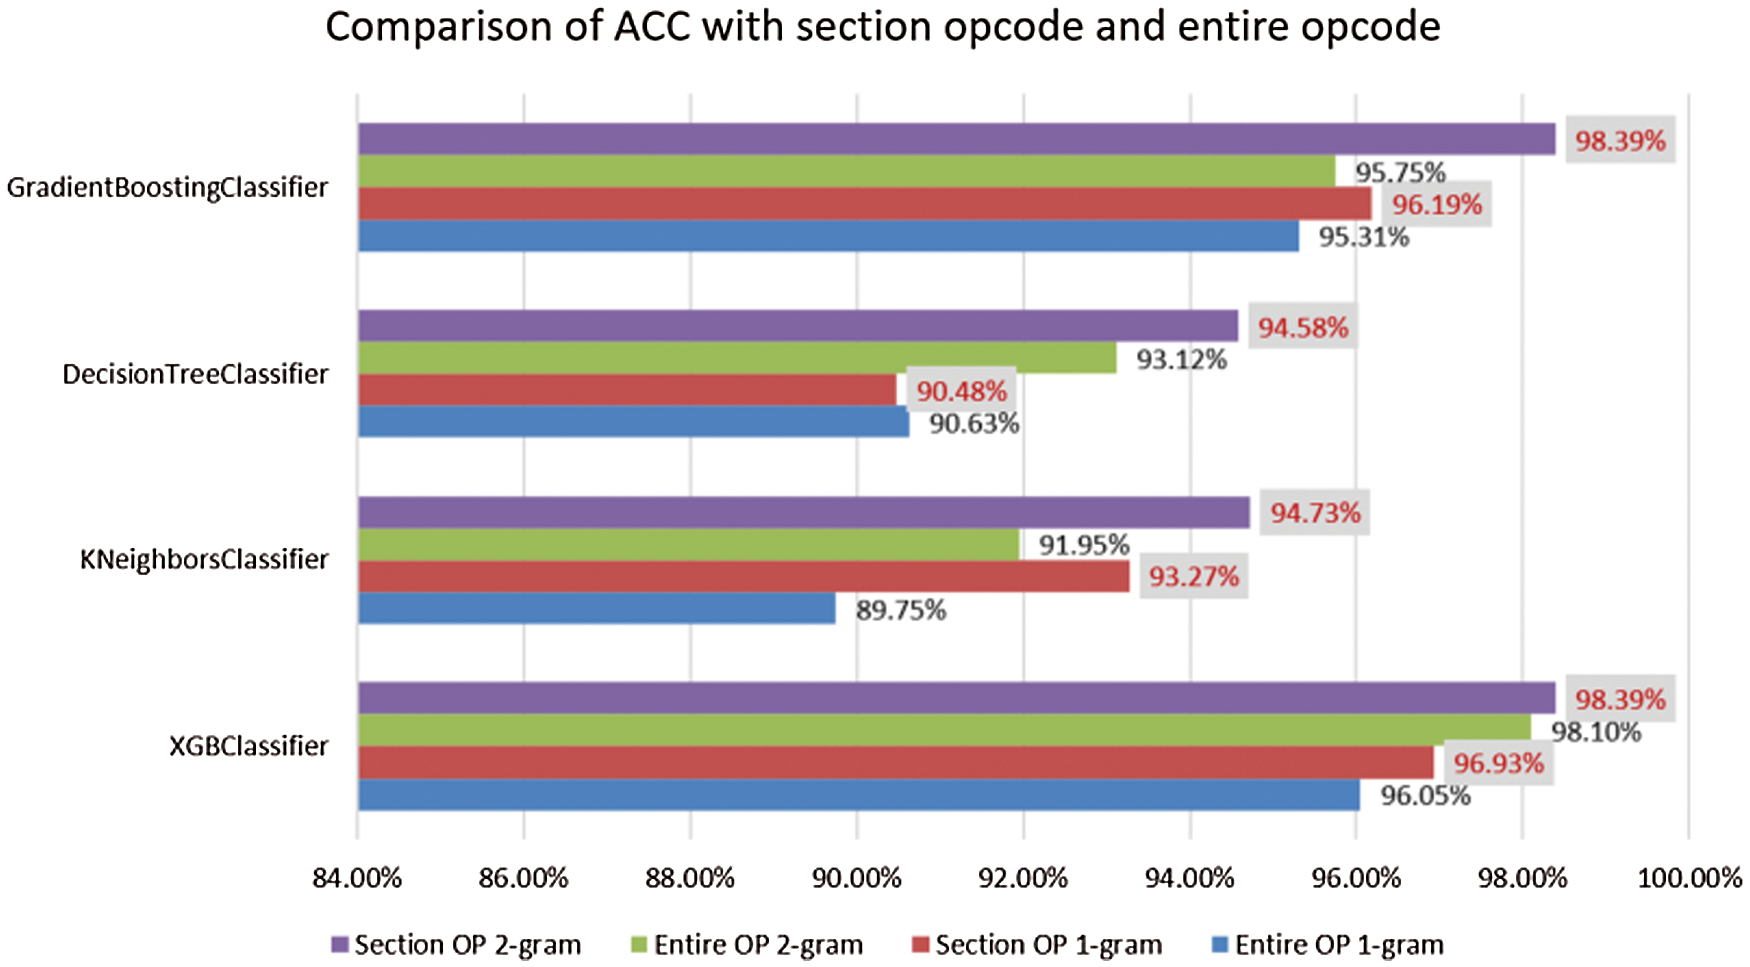
Figure 3: Comparison of ACC with section opcode and entire opcode
Most PE comprises pre-defined sections like .data, .edata, .idata. etc. These sections contain many useless opcodes such as DB, DW, DD, DQ, DT, DDQ, DO, and aligns, etc., which are not useful for identifying malware. Therefore, the entire opcode is not very satisfactory compared to section opcode in most classifiers.
4.2.2 The Number of Features for Different Opcode Sequence Lengths
Experiment 2. The previous experiment proved that section opcode is adequate for distinguishing between benign programs and malware. We will gradually add various information such as section entropy, API list, and header information to the opcode feature set. As shown in Fig. 4, the integrated feature set’s total dimensionality is achieved to 45,190, 117,161, and 1,596,805, respectively. We could not perform a classification step using the scikit-learn API for opcode-sequence lengths longer than 2. Therefore, the rest of the steps is only tested for opcode sequences of length 1 and 2.
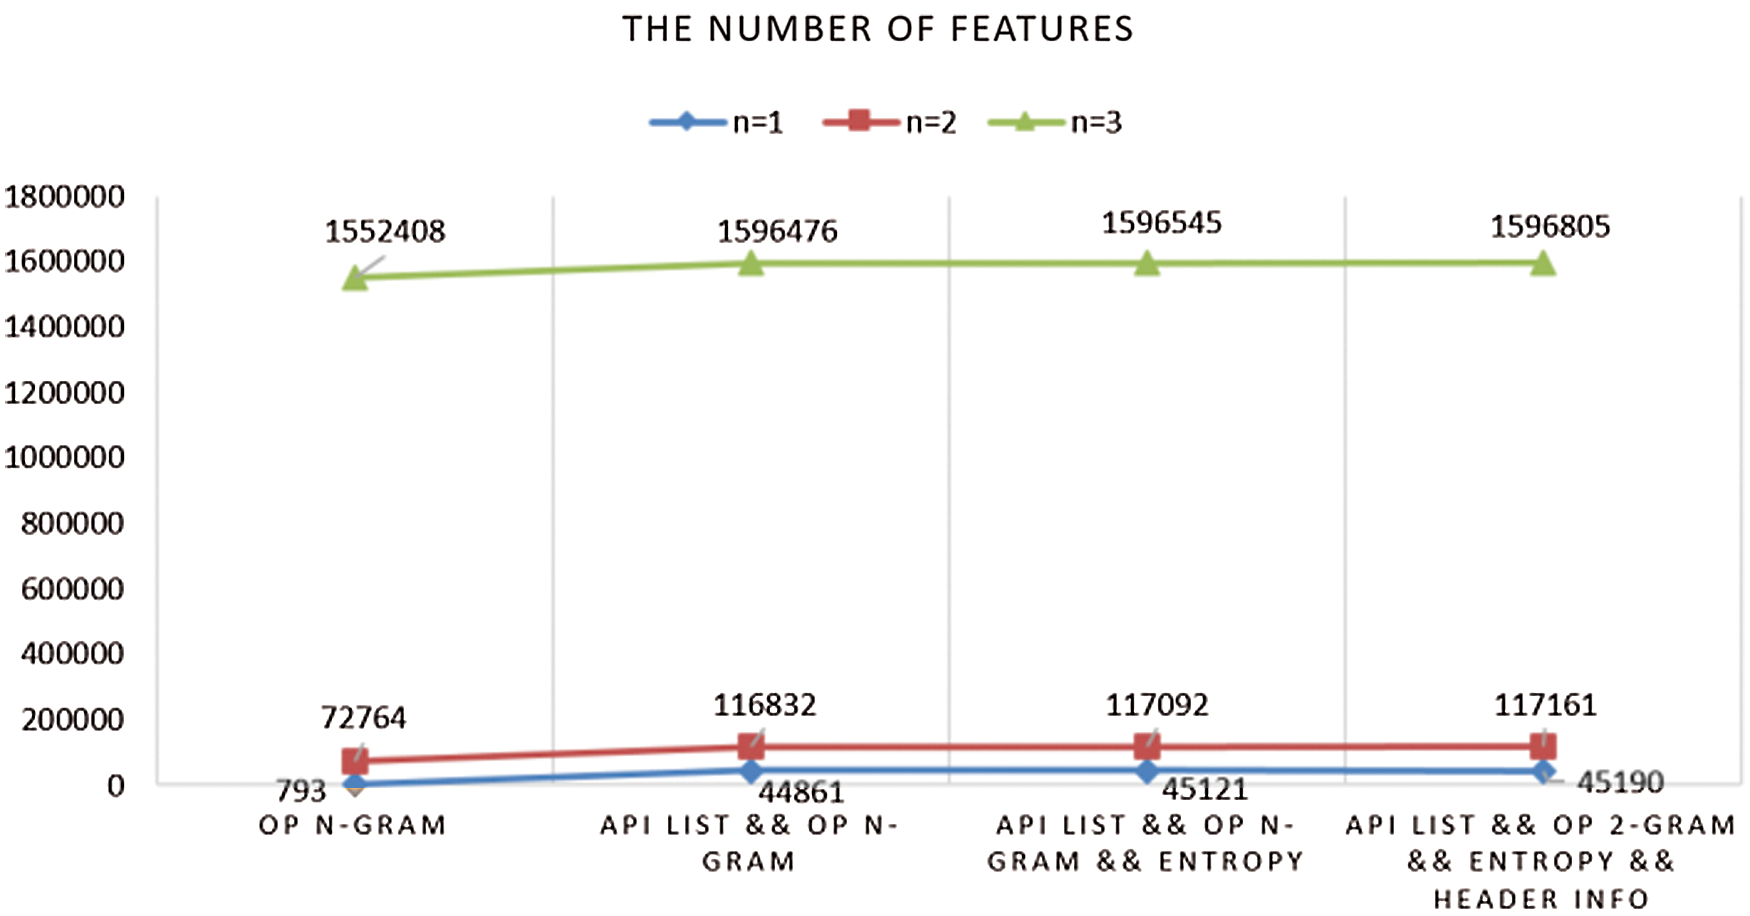
Figure 4: The number of features for different opcode sequence lengths
4.2.3 Comparison of Result in Terms of ACC of Classifiers
Experiment 3. We had five different features extracted from the programs in our dataset. We combined these features into several feature sets, including section opcode-sequence length of 1 (1-grams); 1-grams + API list; 1-grams + API list + section Entropy; an integrated feature set which contains section opcode 1-gram, API list, section entropy, and header information; section opcode sequence length of 2 (2-grams); 2-gram + API list; 2-grams + API list + section entropy as well as an integrated feature set which contains 2-grams, API list, section entropy, and header information.
As shown in Fig. 5, the different classifier’s accuracy increases by gradually adding the API list, section entropy, and header information into the section opcode 1-gram feature set. The XGBoost obtained the best results with the integrated feature set, which included section opcode 1-grams, API list, section entropy, and header information yielding an accuracy of 99.12%. Nearly every classifier yielded results with an accuracy higher than 94% when using the feature set integrated with section opcode 1-grams.
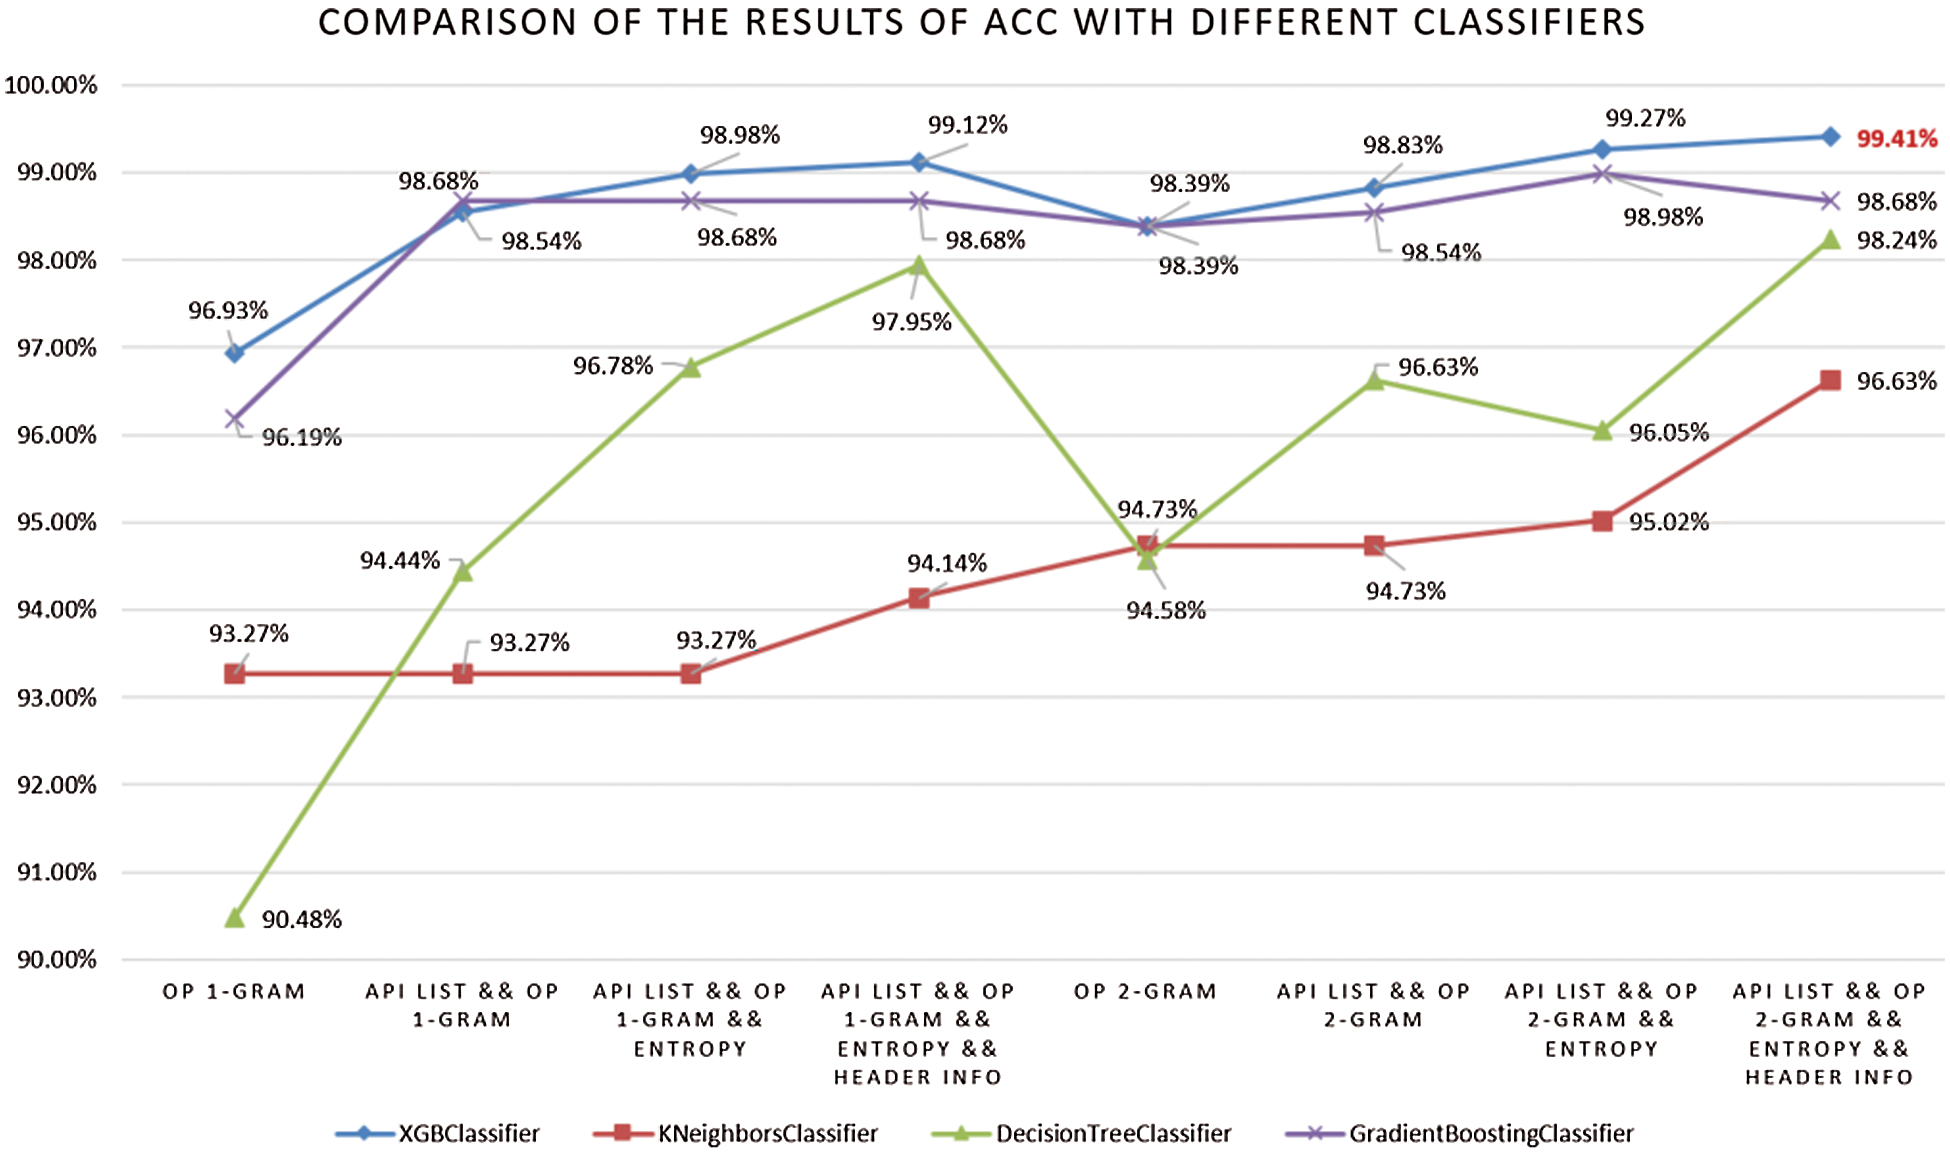
Figure 5: Comparison of the results in terms of accuracy with different classifiers
The results are substantially improved when using section opcode 2-grams. XGBoost with the integrated feature set contains section opcode 2-grams, API list, section Entropy, and header information is the best, at 99.41%. The Decision Tree trained with the section opcode 2-grams feature set has the worst relative accuracy, 94.58%. All classifier’s accuracy was improved with the feature set integrated with section opcode 2-gram, and it higher than 96.63%. The classifier’s accuracy also increases as it gradually adds other features to the section opcode 2-grams feature set.
We want to point out several observations from these experiments. (1) All classifiers obtained an accuracy greater than 90.48%. Notably, the integrated features were able to achieve 99.41% classification accuracy. This demonstrates that our extracted feature set is adequate for malware detection. (2) In most cases, the XGBoost classifier significantly outperforms the rest of the classifiers. (3) All classifiers used the default parameters of the scikit-learn library. The performance can be enhanced by optimizing the best parameters of each classifier.
4.2.4 Comparison of ACC with Binary and Opcode N-grams
Experiment 4. The previous research efforts in the domain of static malware detection were mainly based on binary and opcode as the main features. To confirm the effectiveness of the two kinds of features, we also extracted the entire binary 1-grams and 2-grams of the program for comparison. As shown in Fig. 6, all classifiers obtained an accuracy higher than 91.65%. This demonstrates that both binary and opcode features are sufficient for malware classification.
The results were substantially improved, whether using the binary code 2-grams or opcode 2-grams. The XGBoost obtained the best accuracy, 98.98% with binary code 2-grams, and yielded an accuracy of 99.41% when using section opcode 2-grams integrated with the API list, section entropy, and header information. We want to point out the accuracy of opcode n-grams significantly outperforms the binary n-grams in most cases. We did not add the API list, section entropy, and header information into the binary n-grams feature set in this experiment. The entire binary of a program already contains such features. It just presents our extracted features in binary form.
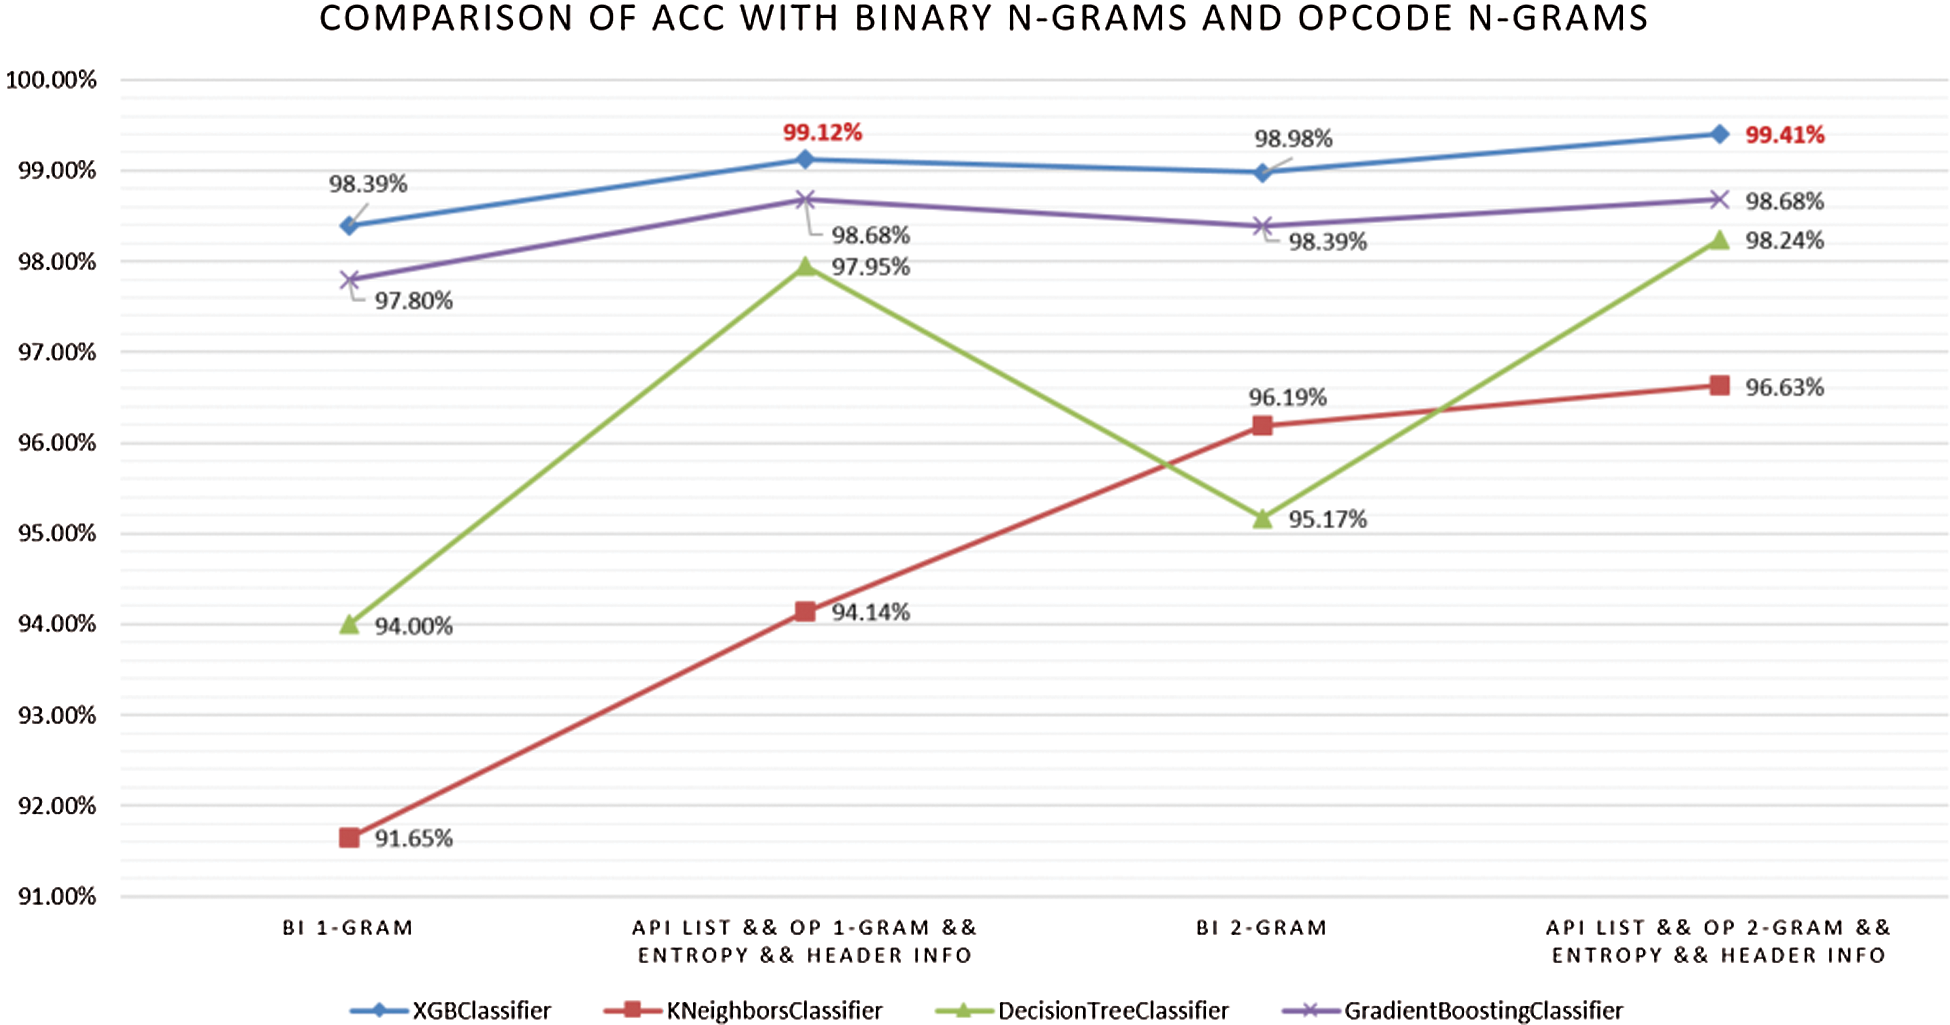
Figure 6: Comparison of ACC with binary n-grams and opcode n-grams
4.2.5 Best Combination Parameters Searching
Experiment 5. Experiment 3 shows that using the default parameters of XGBoost with the integrated feature set, which includes section opcode 2-grams, API list, section entropy, and header information, can achieve 99.41% classification accuracy. Therefore, the rest of the steps are just testing for the XGBoost classifier with the integrated feature set.
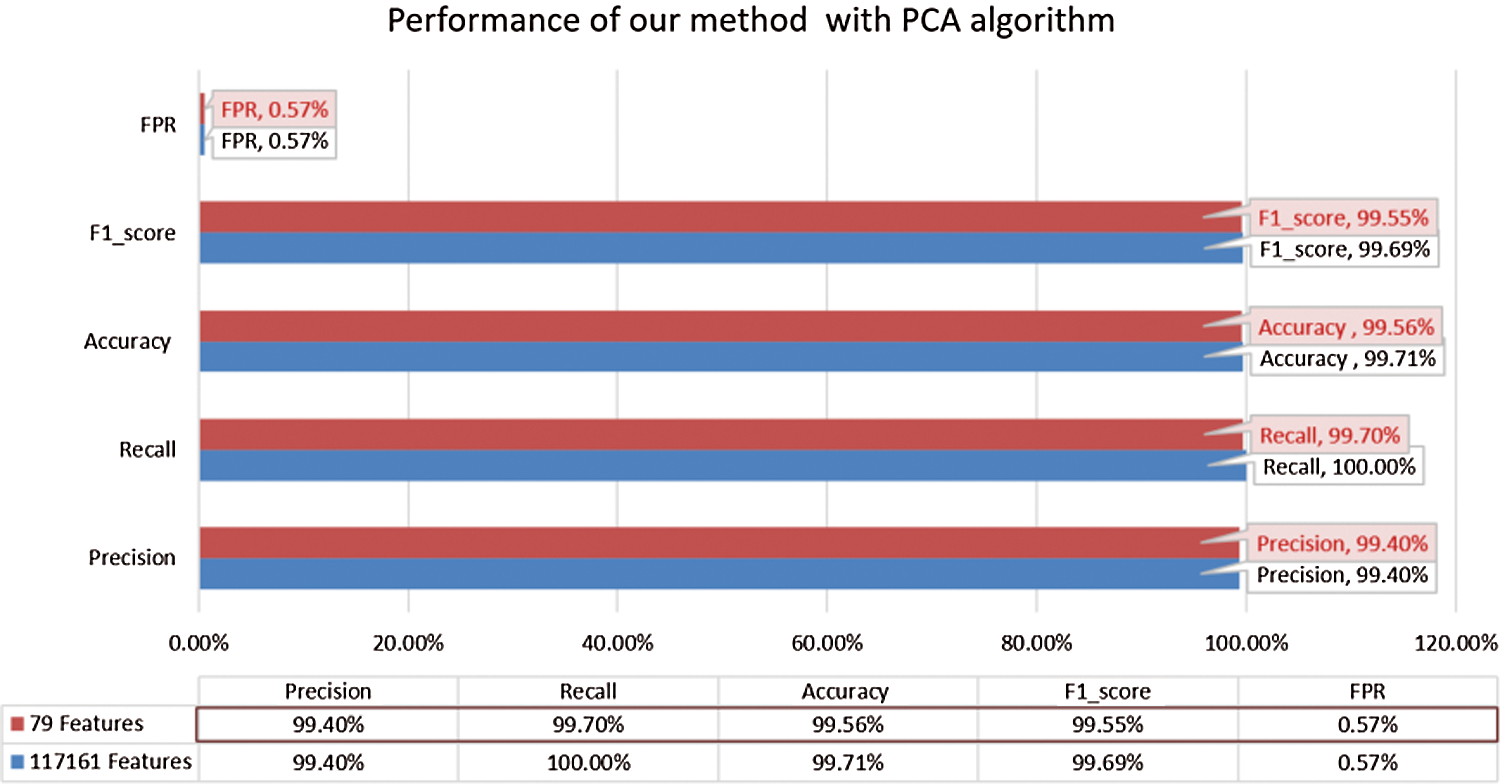
Figure 7: Performance of proposed static malware detection system
To improve the performance of the XGBoost classifier, we use the gridsearchCV API of scikit-learn to search for the best combination of parameters or the classifier. As shown in Fig. 7, by optimizing the best combination parameters, the XGBoost with our integrated features achieved the highest accuracy at 99.71%.
4.2.6 Process Duration and Performance of Proposed System
Experiment 6. Most real-life data say many features are just highly correlated, and so it turns out to be possible to compress the data a lot and still retain most of the variance. To overcome the curse of dimensionality, we adopted a feature reduction step using the PCA algorithm to reduce the dimension of the features to k, which would significantly reduce the features’ dimensionality and still retain 99% variance.
To evaluate the contribution of the PCA algorithm, we selected 79 features from the original integrated features, which retain 99% of the variance and are directly applied to the XGBoost classifier. Process duration of this classifier with our 79 features and original features as shown in Fig. 8. The classifier without the PCA algorithm achieved a training time of 1016.6 seconds and a testing time of 1.53 seconds. The XGBoost classifier with the PCA algorithm only required 0.976 seconds for training and 0.004 seconds for testing. This denotes that the PCA algorithm can be effectively used to reduce the time overhead of our detection system.
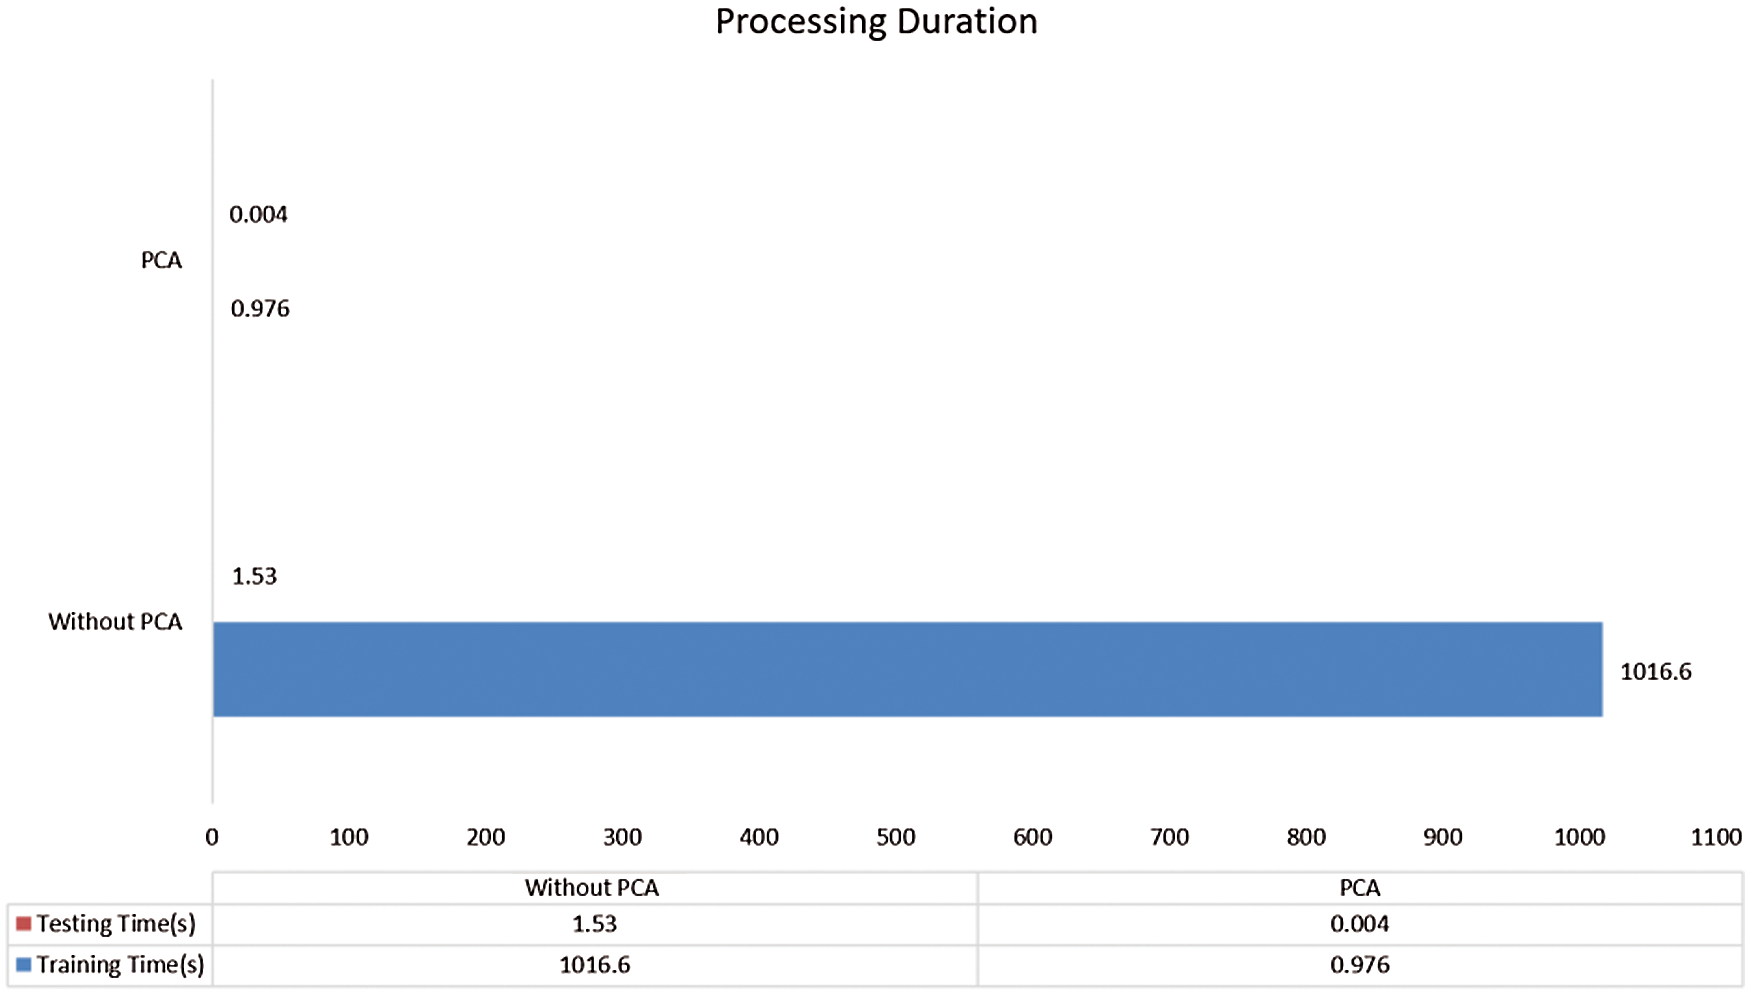
Figure 8: Process duration of XGBoost classifier
In this section, we evaluate the efficiency of our system by comparing our system with existing work, are presented in Tab. 2.
Table 2: Comparison of our system with existing work
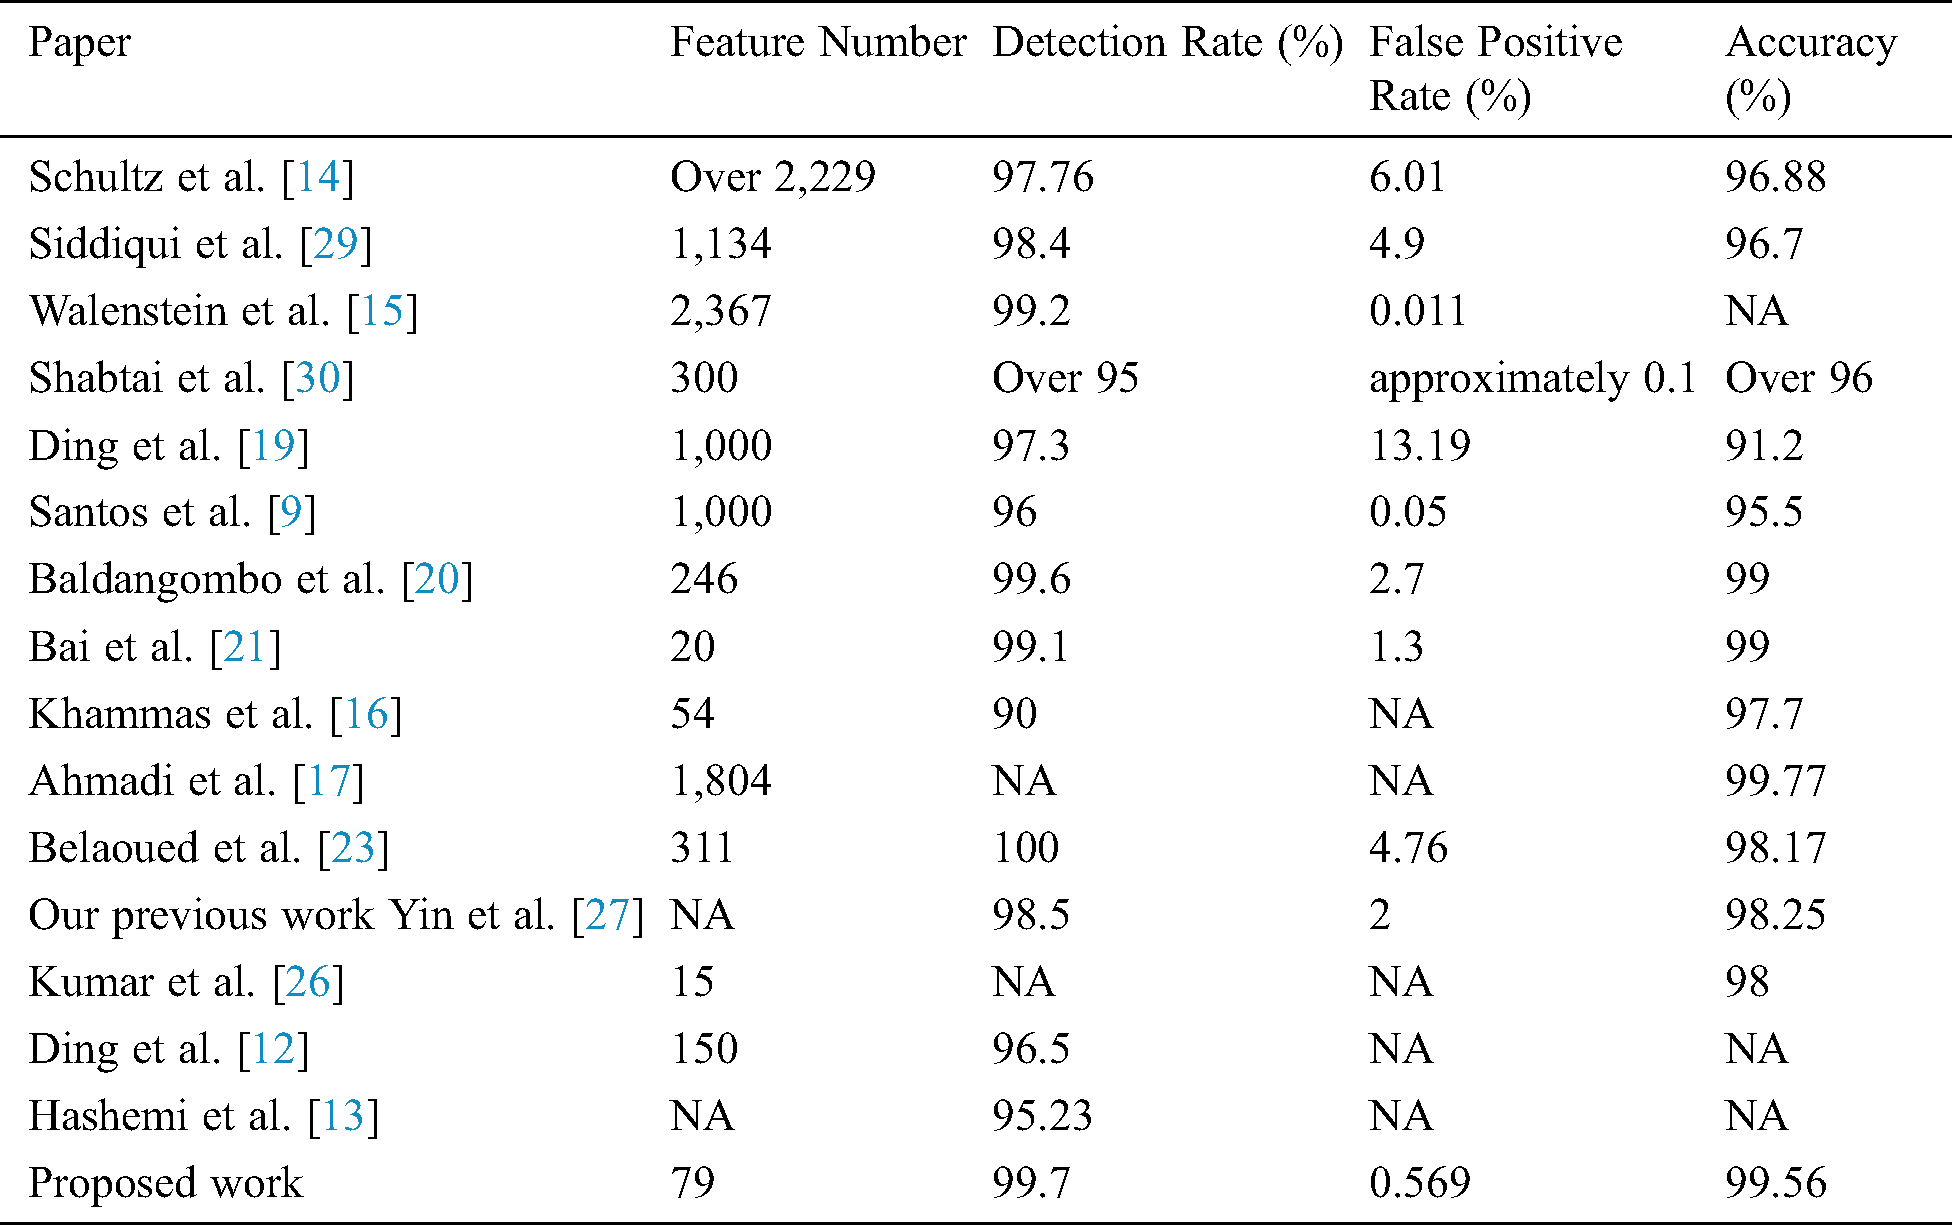
As can be seen from the results in Tab. 2, our system uses fewer features than most existing systems. The method proposed in Bai et al. [21] only used 20 features. However, considering the detection system’s performance, we can see that our system had a higher accuracy and detection ratio than their system with an improvement rate of 0.56%, 0.6%, respectively. Consequently, in our system, the false-positive ratio was reduced from 1.3% to 0.569%. Although the method proposed in Kumar et al. [26] used 15 features, our system had better accuracy than their system with an improvement of 1.56%. Khammas et al. [16] use 54 features to build their malware detection, and it has lower accuracy and detection ratio than our system. The system proposed by Belaoued et al. [23] had a better detection ratio than our method, and it is yielded 100%. However, their false positive ratio to 4.76% denotes many benign cases mis-classified as malware with their system. Besides, the number of features used in their system is much higher than our system.
From the results presented in the above table, it can be seen that our system outperforms the presented systems in terms of accuracy and detection ratio and achieves 99.56% and 99.70%, respectively. The false-positive also reduced to an acceptable level, 0.5694%. The method proposed in Ahmadi et al. [17] had better accuracy than our method, with an improvement rate of 0.21%. Although the performance is very close, it is worth pointing out the difference between the method proposed in this paper and the one followed by Ahmadi et al. [17].
a) The purpose is different: The purpose of Ahmadi et al. [17] is to build classifiers using Microsoft Malware Challenge dataset and effectively classify malware variants into their actual family groups. Such systems are well suited for software analysts researching malware. Our goal is to detect and differentiate between malware and benign program which is particularly well suited for commercial anti-malware products.
b) The feature is different: The authors mentioned that the PE header could be a rich source of information. However, to ensure file sterility Microsoft removed the PE header. Therefore, they used binary and assembly files provided by Microsoft to extract a total of 13 types of 1804 features, including binary n-grams, metadata, entropy, APIs, opcodes, etc. This paper used four types of 79 features: section opcode 2-grams, API list, section Entropy, and header information, which were directly extracted from our collected PE files to build our classification system.
c) Although the method proposed in Ahmadi et al. [17] uses assembly files directly, we have to consider the time overhead of Microsoft disassembling the original files. This is because disassembling them is a costly task. Our system is adequate for the real-time detection of malware, it only requires 1.501 seconds for the feature extraction phase and 0.0453 seconds per file for detection, and it is almost four times faster than their method, as the latter takes 5.626 seconds per file to extract features.
d) The author did not mention the time of detection. We use the same classification algorithm, but the number of features in their system is almost 23 times larger than ours. Therefore, we believe that our system will save more time, including feature extraction, training, and testing.
e) For real-world malware detection, its sole purpose is to detect whether the executable is a malware or a benign program rather than detecting whether the binary and assembly file is malicious or not. Therefore, we believe that our system is more suitable for commercial anti-malware products.
Considering the overall performance; we can conclude that our proposed static malware detection system is more efficient than existing work for malware detection.
Due to the growth of malware in recent years, malware detection has become a significant topic of research and concern. The classic signature approach adopted by antivirus vendors is no longer sufficiently effective because the exponential growth of new malware makes it impractical. Therefore, we proposed a malware detection system using machine learning techniques to detect known and unknown malware by comparing profiles of malware and benign programs.
In this paper, we proposed a machine learning-based system using an integrated feature set for malware detection. Specifically, we propose an integrated feature set for more effective discriminant malware and benign programs. Our experiments show that these features provide an excellent detection ratio while maintaining a low false-positive ratio for detecting known and unknown malware. We also proved that the algorithm-XGBoost used by most of the winners in the recent Kaggle competitions is applicable and can help improve the performance of malware detection. Traditional signature uses a short and unique string of bytes such as MD5, SHA256, CRC32, etc. which is recorded in the signature database for each known malware so that future examples can be correctly classified with a small error rate. Since it needs to have prior knowledge of malware by their signatures, it inefficient against unknown and metamorphic malware. Although our system is more suitable for real-time detection than other state-of-the-art systems, it is still time consuming. Traditional signature-based detection systems have relatively faster detection speeds. In future systems, we hope to combine traditional signature detection with our detection system. When a program is detected as benign on a traditional signature-based system, the category of the software can be further confirmed by our system. If the system detects it as malware, the signature can be calculated and updated to match the traditional signature’s database.
Funding Statement: This research was supported, in part, by the Startup Foundation for Introducing Talent of NUIST under Grant No.2019r032; in part, by National Natural Science Foundation of China under grant numbers 61304205, 61502240; in part, by the Natural Science Foundation of Jiangsu Province under grant numbers BK20191401, BK20201136.
Conflicts of Interest: The authors declare that they have no conflicts of interest to report regarding the present study.
1. E. Gandotra, D. Bansal and S. Sofat. (2014). “Malware analysis and classification: A survey,” Journal of Information Security, vol. 5, no. 2, pp. 56–64. [Google Scholar]
2. M. Weber, M. Schmid, M. Schatz and D. Geyer. (2002). “A toolkit for detecting and analyzing malicious software,” in 18th Annual Computer Security Applications Conf. Las Vegas, NV, USA, pp. 423–431. [Google Scholar]
3. D. Bilar. (2007). “Opcodes as predictor for malware,” International Journal of Electronic Security and Digital Forensics, vol. 1, no. 2, pp. 156–168. [Google Scholar]
4. R. Moskovitch, C. Feher, N. Tzachar, E. Berger, M. Gitelman et al. (2008). , “Unknown malcode detection using opcode representation,” in European Conf. on Intelligence and Security Informatics. Berlin, Heidelberg, pp. 204–215. [Google Scholar]
5. I. Santos, F. Brezo, J. Nieves, Y. K. Penya, B. Sanz et al. (2010). , “Idea: Opcode-sequence-based malware detection,” in Int. Sym. on Engineering Secure Software and Systems. Berlin, Heidelberg, pp. 35–43. [Google Scholar]
6. B. B. Rad, M. Masrom and S. Ibrahim. (2012). “Opcodes histogram for classifying metamorphic portable executables malware,” in 2012 Int. Conf. on e-Learning and e-Technologies in Education (ICEEE). Lodz, Poland, pp. 209–213. [Google Scholar]
7. N. Runwal, R. M. Low and M. Stamp. (2012). “Opcode graph similarity and metamorphic detection,” Journal in Computer Virology, vol. 8, no. 1, pp. 37–52. [Google Scholar]
8. A. H. Toderici and M. Stamp. (2013). “Chi-squared distance and metamorphic virus detection,” Journal of Computer Virology and Hacking Techniques, vol. 9, no. 1, pp. 1–14. [Google Scholar]
9. I. Santos, F. Brezo, X. Ugarte-Pedrero and P. G. Bringas. (2013). “Opcode sequences as representation of executables for data-mining-based unknown malware detection,” Information Sciences, vol. 231, pp. 64–82. [Google Scholar]
10. A. Lakhotia, A. Walenstein, C. Miles and A. Singh. (2013). “VILO: A rapid learning nearest-neighbor classifier for malware triage,” Journal of Computer Virology and Hacking Techniques, vol. 9, no. 3, pp. 109–123. [Google Scholar]
11. Y. J. Fan, Y. F. Ye and L. F. Chen. (2016). “Malicious sequential pattern mining for automatic malware detection,” Expert Systems with Applications, vol. 52, pp. 16–25. [Google Scholar]
12. Y. X. Ding and S. Y. Zhu. (2019). “Malware detection based on deep learning algorithm,” Neural Computing and Applications, vol. 31, no. 2, pp. 461–472. [Google Scholar]
13. H. Hashem and A. Hamzeh. (2019). “Visual malware detection using local malicious pattern,” Journal of Computer Virology and Hacking Techniques, vol. 15, no. 1, pp. 1–14. [Google Scholar]
14. M. G. Schultz, E. Eskin, F. Zadok and S. J. Stolfo. (2001). “Data mining methods for detection of new malicious executables,” in Proc. 2001 IEEE Symposium on Security and Privacy, S&P, Oakland, CA, USA, pp. 38–49. [Google Scholar]
15. A. Walenstein, D. J. Hefner and J. Wichers. (2010). “Header information in malware families and impact on automated classifiers,” in 2010 5th Int. Conf. on Malicious and Unwanted Software. Nancy, Lorraine, France, pp. 15–22. [Google Scholar]
16. B. M. Khammas, A. Monemi, J. S. Bassi, I. Ismail, S. M. Nor et al. (2015). , “Feature selection and machine learning classification for malware detection,” Jurnal Teknologi, vol. 77, no. 1, pp. 243–250. [Google Scholar]
17. M. Ahmadi, D. Ulyanov, S. Semenov, M. Trofimov and G. Giacinto. (2016). “Novel feature extraction, selection and fusion for effective malware family classification,” in Proc. of the Sixth ACM Conf. on Data and Application Security and Privacy, New Orleans Louisiana, USA, pp. 183–194. [Google Scholar]
18. D. K. S. Reddy and A. K. Pujari. (2006). “N-gram analysis for computer virus detection,” Journal in Computer Virology, vol. 2, no. 3, pp. 231–239. [Google Scholar]
19. Y. X. Ding, X. B. Yuan, K. Tang, X. Xiao and Y. B. Zhang. (2013). “A fast malware detection algorithm based on objective-oriented association mining,” Computers & Security, vol. 39, no. 1, pp. 315–324. [Google Scholar]
20. U. Baldangombo, N. Jambaljav and S. J. Horng. (2013). “A static malware detection system using data mining methods,” International Journal of Artificial Intelligence & Applications (IJAIA), vol. 4, no. 4, pp. 123–126. [Google Scholar]
21. J. R. Bai, J. F. Wang and G. Z. Zou. (2014). “A malware detection scheme based on mining format information,” Scientific World Journal, vol. 2014, pp. 260905. [Google Scholar]
22. Z. Markel and M. Bilzor. (2014). “Building a machine learning classifier for malware detection,” in 2014 Second Workshop on Anti-malware Testing Research (WATeR). Canterbury, UK, pp. 1–4. [Google Scholar]
23. M. Belaoued and S. Mazouzi. (2016). “A Chi-square-based decision for real-time malware detection using PE-file features,” Journal of Information Processing Systems, vol. 12, no. 4, pp. 644–660. [Google Scholar]
24. A. Sami, B. Yadegari, H. Rahimi, N. Peiravian, S. Hashemi et al. (2010). , “Malware detection based on mining API calls,” in Proc. of the 2010 ACM Sym. on Applied Computing, Sierre Switzerland, pp. 1020–1025. [Google Scholar]
25. M. Eskandari and S. Hashemi. (2011). “Metamorphic malware detection using control flow graph mining,” International Journal of Computer Science and Network Security, vol. 11, no. 12, pp. 1–6. [Google Scholar]
26. A. Kumar, K. S. Kuppusamy and G. Aghila. (2019). “A learning model to detect maliciousness of portable executable using integrated feature set,” Journal of King Saud University-Computer and Information Sciences, vol. 31, no. 2, pp. 252–265. [Google Scholar]
27. S. N. Yin, H. S. Kang, Z. G. Chen and S. R. Kim. (2018). “A malware detection system based on heterogeneous information network,” in Proc. of the 2018 Conf. on Research in Adaptive and Convergent Systems, Honolulu Hawaii, USA, pp. 154–159. [Google Scholar]
28. M. E. Boujnouni, M. Jedra and N. Zahid. (2016). “New malware detection framework based on N-grams and Support Vector Domain Description,” in 2015 11th Int. Conf. on Information Assurance and Security (IAS). Marrakech, Morocco, pp. 123–128. [Google Scholar]
29. M. Siddiqui, M. C. Wang and J. Lee. (2008). “Data mining methods for malware detection using instruction sequences,” in AIA’08: Proc. of the 26th IASTED Int. Conf. on Artificial Intelligence and Applications, CA, USA, pp. 358–363. [Google Scholar]
30. A. Shabtai, R. Moskovitch, C. Feher, S. Dolev and Y. Elovic. (2012). “Detecting unknown malicious code by applying classification techniques on opcode patterns,” Security Informatics, vol. 1, no. 1, pp. 1–22. [Google Scholar]
31. H. C. Peng, F. H. Long and C. Ding. (2005). “Feature selection based on mutual information criteria of max-dependency, max-relevance, and min-redundancy,” IEEE Transactions on Pattern Analysis and Machine Intelligence, vol. 27, no. 8, pp. 1226–1238. [Google Scholar]
32. J. Yonts. (2012). “Attributes of malicious files,” SANS Institute InfoSec Reading Room. [Online]. Available: https://www.sans.org/reading-room/whitepapers/malicious/paper/33979 [Google Scholar]
33. V. S. Sathyanarayan, P. Kohli and B. Bruhadeshwar. (2008). “Signature generation and detection of malware families,” in Australasian Conf. on Information Security and Privacy. Berlin, Heidelberg, pp. 336–349. [Google Scholar]
34. Y. F. Ye, D. D. Wang, T. Li and D. Y. Ye. (2007). “IMDS: Intelligent malware detection system,” in Proc. of the 13th ACM SIGKDD Int. Conf. on Knowledge Discovery and Data Mining, California, USA, pp. 1043–1047. [Google Scholar]
35. S. Peisert, M. Bishop, S. Karin and K. Marzullo. (2007). “Analysis of computer intrusions using sequences of function calls,” IEEE Transactions on Dependable and Secure Computing, vol. 4, no. 2, pp. 137–150. [Google Scholar]
36. M. Belaoued and S. Mazouzi. (2014). “Statistical study of imported APIs by PE type malware,” in 2014 Int. Conf. on Advanced Networking Distributed Systems and Applications. Bejaia, Algeria, pp. 82–86. [Google Scholar]
37. I. Sorokin. (2011). “Comparing files using structural entropy,” Journal in Computer Virology, vol. 7, no. 4, pp. 259–265. [Google Scholar]
38. D. Baysa, R. M. Low and M. Stamp. (2013). “Structural entropy and metamorphic malware,” Journal of Computer Virology and Hacking Techniques, vol. 9, no. 4, pp. 179–192. [Google Scholar]
39. J. W. Fu, J. F. Xue, Y. Wang, Z. Y. Liu and C. Shan. (2018). “Malware visualization for fine-grained classification,” IEEE ACCESS, vol. 6, pp. 14510–14523. [Google Scholar]
40. M. Sharma, H. Pham and V. B. Singh. (2019). “Modeling and analysis of leftover issues and release time planning in multi-release open source software using entropy based measure,” Computer Systems Science and Engineering, vol. 34, no. 1, pp. 33–46. [Google Scholar]
41. D. Kim, G. Shin and M. Han. (2020). “Analysis of feature importance and interpretation for malware classification,” Computers Materials & Continua, vol. 65, no. 3, pp. 1891–1904. [Google Scholar]
42. Z. Lu, H. S. Kang and S. R. Kim. (2013). “Improved clustering for intrusion detection by principal component analysis with effective noise reduction,” in Information and Communication Technology-EurAsia Conf. Berlin, Heidelberg, pp. 490–495. [Google Scholar]
43. R. Chen, L. Pan, Y. Zhou and Q. Lei. (2020). “Image retrieval based on deep feature extraction and reduction with improved CNN and PCA,” Journal of Information Hiding and Privacy Protection, vol. 2, no. 2, pp. 9–18. [Google Scholar]
44. K. V. Uma and A. Alias. (2020). “C5.0 decision tree model using Tsallis entropy and association function for general and medical dataset,” Intelligent Automation & Soft Computing, vol. 26, no. 1, pp. 61–70. [Google Scholar]
45. Y. Ye, F. Liu, S. Zhao and Z. Liang. (2020). “Ensemble learning based on GBDT and CNN for adoptability prediction,” Computers Materials & Continua, vol. 65, no. 2, pp. 1361–1372. [Google Scholar]
46. T. Q. Chen and C. Guestrin. (2016). “Xgboost: A scalable tree boosting system,” in Proc. of the 22nd ACM sigkdd Int. Conf. on Knowledge Discovery and Data Mining, San Francisco, California, USA, pp. 785–794. [Google Scholar]
 | This work is licensed under a Creative Commons Attribution 4.0 International License, which permits unrestricted use, distribution, and reproduction in any medium, provided the original work is properly cited. |