DOI:10.32604/iasc.2021.015049
| Intelligent Automation & Soft Computing DOI:10.32604/iasc.2021.015049 | |
| Article |
Machine Learning in Detecting Schizophrenia: An Overview
1College of Behavioral and Social Sciences, California Baptist University, Riverside, 92504, USA
2Center for Innovation in Brain Science, University of Arizona, Tucson, 85721, USA
*Corresponding Author: Sara Moein. Email: saramoein@arizona.edu
Received: 04 November 2020; Accepted: 09 December 2020
Abstract: Schizophrenia (SZ) is a mental heterogeneous psychiatric disorder with unknown cause. Neuroscientists postulate that it is related to brain networks. Recently, scientists applied machine learning (ML) and artificial intelligence for the detection, monitoring, and prognosis of a range of diseases, including SZ, because these techniques show a high performance in discovering an association between disease symptoms and disease. Regions of the brain have significant connections to the symptoms of SZ. ML has the power to detect these associations. ML interests researchers because of its ability to reduce the number of input features when the data are high dimensional. In this paper, an overview of ML models for detecting SZ disorder is provided. Studies are presented that applied magnetic resonance imaging data and physiological signals as input data. ML is utilized to extract significant features for predicting and monitoring SZ. Reviewing a large number of studies shows that a support vector machine, deep neural network, and random forest predict SZ with a high accuracy of 70%–90%. Finally, the collected results show that ML methods provide reliable answers for clinicians when making decisions about SZ patients.
Keywords: Support vector machine (SVM); deep neural network (DNN); magnetic resonance imaging (MRI); accuracy; classification; feature
Schizophrenia (SZ), a debilitating mental disease, affects the thinking and feeling capacities in patients. Currently, there is no cure for SZ; however, methods like machine learning (ML) may help in its early detection, predict behaviors, and slow the decline of brain functioning. There were an estimated 20 million SZ cases across the globe in 2019 [1]. Researchers are challenged to predict SZ from subtle signs. Neuroimaging data is a promising resource in the application of pattern-recognition approaches, supporting clinicians in their decision-making processes. Magnetic resonance imaging (MRI) is another ML resource used to detect SZ [2]. During the onset of SZ, there are multiple abnormalities in cognition and physiological signals, including electroencephalogram (EEG) signals and MRI images. SZ is often diagnosed through clinical examination by psychiatrists. However, it can take up to two years for an accurate diagnosis. ML algorithms may help diagnose SZ in earlier stages [3].
In comparison with traditional methods, ML tools work with high-dimensional data to extract significant features. ML methods detect SZ by finding complex relationships between features, distinguishing between nonlinear associations. Traditional methods are unable to discover these associations. The output change in nonlinear systems is proportional to the change of features. Another advantage of ML models, their learning ability, uses current data (training data) to predict future data output.
There is a growing interest in the application of AI and ML in the field of biological psychiatry [4–7]. Researchers in ML and AI apply mathematical models to extract attributes or features from signals and images to determine associations between the features and the brain state to define if the brain is in a normal state [8]. As a powerful tool to unravel patterns in SZ datasets, ML interests scientists because some ML algorithms can discover nonlinear relationships among features. These, in turn, can predict diseases like SZ and monitor a disease’s nonlinear nature. Examples of highly accurate ML methods include the support vector machine (SVM), random forest (RF), Naïve Bayes (NB), artificial neural network (ANN), logistic regression (LR), and deep neural network (DNN) methods.
ML methods have successfully used neuroimaging data to classify cases as healthy controls and SZ, as well as predict an outcome [9,10]. Recently, studies have integrated data to generate rich input data, which has improved the classification of SZ patients from healthy controls [10]. In one study [11], researchers used structural MRI and resting-state functional MRI data from 295 patients with SZ and 45 healthy control samples from five research centers. The following features were extracted from the data: (a) matter volume, (b) white-matter volume, (c) amplitude of low-frequency fluctuation, and (d) regional homogeneity. In addition, the features included two connectome-wide metrics: functional connectivity (FC) matrices and structural covariance matrices. The SVM method was used to classify the data into SZ and healthy control groups. It applied 10-fold cross validation to confirm the results. Better performance is achieved using functional data with an accuracy of 82%. The use of all data (structural and functional) generated the best results, with an accuracy of 90%. This high performance of ML methods versus human decisions is based on mathematical functions in generating connections between features. Therefore, both clinical and non-clinical professionals are interested in applying ML to improve the quality of healthcare in the diagnosis, monitoring, and prognosis of SZ.
In one study [12], authors reported that the treatment of psychopathological patients was predicted with high accuracy by incorporating the ML method through cognitive and electrophysiological data. The study pooled data from comparable cohorts of antipsychotic-naïve in first-episode SZ patients. ML techniques have varying power in predicting the outcome. In ML, the “no free lunch” theorem states there is no algorithm that provides the highest performance for solving all problems. Therefore, researchers must test different ML models to obtain the performance and select the best version after a comparison of accuracy.
There are multiple definitions on ML and related tools. In the following sections, ML tools and review studies are discussed that prove the high performance of ML methods in the prediction, diagnosis, and prognosis of SZ. Finally, studies that have applied ML methods on significant regions of the brain for SZ diagnosis are explored.
AI has multiple subgroups, including ML, natural language processing (NLP), and computer vision. These subgroups make decisions regarding SZ disorder.
ML tools are a set of methods based on mathematical functions. These functions use input data to train a model, making it usable for calculating answers to future questions. The trained model predicts the future, generating results for the diagnosis and prognosis of SZ. In other words, there is no explicit rule when using ML tools to predict answers based on the training process. Training is the process of mathematical calculations to obtain a numerical value (or weight) to make connections between input and output features. Based on the ML model calculation, clinicians can detect the SZ state among other states of the brain.
Supervised learning and unsupervised algorithms are two categories of ML algorithms. In supervised algorithms, an output is associated with each of the input training data. Unsupervised algorithms do not have an output label related to the input data. ML algorithms include Bayesian networks, SVMs, linear regression, RFs, DNNs, and ANNs. The SVM kernel function utilizes nonlinear mapping to separate the data, which makes SVM an accurate method for prediction purposes. A DNN, a kind of ANN, provides high accuracy due to hidden layers within its structure. Therefore, most current studies apply these tools for detecting SZ and other diseases. Research centers have applied ML to detect SZ and predict its symptoms. Indicators of SZ include delusions, hallucinations, and disorganized thinking [13].
Researchers used multiple evaluation measures to evaluate their proposed intelligent method, including ML algorithms (as listed below). The objective of an AI-based method is to increase the accuracy, precision, recall, and R2 coefficient and decrease the mean square error (MSE):


where  is the actual output, and
  the predicted output, and
 is the number of samples,

Other evaluation measures of ML models are the receiver operating characteristic (ROC) and area under the curve (AUC). An ROC curve is a graphical tool for evaluating the performance of the ML algorithm when the data are classified into two classes or binary classifications (for example, the exploration of a patient’s SZ diagnosis). An ROC curve is obtained based on a false positive and true positive rate, changing the threshold of classification from 0 to 1. AUC is the area under the ROC curve. A larger area signifies a more accurate ML model. When AUC is 0.5, the ML model cannot classify the data and has low performance. When AUC is 1, the classifier has a high accuracy in detecting the classes.
Studies have used AUC to measure performance. The model accuracy is increased when the ML algorithm correctly predicts all the output labels (for example, in the classification of SZ patients and the healthy control group, detecting correct labels for SZ patients and healthy individuals). Precision increases when, among all SZ-predicted patients with class 1, more patients belong to class 1.
Recall or sensitivity increases when a greater number of SZ patients are predicted correctly. For example, 300 patients are predicted by the ML algorithm. One-hundred and fifty are SZ patients and 150 are normal. If the model predicted that 100 SZ patients from 300 and 70 are correctly SZ-predicted, the precision would be 70/100 = 0.7. The recall would be 70/150 ~ 0.46.
K-fold cross validation is a validation technique used to avoid overfitting or underfitting the model. In this method, the data are split into K non-overlapping subcategories. (K−1) categories are used for training the model; one remaining subcategory is used for validation. This process is repeated K times. The final performance of the model is based on averaging the performance from each validation set.
ML algorithms use K-fold cross validation to generalize their performance. In one study [14], researchers trained several classification models using 5-fold cross validation for the generalization of an error. Researchers separated the data into 80% training and 20% validation. Next, the precision, recall, accuracy, and F1 score on the validation set are calculated. The following subsection introduces powerful ML methods applied in SZ diagnosis and monitoring.
LR is a popular algorithm for the classification of binary problems. The binary classification aims to predict if a patient has SZ. LR uses the sigmoid function to obtain the probability of an occurrence per event (for example, obtaining the probability of a patient having SZ). LR has been used for the diagnosis of SZ in multiple studies. In one study [15], researchers used LR to select significant factors in the recovery stages of SZ patients among 75 Hong Kong adults. Data were collected on socio-demographic factors, recovery stages, and elements associated with recovery. LR could detect stage 3 recovery, “living with disability,” with an accuracy of 75.45%, and stage 4, “living beyond disability,” with a classification accuracy of 75.50%. LR could detect that age plays a meaningful role in distinguishing recovery stages.
NB is a supervised classifier that works based on Bayes theory. The basic assumption of NB is the independence of features. An NB classifier is a classic ML model; however, it provides significant performance in classification problems. In one study [16], data for 48 SZ patients and 24 healthy controls were collected and classified by NB. The dataset’s features included age, sex, full-scale intelligence quotient, positive and negative syndrome scale, and Wisconsin Card Sorting Test. The NB model could detect SZ with an accuracy of 67%.
A SVM is a popular algorithm for nonlinear transformation of input data based on kernel functions. There are several types of kernel functions, e.g., Gaussian radial basis, linear kernel, and polynomial functions. A SVM was used in many studies for detecting SZ. In one study [17], authors used MRI data collected from structural MRI scans. This was based on whole-brain gray-matter densities estimated using voxel-based morphometry of 212 individuals in SZ and healthy control categories. The cross validation technique was used to validate the results. The obtained accuracy for trained data was 86% for 127 individuals and 83% for the validation set with 85 individuals. The high accuracy of a SVM for classification of MRI data to distinguish SZ patients from normal individuals shows high performance of ML methods for detecting nonlinear associations between input and output data. This showcases that it can effectively handle high-dimensional data as well avoid overfitting.
RF, an ensemble ML model, is composed of multiple weak decision trees. Each decision tree works with two-thirds of the input data and includes a subset of features. The final prediction result from RF is based on averaging the results from all the trees. RF is a powerful ML algorithm that handles missing or duplicate data, as well as avoiding underfitting or overfitting. In addition, RF can obtain importance scores for each feature in the features set. Multiple studies have applied RF in detecting significant features in the detection and prediction of SZ.
In one study [18], researchers applied EEG signals to generate datasets and predict SZ and health controls with RF. The EEG signals were obtained from an online resource [19]. The dataset contained 32 health controls and 49 SZ patients. The dataset contained event-related potentials (ERPs) from basic sensory tasks. The data were collected from 64 EEG channels; however, only ERP averages from nine electrodes (Fz, FCz, Cz, FC3, FC4, C3, C4, CP3, and CP4) were used in the dataset for training the RF.
An EEG time series may contain four components:
a) Level: Baseline for a signal (when it is a straight line)
b) Trend: May linearly increase or decrease over time
c) Seasonality: Repeating pattern of a series over time
d) Irregularity: Variations in the series due to an unpredictable parameter and a pattern that does not repeat
Based on these components, the dataset is generated. Gender, age, and education are added to the feature set, and the RF is trained. The predicted outcome’s accuracy is 74%.
An ANN is a powerful ML method for solving problems, especially in SZ. An ANN is an analogy of the human brain with multiple connections between computation nodes. Each ANN has three layers: (a) input, (b) hidden, and (c) output. An artificial neuron, a mathematical unit for a nonlinear transformation, takes the weighted summation of nodes in the input layer and feeds the summation to the activation function [sigmoid, rectified linear unit (ReLU), and hyperbolic tangent]. The simplest ANN is a feedforward neural network.
A DNN is a complicated ANN with more than one hidden layer. These layers are responsible for discovering nonlinear relationships between input and output data. Researchers have used DNNs in various image processing tasks, including MRI analysis and the prediction of mental disease based on MRI images. A convolutional neural network (CNN), a kind of DNN, has been widely used for detecting mental health disorders [4–7]. The general shapes of DNNs and CNNs are introduced in Fig. 1, which are extracted from [20].
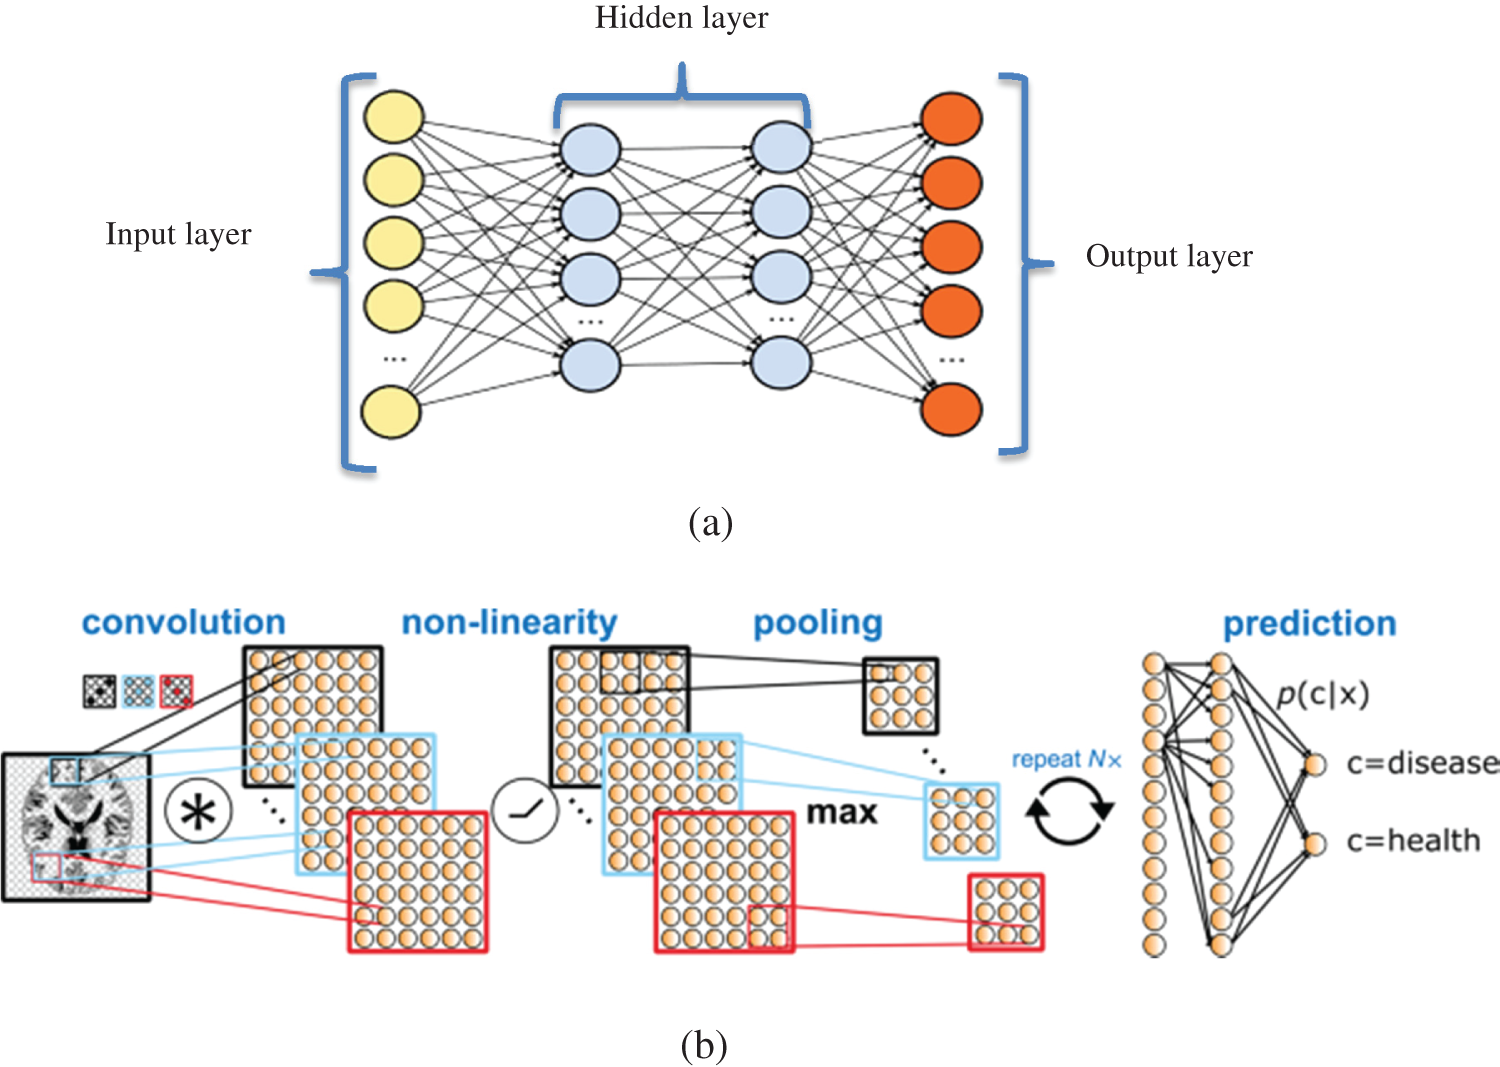
Figure 1: (a): DNN with multiple hidden layers; (b): CNN is a DNN with three types of hidden layers: (1) convolution layer for generating the feature map from MRI images; (2) nonlinearity layer for generating the sum of input weights from each feature is passed to a nonlinear function (such as ReLU); and (3) pooling layer for reducing the dimensionality (number of input features) for prediction. Input features will be used for prediction and detection of SZ or other disorders
Some articles proposed a CNN as a useful tool for the analysis of mental conditions based on EEG signals. Acharya et al. [21] applied a CNN for feature extraction from EEG signals, finding that EEG signals collected from the right hemisphere of the human brain are distinctive for detecting depression. A CNN is suitable for a diagnosis based on EEG signals. The raw signals are corrupted with environmental noises, which makes them unsuitable for prediction purposes. Therefore, pre-processing steps like data-transformation and -interpolation techniques are required to remove noise. In a CNN, the convolutional layers are responsible for the noise-removal process. This attribute makes it an interesting technique for researchers to use to detect diseases, including SZ.
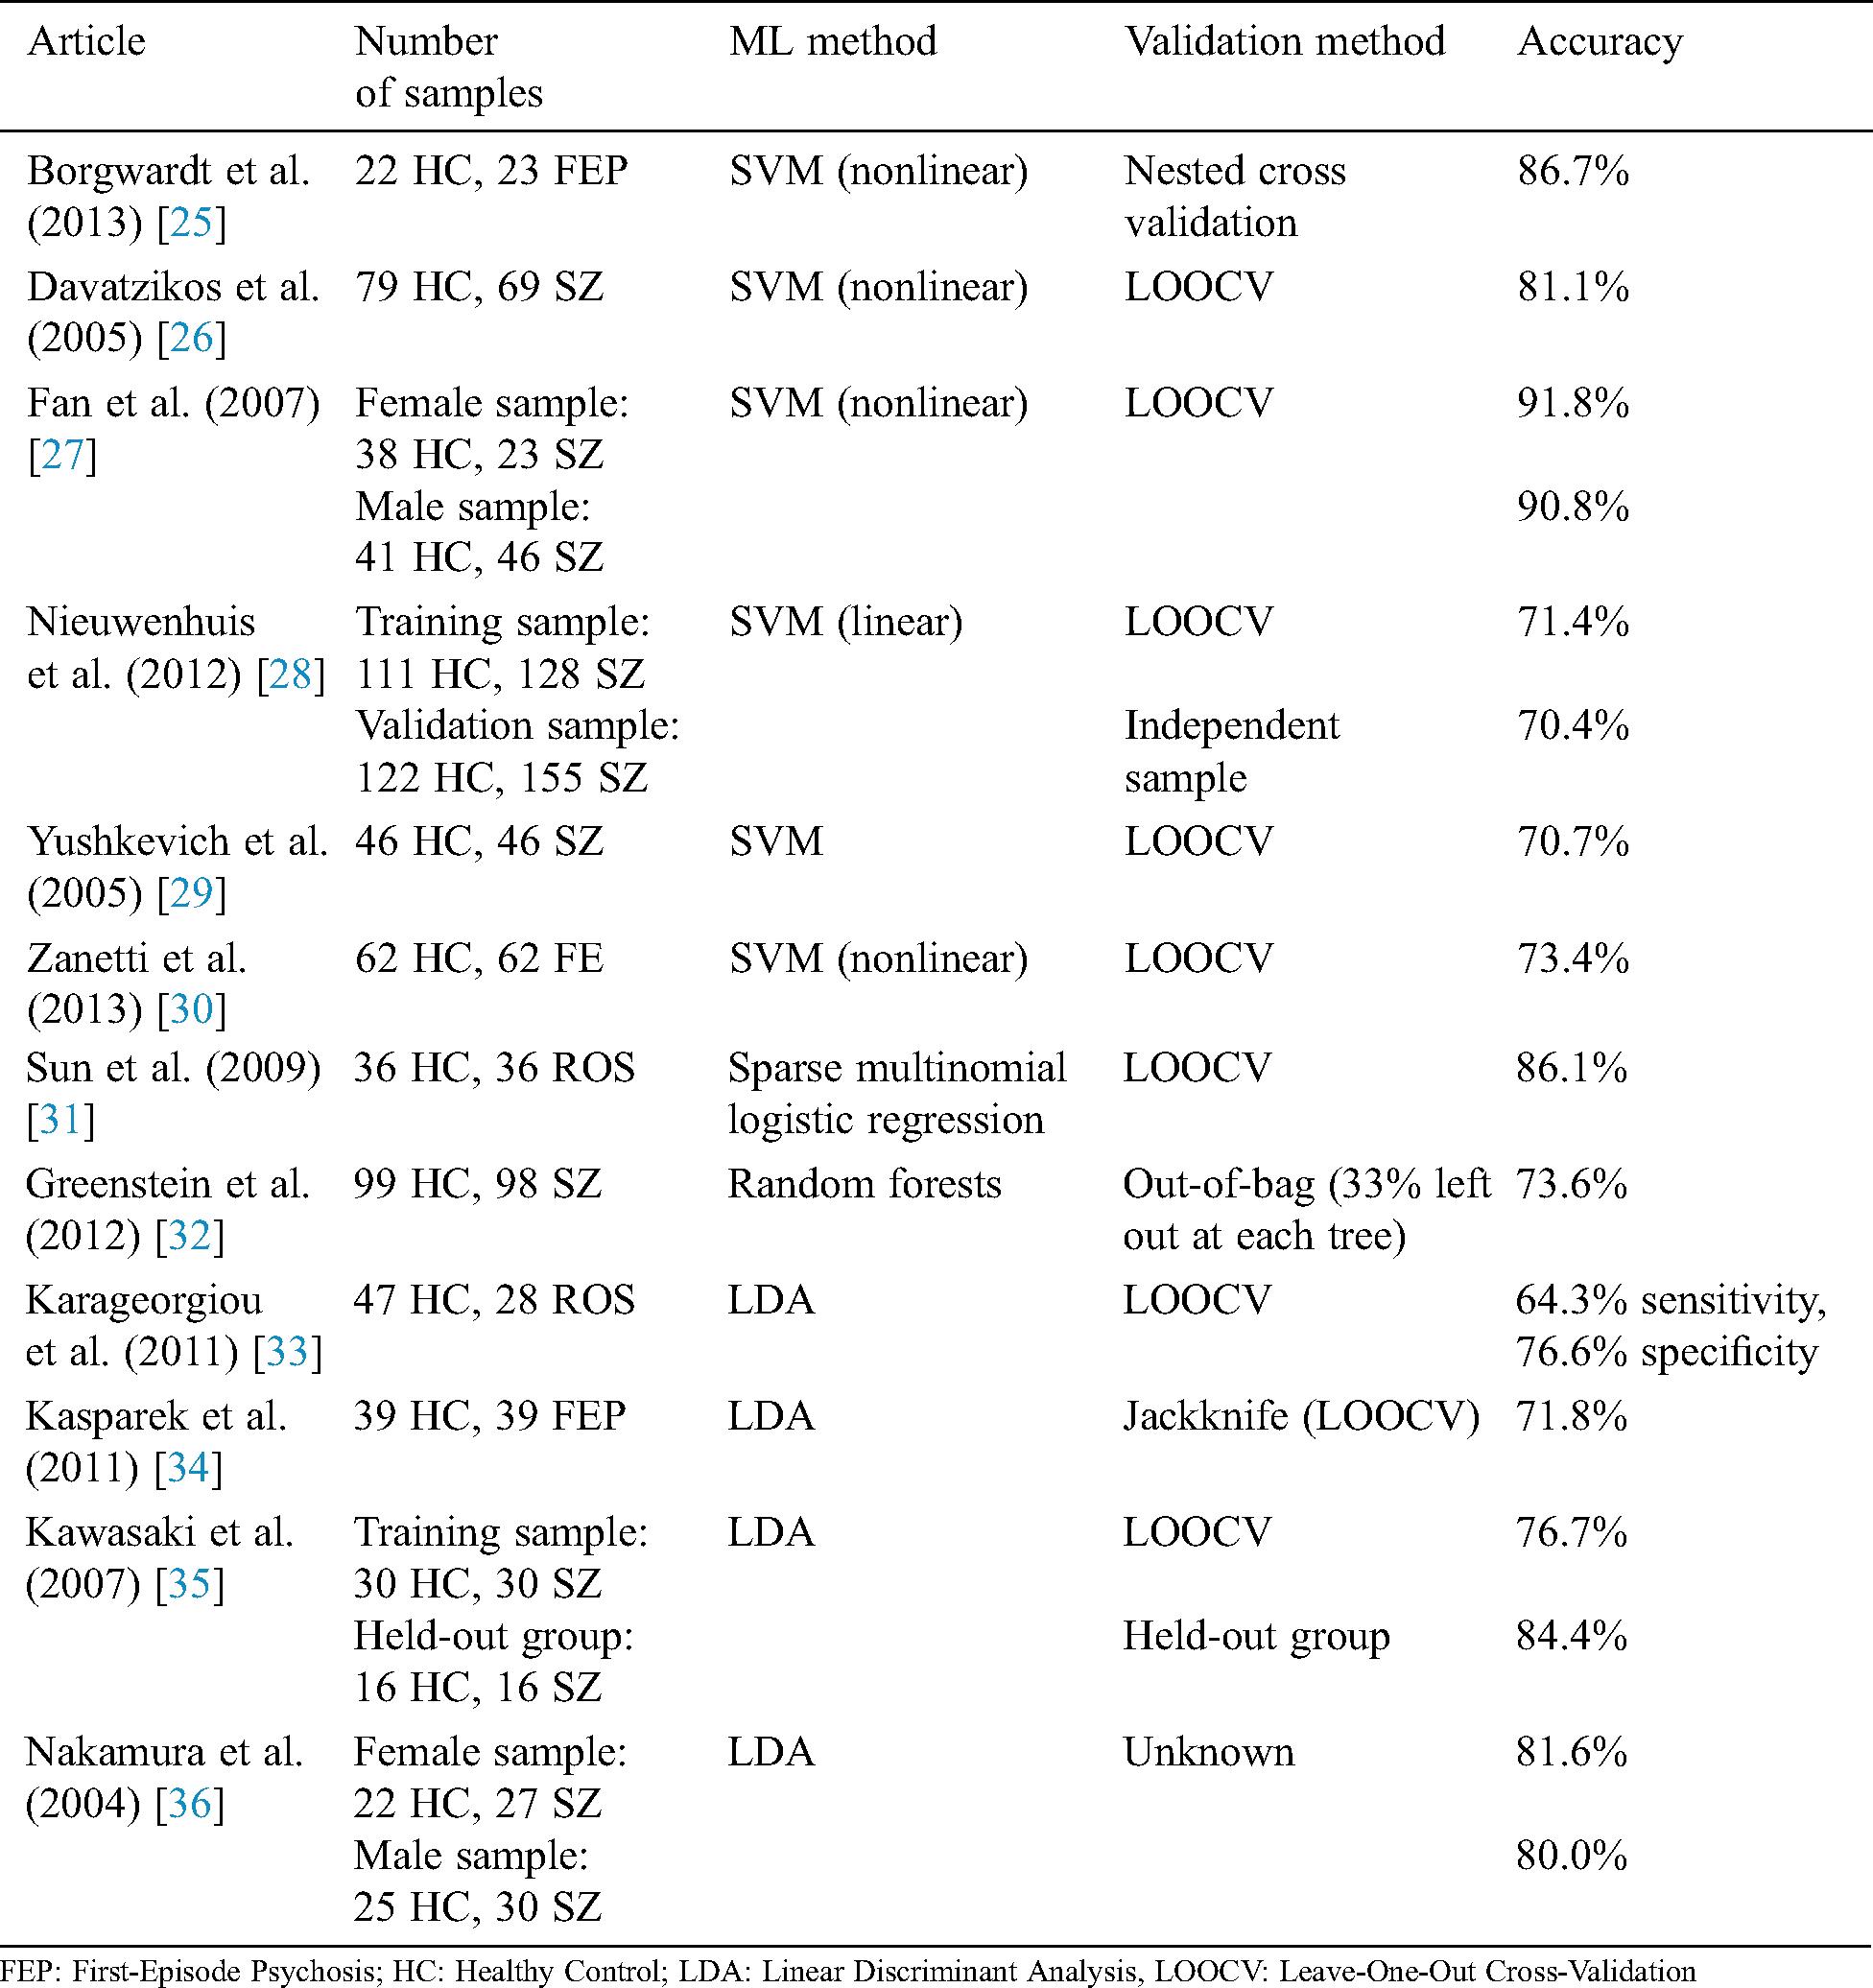
Multiple studies show the superior performance of DNNs for detecting SZ based on MRI data with acceptable accuracy (68.1%–85.0%) [21–24]. In one study [22], higher accuracy was achieved using a deep belief network compared with traditional ML algorithms. Using a DNN, SZ was identified in the study through five multicenter datasets of structural MRI. The results showed the brain region that contributed to the decisional process of DNN. A deep-learning algorithm was trained to identify SZ based on five multicenter datasets of structural MRI results. Researchers validated their results using the single-center clinical validation set. Their classification results show that the right-hand region of the brain provides higher accuracy for predicting SZ. The DNN could predict SZ with AUCs of 70%–90% for validation datasets. Tab. 1 shows studies that applied ML algorithms to the detection of SZ disorders.
Table 1: Studies using ML methods to detect SZ patients
NLP is the automatic method of extracting information from text data and training the intelligent method to detect the output or SZ disorder. NLP applies the linguistic context around the word, searching keywords and interesting phrases in the text. For example, it uses patients’ statements to distinguish stated symptoms of their SZ experiences. A keyword cannot classify patients. Therefore, it is necessary to extract the semantics using techniques to distinguish between these patients. Recently, ML algorithms have been used in NLP techniques to generate efficient results by combining learning processes with NLP methods. There are different resources of text data for detecting SZ. For example, Facebook and Twitter are rich resources for data using the NLP method for disease diagnosis [37].
The study reported in Rezaii et al. [3] used a skip-gram version of Word2vec from the Genism modules in Python [38]. This method identified a window of five words before and after the target word. The DNN had 200 hidden nodes; the text (42,833,581 sentences) was created by the Linguistic Data Consortium [39]. The proposed method could predict psychosis states in people with an accuracy of 93% in the training set and 90% in the validation set. The results show that the main signals of converting to psychosis are low semantic density and talking about voices.
Another study [38] used NLP for predicting psychosis based on 40 interview transcripts with the first episode of psychosis. The DNN discriminated speech of patients from the healthy control group with an accuracy of 99%. This study demonstrates the power of ML to extract knowledge from speech based on NLP techniques.
Twitter is a text resource for NLP methods and the detection of SZ patients. To detect patients, a set of features must be extracted from Twitter texts, including extracted words related to SZ and words describing emotions. For this purpose, a Natural Language Toolkit from Python was used to run the tokenization and lemmatization. Then, NumPy was used to extract numerical features [40].
3 SZ Diagnosis Using ML Based on Structural Neuroimaging Data
Researchers have applied structural and functional neuroimaging data to train the ML model, diagnose SZ, and extract knowledge from the data. Salvador et al. [41] compared ML methods like RF, SVM, and Lasso to detect SZ among 128 SZ cases, 128 bipolar cases, and 127 healthy control cases. Input features were gray and white matter voxel-based morphometry (VBM), vertex-based cortical thickness and volume, a set of regions of interest, volumetric measures, and wavelet-based morphometry. VBM is proven to be the most significant feature for distinguishing patients from a healthy control group.
One study [42] showed that SVM is a high-accuracy ML technique for classifying SZ disorder. In addition, pre-frontal and temporal cortices are strongly related to the diagnosis of SZ. SVM was also applied on data from 41 SZ and 42 healthy control cases based on data from gray-matter volume and WM volume of the brain. Abnormalities of the brain were detected by SVM with an accuracy of 88%. The authors concluded that there is a specific neuroimaging profile of the brain for detecting SZ.
A potential biomarker for detecting SZ is the pattern of illness-related gray matter, which identifies the structural brain alterations in SZ cases. In one study [43], researchers used SVM for analyzing the cortical thickness and surface-area measurements of a brain for 163 cases with a first episode of SZ and 163 healthy control cases. The research showed that gray matter is a contributing region in the default mode network (DMN), central executive network, salience network, and visual network (left fusiform, lingual, posterior cingulate, supramarginal, insula and right isthmus cingulate, lateral occipital, and lingual and frontal pole cortex). Their SVM classified the data with an accuracy of approximately 85% for surface area and 81% for cortical thickness. Another study [44] showed the application of SVM in pathologic changes in WM and GM (in bilateral insula, anterior cingulate cortex, thalamus, superior temporal cortex, and parahippocampal gyrus).
4 SZ Diagnosis Using ML Based on Functional Neuroimaging
Cabral et al. [45] applied multivariate pattern analysis (MVPA) to structural and functional magnetic-resonance-neuroimaging methods. In the study, the functional magnetic resonance imaging (fMRI) of 21 SZ patients and 74 healthy control cases was applied. The resting state of fMRI (rs-fMRI) and structural MRI (sMRI) generated the same accuracy (70.5% versus 69.7%, respectively) using the ML method. The combination of sMRI and rs-fMRI outperformed the performance of single MRI data with an accuracy of approximately 75%. This method discovered that the main region associated with SZ is subcortical short-range and particularly interhemispheric connections.
Other researchers applied rs_fMSRI to distinguish 20 SZ patients from 20 major depressive disorder (MDD) and 20 healthy control cases. Their study combined the FC density analysis with MVPA. The local FC density value distinguished MDD patients from SZ patients using data from the orbitofrontal cortex. That is to say, to better explain this result, patients with SZ had significantly lower connections in the pre-frontal cortex compared with MDD patients. Their proposed ML method generated an accuracy of approximately 85%. This study has shown the importance of the ML method in extracting knowledge from MRI data and differentiating between MDD and SZ cases [46].
One study applied neural networks with their designed activation function to classify 19 SZ patients and 15 healthy control cases. The data were based on stimuli responses like faces, scenes, objects, and scrambled images. The neural network analyzed functional MRI using the MVPA method. The study confirmed that the accuracy of their ML model was significantly associated with behavioral measures. It also showed that impairment correlates with decreasing performance for the 1-back matching task and patterns of cortical activity in the pre-frontal, sensory, and visual cortexes, which are reflected in altered behavior [47].
Wang et al. [48] used SVM algorithms for classification of 48 first-episode, drug-naïve adolescent-onset schizophrenia patients and 31 healthy control cases based on data of long- and short-range functional connectivity (lFC)-(sFC) through rs-fMRI. The model could detect abnormalities of lpFC and spFC in the brain. It classified the cases with an accuracy of 92%, sensitivity of 89%, and specificity of 96%. The research shows the power of SVM in finding nonlinear relationships between functional MRI data and the SZ disorder.
Guo et al. [49] worked on discovering the role of s-lFCs in fMRI for classification of healthy control cases from SZ patients. The studies used SVM for the classification task, showing that SZ patients with increasing spFC and lpFC in gray matter of DMN decrease both in sensorimotor circuits. One finding combined the spFC values in the right superior parietal lobule and lpFC in the left fusiform cerebellum gyrus, increasing the sensitivity and specificity of distinguishing SZ patients from healthy control cases.
Another study [50] used a hybrid ML model based on combining fMRI and single nucleotide polymorphism (SNP) data (combined SNP-fMRI). It distinguished 20 SZ patients from 20 healthy control cases with an accuracy of 87%. The data contained 150 SNPs; the top 15 SNPs were located in 14 significant genes. Brain regions with more contribution for detecting SZ were the inferior, middle, and medial frontal gyri, cingulate gyrus, superior temporal gyrus, and praecuneus.
Arbabshirani et al. [51] presented a SVM classifier to classify 195 SZ and 175 healthy control cases based on rs-fMRI of two types of features. The first, auto-connectivity, captured the temporal connectivity of the brain network. The second, functional network connectivity, captured the inter-network connectivity pattern. The SVM model could distinguish cases with an accuracy of 88%, 86% sensitivity, and 89% specificity.
In this review study, ML models are presented for detecting SZ patients among other cases. First, short descriptions of ML models are provided. Next, an application of ML models is presented for detecting significant regions of the brain in association with SZ disorder using MRI data. The important role of MRI data in generating a training dataset of SZ symptoms is discussed. Finally, a description of NLP and examples of extracted features from text resources like Twitter are provided.
The high accuracy obtained by ML models proves their reliability and ability to improve the quality of healthcare for patients. ML models play a significant role in obtaining insight from available data because of the complex nature of disease and data. Discovering nonlinear relationships between data features and outcome is not possible with traditional and statistical methods because of the high dimensionality of the data.
ML tools are complex in methodology, as well as difficult to understand. However, their high performance makes them a desirable tool for the automated prediction of problems. One challenge faced by researchers in the selection of accurate ML tools is the interpretability and simplicity of the model. Basically, high-performance algorithms have a “black box” that hides the mathematical operations, making it non-interpretable for researchers. Regarding problems, an easily interpretable model is useful when relationships between variables are questioned. However, if high accuracy is a major concern, the application of the ML tool with a black box like an ANN, SVM, and DNN is an interesting solution. These models produce high accuracies in prediction; however, they evade interpretation. Therefore, researchers must weigh accuracy and simplicity in the interpretation of the model.
Current studies on the application of ML in the diagnosis and prognosis of SZ show a limited number of papers related to ML models for predicting SZ based on omics data. Examples include significant genes detected by ML based on microarray data or the process to detect genes early in the diagnosis of SZ. However, there are limited data for detecting SZ. The availability of rich datasets is the best policy to guarantee the prediction accuracy. A large amount of data is required to train the ML model. More research is required to prepare new databases to detect SZ.
Providing new databases would be an effective step in developing an automated decision-support system for improving the quality of healthcare in the field of SZ. In addition, integrating different data (i.e., omics, MRI, and electronic health records) will improve the prediction accuracy. Recent applications of ML models have focused on the use of Big Data for extracting knowledge. This is a valuable path for future studies on effectively predicting SZ.
In this paper, it is proved that ML is a powerful tool for predicting SZ disorder. ML’s ability to detect the regions of the brain that contribute to SZ symptoms is discussed. Furthermore, studies in which structural and functional neuroimaging data were applied for detecting SZ patients are presented. If ML techniques are included in the diagnosis process of SZ patients, clinicians will be more effective in their detection of patients, even in early stages of the disorder. This will be a significant clinical improvement. Applying Big Data methods to extract knowledge from large databases combined with ML is suggested as future work regarding the detection of SZ disorder.
Funding Statement: The authors received no specific funding for this study.
Conflicts of Interest: The authors declare that they have no conflicts of interest to report regarding the present study.
1. S. L. James and D. Abate. (2017). “Global, regional, and national incidence, prevalence, and years lived with disability for 354 diseases and injuries for 195 countries and territories, 1990–2017: A systematic analysis for the global burden of disease study,” Lancet, vol. 392, no. 10159, pp. 1789–1858. [Google Scholar]
2. R. de Filippis, E. A. Carbone, R. Gaetano, A. Bruni, V. Pugliese et al. (2019). , “Machine learning techniques in a structural and functional MRI diagnostic approach in schizophrenia: A systematic review,” Neuropsychiatric Disease and Treatment, vol. 15, pp. 1605–1627. [Google Scholar]
3. N. Rezaii, E. Walker and P. A. Wolff. (2019). “Machine learning approach to predicting psychosis using semantic density and latent content analysis,” NPJ Schizophrenia, vol. 5, no. 1, pp. 203. [Google Scholar]
4. S. Vieira, W. H. Pinaya and A. Mechelli. (2017). “Using deep learning to investigate the neuroimaging correlates of psychiatric and neurological disorders: Methods and applications,” Neuroscience and Biobehavioral Reviews, vol. 74, pp. 58–75. [Google Scholar]
5. A. Riaz, M. Asad, E. Alonso and G. Slabaugh. (2018). “Deep fMRI: An end-to-end deep network for classification of fMRI data,” in Proc. 2018 IEEE 15th Int. Sym. on Biomedical Imaging, Washington, DC, USA, pp. 1419–1422. [Google Scholar]
6. L. Zou, J. Zheng, C. Miao, M. J. Mckeown and Z. J. Wang. (2017). “3D CNN based automatic diagnosis of attention deficit hyperactivity disorder using functional and structural MRI,” IEEE Access, vol. 5, pp. 23626–23636. [Google Scholar]
7. X. Geng and J. Xu. (2017). “Application of autoencoder in depression diagnosis,” in 2017 3rd Int. Conf. on Computer Science and Mechanical Automation, Wuhan, China. [Google Scholar]
8. K. S. Ambrosen, M. W. Skjerbæk, J. Foldager, M. C. Axelsen, N. Bak et al. (2020). , “A machine-learning framework for robust and reliable prediction of short- and long-term treatment response in initially antipsychotic-naïve schizophrenia patients based on multimodal neuropsychiatric data,” Translational Psychiatry, vol. 10, no. 1, pp. 276. [Google Scholar]
9. M. R. Arbabshirani, S. Plis, J. Sui and V. D. Calhoun. (2017). “Single subject prediction of brain disorders in neuroimaging: Promises and pitfalls,” Neuroimage, vol. 145, pp. 137–165. [Google Scholar]
10. R. J. Janssen, J. Mourão-Miranda and H. G. Schnack. (2018). “Making individual prognoses in psychiatry using neuroimaging and machine learning,” Biological Psychiatry: Cognitive Neuroscience and Neuroimaging, vol. 3, no. 9, pp. 798–808. [Google Scholar]
11. N. T. Doan, T. Kaufmann, F. Bettella, K. N. Jørgensen, C. L. Brandt et al. (2017). , “Distinct multivariate brain morphological patterns and their added predictive value with cognitive and polygenic risk scores in mental disorders,” NeuroImage: Clinical, vol. 15, pp. 719–731. [Google Scholar]
12. N. Bak, B. Ebdrup, B. Oranje, B. Fugerlund, M. H. Jensen et al. (2017). , “Two subgroups of antipsychotic-naive, first-episode schizophrenia patients identified with a Gaussian mixture model on cognition and electrophysiology,” Translational Psychiatry, vol. 7, no. 4, pp. e1087. [Google Scholar]
13. T. Rahman and J. Lauriello. (2016). “Schizophrenia: An overview,” Focus (American Psychiatric Publishing), vol. 14, no. 3, pp. 300–307. [Google Scholar]
14. K. McManus, E. K. Mallory, R. L. Goldfeder, W. A. Haynes and J. D. Tatum. (2015). “Mining twitter data to improve detection of schizophrenia,” AMIA Joint Summits on Translational Science Proceedings. AMIA Joint Summits on Translational Science, pp. 122–126, . https://pubmed.ncbi.nlm.nih.gov/26306253/. [Google Scholar]
15. S. Borgwardt, N. Koutsouleris, J. Aston, E. Studerus, R. Smieskova et al. (2013). , “Distinguishing prodromal from first-episode psychosis using neuroanatomical single-subject pattern recognition,” Schizophrenia Bulletin, vol. 39, no. 5, pp. 1105–1114. [Google Scholar]
16. Y. T. Jo, S. W. Joo, S. H. Shon, H. Kim, Y. Kim et al. (2020). , “Diagnosing schizophrenia with network analysis and a machine learning method,” International Journal of Methods in Psychiatric Research, vol. 29, no. 1, pp. 147. [Google Scholar]
17. R. Chin, A. X. You, F. Meng, J. Zhou and K. Sim. (2018). “Recognition of schizophrenia with regularized support vector machine and sequential region of interest selection using structural magnetic resonance imaging,” Scientific Reports, vol. 8, no. 1, pp. 635. [Google Scholar]
18. L. Zhang. (2019). “EEG signals classification using machine learning for the identification and diagnosis of schizophrenia,” in 41st Annual Int. Conf. of the IEEE Engineering in Medicine and Biology Society (EMBCBerlin, Germany, pp. 4521–4524. [Google Scholar]
19. D. Greenstein, J. D. Malley, B. Weisinger, L. Clasen and N. Gogtay. (2012). “Using multivariate machine learning methods and structural MRI to classify childhood onset schizophrenia and healthy controls,” Frontiers in Psychiatry, vol. 3, pp. 53. [Google Scholar]
20. D. Durstewitz, G. Koppe and A. Meyer-Lindenberg. (2019). “Deep neural networks in psychiatry,” Molecular Psychiatry, vol. 24, no. 11, pp. 1583–1598. [Google Scholar]
21. U. R. Acharya, S. L. Oh, Y. Hagiwara, J. H. Tan, H. Adeli et al. (2018). , “Automated EEG-based screening of depression using deep convolutional neural network,” Computer Methods and Programs in Biomedicine, vol. 161, pp. 103–113. [Google Scholar]
22. J. Oh, B. Oh, K. Lee, J. Chae and K. Yun. (2020). “Identifying schizophrenia using structural MRI with a deep learning algorithm,” Frontiers in Psychiatry, vol. 11, no. 16, pp. 16. [Google Scholar]
23. Y. Xiao, Z. Yan, Y. Zhao, B. Tao, H. Sun et al. (2019). , “Support vector machine-based classification of first episode drug-naïve schizophrenia patients and healthy controls using structural MRI,” Schizophrenia Research, vol. 214, pp. 11–17. [Google Scholar]
24. W. H. Pinaya, A. Gadelha, O. M. Doyle, C. Noto, A. Zugman et al. (2016). , “Using deep belief network modelling to characterize differences in brain morphometry in schizophrenia,” Scientific Reports, vol. 6, no. 1, pp. 38897. [Google Scholar]
25. S. Borgwardt, N. Koutsouleris, J. Aston, E. Studerus, R. Smieskova et al. (2013). , “Distinguishing prodromal from first-episode psychosis using neuroanatomical single-subject pattern recognition,” Schizophrenia Bulletin, vol. 39, no. 5, pp. 1105–1114. [Google Scholar]
26. C. Davatzikos, D. Shen, R. C. Gur, X. Wu, D. Liu et al. (2005). , “Whole-brain morphometric study of schizophrenia revealing a spatially complex set of focal abnormalities,” Archives of General Psychiatry, vol. 62, no. 11, pp. 1218–1227. [Google Scholar]
27. Y. Fan, D. Shen, R. C. Gur, R. E. Gur and C. Davatzikos. (2007). “COMPARE: Classification of morphological patterns using adaptive regional elements,” IEEE Transactions on Medical Imaging, vol. 26, no. 1, pp. 93–105. [Google Scholar]
28. M. Nieuwenhuis, N. E. van Haren, H. E. Hulshoff Pol, W. Cahn, R. S. Kahn et al. (2012). , “Classification of schizophrenia patients and healthy controls from structural MRI scans in two large independent samples,” NeuroImage, vol. 61, no. 3, pp. 606–612. [Google Scholar]
29. P. Yushkevich, A. Dubb, Z. Xie, R. Gur, R. Gur et al. (2005). , “Regional structural characterization of the brain of schizophrenia patients,” Academic Radiology, vol. 12, no. 10, pp. 1250–1261. [Google Scholar]
30. M. V. Zanetti, M. S. Schaufelberger, J. Doshi, Y. Ou, L. K. Ferreira et al. (2013). , “Neuroanatomical pattern classification in a population-based sample of first-episode schizophrenia,” Progress in Neuro-Psychopharmacology and Biological Psychiatry, vol. 3, no. 43, pp. 116–125. [Google Scholar]
31. D. Sun, R. G. van Erp, P. M. Thompson, C. E. Bearden, M. Daley et al. (2009). , “Elucidating a magnetic resonance imaging-based neuroanatomic biomarker for psychosis: Classification analysis using probabilistic brain atlas and machine learning algorithms,” Biological Psychiatry, vol. 66, no. 11, pp. 1055–1060. [Google Scholar]
32. D. Greenstein, J. D. Malley, B. Weisinger, L. Clasen and N. Gogtay. (2012). “Using multivariate machine learning methods and structural MRI to classify childhood onset schizophrenia and healthy controls,” Frontiers in Psychiatry, vol. 3, pp. 53. [Google Scholar]
33. E. Karageorgiou, S. C. Schulz, R. L. Gollub, N. C. Andreasen, B. C. Ho et al. (2011). , “Ho etal, Neuropsychological testing and structural magnetic resonance imaging as diagnostic biomarkers early in the course of schizophrenia and related psychoses,” Neuroinformatics, vol. 9, no. 4, pp. 321–333. [Google Scholar]
34. T. Kasparek, C. E. Thomaz, J. R. Sato, D. Schwarz, E. Janousova et al. (2011). , “Maximum-uncertainty linear discrimination analysis of first-episode schizophrenia subjects,” Psychiatry Research: Neuroimaging, vol. 191, no. 3, pp. 174–181. [Google Scholar]
35. Y. Kawasaki, M. Suzuki, F. Kherif, T. Takahashi, S. Y. Zhou et al. (2007). , “Multivariate voxel-based morphometry successfully differentiates schizophrenia patients from healthy controls,” NeuroImage, vol. 34, no. 1, pp. 235–242. [Google Scholar]
36. K. Nakamura, Y. Kawasaki, M. Suzuki, H. Hagino, K. Kurokawa et al. (2004). , “Multiple structural brain measures obtained by three-dimensional magnetic resonance imaging to distinguish between schizophrenia patients and normal subjects,” Schizophrenia Bulletin, vol. 30, no. 2, pp. 393–404. [Google Scholar]
37. J. L. Winterburn, A. N. Voineskos, G. A. Devenyi, E. Plitman and C. D. Fuente-Sandoval. (2019). “Can we accurately classify schizophrenia patients from healthy controls using magnetic resonance imaging and machine learning? A multi-method and multi-dataset study,” Schizophrenia Research, vol. 214, pp. 3–10. [Google Scholar]
38. D. Si, S. C. Cheng, R. Xing, C. Liu and H. Y. Wu. (2019). “Scaling up prediction of psychosis by natural language processing,” in IEEE 31st Int. Conf. on Tools with Artificial Intelligence (ICTAIPortland, OR, USA, pp. 339–347. [Google Scholar]
39. E. Sandhaus, “The New York Times annotated corpus,” Linguistic Data Consortium, Philadelphia, 2008. [Google Scholar]
40. E. Grave, P. Bojanowski, P. Gupta, A. Joulin and T. Mikolov. (2018). “Learning word vectors for 157 languages,” in Proc. of the Int. Conf. on Language Resources and Evaluation, pp. 3473–3487, , Available in: https://arxiv.org/abs/1802.06893. [Google Scholar]
41. R. Salvador, J. Radua, E. J. Canales-Rodríguez, A. Solanes, S. Sarro et al. (2017). , “Evaluation of machine learning algorithms and structural features for optimal MRI-based diagnostic prediction in psychosis,” PLoS One, vol. 12, no. 4, pp. e0175683. [Google Scholar]
42. X. Lu, Y. Yang, F. Wu, M. Jao, Y. Xo et al. (2016). , “Discriminative analysis of schizophrenia using support vector machine and recursive feature elimination on structural MRI images,” Medicine (Baltimore), vol. 95, no. 30, pp. e3973. [Google Scholar]
43. Y. Xiao, Z. Yan, Y. Zhao, B. Tao, H. Sun et al. (2019). , “Support vector machine-based classification of first episode drug-naïve schizophrenia patients and healthy controls using structural MRI,” Schizophrenia Research, vol. 214, pp. 11–17. [Google Scholar]
44. S. J. Iwabuchi, P. F. Liddle and L. Palaniyappan. (2013). “Clinical utility of machine-learning approaches in schizophrenia: Improving diagnostic confidence for translational neuroimaging,” Frontiers in Psychiatry, vol. 4, pp. 95. [Google Scholar]
45. C. Cabral, L. Kambeitz-Ilankovic, J. Kambeitz, V. D. Calhoun, D. B. Dwyer et al. (2016). , “Classifying schizophrenia using multimodal multivariate pattern recognition analysis: Evaluating the impact of individual clinical profiles on the neurodiagnostic performance,” Schizophrenia Bulletin, vol. 42, no. suppl 1, pp. S110–S117. [Google Scholar]
46. X. Chen, C. Liu, H. He, X. Chang, Y. Jiang et al. (2017). , “Transdiagnostic differences in the resting-state functional connectivity of the prefrontal cortex in depression and schizophrenia,” Journal of Affective Disorders, vol. 217, pp. 118–124. [Google Scholar]
47. J. H. Yoon, D. Tamir, M. J. Minzenberg, J. D. Ragland, S. Ursu et al. (2008). , “Multivariate pattern analysis of functional magnetic resonance imaging data reveals deficits in distributed representations in schizophrenia,” Biological Psychiatry, vol. 64, no. 12, pp. 1035–1041. [Google Scholar]
48. S. Wang, Y. Zhan, Y. Zhang, L. Lyu, G. Wang et al. (2018). , “Long- and short-range functional connectivity in adolescent-onset schizophrenia patients: A resting-state fMRI study,” Progress in Neuro-Psychopharmacology and Biological Psychiatry, vol. 81, pp. 445–451. [Google Scholar]
49. W. Guo, F. Liu, J. Chen, R. Wu, L. Li et al. (2017). , “Using short-range and long-range functional connectivity to identify schizophrenia with a family-based case-control design,” Psychiatry Research: Neuroimaging, vol. 264, pp. 60–67. [Google Scholar]
50. H. Yang, J. Liu, J. Sui, G. Pearlson and V. D. Calhoun. (2010). “A hybrid machine learning method for fusing fMRI and genetic data: Combining both improves classification of schizophrenia,” Frontiers in Human Neuroscience, vol. 4, no. 192, pp. 1–9. [Google Scholar]
51. M. R. Arbabshirani, E. Castro and V. D. Calhoun. (2014). “Accurate classification of schizophrenia patients based on novel resting-state fMRI features,” Int. Conf. IEEE Engineering in Medicine and Biology Society, pp. 6691–6694. [Google Scholar]
 | This work is licensed under a Creative Commons Attribution 4.0 International License, which permits unrestricted use, distribution, and reproduction in any medium, provided the original work is properly cited. |