DOI:10.32604/iasc.2021.015198
| Intelligent Automation & Soft Computing DOI:10.32604/iasc.2021.015198 | |
| Article |
Live Data Analytics with IoT Intelligence-Sensing System in Public Transportation for COVID-19 Pandemic
1College of Computer Science and Engineering, University of Jeddah, Saudi Arabia
2College of Computing and Informatics, Saudi Electronic University, Saudi Arabia
*Corresponding Author: Abdullah Alamri. Email: amalamri@uj.edu.sa
Received: 09 November 2020; Accepted: 16 December 2020
Abstract: The COVID-19 pandemic has presented an unprecedented challenge to the entire world. It is a humanitarian crisis on a global scale. The virus continues to spread throughout nations, putting health systems under enormous pressure in the battle to save lives. With this growing crisis, companies and researchers worldwide are searching for ways to overcome the challenges associated with this virus. Also, the transport sector will play a critical role in revitalizing economies while simultaneously containing the spread of COVID-19. As the virus is still circulating, the only solution is to redesign public transportation to make people feel safe. In this paper, we have proposed a system based on computer vision and IoT sensor infrared technology with live data analytics. The proposed system is capable of gathering, storing, analyzing, processing, and handling the vast amount of data produced by the IoT sensors, and provides the users with real-time information on potential events affecting public transport, thereby enabling users to make well-informed and timely decisions. The evaluation showed that, despite the complexity of the system, it performs well.
Keywords: IoT; big data; data analytics; cloud computing; fog computing; COVID-19
Since the first report of coronavirus disease 2019 (COVID-19) at Wuhan, China in December 2019, according to the Center for Systems Science and Engineering of Johns Hopkins University, it has now affected at least 41 million people worldwide and been responsible for more than one million deaths [1]. The COVID-19 pandemic has presented an unprecedented challenge to the entire world. It is a humanitarian crisis on a global scale. The virus continues to spread throughout nations worldwide, putting health systems under enormous pressure in the battle to save lives.
With this growing epidemic, researchers around the world are searching for ways to cope with the complexities of this virus, to mitigate its spread, and to create a vaccine for this disease. Science and technology have an important part to play in this crisis. For example, various countries have concentrated on artificial intelligence (AI) technology early in the epidemic of the virus by focusing on facial recognition cameras to detect infected humans, robots and drones to deliver food and medicines to patients and disinfect public places, to patrol streets, and broadcast voice messages to the public urging them to stay at home.
The transport sector will play a critical role in moving economies again while containing the spread of COVID-19. Many people need to leave their homes and use public transport to generate income. The provision of products and services still depends on workers reaching their workplaces, and many of those who must continue to move depend on public transportation systems, which are uniquely positioned to carry large numbers of passengers across crowded urban areas. Even during an outbreak, public transportation remains a critical service to the communities as the backbone of sustainable mobility and essential for economic recovery. However, public transport systems can be considered a risk environment [2], because:
1. There are a great number of people in a confined space with limited ventilation.
2. There is no system for identifying potentially sick persons.
As the virus is still circulating, the only solution is to redesign public transportation so that people feel safe.
It is time consuming to apply to commuters the popular method of temperature checking due to the crowding of people, and not all public transport points and stops can be covered. We have proposed a system based on computer vision and IoT sensor infrared technology with live data analytics. This system makes it possible to track passengers in a contactless, reliable, and efficient manner and, unlike traditional systems, people will be unaware of it. With this technology in place, people with an elevated body temperature or abnormal breathing rate can be located quickly and accurately.
The envisioned goal of this research is to create live-data analytics with an IoT intelligence-sensing system. The proposed system is capable of gathering, storing, analyzing, processing, and handling the vast amount of data produced by IoT sensors, and provides the users with real-time information on the potential public transport events, thereby enabling users to make well-informed and timely decisions. This research paper addresses the following questions:
1. What are the functions that need to be implemented in IoT sensing intelligence system?
2. What are the challenges facing the processing and management of the vast amount of intelligent data being generated?
The rest of the paper is structured as follows: The background and current literature related to this field of study are presented in Section 2. The architecture of the proposed structure consisting of three functional layers is presented in Section 3. This work is motivated by describing motivation example in Section 4. In Section 5, experiments based on the distributed MongoDB database with parallel processing tasks that leverage the benefits offered by Apache Spark are discussed. Section 6 concludes the paper and suggests future research directions.
Governments worldwide have responded to the circumstances of the unprecedented COVID-19 pandemic. Many countries and regions have imposed stricter measures on public transport operators to prevent and help to curb the spread of the viruses. The body temperature of passengers is being scanned to contain the spread of COVID-19, and symptom screening has become a ubiquitous tool in the global response. The primary goal of this activity is to contain the spread of COVID-19 by reducing as much as possible the contact between groups of people.
Several technologies have been applied to devise direct and indirect techniques to monitor body temperature and breathing activity. For example, for body temperature, infrared thermometers (IRT) are fast, convenient, and easy to use [3,4]. Regarding respiratory rate, these techniques include direct contact such as microphone [5,6], magnetic induction [7,8] and capacitive [9,10], and indirect techniques (contactless) such as laser radar detection [11,12], electromagnetic radar detection [13,14], ultrasonic radar detection [15–17], thermographic imaging [18], and video camera imaging [19]. However, each of these techniques requires different type of monitoring and has benefits and drawbacks. More details about these techniques can be found in references [20,21].
The available scientific literature supports the use of a wide range of no-contact, infrared thermometer, and temperature scanning solutions to detect elevated temperatures1 These devices have many benefits, in that they help to determine whether a passenger has a COVID-19 infection. This study supports using the thermal image processing approach that uses a thermal camera equipped with IRT to remotely sense multiple symptoms in passengers Fig. 1.
Thermal imaging is a non-contact and non-intrusive technique that uses thermal or infrared sensors capable of displaying the temperature of humans and measuring their respiratory rate. These cameras are being leveraged in many industrial and/or research fields including medical diagnostics, meteorology, environmental studies, and architecture, where temperature is a key variable.
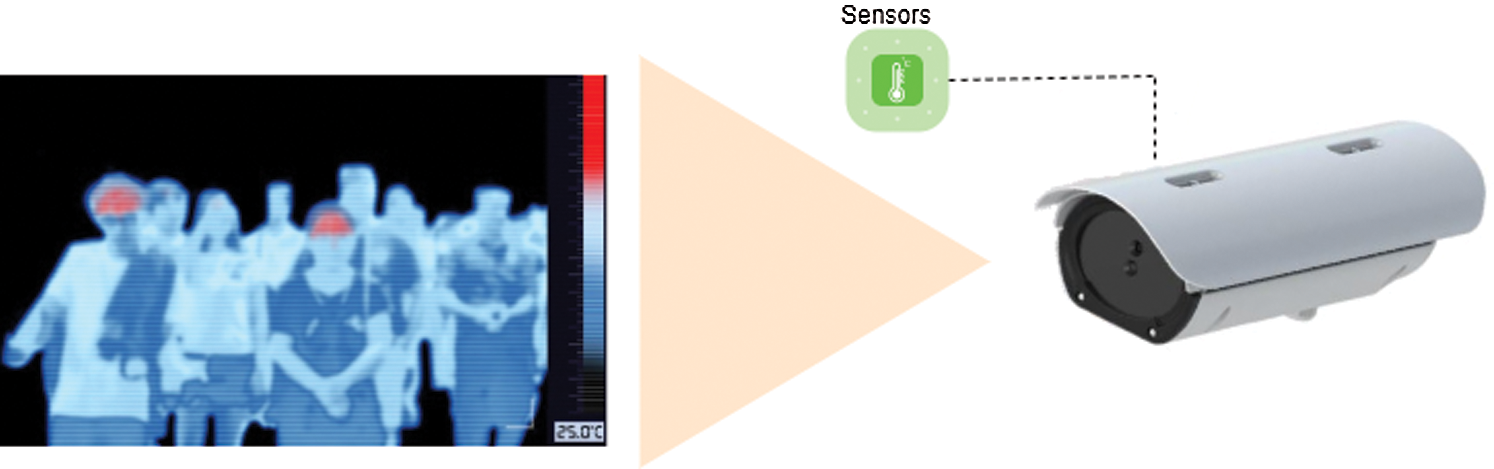
Figure 1: Thermal image system
The IoT devices have limited processing power in computing and storage resources to perform advanced analytical tasks. Cloud computing provides a very powerful solution for IoT application, service, and resource management [22–24]. The integration of cloud infrastructure with IoT architecture brings significant advantages to IoT including data analytical tasks [22]. However, the transmission of data over the Internet between IoT devices and the cloud increases the delay and traffic of the network. To reduce the latency and network traffic between IoT devices and the cloud, fog architecture is used to overcome several problematic issues [23,25].
Existing traditional approaches for addressing challenges of COVID-19 in the transport sector do not achieve success and may not be sufficient to prevent and help to curb the spread of the viruses. The cloud-based live data analytics with an IoT intelligence-sensing system discussed in this paper, offer a number of advantages. However, we need more than just sensors and internet access to construct a tool that is highly effective. Indeed, this infrastructure must be backed by a system capable of capturing, storing, analyzing, processing, and handling the vast amount of data produced by IoT sensors (the big data challenge). Fig. 2 demonstrates the system configuration that allows task automation based on the data that the interconnected sensors collect. Furthermore, it provides the users with real-time information about the potential public transport events to enable the users to make well-informed and timely decisions.
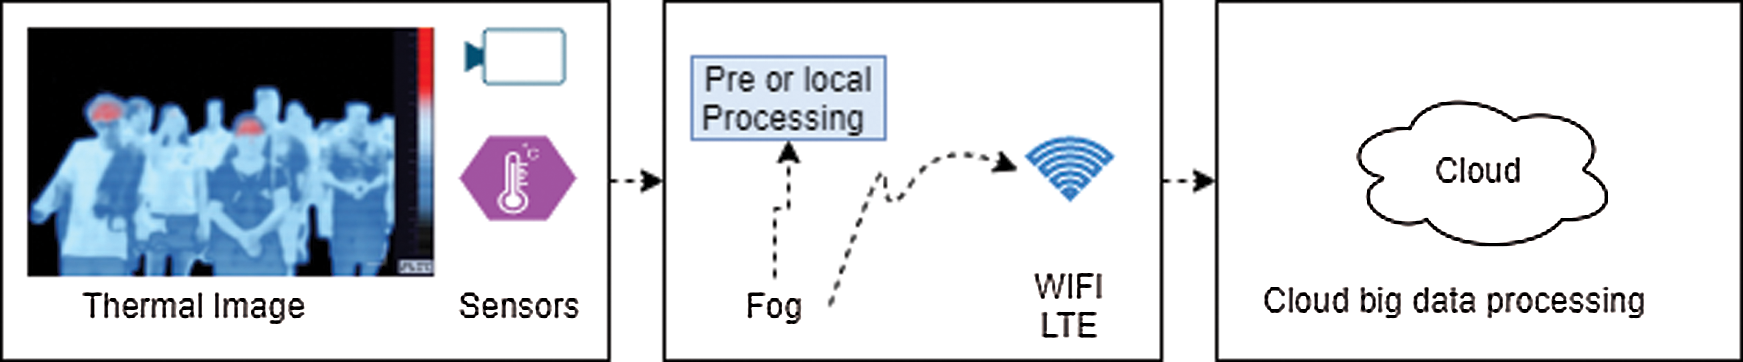
Figure 2: The overview of the real time of cloud-fog based IoT intelligence-sensing system
3 The Architecture of Live Data Analytics with IoT Intelligence-Sensing System
Fig. 3 presents the architecture of the proposed system consisting of three functional layers: IoT sensors, fog computing and cloud computing which work in conjunction with one another.
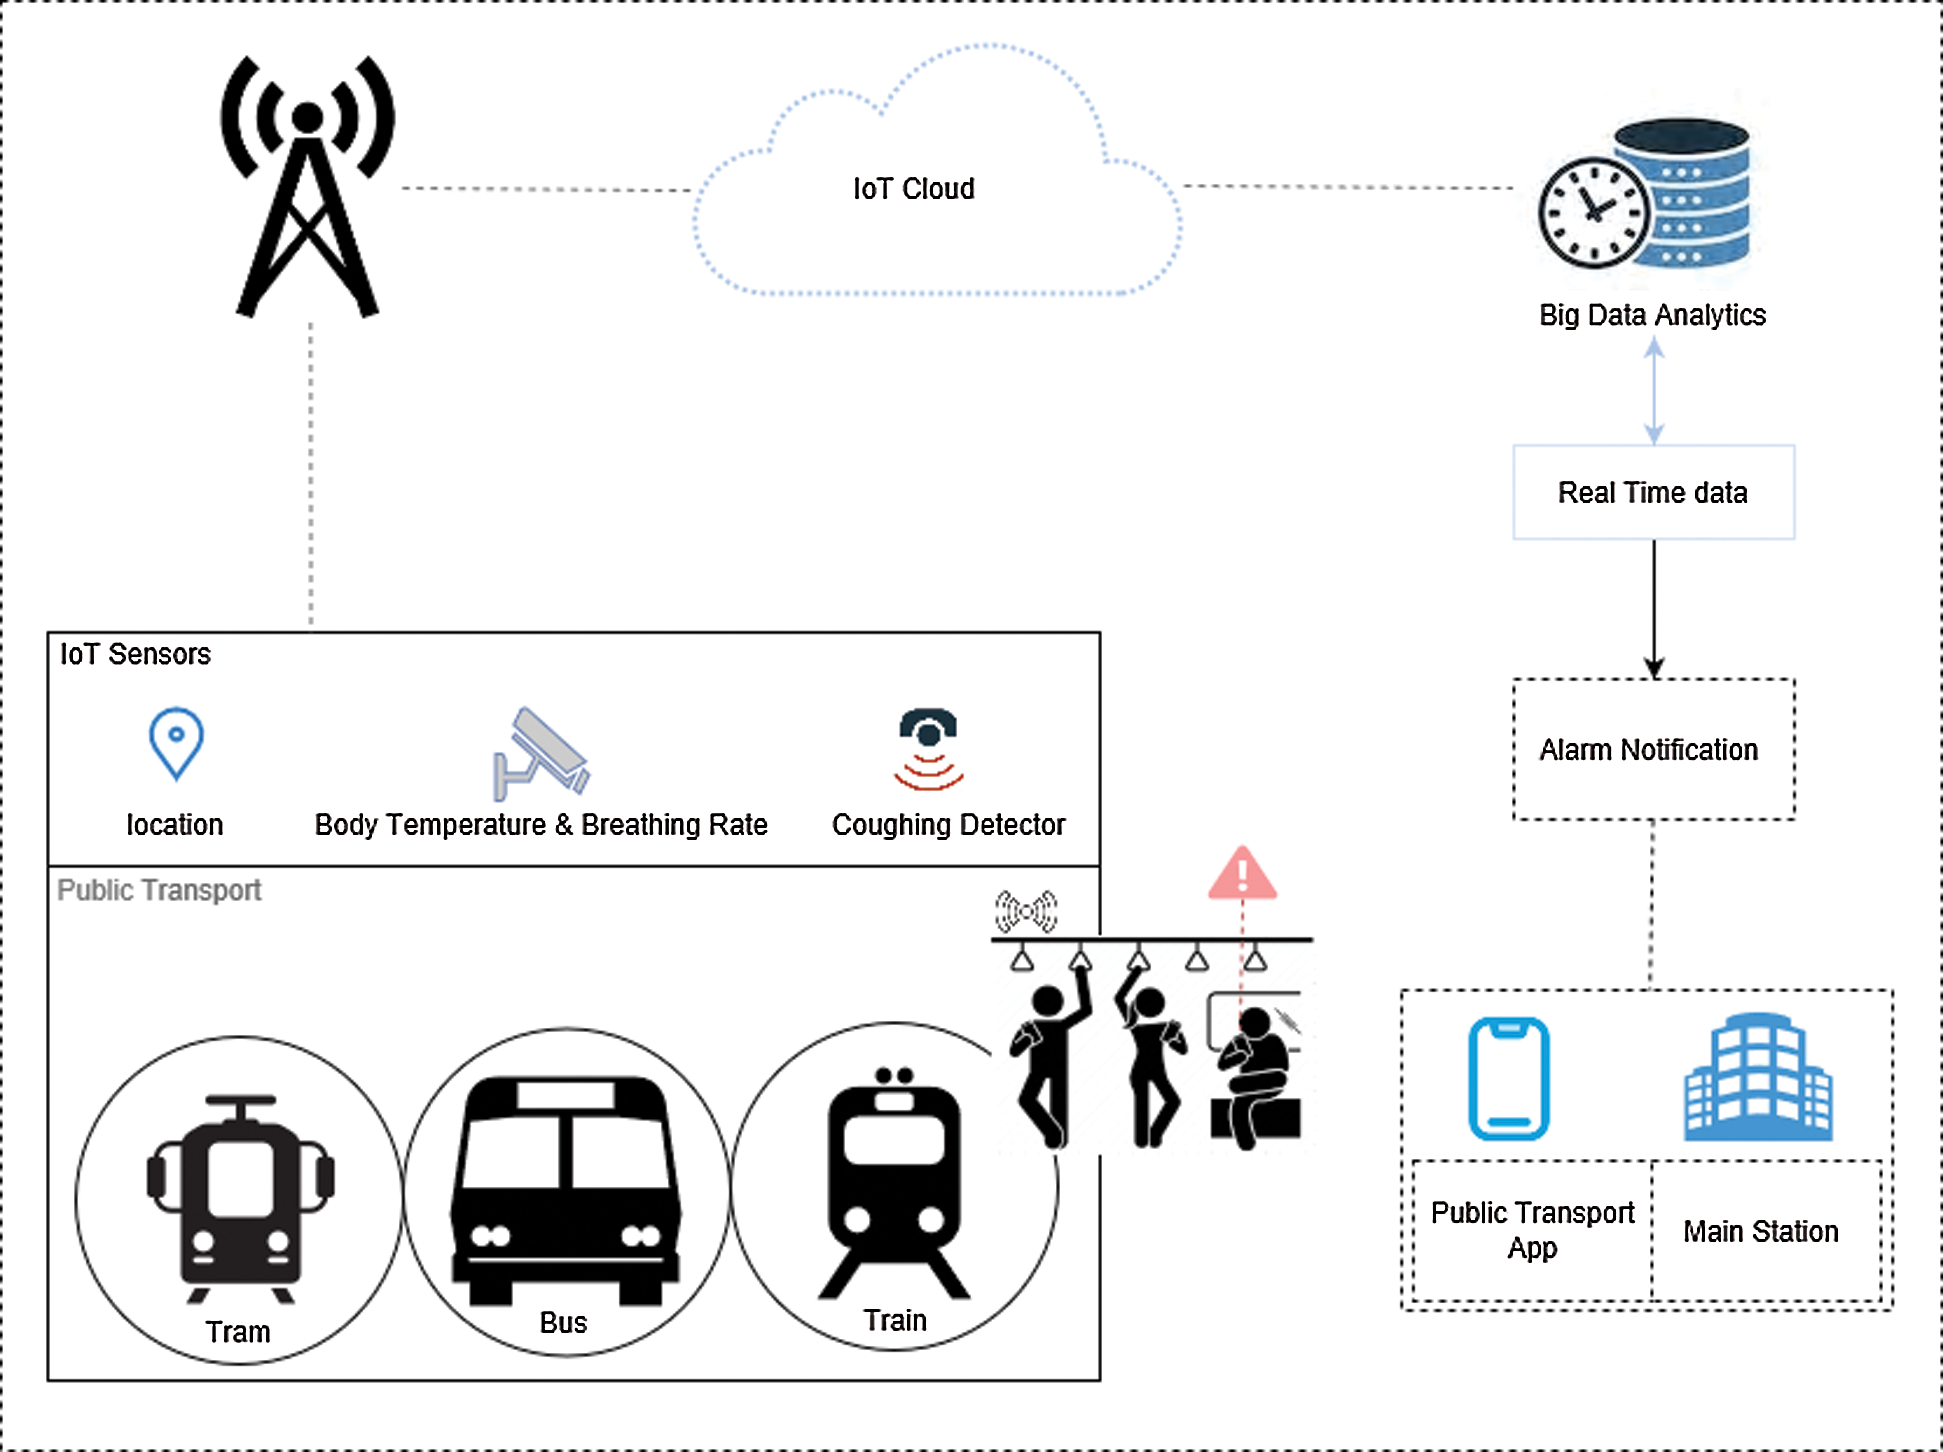
Figure 3: The architecture of live-data analytics with IoT intelligence-sensing system
The IoT layer is the backbone of the whole system since it acquires data through different wireless networks. The IoT nodes are constituted by sensors that measure different parameters such as body temperature and respiratory rates to detect the health status of passengers on public transport. Additionally, IoT sensors are based on a public transport tracker system that gathers information about passenger locations.
Definition 1. A sensor measurement Si consists a sequence of tuples Ti ⊆ (T1, …, Tn) that contain a set of attributes such as: Ti = (vi, (tsi,lsi) ) where
vi is a sensed value,
tsi is the timestamp,
lsi represent the location of sensor.
The parameter measurements are described below:
BODY TEMPERATURE PARAMETERS MEASUREMENT: As is known, human body temperature is one of the main vital signs of illness. It is most commonly measured in the medical community at regular intervals and often at home to try to quantify an individual’s degree of “sickness”. In public transportation, thermal imaging cameras are equipped with sensors that are capable of obtaining accurate measurements of human body temperature.
PHYSIOLOGICAL PARAMETERS MEASUREMENT: The other main symptoms of COVID-19 are a cough and shortness of breath. Hence, the respiratory rate and cough frequency need to be measured to analyze a passenger’s health. The remote monitoring of breathing rates using infrared thermography has emerged as a promising monitoring and diagnostic technology in a wide range of medical fields. Also, cough sounds can be captured by a collection of microphones.
LOCATION PARAMETERS COLLECTION: In this context, sensors are represented by tracker-based GSM/GPRS/GPS systems mounted in public transport vehicles that capture geo-localization and provide public transport monitoring in real time.
The fog computing layer enables the interoperability of heterogeneous sources of data and offers a com- prehensive solution ranging from data collection and pre-processing to the cloud. The fog layer includes a number of powerful servers that receive data from the IoT sensor layer, pre-processing and uploading it to the cloud as needed. Fog architecture is used to overcome several problematic issues:
• Fog computing is used to reduce traffic between IoT sensors and the cloud.
• Fog computing provides short communication paths, accelerating automated analysis and decision- making processes.
• Fog computing enhances data security as data is pre-processed by the local network in which sensitive data can remain internal or be encrypted or anonymized before being uploaded to the cloud.
Due to its sophistication and scaling capabilities, the key benefits and advantages driving the widespread adoption of cloud computing are its ability to store massive amounts of data, and handle computation- intensive data processing and analysis tasks. This layer is responsible for managing, storing, and analyzing efficiently all the data that are collected by the system. This layer includes the following functional modules:
• Cloud Sensor Data Manager,
• Big Data Analyzer,
• Graphical User Interface.
The Cloud Sensor Data Manager acts as a central repository responsible for maintaining and providing access to fog-layer information. In order to be integrated into a MongoDB distributed database, all sensor data and geo-location data obtained from public transport are sent in real time to a JSON parsing system. MongoDB is the perfect choice for data management since it uses JSON documents to store information like tables and rows in a relational database.
Definition 2. Si = {Si || 1 ≤ I ≤ S} represents a finite collection of measurements of sensors obtained and managed remotely in the Cloud Sensor Data Manager.
The Big Data Analyzer is able to process and analyze the data coming from the fog layer. To do this, the analyzer implements two modules: batch processing module, and services module, as shown in Fig. 4.
• The batch processing module extracts information from the cloud sensor data manager. The module implements the distributed MongoDB database with parallel processing tasks that take advantage of the benefits offered by Apache Spark. Combining the fastest analysis engine (Spark) with the fastest- growing database (MongoDB) enables companies to conduct accurate real-time analysis easily.
• The service module provides a temporary repository for storing the results obtained from IoT data analysis and publishing/subscribing frameworks for applications to access this information. This module facilitates the use of big data analysis results by enabling access to the data by exposing the API (Application Programming Interface).
Definition 3. (information extraction): Is a subset of data tuples L that are extracted from a set of original data tuples T using extraction analysis (filtering) operation:
Ti ∈ (T1, T2, …, Tn): Ti = (vi, lsi, tsi) →Li
Li = (e1,e2…), ∀e ⊂ (v, ls, ts).

Figure 4: The big data analyzer architecture
GRAPHICAL USER INTERFACE (GUI) is responsible for translating the analyzed information into rich content and displaying it. In the system, two GUIs are available:
• The web application (Main Station)
• The mobile app (Public Transport app)
The user turns on location permissions in the mobile app, and the mobile app collects the latitude and longitude points. The API location filter is utilized to send notifications to users within a certain radius around those points. Another micro-service investigates how public transport vehicle positions change in a given area near users waiting at bus or tram stops or train stations in order to send to their mobile apps messages warning about potential events. The development of the mobile APP is outside the scope of this paper.
In order to stimulate our scientific work, in the following, we discuss a scenario where the passengers’ health status is monitored in public transport to contain the spread of COVID-19 by limiting contact between groups of people as much as possible that could have been avoided by means of the IoT intelligence-sensing system. For instance, train number: 23 travels from station A to station B. The IoT nodes are constituted by sensors monitoring in real time the health status of passengers on public transport. If live data analytics with IoT intelligence-sensing system detects a passenger with temperature ≥ 38°C or other parameter measurement indicators are not normal, it sends alert messages, via a mobile app, to users close to the positions of public transport vehicles to notify them of possible events. For example, train number: 23, carriage number: 3 has possible emergency. Do not ride! The same method applies to other modes of public transport.
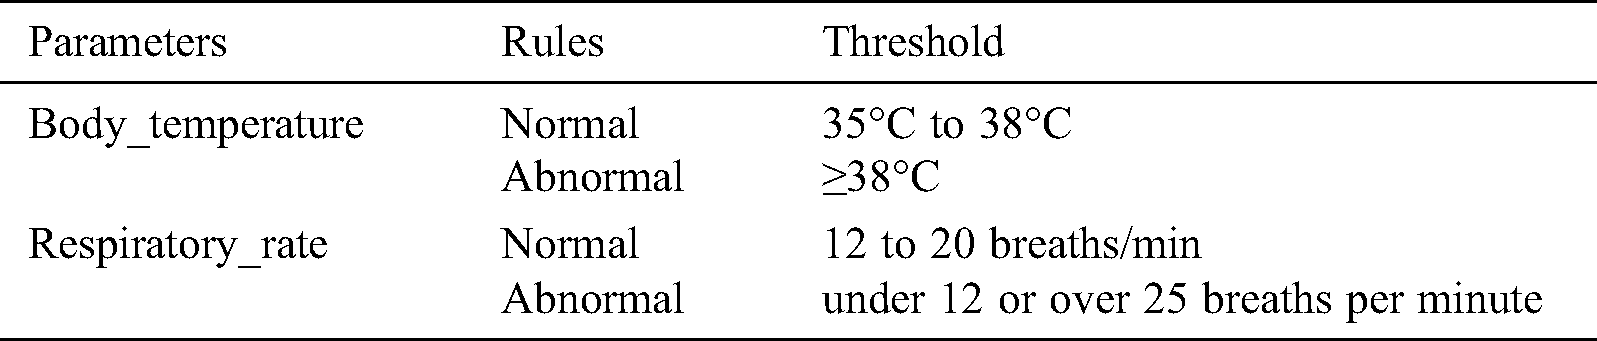
However, the effectiveness of this system depends on the response time. In fact, it is possible to limit contact between people only if the warning message reaches the users in a short period of time. The performance of the entire system depends on the ability to quickly process a large amount of IoT sensor data. Hence, an effective and reliable storage and processing system for big data is urgently needed. Live data analytics with IoT intelligence-sensing system can be summarized as the pseudo-code shown in Algorithm 1. An example of analyzing and extracting temperature signal of passengers is shown in Algorithm 2 and Fig. 5. Also, Tab. 1 displays the rules configured for handling an event.
Table 1: The rules configured in the event processing
Algorithm 1: Live analytics pseudo-code

Algorithm 2: Viewing result analysis


Figure 5: Temperature signal extraction and analysis
The live data analytics with IoT intelligence-sensing system is implemented in Python, and the MongoDB distributed database is applied to handle the data store. MongoDB is also integrated with Apache Spark to extend analytics capabilities even further to perform real-time analytics and machine learning. The mobile APP implementation is outside the scope of this paper.
In this experiment, we use a virtual dataset for public transport passengers whose body temperature is obtained. We assume that each IoT sensor sends data every 60 s, and we have 1000 public transport vehicles equipped with an IoT sensor in our system.
The aim of our experiments was to check whether our system prototype was able to send timely warning notifications to users so as to limit their contact with other people. Also, the latency of the 4G network is always taken into account when sending data from the public transport vehicle to our infrastructure and sending back the alert message from our infrastructure to users. We conducted several tests.
First, we increased the dataset of public transport vehicles and users to investigate and determine the capabilities and the shortcomings of our system. Fig. 6 shows that, when the number of public transport vehicles increases, the processing time of the live data analytics with IoT intelligence-sensing system increases, and the time roughly depends on the dataset size linearly. The request is executed multiple times in order to obtain reliable results.
Furthermore, in the experiments, the mongoDB supports the GeoJSON objects to process the location-based information. Fig. 7 demonstrates the output of the GeoJSON format conversion of row data and insertion into MongoDB so that GeoSpatial queries can be executed. In order to visually examine the corresponding scatter plot of the experiment, Figs. 8 and 9 display the scatterplot red and blue dots which show the corresponding scatterplot of users near a bus stop who need to be sent an alert message.
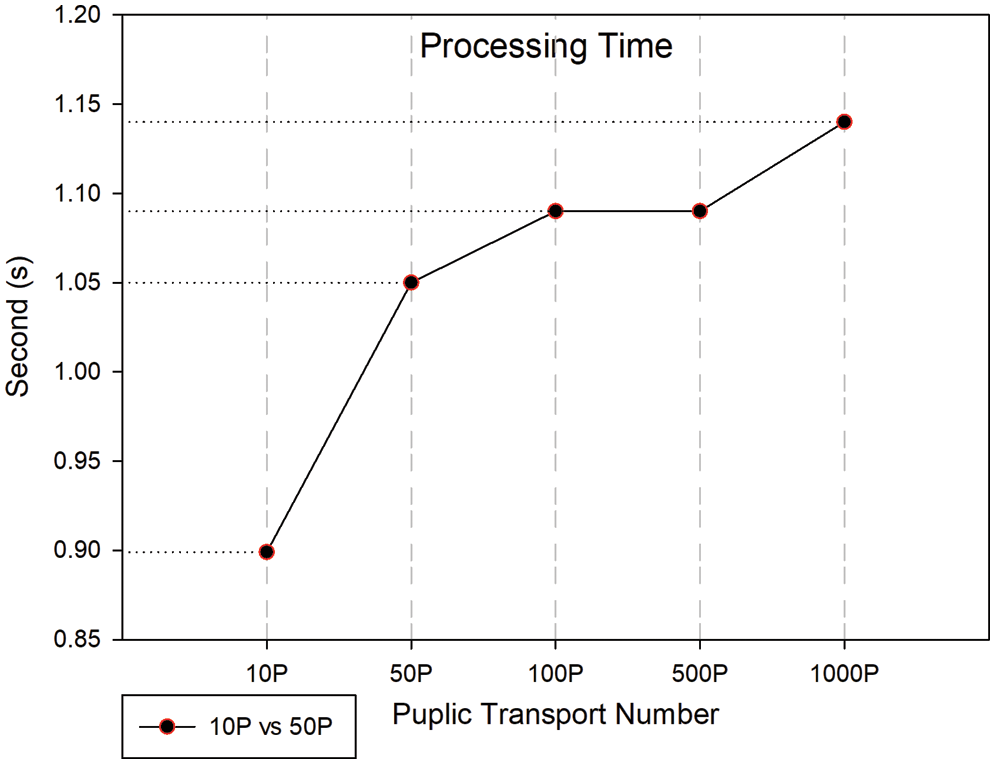
Figure 6: Processing time
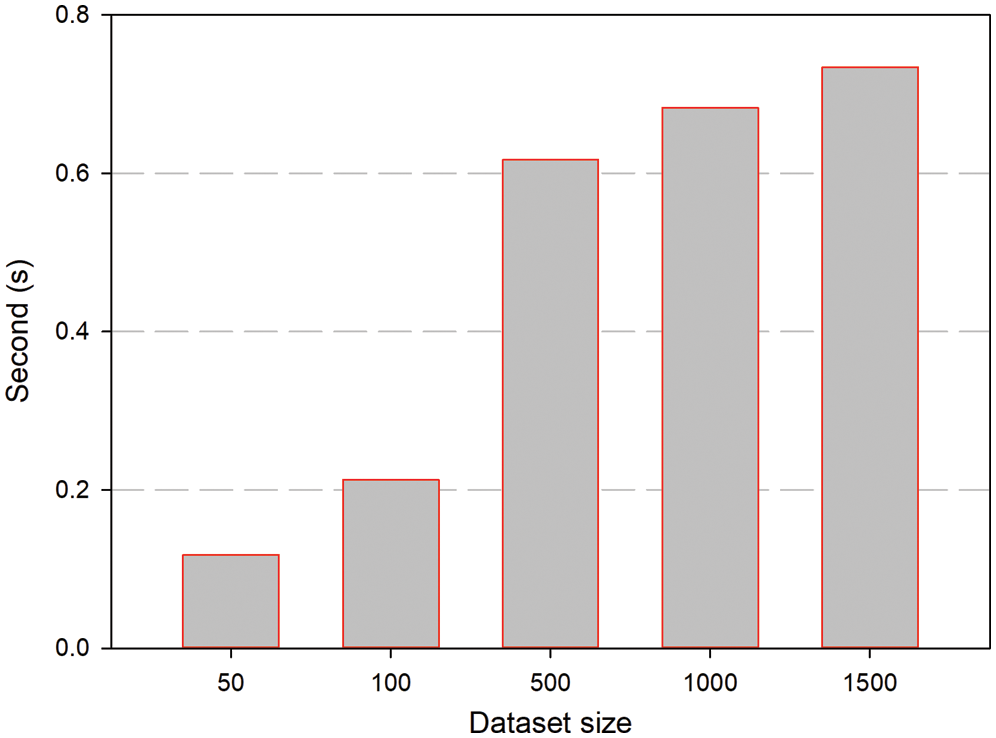
Figure 7: Performance of converting row data to GeoJSON format and insertion into MongoDB

Figure 8: Users near a bus stop who need to be sent an alert message (2 km)

Figure 9: Users near a bus stop who need to be sent an alert message (500 m)
The above analysis confirms the effectiveness of our live data analytics with IoT intelligence-sensing system. In fact, if 1000 public transport vehicles are equipped with our system’s IoT sensors, and with a standard 4G delay for sending data and alerts equal to 50 milliseconds, our system is able to send an alerts notification in 1.24 s for a distance of 2 km as shown in Fig. 10. Briefly, live data analytics with an IoT intelligence sensing system is capable of collecting, storing, analyzing, processing, and managing the vast amount of data generated by IoT sensors, and provides the users with real-time information about potential public transport events, thereby enabling the users to make well-informed and timely decisions.

Figure 10: Total time (1000 P)
Live data analytics with IoT intelligence sensing-based risk alerting system is proposed to face the challenges of COVID-19 in transport sector. The infrastructure of the proposed model backed by a system capable of collecting, storing, analyzing, processing, and managing the vast amount of data generated by IoT sensors. There are several challenges that need to be addressed in future work. We plan on evaluating the impact of security in the proposed system. Also, we will investigate challenges associated with IoT such as privacy protection, granular access control, cryptography authorized information-driven security, secure data repository, data provenance, and granular scrutiny. In addition, further experiments will be conducted in order to evaluate the system’s behavior and performance.
Acknowledgement: Thanks to our families & colleagues who supported us morally.
Funding Statement: The authors received no specific funding for this study.
Conflicts of Interest: The authors declare that they have no conflicts of interest to report regarding the present study.
1 https://www.fda.gov/medical-devices/coronavirus-covid-19-and-medical-devices/non-contact-temperatureassessment-devicesduring-covid-19-pandemic
1. C. R. Center, “COVID-19 dashboard by the center for systems science and engineering (CSSE),” Johns Hopkins University (JHU2020. [Online]. Available: https://coronavirus.jhu.edu/map.html. [Google Scholar]
2. A. Tirachini and O. Cats. (2020). “COVID-19 and public transportation: Current assessment, prospects, and research needs,” Journal of Public Transportation, vol. 22, no. 1, pp. 1–21. [Google Scholar]
3. B. Lahiri, S. Bagavathiappan, T. Jayakumar and J. Philip. (2012). “Medical applications of infrared thermography: A review,” Infrared Physics & Technology, vol. 55, no. 4, pp. 221–235. [Google Scholar]
4. S. Bagavathiappan, B. Lahiri, T. Saravanan, J. Philip and T. Jayakumar. (2013). “Infrared thermography for condition monitoring–A review,” Infrared Physics & Technology, vol. 60, pp. 35–55. [Google Scholar]
5. X. Sun, Z. Lu, W. Hu and G. Cao. (2015). “Symdetector: Detecting sound-related respiratory symptoms using smartphones,” in Proc. of the 2015 ACM Int. Joint Conf. on Pervasive and Ubiquitous Computing, Osaka, Japan, pp. 97–108. [Google Scholar]
6. Y. Nam, B. A. Reyes and K. H. Chon. (2016). “Estimation of respiratory rates using the built-in microphone of a smartphone or headset,” IEEE Journal of Biomedical and Health Informatics, vol. 20, no. 6, pp. 1493–1501. [Google Scholar]
7. S. Milici, A. Lázaro, R. Villarino, D. Girbau and M. Magnarosa. (2018). “Wireless wearable magnetometer-based sensor for sleep quality monitoring,” IEEE Sensors Journal, vol. 18, no. 5, pp. 2145–2152. [Google Scholar]
8. D. Teichmann, J. Foussier and S. Leonhardt. (2010). “Respiration monitoring based on magnetic induction using a single coil,” in 2010 Biomedical Circuits and Systems Conf. (BioCASPaphos, Cyprus, pp. 37–40. [Google Scholar]
9. T. Wartzek, S. Weyer and S. Leonhardt. (2011). “A differential capacitive electrical field sensor array for contactless measurement of respiratory rate,” Physiological Measurement, vol. 32, no. 10, pp. 1575–1590. [Google Scholar]
10. S. D. Min, Y. Yun and H. Shin. (2014). “Simplified structural textile respiration sensor based on capacitive pressure sensing method,” IEEE Sensors Journal, vol. 14, no. 9, pp. 3245–3251. [Google Scholar]
11. L. Scalise, P. Marchionni and I. Ercoli. (2010). “Optical method for measurement of respiration rate,” in 2010 IEEE Int. Workshop on Medical Measurements and Applications, Ottawa, Canada, pp. 19–22. [Google Scholar]
12. P. Marchionni, L. Scalise, I. Ercoli and E. Tomasini. (2013). “An optical measurement method for the simultaneous assessment of respiration and heart rates in preterm infants,” Review of Scientific Instruments, vol. 84, no. 12, 121705. [Google Scholar]
13. N. Birsan and D. P. Munteanu. (2012). “Non-contact cardiopulmonary monitoring algorithm for a 24 GHz doppler radar,” in 2012 Annual Int. Conf. of the IEEE Engineering in Medicine and Biology Society, San Diego, CA, USA, pp. 3227–3230. [Google Scholar]
14. O. B. Lubecke, P. W. Ong and V. Lubecke. (2002). “10 GHz Doppler radar sensing of respiration and heart movement,” in Proc. of the IEEE 28th Annual Northeast Bioengineering Conf. (IEEE Cat. No. 02CH37342Philadelphia, PA, USA, pp. 55–56. [Google Scholar]
15. A. Sinharay, R. Rakshit, A. Khasnobish, T. Chakravarty, D. Ghosh et al. (2017). , “The ultrasonic directional tidal breathing pattern sensor: Equitable design realization based on phase information,” Sensors, vol. 17, no. 8, pp. 1853. [Google Scholar]
16. S. D. Min, D. J. Yoon, S. W. Yoon, Y. H. Yun and M. Lee. (2007). “A study on a non-contacting respiration signal monitoring system using Doppler ultrasound,” Medical & Biological Engineering & Computing, vol. 45, no. 11, pp. 1113–1119. [Google Scholar]
17. S. D. Min, J. K. Kim, H. S. Shin, Y. H. Yun, C. K. Lee et al. (2010). , “Noncontact respiration rate measurement system using an ultrasonic proximity sensor,” IEEE Sensors Journal, vol. 10, no. 11, pp. 1732–1739. [Google Scholar]
18. M. H. Hu, G. T. Zhai, D. Li, Y. Z. Fan, X. H. Chen et al. (2017). , “Synergetic use of thermal and visible imaging techniques for contactless and unobtrusive breathing measurement,” Journal of Biomedical Optics, vol. 22, no. 3, pp. 1–11. [Google Scholar]
19. C. Massaroni, D. S. Lopes, D. Lo Presti, E. Schena and S. Silvestri. (2018). “Contactless monitoring of breathing patterns and respiratory rate at the pit of the neck: A single camera approach,” Journal of Sensors, vol. 2018, no. 11, pp. 1–13. [Google Scholar]
20. A. Al-Naji, K. Gibson, S. H. Lee and J. Chahl. (2017). “Monitoring of cardiorespiratory signal: Principles of remote measurements and review of methods,” IEEE Access, vol. 5, pp. 15776–15790. [Google Scholar]
21. T. Hall, D. Y. Lie, T. Q. Nguyen, J. C. Mayeda, P. E. Lie et al. (2017). , “Non-contact sensor for long-term continuous vital signs monitoring: A review on intelligent phased-array doppler sensor design,” Sensors, vol. 17, no. 11, pp. 2632. [Google Scholar]
22. A. Tewari and B. Gupta. (2020). “Security, privacy and trust of different layers in Internet-of-Things (IoTs) framework,” Future Generation Computer Systems, vol. 108, pp. 909–920. [Google Scholar]
23. A. Al-Qerem, M. Alauthman, A. Almomani and B. Gupta. (2020). “IoT transaction processing through cooperative concurrency control on fog-cloud computing environment,” Soft Computing, vol. 24, no. 8, pp. 5695–5711. [Google Scholar]
24. C. M. Bulla and M. N. Birje. (2021). “A multi-agent-based data collection and aggregation model for fog-enabled cloud monitoring,” International Journal of Cloud Applications and Computing (IJCAC), vol. 11, no. 1, pp. 73–92. [Google Scholar]
25. A. P. Plageras, K. E. Psannis, C. Stergiou, H. Wang and B. B. Gupta. (2018). “Efficient IoT-based sensor BIG Data collection–processing and analysis in smart buildings,” Future Generation Computer Systems, vol. 82, pp. 349–357. [Google Scholar]
 | This work is licensed under a Creative Commons Attribution 4.0 International License, which permits unrestricted use, distribution, and reproduction in any medium, provided the original work is properly cited. |