DOI:10.32604/iasc.2021.014905
| Intelligent Automation & Soft Computing DOI:10.32604/iasc.2021.014905 | |
| Article |
A Study on Using a Wireless Sensor Network to Design a Plant Monitoring System
1Department of Information Technology, Takming University of Science and Technology, Taipei, 11451, Taiwan
2Department of Electrical Engineering, National Chin-Yi University of Technology, Taichung, 41170, Taiwan
*Corresponding Author: Wen-Tsai Sung. Email: songchen@ncut.edu.tw
Received: 26 October 2020; Accepted: 01 December 2020
Abstract: Traditional agriculture has to face different climatic factors, resulting in unstable crop yields, whereas a plant factory is indoors, thus avoiding different natural disasters and insect pests. It is also available for bulk production in all-weather all year-round, guaranteeing crop quality. This study uses a wireless sensor network (WSN) architecture for multi-monitoring of a plant environment, aiming to improve its growing environment quality. In terms of monitoring environment, the sensor modules at the end device nodes are combined with Arduino for capturing the sensor values, which are transmitted by wireless signal transmission. The data of wireless signals are further transmitted by multiple end devices XBee to the coordinator XBee. The coordinator is in charge of collecting data, which are transferred via a Com port to the monitoring-end computer; the system interface classifies the sensing data and displays the sensor values on the screen; at the same time, the sense data are transferred to the Access database and stored. The sensor values are uploaded to a Cloud hard disk database MySQL, and real-time environment data can be seen on webpage. In terms of control, whenever an abnormal warning occurs as the environment sensing value exceeds the preset plant growing condition, the system interface displays a warning and transfers a wireless control signal via WSN to the control module of the terminal node. The electric apparatus is actuated when the control instruction is received to improve the environmental quality, until the abnormal warning stops, and the operation stops. There is an additional time setting function, whereby the user can set the sprinkling and lighting-up time in the system interface, so that at the present time, the program sends an instruction to the controller to activate the designated action. According to multiple experimental analyses, the combination of Arduino and XBee is applicable to different scenarios, such as an environmental monitoring system and an interaction with scenario, even robot making. Different wireless sensor applications can be constructed, so that the users can make further WSN technology development and innovations based on the results of this study.
Keywords: LED; infrared; internet of things; sensor; ZigBee; XBee
1 System Architecture and Hardware Architecture
This study uses WSN architecture and multiple sensors in a monitoring environment, and each sensor is combined with Arduino to capture a sensor value signal. In terms of signal transmission, several ZigBee nodes compose a WSN, using star topology structure. At the very start of sensor value transmission, the data must be transferred by several end devices XBee via wireless transmission to the coordinator XBee of the monitoring end. The signal received by the coordinator is transferred to the system interface of the monitoring end. All measured data are classified and displayed on the interface for the user, while the data are automatically stored in the Access database. The threshold is set according to the plant growing conditions, and whenever the sensor value exceeds the threshold, the XBee connected to the monitoring end transfers an instruction; i.e., a control signal to the Arduino control switch and to the end device XBee that must be actuated via the coordinator XBee, so that the control equipment is actuated according to the requirement of the control environment system, thus implementing automatic sensing environment monitoring. In addition, there are manual control and time setting switchgears, and the plant factory sensor values are adjusted and set according to the vegetable and fruit planted and the suitable environment for the vegetable and fruit; e.g., an appropriate range of temperature and humidity, nutrient and illuminance, as well as the requirements of different plants [1–3].
This system consists of five parts, as shown in Fig. 1. The sensing part consists of temperature and humidity sensor, soil moisture sensor, photoresistor, air quality sensor, and illuminance sensor, which are in charge of monitoring the whole plant growing environment. In terms of transmission equipment, XBee is in charge of all transmission signals and control commands. In terms of monitoring equipment, the system interface is in charge of receiving all data from the sensor nodes, which are classified and displayed on the screen, and in charge of sending control signal to the control terminal node to control action. In addition, the received data are stored in the Access database and MySQL database. The whole environmental monitoring architecture is described above, and each part has its own duty. With the overall monitoring wireless network built, the integration aims to monitor plant growth conditions and to provide the best comfortable environment for the plants, and the ultimate objective is to accelerate plant growth [4,5].

Figure 1: Monitoring system research structure
The WSN XBee network topology is the star topology in this study, using multiple sensors to capture environmental data. Fig. 2 shows the temperature, humidity, PIR, and volume sense signal values measured by sensors, combined with the Arduino platform to capture and convert signals. The data are transmitted by the end device XBee node to the coordinator XBee, whereby the coordinator is connected to a computer, and the data are viewed through an interface program. In the future, users can receive instant information via a smartphone or tablet PC instead of a computer. The computer terminal uploads the collected data to the Cloud hard disk to store data, making it convenient for users to check in the future and other users can log into the Cloud hard disk to check the real-time data; the messages will be known without being on the scene, and the present situation can be known instantly [6–8].
Fig. 3 shows the plant environment monitoring system architecture in a sensing scenario. There is an additional function of the control system. Whenever the sensor value reaches the preset condition threshold, e.g., soil moisture deficiency, hyperpyrexia, or solar illumination deficiency, the monitoring end transmits signals to the sprinkler and plant light to actuate sprinkling and lighting, implementing monitoring environment and control so that the system can be further perfected. The data and messages can be received by a smartphone or tablet PC instantly in the future, and the data are uploaded to the Cloud hard disk as a database, facilitating subsequent reference. The Arduino unscrambles the signal to control the pin control relay switch, so that the electric appliance can work according to the environmental requirement; the control signal will not be sent until the value is lower than the threshold, and then the electric appliance is switched off [9,10].

Figure 2: WSN architecture

Figure 3: Plant care environment monitoring system
Fig. 4 shows the integrated sensing system flowchart. The signals are sent from the sensors, and the coordinator receives all signals. The signals are imported through the Com port and classified by the system interface; the values are displayed on the screen, and the values are stored in the Access database and online Cloud hard disk MySQL database. Afterwards, the system decides whether to execute the operation according to the plant factory’s setting for the plant environment. If the set value is exceeded, then the coordinator sends a signal to the control terminal to control the corresponding equipment. If it is not exceeded, then it returns to the original process and judges the next data. The overall automatic control process implements a complete monitoring of plant growth; the control method can be changed for different plants, so that this monitoring system is applicable to any plants, accelerating growth [11–14].
Fig. 5 introduces the hardware architecture. The sensor module is shown in Fig. 6, comprising illuminance sensor, photoresistor, air quality sensor, temperature and humidity sensor, and soil moisture sensor, which all monitor the whole plant growing environment. The illuminance sensor is in charge of detecting light intensity; the light can be adjusted to brighter or dimmer according to plant requirement. The photoresistor controls the light on/off according to brightness and darkness. The air quality sensor is sensitive to harmful gas and detects if there is harmful gas in the air.

Figure 4: Integrated sensing monitoring system flowchart
When the harmful gas content in the air is too high, the fan is switched on automatically for automatic ventilation control. The harmful gas is thus discharged. Two experiments were conducted for lettuce seeds according to Osamu Tanaka. Two containers of lettuce seeds were used for Experiment 1. One container was filled with ground camphor tree leaves and sealed up. This container was full of the aroma of camphor tree leaves. The other container was filled with unground camphor tree leaves and sealed up. On the next day, the seed in the container without camphor tree aroma germinated, whereas the seed in the container with aroma did not germinate; even after several days passed, it did not germinate. An intense odor inhibited the germination. Smoke from a cigarette was used for Experiment 2. The results showed that the seed in the container with smoke from the cigarette germinated obviously later than the seed in the container without smoke from the cigarette. If the smoke from the cigarette was injected into the container continuously, then the seed would not germinate for days. The two experiments prove that the seeds can perceive smell and smoke from cigarette, which inhibit germination [15]. The temperature sensor detects the ambient temperature; when the temperature is too high, the sprayer and fan are actuated for cooling. When the humidity is too low, the sprayer is actuated to increase air humidity. The soil moisture sensor is inserted in the soil to detect the moisture content in soil. When the moisture content is low, the sprayer is controlled automatically to increase the moisture content, so as to prevent the plant from withering. Fig. 7 shows the light module, using white plant light and RGB light, which promote plant growth [16,17].
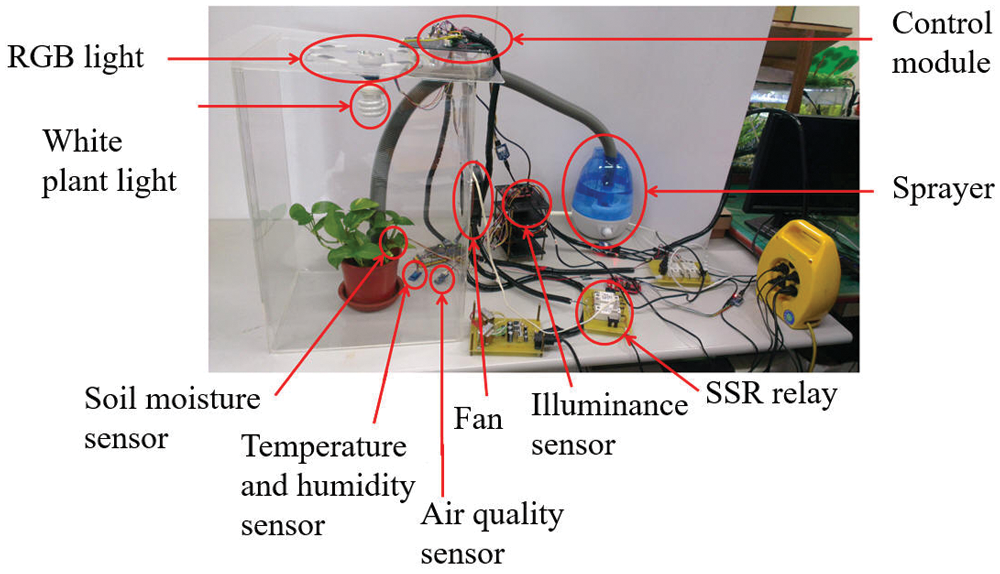
Figure 5: Hardware architecture

Figure 6: Sensing module

Figure 7: Light module
Harun et al. proposed low-power agricultural applications of wireless sensor networks [18,19]. Nick Harris et al. proposed a distributed wireless sensor network plant monitoring application [20–22]. Qilong Han proposed a method of environmental quality monitoring [23]. Ezhilazhahi, Xianglian Meng, and Sridhar et al. proposed an environmental monitoring system using the Internet of Things and wireless sensing networks [24–26]. Haque and Sreelakshmi et al. proposed a plant monitoring system based on the Internet of Things [27,28].
2 Introduction to the System Sensing Module
DHT11 is a calibrated digital signal output compound temperature and humidity sensor. It has extremely high reliability and superior stability in digital module acquisition technologies and temperature and humidity sensing technology. The sensor contains an NTC temperature measuring element and resistive humidity measuring element, connected to an 8-bit monolithic chip. DHT11 has quick response, strong anti-interference, and very high performance-price ratio. Each DHT11 is calibrated in a very accurate humidity calibration room. The calibration coefficient is stored in OTP memory, and the sensor will call a calibration coefficient for detection signal processing. The single line serial output is used, so that the system integration is simple and rapid. For small volume, very low power consumption and extraordinary long-term stability, it can be the best choice for various applications even under harsh cases [29]. The plants in the gardens are groomed by people, and the soil moisture sensor is easy to use. The sensor is inserted in soil to read the data. With the assistance of a soil moisture sensor, the plant can remind you to water it. The air quality sensor TP-401A implements comprehensive monitoring of the air quality in a confined space. The TP-401A indoor air quality sensor is characterized by low power consumption, long life, low cost, compactness, and high sensitivity to low concentration harmful gas. It can monitor a wide range of harmful gases, such as CO, alcohol, diluent, toning lotion volatilized molecules, banana oil, cleaning solvent, insecticide, correction fluid, formaldehyde, acetone, etc. The sensor is unable to know the concentration of the target gas and specific data, but it is still applicable to simply numerical results. It can be used in air conditioning automatic ventilation control, indoor exhaust fan ventilation, ventilation control, automatic aroma machine, and air cleaner. The illuminance sensor BH1750FVI is a digital illumination intensity sensor integrated circuit for a two-line serial bus port. This integrated circuit can adjust the brightness of an LCD screen or keyboard background light according to the collected light intensity data. BH1750FVI has a spectral sensitivity characteristic approximating visual sensitivity, as it can detect a wide range of light intensity variation (1lx-65535lx) with its high resolution and low power consumption, but it is slightly affected by infrared, as the least error is ±20% [30].
This experiment uses the coordinator XBee connected to the monitoring end to receive the end device XBee data. The sensor is combined with Arduino to obtain real-time environment data, temperature, humidity, soil moisture, air quality and illuminance, which are displayed on the interface program [31].
Fig. 8 shows the system interface real-time data menu. The left side of the menu shows the environmental sensing data. The sensor values are displayed instantly, and the temperature, humidity, soil moisture, air quality, photoresistor value, and illuminance sensor are displayed from top to bottom. There are two status lights indicating real-time soil moisture and current status of light brightness. The first status light from top to bottom represents the soil moisture, the red light is displayed whenever the soil moisture is insufficient, and the moisture deficiency is described in words. If the moisture is sufficient, then the green light is displayed, and the moisture sufficiency is described in words [32,33].
The other light represents the light brightness. If the light intensity is sufficient, then the green light is displayed to represent sufficient light brightness, and thus supplemental lighting is not needed. If the light intensity is insufficient, then the brightness insufficiency is displayed, and supplemental lighting is needed. The time is set in the upper right corner of the menu, which is applicable to setting the time for actuation. If the sprinkler starting time is set as 3 p.m. today, then the sprinkling function will be actuated immediately at 3 p.m., or the lighting actuation time can be set as 3 p.m., and the setting can be changed for actuating any devices. There are three switching modes available, which are auto mode, manual mode and continuous on mode, clicked as the user requires. The fan is turned on manually on the right of the menu. The LED lamp has red light, blue light, and green light available. The lower part of the menu displays the real-time environment chart, displaying current temperature and humidity; X-axis represents current time, and Y-axis represents temperature and humidity. The system interface real-time data menu enables the user to use the automatic monitoring system to check various environmental sensing data, so as to know the current environmental condition, to switch over to automatic, manual or continuous on mode, and to freely set the time for activation and program duration starting time [34,35]. Fig. 8 shows that the program has a menu capture function. As long as the Capture Menu button is pressed, the program captures the current menu immediately, which is converted into an image file and stored in the specified folder. The Cloud hard disk is logged in via a mobile phone to check the latest environmental value menu in the MySQL database [36,37].

Figure 8: System interface real-time data menu
4 Plant Growth Rate Experiment
Fig. 9 shows the photos taken before automatic monitoring on August 23, 2018. Our team uses 3 comparison methods:
a) Potted plants are placed in acrylic plant boxes (indoors) (experimental group)
b) Potted plants without additional equipment (indoors) (control group)
c) Potted plants without additional equipment (on the outdoor balcony)
Compare these three conditions and measure them all day. The system compares the temperature and humidity data for obvious changes, and the environmental values are sampled every half an hour. The experimental results found that the outdoor temperature and humidity changed with the change of the intensity of sunlight. The temperature was the highest at noon. There was no sunlight indoors, and there was no significant change in environmental data under the monitoring of automated equipment. In contrast, the control group, the temperature, and the experiment the group comparison appears slightly higher. The data results show that if potted plants are outdoors, the temperature is too high to be harmful to the plants. Frequent watering is required to avoid soil dryness and plant wilting. There is little change under the indoor automation control, and indoor soil moisture is not easy to evaporate.

Figure 9: Potted plant A as the experimental group (automatic monitoring) and potted plant B as the control group (natural growth)
Figs. 10 and 11 show the indoor and outdoor experiments. In the all-day sunlight and indoor polymethacrylate box experiment and indoor control group, in the case without sunlight, the daylong environmental data temperature and humidity chart are compared to check if there is a significant difference. The experimental results show that the temperature and humidity vary with the sunlight intensity outdoors, and the maximum temperature occurs at noon. The interior is free of sunlight, and with automated equipment monitoring there is no apparent change in environmental data. The control group has a little higher temperature than the experimental group.

Figure 10: Outdoor and indoor all-day temperature data

Figure 11: Outdoor and indoor all-day humidity data
The experimental group irradiated by sunlight on an outdoor balcony for one day is shown in Fig. 12, whereby the soil moisture variation is observed and sampled every half-hour. We take data of the conditions with a sprinkling function and without a sprinkler. The weather is fine on the measurement day, and the plant is placed in the sunlight. It is observed that the values for the case with an automatic sprinkler remain above 600, and the soil remains moist. In the case without a watering device, as the soil moisture evaporates, the plant dries up gradually with time. The control group is not irradiated by sunlight, but the plant absorbs water, and due to evapotranspiration, the moisture is lost gradually with time.
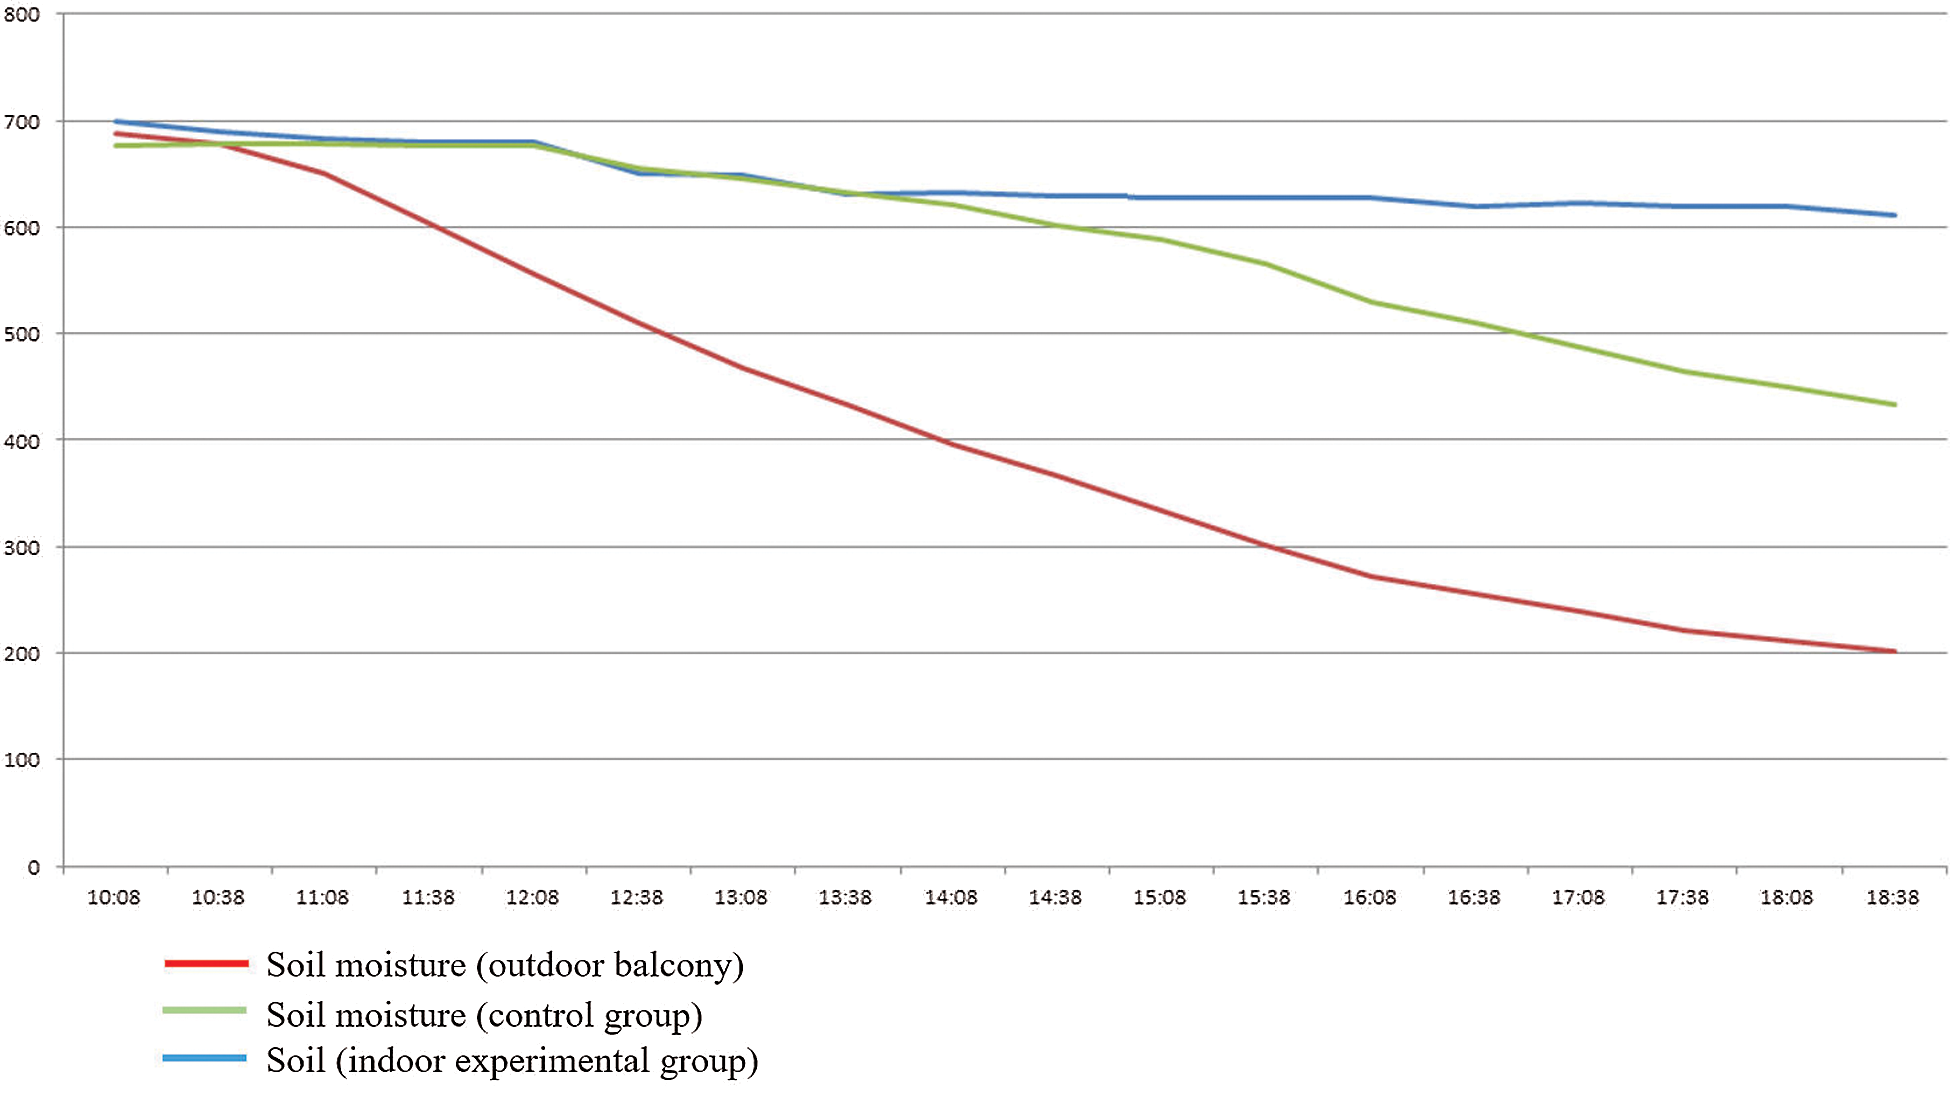
Figure 12: Difference between experimental potted plant soil moisture with and without automatic sprinkling
Fig. 13 shows the sensors on the plant, including soil moisture, air quality, photoresistor, and air temperature and humidity. The environment sensors’ received values are combined with the Arduino to export environmental data, transmitted by end device XBee to the coordinator XBee. The sensed environmental data are sent to the monitoring end, and the system interface displays the environmental data. The soil moisture sensor is inserted in the soil to detect soil moisture and monitor the soil water content in order to decide whether or not to activate the sprinkler. The air quality sensor specializes in monitoring the indoor air quality comprehensively and for detecting if there is any harmful gas or not. If harmful gas is detected, the sensor responds numerically, and the fan is actuated to improve the air quality. The photoresistor sensor induces ambient light. When the light is insufficient, the plant light is turned on to illuminate the plant. When the illumination is sufficient for the plant, the plant light is turned off to avoid strong light harming the plant. The temperature and humidity sensor detect the ambient temperature and humidity. When the temperature is too high, the sprinkler is actuated to spray water, and the fan is switched on to reduce current temperature. If the humidity is too low, the sprinkler is activated to increase air humidity, so as to keep the plant moist and to reduce moisture evapotranspiration.

Figure 13: Sensors for the experimental group
Fig. 14 shows the photo taken on September 16, 2018. The automatic control experiment lasted 20 days. It is observed that potted plant A has apparently grown compared with B, and the growth rate of potted plant B is obviously lower. It is proved that the plant can receive good care under automatic monitoring, and the growth rate is much higher than the control group.

Figure 14: Experimental group and control group after the experiment
Our research uses the method of direct observation, direct observation from historical growth photos. Based on the photos of growth, the research team checked the appearance of potted plants A and potted plants B. Through direct observation and records, the growth of potted plants A is much better than potted plants B. Please refer to Tab. 1.
Table 1: Measurement records of pot A and pot B

5 Experiment on Red Beans in Different Lights
There are three necessary conditions for germination. First, there must be moisture or else dry seeds will not germinate. Second, the appropriate temperature varies with the plants. The indoor temperature is usually about 25°C dues to air conditioning, meeting the germination condition of general plants. The last condition is the air. The seeds breathe like animals do. The seeds breathe slightly in a dry condition, but once there is moisture, more air is needed for germination. Certainly, a general indoor space must have air. However, sunlight is not a necessity, because some plants can germinate without sunlight. The red bean is the best example, as it can germinate without sunlight, and so illumination is not a necessary condition, but light can affect its growth rate. Fig. 15 shows the red beans are tested in different lights. The red bean seeds are irradiated by green light, red light, blue light, and white light, respectively. Under the general indoor condition at the same temperature, humidity, and moisture, the growth rate of 12 red beans of each group in different lights is observed. As shown in Fig. 16, 60 red beans of 5 groups are tested in different lights. Four groups are tested in different lights, and Group 5 is tested for germination without light. It is observed on Day 2 that the seeds absorb water and expand. The red beans germinate successively from Day 3, but not so obvious. The red bean hull cracks, 9 beans in blue light germinate, 11 beans in green light germinate, 9 beans in white light germinate, 7 beans in red light germinate, and 5 beans in the shadow germinate. All of the red beans in blue light germinate on Day 4 and grow faster than the other groups. The germination numbers in green light and white light are identical with the last day, while the number in red light is larger than the last day by 2; 9 beans have germinated, while that of the group without light increased by 4, and 9 germinated. On Day 5, all of the beans in green light and white light germinate like those in blue light; the red beans in blue light are still leading, followed by green light, and then white light and red light, while the last one is the group without light. On Day 6 the roots of red beans in blue light grow longer and longer, followed by the green light, white, light and red light, which are juxtaposed to the group without light. On Day 7 the stems and leaves of a part of red beans in blue light have grown out much earlier than the other groups. On Day 8 the leaves of most red beans in blue light have come out, 5 seeds in green light have leaves, 1 seed in red light has leaves, and the white light group and group without light have no leaves. On Day 9 the seeds of the blue light group have sprouted many stems and leaves, and the growth of the green light group is approximate to the blue light group. Four seeds in red light and white light have sprouted stems and leaves, approximately juxtaposed, the group without light is the slowest. As shown in Fig. 17, the last record is made on Day 10, when the growth of red beans of the blue light group is much earlier than that in the other lights, and the growth is vigorous; they are followed by green light, and then the red light and white light are equivalent to each other; the group without light has the slowest growth, and the stem and leaf are not observed until Day 10.
As shown in Tab. 2, this experiment records the germination number and the numbers of stems and leaves sprouted of the red bean groups in different lights from Day 1 to Day 10. According to the seed to germination growing process, the blue light has the most significant effect on the growth rate of red bean seeds, and then the green light; the red light and white light are juxtaposed; and the last one is the group without lighting, as it has a stem and leaf on the last day. This proves that the light influences the growth rate of plants and validates that a part of plants can germinate with three major elements, which are temperature, moisture, and air. In addition, the blue light grows the root, improves the photosynthesis of leaves, and thickens the stems. Cheng (2005) mentioned that the author learned from a visit to the U.S. Space Center that sunlight could be replaced by lighting to grow plants as food supply in outer space in the future. The author tested different lights and found that the mung bean sprout had the best phototropism for blue light, and the plant would not grow excessively. In addition, in agravic space, using blue light to irradiate the stem of a plant could give the plant good photosynthesis for normal growth, and the plant could be induced to grow in a designed direction using the blue phototropism of plants, so as to take full advantage of the useful room of a space capsule. The two references proved the influence of light on plants, in which appropriate light is very helpful to plant growth.

Figure 15: Using four different lights to test growth rate of red beans
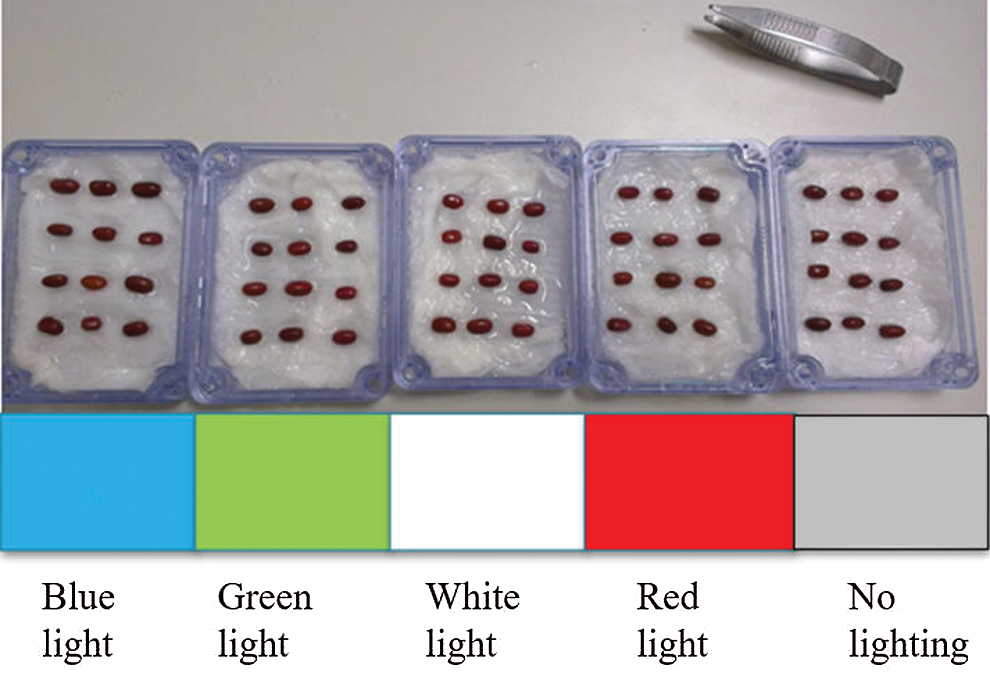
Figure 16: There are 60 red beans of 5 groups for the experiment
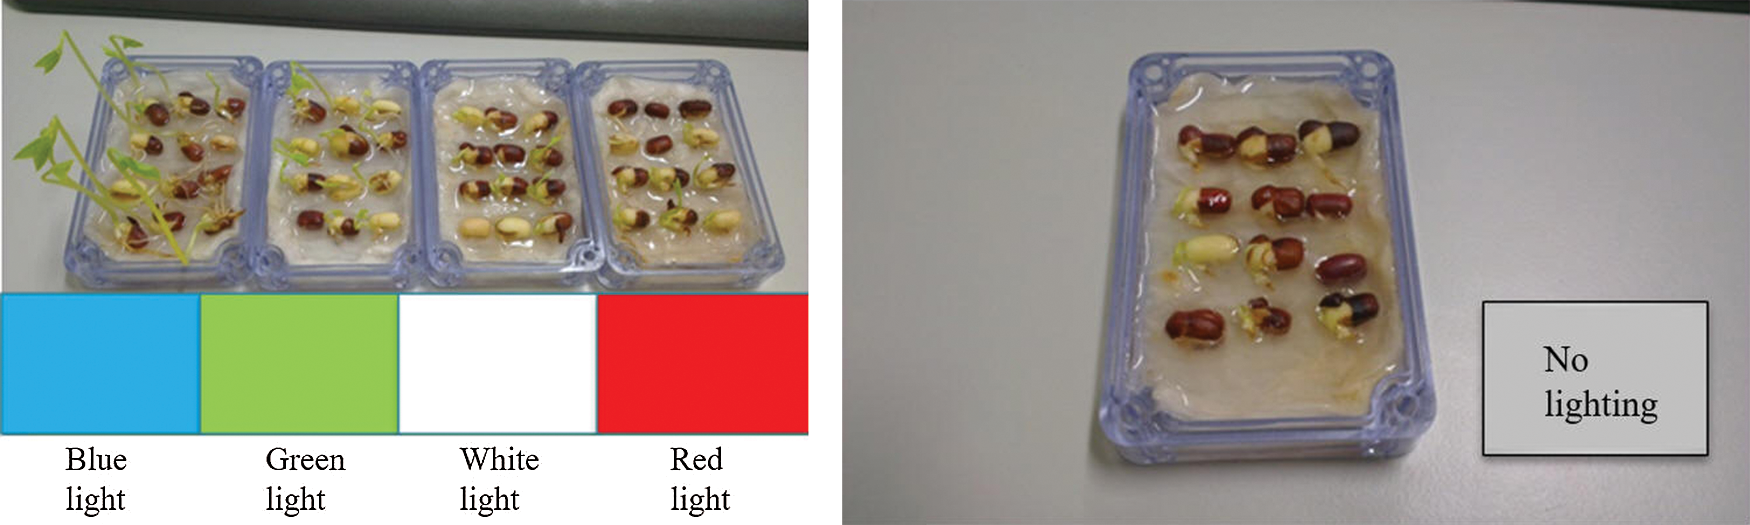
Figure 17: Various groups of red beans on Day 10; the red beans of the blue light group take a large lead over the other groups, and the difference is very obvious
Table 2: Growth rates with different light sources

As shown in Fig. 18, Arduino is used as experimental substrate to build and integrate an environmental monitoring system. The sensing part comprises temperature and humidity sensor, soil moisture sensor, air quality sensor, illuminance sensor, and photoresistor. These sensors monitor one item respectively. When the temperature is too high, the sprayer and fan are actuated for sprinkling and aeration cooling to reduce the temperature to a level suitable for plant growth. When the air humidity is insufficient, the sprayer is switched on to increase the air humidity to avoid insufficient air humidity resulting in insufficient plant moisture. When the soil moisture is insufficient, the sprayer is activated to moisten the soil to avoid the potted plant losing soil moisture. When the air quality is poor, the fan is turned on to extract the polluted air to avoid the air affecting the plant growth. When the illuminance is insufficient, the plant light is turned on to increase the plant growth rate. The RGB lamps provide different plants with a color light, increasing the growth rate. On the contrary, a wrong light will inhibit the growth rate.

Figure 18: Implementation results
6 Transmission Distance and Packet Reliability Experiment
Sean Dieter Tebje Kelly proposed that the reliability of a system is calculated from the correct information content received by a sensor, the number of lost packets, and the total number of packets from the end device to coordinator. The literature has not proposed the reliability transmission distance. According to the distance of a plant monitoring system, the experimental reliability transmission distances are 3 m, 10 m, and 20 m in this study, and the packet is transmitted once per second, where the reliability is rounded to two decimal places. About one days’ worth of experimental results are shown in Tab. 3. The longer the transmission distance is, the lower is the packet reliability. However, the reliability is relatively high within 20 m.

Table 3: Reliability of packets received according to distance

7 Use Extension Theory for Judgment
This study uses extension theory to analyze the environmental data to judge the current situation and to make a corresponding response. As shown in Fig. 19, the input values are sunshine 7 hours, temperature 47°C, humidity 50%, and soil moisture 600. The analysis result shows that when the temperature exceeds a normal range, the excess beyond the normal temperature range is displayed. Fig. 20 shows sunshine 7 hours, temperature 35°C, humidity 50%, and soil moisture 600. The correlation grade analysis result shows a high temperature, and so the corresponding method is to activate a sprayer for cooling and to turn on the fan for ventilation.
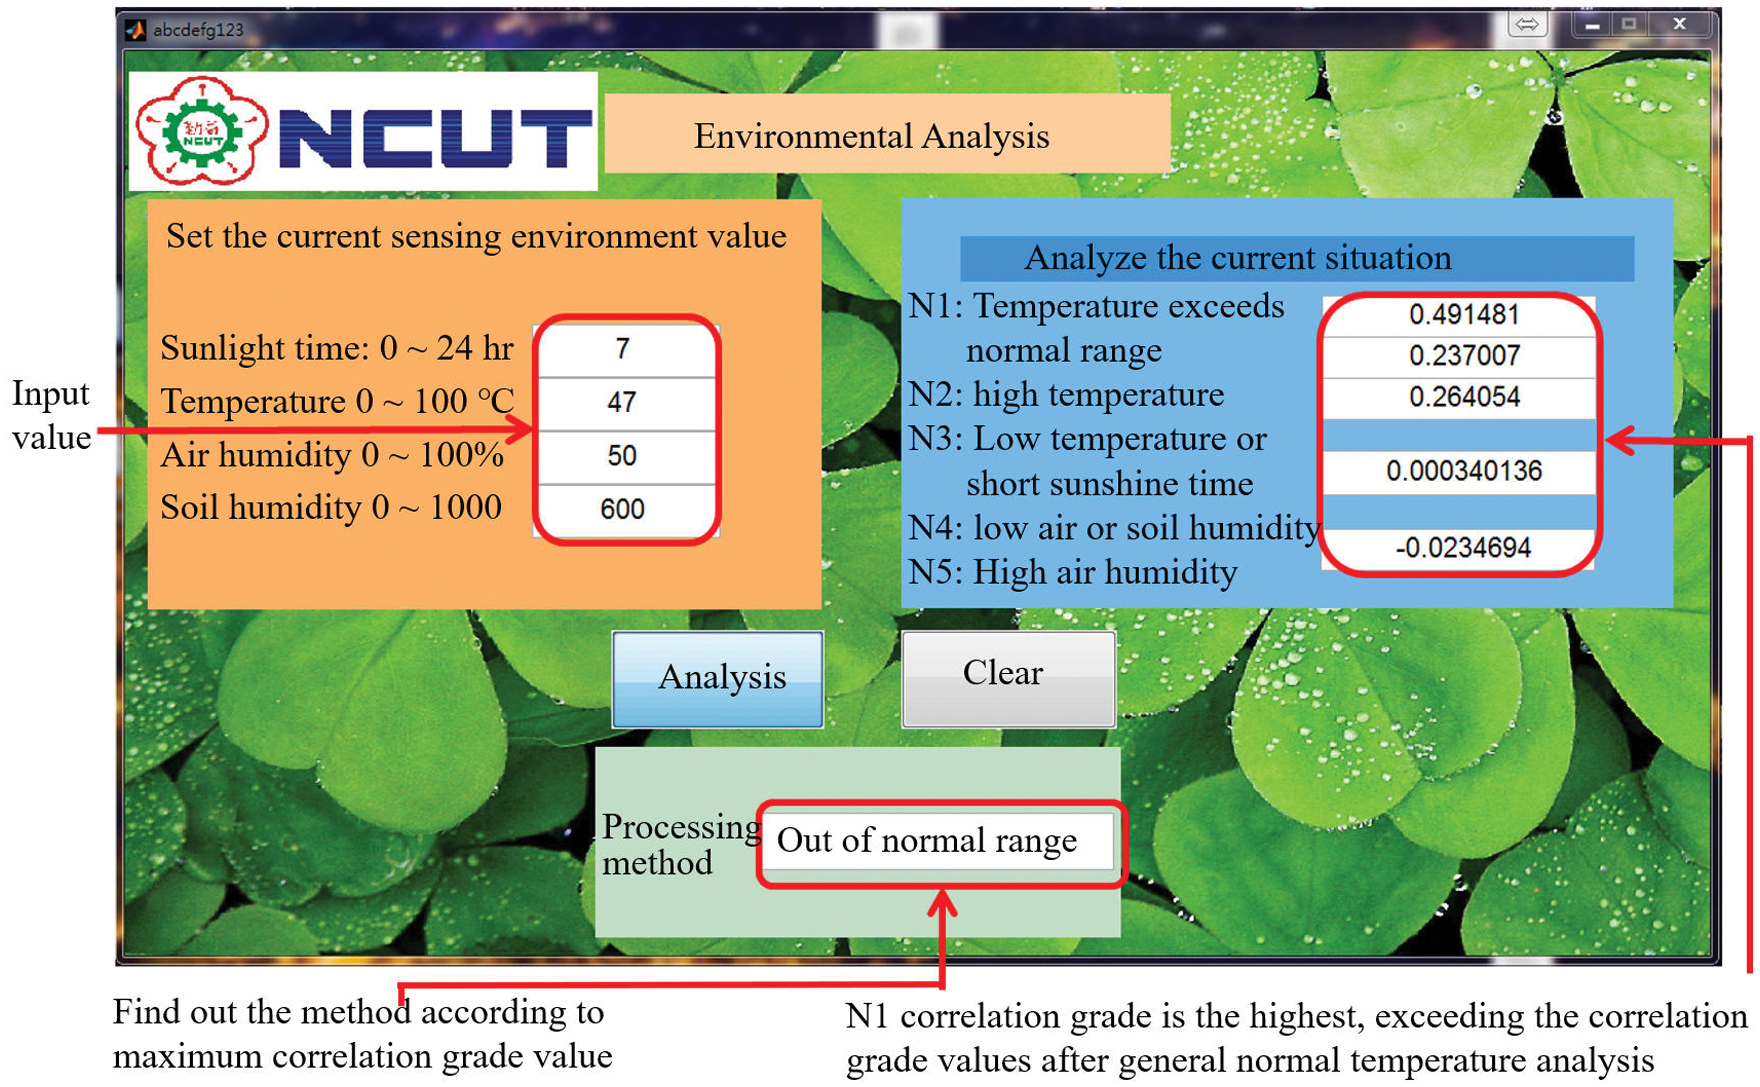
Figure 19: Extension analysis result shows temperature exceeds range

Figure 20: Extension analysis result shows temperature is high; cooling is required
The purpose of this system research is to develop a corresponding plant, only need to understand the plant growth environment, so that the monitoring system can be modified. Generally, common plants can use this system to maintain good growth and increase the growth rate of plants. The proposed method makes plant growth a concrete manifestation of a good environment by modifying various parameters. In other words, the environment that meets the rapid growth of plants is believed to be an environment that makes people feel comfortable. In this study, our laboratory uses common potted plants, and the temperature and humidity are also in line with the normal environment. There is constant temperature air-conditioning inside, and there is sunlight outside. Therefore, finding the best growth pattern for plants will be easy to achieve.
In the first experiment of this study, the test potted plant A under automatic control monitoring obviously grows faster than the naturally grown potted plant B in several days of observation, proving that the automatic monitoring system contributes to plant growth. In the second experiment, the growth of red beans from seed to germination is observed in different color lights. The results for 10 days show that the blue light has the greatest effect on accelerating the growth of red bean seeds, the green light takes second place, and the red light is slightly different from white light. The group without lighting has the lowest growth rate. In the third experiment, a sound sensor is used to make a simple interaction with the polymethacrylate plant box. A sound sensor is blown, and as long as the LED lamp on the Arduino board gives out light, the plant box actuates lighting and the sprayer. The sound sensor is blown again, and the LED lamp lights up, and then the plant box is closed. This simple interaction makes life more interesting. The fourth research result shows that the longer the experimental XBee wireless transmission distance is, the lower is the reliability. The reliability is higher than 95% within 20 m.
The fifth research goal is to use extension theory to analyze current conditions. The best required method is found rapidly by extension theory analysis, contributing to plant growth. The ultimate objective of the whole monitoring system is to modify the system according to any conditions as long as the growing environment of any plant is known. Therefore, the system is applicable to any plants, whereby plant growth remains good, and the plant growth rate can be enhanced.
Acknowledgement: This research was supported by the Department of Electrical Engineering, National Chin-Yi University of Technology. The authors would like to thank the National Chin-Yi University of Technology, Takming University of Science and Technology, Taiwan, for supporting this research.
Funding Statement: The author(s) received no specific funding for this study.
Conflicts of Interest: The authors declare that they have no conflicts of interest to report regarding the present study.
1. C. Konstantopoulos, E. Koutroulis, N. Mitianoudis and A. Bletsas. (2016). “Converting a plant to a battery and wireless sensor with scatter radio and ultra-low cost,” IEEE Transactions on Instrumentation and Measurement, vol. 65, no. 2, pp. 388–398. [Google Scholar]
2. S. N. Daskalakis, G. Goussetis, S. D. Assimonis, M. M. Tentzeris and A. Georgiadis. (2018). “A uW backscatter-morse-leaf sensor for low-power agricultural wireless sensor networks,” IEEE Sensors Journal, vol. 18, no. 19, pp. 7889–7898. [Google Scholar]
3. Uthman Baroudi. (2017). “Robot-assisted maintenance of wireless sensor networks using wireless energy transfer,” IEEE Sensors Journal, vol. 17, no. 14, pp. 4661–4671. [Google Scholar]
4. N. Harris, A. Cranny, M. Rivers, K. Smettem and E. G. Barrett-Lennard. (2016). “Application of distributed wireless chloride sensors to environmental monitoring: Initial results,” IEEE Transactions on Instrumentation and Measurement, vol. 65, no. 4, pp. 736–743. [Google Scholar]
5. L. Ascorti, S. Savazzi, G. Soatti, M. Nicoli, E. Sisinni et al. (2017). , “A wireless cloud network platform for industrial process automation: Critical data publishing and distributed sensing,” IEEE Transactions on Instrumentation and Measurement, vol. 66, no. 4, pp. 592–603. [Google Scholar]
6. J. Zhu, H. Yu, Z. Lin, N. Liu, H. Sun et al. (2019). , “Efficient actuator failure avoidance mobile charging for wireless sensor and actuator networks,” IEEE Access, vol. 7, pp. 104197–104209. [Google Scholar]
7. W. Liang, Z. Xu, W. Xu, J. Shi, G. Mao et al. (2017). , “Approximation algorithms for charging reward maximization in rechargeable sensor networks via a mobile charger,” IEEE/ACM Transactions on Networking, vol. 25, no. 5, pp. 3161–3174. [Google Scholar]
8. D. Spirjakin, A. Baranov and S. Akbari. (2018). “Wearable wireless sensor system with RF remote activation for gas monitoring applications,” IEEE Sensors Journal, vol. 18, no. 7, pp. 2976–2982. [Google Scholar]
9. J. Chen, J. Klein, Y. Wu, S. Xing, R. Flammang et al. (2016). , “A thermoelectric energy harvesting system for powering wireless sensors in nuclear power plants,” IEEE Transactions on Nuclear Science, vol. 63, no. 5, pp. 2738–2746. [Google Scholar]
10. L. Shu, M. Mukherjee, X. Xu, K. Wang and X. Wu. (2016). “A survey on gas leakage source detection and boundary tracking with wireless sensor networks,” IEEE Access, vol. 4, pp. 1700–1715. [Google Scholar]
11. P. Gil, A. Santos and A. Cardoso. (2014). “Dealing with outliers in wireless sensor networks: An oil refinery application,” IEEE Transactions on Control Systems Technology, vol. 22, no. 4, pp. 1589–1596. [Google Scholar]
12. A. Cammarano, C. Petrioli and D. Spenza. (2016). “Online energy harvesting prediction in environmentally powered wireless sensor networks,” IEEE Sensors Journal, vol. 16, no. 17, pp. 6793–6804. [Google Scholar]
13. F. Sangare, Y. Xiao, D. Niyato and Z. Han. (2017). “Mobile charging in wireless-powered sensor networks: Optimal scheduling and experimental implementation,” IEEE Transactions on Vehicular Technology, vol. 66, no. 8, pp. 7400–7410. [Google Scholar]
14. A. Afsharinejad, A. Davy, B. Jennings and C. Brennan. (2016). “Performance analysis of plant monitoring nanosensor networks at THz frequencies,” IEEE Internet of Things Journal, vol. 3, no. 1, pp. 59–69. [Google Scholar]
15. S. Cai and V. K. N. Lau. (2018). “Zero MAC latency sensor networking for cyber-physical systems,” IEEE Transactions on Signal Processing, vol. 66, no. 14, pp. 3814–3823. [Google Scholar]
16. Q. Han, P. Liu, H. Zhang and Z. Cai. (2019). “A wireless sensor network for monitoring environmental quality in the manufacturing industry,” IEEE Access, vol. 7, pp. 78108–78119. [Google Scholar]
17. L. Shu, M. Mukherjee, L. Hu, N. Bergmann and C. Zhu. (2016). “Geographic routing in duty-cycled industrial wireless sensor networks with radio irregularity,” IEEE Access, vol. 4, pp. 9043–9052. [Google Scholar]
18. A. N. Harun, R. Ahmad and N. Mohamed. (2015). “WSN application in LED plant factory using continuous lighting (CL) method,” in 2015 IEEE Conf. on Open Systems (ICOSBandar Melaka, Malaysia. [Google Scholar]
19. D. W. Upton, R. P. Haigh, P. J. Mather, P. I. Lazaridis, K. K. Mistry et al. (2020). , “Gated pipelined folding ADC-based low power sensor for large-scale radiometric partial discharge monitoring,” IEEE Sensors Journal, vol. 20, no. 14, pp. 7826–7836. [Google Scholar]
20. J. E. Shuda, A. J. Rix and M. J. Booysen. (2018). “Towards module-level performance and health monitoring of solar PV plants using LoRa wireless sensor networks,” in 2018 IEEE PES/IAS PowerAfrica, Cape Town, South Africa. [Google Scholar]
21. G. Deepika and P. Rajapirian. (2016). “Wireless sensor network in precision agriculture: A survey,” in 2016 Int. Conf. on Emerging Trends in Engineering, Technology and Science (ICETETSPudukkottai, India. [Google Scholar]
22. R. I. Gomaa, I. A. Shohdy, K. A. Sharshar, A. S. Al-Kabbani and H. F. Ragai. (2014). “Real-time radiological monitoring of nuclear facilities using ZigBee technology,” IEEE Sensors Journal, vol. 14, no. 11, pp. 4007–4013. [Google Scholar]
23. D. He and L. X. Zhang. (2012). “The water quality monitoring system based on WSN,” in 2012 2nd Int. Conf. on Consumer Electronics, Communications and Networks (CECNetYichang, China. [Google Scholar]
24. A. M. Ezhilazhahi and P. T. V. Bhuvaneswari. (2017). “IoT enabled plant soil moisture monitoring using wireless sensor networks,” in 2017 Third Int. Conf. on Sensing, Signal Processing and Security (ICSSSChennai, India. [Google Scholar]
25. X. Meng, W. Cong, H. Liang and J. Li. (2018). “Design and implementation of Apple Orchard Monitoring System based on wireless sensor network,” in 2018 IEEE Int. Conf. on Mechatronics and Automation (ICMAChangchun, China. [Google Scholar]
26. B. Sridhar, S. Sridhar and V. Nanchariah. (2020). “Design of novel wireless sensor network enabled IoT based smart health monitoring system for thicket of trees,” in 2020 Fourth Int. Conf. on Computing Methodologies and Communication (ICCMCErode, India. [Google Scholar]
27. M. E. Haque, K. Majumder and S. Uddin. (2019). “Potential measure to enhance lifespan of power plant monitoring system in era of IoT,” in 2019 IEEE Int. Conf. on Power, Electrical, and Electronics and Industrial Applications (PEEIACONDhaka, Bangladesh. [Google Scholar]
28. P. Sreelakshmi, C. Prabhavathi and K. Navyashree. (2018). “Design and implementation of an arm cortex M0+ based low power sensor node for an IoT based plant monitoring system,” in 2018 3rd IEEE Int. Conf. on Recent Trends in Electronics, Information & Communication Technology (RTEICTBangalore, India. [Google Scholar]
29. G. Bloom, G. Cena, I. C. Bertolotti, T. Hu, N. Navet et al. (2019). , “Event notification in CAN-based sensor networks,” IEEE Transactions on Industrial Informatics, vol. 15, no. 10, pp. 5613–5625. [Google Scholar]
30. A. W. Al-Dabbagh and T. Chen. (2016). “Design considerations for wireless networked control systems,” IEEE Transactions on Industrial Electronics, vol. 63, no. 9, pp. 5547–5557. [Google Scholar]
31. E. T. Iorkyase, C. Tachtatzis, P. Lazaridis, I. A. Glover and R. C. Atkinson. (2019). “Low-complexity wireless sensor system for partial discharge localisation,” IET Wireless Sensor Systems, vol. 9, no. 3, pp. 158–165. [Google Scholar]
32. L. Shu, M. Mukherjee, M. Pecht, N. Crespi and S. N. Han. (2018). “Challenges and research issues of data management in IoT for large-scale petrochemical plants,” IEEE Systems Journal, vol. 12, no. 3, pp. 2509–2523. [Google Scholar]
33. C. Zhu, S. Wu, G. Han, L. Shu and H. Wu. (2015). “A tree-cluster-based data-gathering algorithm for industrial WSNs with a mobile sink,” IEEE Access, vol. 3, pp. 381–396. [Google Scholar]
34. Q. Liu, Z. Wang, X. He, G. Ghinea and F. E. Alsaadi. (2017). “A resilient approach to distributed filter design for time-varying systems under stochastic nonlinearities and sensor degradation,” IEEE Transactions on Signal Processing, vol. 65, no. 5, pp. 1300–1309. [Google Scholar]
35. Y. Liu, M. Kashef, K. B. Lee, L. Benmohamed and R. Candell. (2019). “Wireless network design for emerging IIoT applications: Reference framework and use cases,” Proc. of the IEEE, vol. 107, no. 6, pp. 1166–1192. [Google Scholar]
36. F. Al-Turjman and S. Alturjman. (2018). “Context-sensitive access in industrial Internet of Things (IIoT) healthcare applications,” IEEE Transactions on Industrial Informatics, vol. 14, no. 6, pp. 2736–2744. [Google Scholar]
37. M. R. Caldieri, J. A. Bigheti and E. P. Godoy. (2017). “Implementation and evaluation of wireless networked control systems using modbus,” IEEE Latin America Transactions, vol. 15, no. 2, pp. 206–212. [Google Scholar]
 | This work is licensed under a Creative Commons Attribution 4.0 International License, which permits unrestricted use, distribution, and reproduction in any medium, provided the original work is properly cited. |