DOI:10.32604/iasc.2020.014142
| Intelligent Automation & Soft Computing DOI:10.32604/iasc.2020.014142 | |
| Article |
A Negotiated Pricing Model for Innovation Services Based on the Multiobjective Genetic Algorithm
1Harbin University of Science and Technology, Harbin, 150080, China
2Harbin Engineering University, Harbin, 150001, China
*Corresponding Author: Yan Zhou. Email: zhouyan@hrbust.edu.cn
Received: 01 September 2020; Accepted: 25 September 2020
Abstract: Service pricing is a bottleneck in the development of innovation services, as it is the issue of most concern to the suppliers and demanders. In this paper, a negotiated pricing model that is based on the multiobjective genetic algorithm is developed for innovation services. Regarding the process of service pricing as a multiobjective problem, the objective functions which include the service price, service efficiency, and service quality for the suppliers and the demanders are constructed. Because the solution of a multiobjective problem is typically a series of alternatives, an additional negotiation process is necessary in determining the final decision. A learning strategy is adopted during the negotiation process to simulate reality. Finally, the model is implemented in an innovation service transaction, the objective of which is to select the optimal price plan. The results demonstrate that the model is able to provide quantitative decision support for the pricing of an innovation service with a win-win result obtained. Furthermore, the influence of the parameters during the negotiation process is analyzed in detail. The effects of the learning strategy in accelerating the negotiation process and the set of reasonable parameters are discussed.
Keywords: Innovation service; negotiated pricing model; multiobjective problem; genetic algorithm; learning strategy
A ‘three-step’ strategy is proposed by the Chinese government in the ‘Outline of the National Strategy of Innovation-Driven Development’ [1]. According to this strategy, China will become an innovative country by 2020, a forefront of innovation-oriented country by 2030, and world’s top scientific and technological innovation powerhouse by 2050. To realize these objectives, industries with enormous innovation vitality were incorporated into China’s strategic emerging industries which is the key point to realize the strategic deployment of driving industrial innovation [2,3].
With the innovation-driven development strategy, innovation services emerge. Innovation services are the services provided for innovative activities, such as research and development (R & D) services, intellectual property services, and advanced technology services, etc. The principals of innovation services include scientific and technological intermediaries [4,5], service platforms for innovation [6], resource sharing platforms for science and technology [7], and knowledge-service intermediaries [8], among others. The advantages of resource and service are combined among these subjects to provide proper service support for industrial innovation in order to effectively increase the industrial innovation efficiency.
The premise for an innovation service to achieve value is that it is adopted by innovation enterprises [9]. Typically, the price of an innovation service is the main factor that determines its successful adoption by innovation enterprises. So the pricing of innovation services is the key to the transaction of innovation services and will affect the overall development of innovation services. Therefore, the reasonable pricing of innovation services and the maximization of the benefits of both the suppliers and the demanders of innovation services have become urgent problems to be solved.
In previous studies, the pricing of services mostly refers to the pricing method of commodities in which the prices are determined based on the supply-demand relationship [10] and the service cost. Kung et al. attempted to determine service prices using game theory [11]. Li et al. provided a pricing framework for big data services which was based on the comprehensive service quality, service time, and matching degree of supply and demand [12]. With the development of blockchain technology, researchers began to use it to mediate the pricing of services [13]. However, the service pricing methods in these studies are set by the suppliers. Due to the frequent interaction between the suppliers and the demanders in innovation services, the demanders also play an important role in the price-setting process; hence, the application of the above simple methods to adapt to the particularity of innovation services is difficult.
In this study, the process of innovation services pricing is regarded as the process of value co-creation between the suppliers and the demanders [14]. The price of an innovation service is reasonable if the supplier and demander achieve win-win. Therefore, the utilities of the supplier and demander can be regarded as objective functions, and the pricing of innovation services is essentially a multiobjective decision-making problem. However, the solution of a multiobjective problem is usually a series of alternatives and another process is necessary to make the final decision.
In this paper, Non-dominated Sorting Genetic Algorithm-II (NSGA-II) algorithm is utilized to solve the multiobjective problem to obtain the Pareto front (the above mentioned ‘series of alternatives’). A negotiation process is performed on the Pareto front to make the final decision. A learning strategy is adopted during the negotiation process to simulate reality. The remainder of this paper is structured as follows: The process of innovation services pricing is analyzed theoretically in Section 2, with a model for innovation services pricing exhibited. Section 3 presents the algorithm of the model in detail. In Section 4, an implementation of the model is described. The influence of the parameters during the negotiation process is discussed in Section 5. The conclusions are drawn in Section 6.
2 Theoretical Analysis & Modeling
In this section, the problem of innovation service pricing is analyzed theoretically. Three hypotheses are formulated, based on which the model is constructed.
A practical service pricing process typically involves more than one demander and supplier. However, multiple demanders and suppliers can be regarded as the superposition of single demander and supplier. Therefore, hypothesis 1 is raised:
Hypothesis 1: The number of demanders and the number of suppliers in a service are both 1. The demander and the supplier are denoted as D and S, respectively.
In a practical service pricing process, the price of the service is generally the main concern of the demander and supplier. While the quality and efficiency of the service will also affect the price acceptance. Usually, both the supplier and the demander have corresponding acceptance ranges for each attribute. Therefore, hypothesis 2 is raised:
Hypothesis 2: The set of service attributes is denoted as  which includes the service price, service efficiency, and service quality.
  stands for the value of
 . The acceptable ranges for the demander D and for the supplier S on
  are denoted by
 and
and  , respectively.
The importance of each attribute of the service varies from the demander to the supplier. The weight coefficient of each attribute must be considered. Therefore, hypothesis 3 is raised:
Hypothesis 3: The demander and the supplier specify the set of weight coefficients for each attribute according to their own actual situation. The sets of weight coefficients are denoted as  for the demander and
  for the supplier, which satisfy

With these hypotheses, a model for innovation service pricing can be developed. The model is composed of four steps (Fig. 1), which are described as follows:

Figure 1: Flowchart of the innovation service pricing model
Step 1: Set the initial parameters of the supplier and the demander. The parameters include the acceptable ranges  and
and 
 , and the corresponding sets of weight coefficients
  and
and  .
.
Step 2: Construct the objective functions of the supplier and the demander, which are denoted as  and
and  , respectively.
Step 3: Find the solution of the multiobjective optimization problems (i.e., Pareto front).
Step 4: Obtain the final decision 
 on the Pareto front with the chosen strategy for negotiation.
3.1 Objective Functions Construction
The benefit is usually the primary objective of both the supplier and the demander. In this model, the overall benefit is assumed to be the sum of the benefits that are received from the service price, service efficiency, and service quality. Furthermore, it is assumed that there is no overlap between the benefits of the three parts, namely, the benefits can be linearly superimposed. Based on the comprehensive benefit calculation formula proposed by Raiffa [15], the benefit functions (i.e., objective funtions) for the supplier and the demander are:


where  and
and  are the contributions of the attribute j to the demander and the supplier, respectively. The computing method for
  and
and  is defined as follows:

in which ‘cost’ and ‘benefit’ are tags attached to the attributes. The tag of an attribute indicates whether the increase in the attribute will cause an increase in the cost or benefit. Each attribute could have different tags for the demander and the supplier, as presented in Tab. 1.
Table 1: Tags of each attribute for the demander and the supplier

To maximize the benefits of both the supplier and the demander with the acceptable ranges of the attributes as constraints, the following multiobjective problem is formulated:

subject to

3.2 Obtainment of the Pareto Front
The multiobjective optimization problem defined by Eqs. (4 and 5) can be solved with genetic algorithm [16,17], ant colony algorithm [18], particle swarm optimization algorithm [19] or simulated annealing algorithm [20]. In this paper, one of the most widely employed multiobjective optimization methods NSGA-II is utilized to obtain the set of noninferior solution of the problem.
NSGA-II is a multiobjective optimization method that is based on the genetic algorithm. The basic process of NSGA-II is illustrated in Fig. 2. Detailed information about the method is provided in [21,22].

Figure 2: Flowchart of NSGA-II algorithm
With the NSGA-II algorithm, the Pareto front of the above multiobjective problem is obtained. The Pareto front is composed of a series of points, with each point contains a possible combination of attributes  and the corresponding combination of utilities for the supplier and the demander
  .
.
3.3 Negotiation on the Pareto Front
A series of alternatives (Pareto front) are obtained with NSGA-II in Section 3.2. In this section, a negotiation is conducted to make the final decision. The classic negotiation strategy proposed by Faratin [23] is adopted in combination with a learning strategy to complete the negotiation process.
In Faratin’s method, the supplier and the demander reached an agreement with a process of initial expectations and gradual concessions. For each negotiation, the expected utility EU(t) is

where t is the number of negotiations; max and min are the maximum and minimum values of the acceptable utilities for the supplier or the demander, respectively;  is the concession coefficient, which has the following form:

in which  is the maximum number of negotiations;
  is the initial concession coefficient, which corresponds to the initial value of
  ;
;  is the parameter of concession speed control, according to which the degree of aggressiveness of the negotiation strategy adopted by both sides is determined. The value of
  as a function of t is illustrated in Fig. 3 for different
  values.

Figure 3:  as a function of t for different
  values (
 )
)
The learning strategy attempts to automatically adjust the value of  according to the concession of the opposite side [24]. The method was demonstrated to accelerate and increase the robustness of the negotiation process. Take the supplier as an example,
  is the difference between the utilities of the last two proposals, where
  represents the supplier’s utility with the demander’s bid. Define the concession rate
  as the ratio of the differences:

Now, we discuss the automatic adjustment of the value of  . With the definition of
  given by Eq. (8), if
  , the concession of the demander is gradually increasing with t. The supplier should reduce its concession to avoid unnecessary excess concession and increase its final utility. If
  , the demander is making steady concession. Therefore, the supplier should keep a constant value of
  and also make steady concession. If
  , the demander is reducing its concession. So the supplier should make larger concession to approach the demander’s expected bid in order to increase the success rate of the negotiation. After a series of tests, the value of
  is adopted due to its simplicity and effectiveness.
The negotiation is conducted on the Pareto front obtained with NSGA-II. The supplier and the demander compare their actual and expected utilities and negotiate until an agreement is reached. The process is described as follows with a flowchart illustrated in Fig. 4:

Figure 4: Flowchart of the negotiation process
Step 1: Based on the Pareto front, the supplier bids on its highest utility. The utility of the supplier is defined as  and the corresponding combination of bidding attributes is
  . Proceed to step 2.
Step 2: After receiving a bid from the supplier, the demander obtains its utility  on the Pareto front. The demander compares
  with
with  which can be computed with the concession function Eq. (6). If
  , then proceed to step 3; otherwise (i.e.,
  ), proceed to step 6 directly.
Step 3: The demander rejects the bid of the supplier as it does not meet the demander’s expectation. Based on  , the demander finds the utility
  which is closest to
  on the Pareto front and provides the corresponding
  as the bid. Proceed to step 4.
Step 4: The supplier receives the new bid and obtain the corresponding utility  . Similar to step 2, the supplier compares
  with
with  which can be computed with the concession function Eq. (6). If
  , then proceed to step 5; otherwise (i.e.,
  ), proceed to step 6 directly.
Step 5: The supplier rejects the bid of the demander as it does not meet the supplier’s expectation. Based on  , the supplier finds the utility
  which is closest to
  on the Pareto front and provides the corresponding
  as the bid. Return to step 2.
Step 6: The bid meets the supplier’s and demander’s expectations. An agreement is reached and the negotiation is terminated.
In this section, the developed model is implemented in a service pricing problem. To evaluate the price of a R & D service, an innovation service platform selects one each representative company from potential suppliers and demanders, which are denoted as S and D, respectively. The platform collects the weight coefficients and acceptable ranges for the service price, service efficiency and service quality of S and D. Relevant parameters for the supplier and the demander in the R & D service pricing problem are presented in Tab. 2.
Table 2: Parameters for the supplier and demander in the R & D service pricing problem

According to Eq. (3), the utilities of each attribute for S and D are calculated as follows:
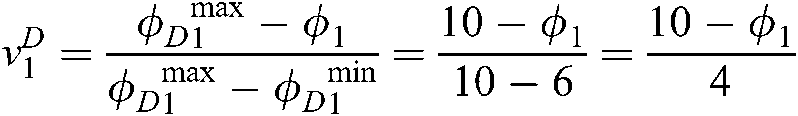

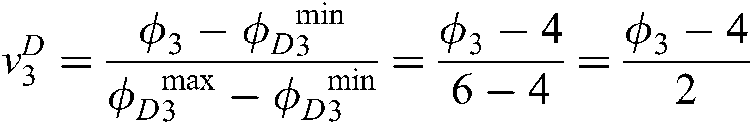


According to Eqs. (4) and (5), the following objective functions and corresponding constraints can be obtained:


subject to

NSGA-II is utilized to solve this multiobjective optimization problem. The relevant parameter settings of NSGA-II are given in Tab. 3. The Pareto front is obtained, as shown in Fig. 5.

Figure 5: Pareto front for the problem
Table 3: Parameter settings of NSGA-II

Based on the Pareto front, S and D negotiate on service prices, service quality, and service efficiency. The actual and expected utilities of S and D change with the number of negotiations are shown in Fig. 6.

Figure 6: Actual and expected utilities of S and D as functions of the number of negotiations
As shown in Fig. 6, the actual utilities reached the expected utility at the 15th negotiation, which means that an agreement is reached. The final bid for the 15th negotiation is 8.4228; therefore, the final price of the R & D service is 8.4228.
5 Discussion on Negotiation Process
The learning strategy and some user-defined parameters are adopted during the negotiation process, while the influence of them has not been fully discussed. The objective of this section is to discuss the influence of learning strategy and the user-defined parameters in detail. The results of the problem in section 4 is considered as the basis, which means that the Pareto front is kept same as above for all the following discussions.
First, we investigate the influence of the learning strategy. For simplicity, the control parameters including initial concession parameter  and concession speed control parameter
  are the same as section 4. The learning strategy is simply turned off or not during the simulation for comparison. The results of the negotiation process are shown in Fig. 7. The number of negotiations for with and without the learning strategy are 15 and 60, respectively. The final results are the same for the two cases. Therefore, the negotiation process is greatly accelerated with the learning strategy with nearly no change on the final results.

Figure 7: Utilities of the supplier S and the demander D as functions of the number of negotiations with or without the learning strategy (LS is short for learning strategy)
5.2 Initial Concession Parameter  and Concession Speed Control Parameter
The initial concession parameter  and concession speed control parameter
  are two important parameters during the negotiation process. To analyze them in detail,
  ranging from 0.1 to 1.0 and
  ranging from 0.2 to 1.8 are considered. The interval of value range for
  and
and  are 0.1 and 0.2, respectively. The
  in Eq. (6) is set 100 for all the simulations, which is reasonable for reality.
The results of iteration number and the utilities of the demander and the supplier for various combinations of  are given in Tab. 4. It is not hard to find that a larger initial concession parameter
  and concession speed control parameter
  will lead to a smaller iteration number. It is noted that when the value of
  is larger than 0.6, program will crash. However, the accuracy of the results is necessary to be checked. Here the results with very large
  (here we use
  ) and very small
  and
and  (
( and
and  ) as the reference results. The utilities of the demander and the supplier are 0.221799 and 0.288188, respectively. The following equation is adopted to compute the relative error
Table 4: The results of iteration number (Ite Num.), and the utilities of the demander (De.) and the supplier (Su.) for various combinations of 


Here De. and Se. indicate the utilities of the demander and the supplier, respectively. Subscript ref means the reference values.
The relative errors of the utilities are illustrated in Fig. 8. To be clear, both three-dimensional and two-dimensional results are shown. For the combination of small  and
and  , relative error could be very large, up to 100%. With the increase of
  and
and  , the error decrease gradually. Less than 5% error is observed when
  and
and  is large enough. Recall the results in Tab. 4, it seems that larger values of
  and
and  usually behave better. However, it should be remembered that very large
  may lead to a crash of the program, as mentioned before.

Figure 8: Relative error of the utilities in (a) three-dimensional; and (b) two-dimensional
An pricing model for innovation services that is based on the combination of the genetic algorithm and negotiation is developed in this paper. Based on three hypotheses, the model is analyzed and interpreted in detail. The model utilizes the benefit functions of commonly considered parameters of the service supplier and demander as the objective functions, obtains the Pareto front with NSGA-II, and adopts a learning strategy as the negotiation strategy. The model is utilized to study the pricing process of a R & D service, and the optimal price is successfully obtained. Therefore, the reliability of the model is demonstrated.
A detailed discussion on the influence of the learning strategy and the user-defined parameters during the negotiation process are performed based on the selected implementation. It is observed that the learning strategy greatly accelerates the negotiation process with nearly no influence on the final results. In addition, a larger initial concession parameter  and concession speed control parameter
  will lead to a smaller iteration number with acceptable accuracy obtained. While the initial concession parameter
  should not be too large, otherwise the program will crash.
However, the model has various shortcomings. For example, the negotiation process is only affected by the behavior of the negotiating counterparty, and the influence of the market supply-demand environment is not considered. This shortcoming will be resolved in the future so that the pricing model can better adapt to the development of innovation services.
Acknowledgement: The authors are grateful for the important and valuable comments of the anonymous reviewers.
Conflict of Interest: The authors declare that they have no conflicts of interest to report regarding the present study.
Funding Statement: This research was funded by the National Natural Science Foundation of China (No. 71704036), the Harbin University of Science and Technology's 2019 "Science and Engineering Talents" Program Outstanding Young Talent Project (2019-KYYWF-0216), and the Harbin University of Science and Technology School of Economics and Management "Double First Class" Discipline Construction High-level Cultivation Project (KY202013C).
1. M. K. Sheng and J. Luo. (2018). “Comparative research on strategy and policy of science and technology innovation between China and India - take STI in India and China’s "outline of nation innovation-driven development strategy" as an example,” Science & Technology Progress and Policy, vol. 35, pp. 127–134. [Google Scholar]
2. Y. Li, H. Guo, S. Y. Cooper and H. Q. Wang. (2019). “The influencing factors of the technology standard alliance collaborative innovation of emerging industry,” Sustainability, vol. 11, no. 24, pp. 1–17. [Google Scholar]
3. J. Wu, Z. Yang, X. Hu, H. Wang and J. Huang. (2018). “Exploring driving forces of sustainable development of China’s new energy vehicle industry: an analysis from the perspective of an innovation ecosystem,” Sustainability, vol. 10, no. 12, pp. 1–24, . DOI 10.3390/su10020001. [Google Scholar]
4. E. Villani, E. Rasmussen and R. Grimaldi. (2017). “How intermediary organizations facilitate university—industry technology transfer: a proximity approach,” Technological Forecasting and Social Change, vol. 114, pp. 86–102, . DOI 10.1016/j.techfore.2016.06.004. [Google Scholar]
5. F. Stezano. (2018). “The role of technology centers as intermediary organizations facilitating links for innovation: four cases of federal technology centers in Mexico,” Review of Policy Research, vol. 35, no. 4, pp. 642–666, . DOI 10.1111/ropr.12293. [Google Scholar]
6. W. Fu, Q. Wang and X. Zhao. (2017). “The influence of platform service innovation on value co-creation activities and the network effect,” Journal of Service Management, vol. 28, no. 2, pp. 348–388, . DOI 10.1108/JOSM-10-2015-0347. [Google Scholar]
7. K. Hong, J. R. Hu and W. Wang. (2010). “Research on the innovative clusters and countermeasures of science & technology information resource sharing platform kunming Chengdu platform as an example,” in 5th International Conference on Cooperation and Promotion of Information Resources in Science and Technology, pp. 386–391. [Google Scholar]
8. T. Abbate, A. P. Codini and B. Aquilani. (2019). “Knowledge co-creation in Open innovation digital platforms: processes, tools and services,” Journal of Business & Industrial Marketing, vol. 34, no. 7, pp. 1434–1447, . DOI 10.1108/JBIM-09-2018-0276. [Google Scholar]
9. C. Gronroos. (2011). “Value co-creation in service logic: a critical analysis,” Marketing Theory, vol. 11, no. 3, pp. 279–301, . DOI 10.1177/1470593111408177. [Google Scholar]
10. F. Cui, H. Tang, Q. Zhang, B. J. Wang and L. W. Dai. (2019). “Integrating ecosystem services supply and demand into optimized management at different scales: a case study in Hulunbuir, China,” Ecosystem Services, vol. 39, pp. 100984. [Google Scholar]
11. L. Kung and G. Zhong. (2017). “The optimal pricing strategy for two-sided platform delivery in the sharing economy,” Transportation Research Part E: Logistics and Transportation Review, vol. 101, pp. 1–12, . DOI 10.1016/j.tre.2017.02.003. [Google Scholar]
12. H. Li, M. Dong, K. Ota and M. Y. Guo. (2016). “Pricing and repurchasing for big data processing in multi-clouds,” IEEE Transactions on Emerging Topics in Computing, vol. 4, no. 2, pp. 266–277, . DOI 10.1109/TETC.2016.2517930. [Google Scholar]
13. T. Choi, S. Guo, N. Liu and X. Y. Shi. (2020). “Optimal pricing in on-demand-service-platform-operations with hired agents and risk-sensitive customers in the blockchain era,” European Journal of Operational Research, vol. 284, no. 3, pp. 1031–1042, . DOI 10.1016/j.ejor.2020.01.049. [Google Scholar]
14. M. Kohtamaki and J. Partanen. (2016). “Co-creating value from knowledge-intensive business services in manufacturing firms: the moderating role of relationship learning in supplier—customer interactions,” Journal of Business Research, vol. 69, no. 7, pp. 2498–2506, . DOI 10.1016/j.jbusres.2016.02.019. [Google Scholar]
15. H. Raiffa. (1982). The Art and Science of Negotiation. Cambridge, MA: Harvard University Press. [Google Scholar]
16. K. W. De Bock, K. Coussement and S. Lessmann. (2020). “Cost-sensitive business failure prediction when misclassification costs are uncertain: a heterogeneous ensemble selection approach,” European Journal of Operational Research, vol. 285, no. 2, pp. 612–630, . DOI 10.1016/j.ejor.2020.01.052. [Google Scholar]
17. G. Babaei and S. Bamdad. (2020). “A multi-objective instance-based decision support system for investment recommendation in peer-to-peer lending,” Expert Systems with Applications, vol. 150, pp. 113278. [Google Scholar]
18. M. Mavrovouniotis, C. Li and S. Yang. (2017). “A survey of swarm intelligence for dynamic optimization: algorithms and applications,” Swarm and Evolutionary Computation, vol. 33, pp. 1–17, . DOI 10.1016/j.swevo.2016.12.005. [Google Scholar]
19. A. Li, B. Xue and M. Zhang. (2020). “Multi-objective feature selection using hybridization of a genetic algorithm and direct multisearch for key quality characteristic selection,” Information Sciences, vol. 523, pp. 245–265, . DOI 10.1016/j.ins.2020.03.032. [Google Scholar]
20. M. H. Shirvani. (2020). “Bi-objective web service composition problem in multi-cloud environment: a bi-objective time-varying particle swarm optimisation algorithm,” Journal of Experimental & Theoretical Artificial Intelligence, pp. 1–24. [Google Scholar]
21. N. Srinivas and K. Deb. (1995). “Multiobjective function optimization using nondominated sorting genetic algorithms,” Evolutionary Computation, pp. 221–248. [Google Scholar]
22. K. Deb, A. Pratap and S. Agarwal. (2002). “A fast and elitist multiobjective genetic algorithm: NSGA-II,” IEEE Transactions on Evolutionary Computation, pp. 182–197. [Google Scholar]
23. P. Faratin, C. Sierra and N. R. Jennings. (1998). “Negotiation decision functions for autonomous agents,” Robotics and Autonomous Systems, vol. 24, no. 3-4, pp. 159–182, . DOI 10.1016/S0921-8890(98)00029-3. [Google Scholar]
24. K. V. Hindriks, D. Tykhonov and M. M. de Weerdt. (2012). “Qualitative one-to-many multi-issue negotiation: approximating the QVA,” Group Decision and Negotiation, vol. 21, no. 1, pp. 49–77, . DOI 10.1007/s10726-009-9186-6. [Google Scholar]
 | This work is licensed under a Creative Commons Attribution 4.0 International License, which permits unrestricted use, distribution, and reproduction in any medium, provided the original work is properly cited. |