DOI:10.32604/iasc.2020.012775
| Intelligent Automation & Soft Computing DOI:10.32604/iasc.2020.012775 | |
| Article |
Text Detection and Classification from Low Quality Natural Images
1Department of Computer Science, Wah Campus, COMSATS University Islamabad, Islamabad, 47040, Pakistan
2Department of Computer Science, HITEC University, Taxila, 47080, Pakistan
3Department of Mathematics and Computer Science,Beirut Arab University, Beirut, Lebanon
4Department of Computer Science and Engineering, Soonchunhyang University, Asan, 31538, South Korea
*Corresponding Author: Yunyoung Nam. Email: ynam@sch.ac.kr
Received: 02 July 2020; Accepted: 10 September 2020
Abstract: Detection of textual data from scene text images is a very thought-provoking issue in the field of computer graphics and visualization. This challenge is even more complicated when edge intelligent devices are involved in the process. The low-quality image having challenges such as blur, low resolution, and contrast make it more difficult for text detection and classification. Therefore, such exigent aspect is considered in the study. The technology proposed is comprised of three main contributions. (a) After synthetic blurring, the blurred image is preprocessed, and then the deblurring process is applied to recover the image. (b) Subsequently, the standard maximal stable extreme regions (MSER) technique is applied to localize and detect text. Soon after, K-Means is applied to get three different clusters of the query image to separate foreground and background and also incorporate character level grouping. (c) Finally, the segmented text is classified into textual and non-textual regions using a novel convolutional neural network (CNN) framework. The purpose of this task is to overcome the false positives. For evaluation of proposed technique, results are obtained on three mainstream datasets, including SVT, IIIT5K and ICDAR 2003. The achieved classification results of 90.3% for SVT dataset, 95.8% for IIIT5K dataset, and 94.0% for the ICDAR 2003 dataset, respectively. It shows the preeminence of the proposed methodology that it works fine for good model learning. Finally, the proposed methodology is compared with previous benchmark text-detection techniques to validate its contribution.
Keywords: Feature points; K-means; deep learning; blur image; color spaces; classification
The recent era has witnessed a lot of growth in smart cities. Especially in health care, banking, education and video surveillance as well as IoT based autonomous vehicles. Such systems demand edge and app intelligence mechanisms. Further, the invasion of deep learning (DL) based systems have also evolved and put many challenges on these autonomous systems [1,2]. Textual data in images presents instrumental knowledge for content-based image repossession and many other applications of computer vision. This textual information varies because of disparities in font size, style, alignment, random orientation. Above all, the low contrast, low resolution, blur and complex background make its detection (localization and identification) and classification (verification) more challenging [3]. Generally, the scenic properties like foreground and background (Textual and non-textual data) often creates problems in text detection and classification. Foreground properties include variation in size, colour, font and orientation, which become a source of complication in the detection of textual data robustly from scene text images. Conversely, images with complex backgrounds contain a variety of objects with multiple colours along with sky, grass, bricks, and fences that decline the robustness and creates difficulty in extraction of textual features.
To counter low-quality property of an image for detecting text requires high-level skills and machine learning approaches to enhance the image for attaining good results. However, in recent years techniques based on deep learning have been introduced which acquire classified features from training data, provides new promising results on benchmarks as ICDAR series contents [4,5]. Handcrafted features were also introduced to get the properties of textual areas as shape and texture of text. But most of them deal with standard quality images rather than low-quality images. As mentioned earlier, important information is stored in textual images. It is utilized in videos and image applications based on content, as in searching web images base on content, repossession of information from videos, text recognition and analysis based on mobile. A lot of projects recently have been using maximally stable extremal regions (MSER) based methods as character candidates. Although MSER is considered as the best method for localizing text in ICDAR 2011 Robust Reading Competition [6] and produces promising results. Nevertheless, at the same time, report some problems. The ability to read robust textual data from dissipated scene text images helped in multiple real-world applications. For example, advantageous technologies for visually harmed persons and also in geo-localization, urban and robot navigation, cross-lingual access and in autonomous vehicles [7] containing onboard units (OBU) and interacting with road side unit (RSU) as well as other edge and IoT based units [8]. Therefore, most recently, the problem of detection of textual data from natural scene text images of low quality has acquired increasing attention from computer vision. Moreover, such challenges are even more important when the systems also demand privacy, latency and scalability while trying to utilize the edge intelligent devices and nodes [9]. Scene text detection and classification became challenging because of two types of factors known as internal and external. External factors are based on the environment, which causes blur, noise, occlusions etc. to create problems in the detection of textual data. Internal factors are the properties and dissimilarities in textual data from scene text images [10]. The complications in scene text are due to the three major reasons which are: 1) Natural images containing text in orientations, so bounding boxes are oriented rectangles or quadrangles; 2) Significant variations in the aspect ratio of scene text bounding boxes; 3) Variations of text data as characters, words, and text lines may cause confusion for algorithms to locate the boundaries.
Alternatively, most of the traditional methods, such as MSE, are found credible in detecting text. In recent times, methods based on CNN achieve up to the mark results for classification of text and many other domains like surveillance [11], medicine [12,13], biometric [14], and agriculture [15,16]. Powerful extraction of characteristic features is the immense power of CNN based models, and these are further helpful for high-class model learning, which can respond effectively to unseen data [17]. Considering the effectiveness of such methods, a novel methodology is suggested in this paper for the detection and classification of textual data from low quality natural scene images. In this paper, K-Means and MSER are used for separating foreground from background and a CNN model for classification of regions containing text and non-text.
1.1 Objective and Contribution
To address the app and edge level challenges in this paper, we have proposed a DL based intelligence system for a smart vehicle that is equipped with the smart cameras and is capable of processing text that is blurred and is challenging to process. Main points of the proposed work are as follows:
• Firstly, input images are converted into blur images, as we do not have any benchmarked dataset of blur text images. So averaging filter is applied to the input images to make them blur. Then, preprocessing is applied on blur images for deblurring and improving the quality.
• Further, histogram equalization is applied on blurry images for contrast enhancement, then L*a*b color space is applied for preprocessing as tones and colors are held distinctly, and one color can be adjusted without disturbing the other.
• After visual enhancement of an image, the challenge of text detection having different foregrounds and backgrounds is encountered. The unsupervised learning algorithm k-means is exploited, where clusters are created using this algorithm. These clusters help in separation of foreground and background (text and non-text) from the query image.
• Next, MSER is applied to detect textual data from each clustered image followed by character level grouping. Sometimes, the non-text connected components are discovered, which can be further discarded based on geometric properties.
• Finally, obtained connected components are organized into text and non-text sections using the proposed CNN framework. By incorporating deep features, the false positive rate is significantly minimized.
Low-quality images are mostly affected by occlusions and blur effects. Occlusions in natural scene images are caused by overlapping of text, while blur effects are caused by capturing device issues and also because of uncontrolled light effects. Therefore, it becomes challenging for optical character recognition (OCR) to recognize or understand the textual data from low-quality images. Some previous works deal with the rebuilding of occluded characters by watermarks in textual images [18]. Others also exploited the texture synthesis to reconstruct the text that can in-expensively and efficiently create novel texture by selecting and duplicating the references from sources [19]. Exemplar-based methodologies rebuild the texture, but problems are found using linear structures. Some more algorithms are proposed to solve the image filling issue. Using digital methods of inpainting fill holes by promulgating linear structures through diffusion. The downside is that process of diffusion causes blur, that becomes obvious when filling enormous region. Criminist et al. [20] proposed a technique by combining both texture and image inpainting methods. The perceptiveness is that ‘inpainting front’ should spread along linear isophotes. Zhao et al. [21] introduced a methodology for removing noise from low-quality images. Their algorithm contained three steps that are a) Match filter was applied initially) Wiener filter was used to remove noise further and c) they have used an average filter to smooth the images. This algorithm has improved the quality of images by removing noise from images. Earlier Ittner et al. [22] have proposed an algorithm to categorize textual data from low-quality images. This model was presented to read textual data from documents. The proposed method used OCR to categorize text as OCR can handle a large number of words utilizing low-quality images. The classifier consists of two parts: i) The prototype to compare the documents and ii) A function to transform similarity of a document to prototype for estimating the probability of the document. Iqbal et al. [23] introduced a colour correction model for improving low-quality images by using contrast correction by efficiently removing bluish color and increase the low red illumination for achieving high-quality images. Their proposed technique has three main steps. Firstly, the image was equalized on red, green blue (RGB) colors. Then contrast correction was applied on the RGB color model, and finally, on HSI color model is used. Another framework [24] has been proposed to disable the degradation of images acquired by an outdoor camera. Neverova et al. [25] proposed for improving images with lightning conditions. They have shown that a combination of color images and corresponding depth maps allows recovering estimations of locations and colors of multiple lights from scene images. The optimization process has been used to find lightening conditions that allow minimizing the difference of original image and rendered one. Tuyet et al. [26] presented a method for detecting edges of objects from medical images. This technique has used Bayesian thresholding for de-noising of images and, B-spine curve for smoothing. Zhu et al. [27] introduced a method to detect animals from low quality images. This technique presented two-channeled pyramid network for image detection. For gaining local information, a depth indication extracted from original image and two channeled perceiving models were used as input for training of network. And finally, all information was merged to get full detection results. Al-Shemarry et al. [28] has introduced a 3L-LBP method for reading number plates from low quality images. The method given by them used three levels of preprocessing pattern classifiers to detect license plate localities and showed good accuracy. On images having challenges such as uneven contrast, dirt, fog and distortion.
The methodologies mentioned above have improved the quality of images by noise removal. However, the main drawback while using OCR is that OCR may get confused among characters and words in case of low-quality textual images. As a result, the above-discussed techniques lack the state-of-the-art in detecting text from low quality natural scene text images. Hence, the proposed technique handles the challenges of detecting and classifying textual data accurately from low-quality scene text images.
A process plan of the proposed framework is presented in Fig. 1. The proposed work consists of two parts: (1) Following the preprocessing of low-quality images, the K-Means is employed to extract three-level clusters of the query image. Afterwards, the detection of textual data is performed using MSER followed by character level grouping; (2) The connected components obtained are then classified into textual and non-textual regions using a CNN framework.
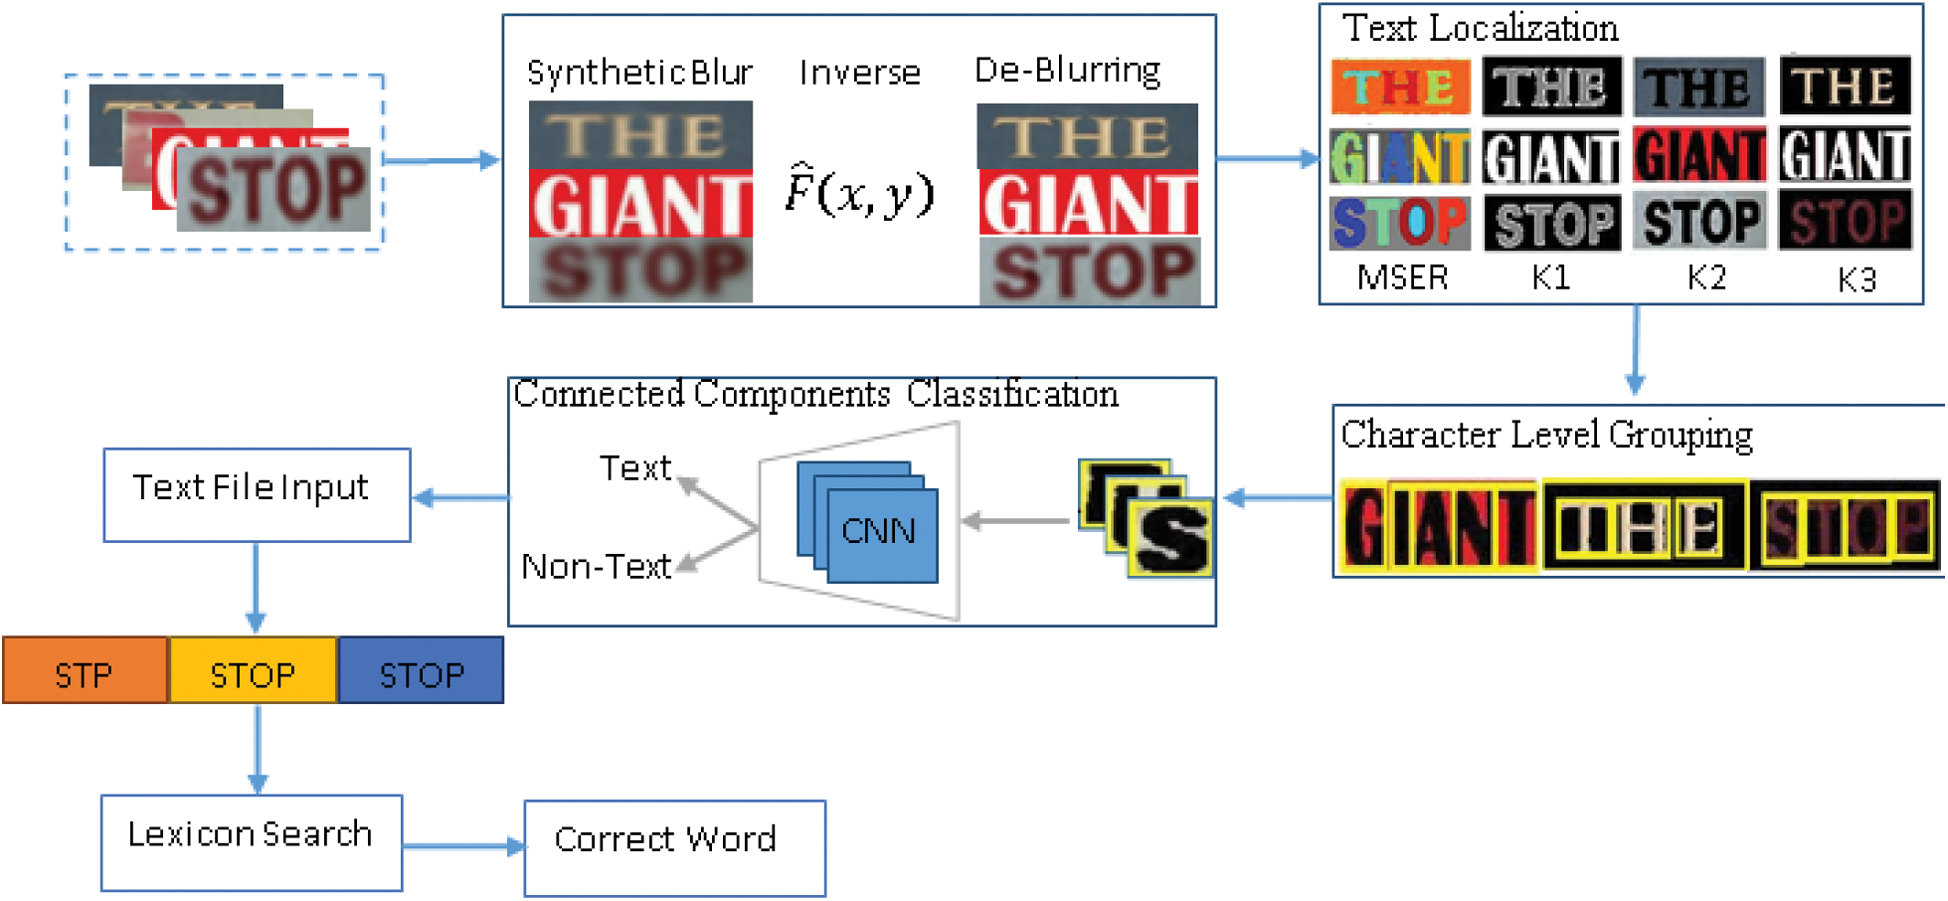
Figure 1: Proposed framework process
3.1 Blurring/Deblurring Process
Blurry dataset for natural scene text detection and recognition are currently not publically available for analysis purpose [29]. Therefore, in this paper, syntactic dataset was adopted and apply on natural scene text detection datasets. To begin with idea, the original image  is converted into blur image
  by using following generative model.

where,  represents additive noise and
  is known as two-dimensional blur kernel/PSF (Point Spread Function) in our case it is Gaussian kernel, and it is calculated using [30,31]:

where  and
and  represent horizontal and vertical distances from origin, and
  is known as standard deviation of Gaussian distribution in the paper value of sigma (
 ) to 1.76. Output of the stanstatic blure using Gaussian blure is presented in Fig. 2.

Figure 2: Degradation synthetic blur input image 
The next step is to reverse the synthetic blur process. For this purpose in this paper, the de-blurring is taken out in the frequency domain rather than in spatial domain via Fast Fourier Transform (FFT) and Inverse FFT. Wiener filter acts as a filtration function to restore the image into a clear image. Considering,  is blurry image; it can be converted into
  image by using the following Wiener filter process [32].


where,  is inverse process and estimation of
  computed from
  . The output of the de-blurring images is displayed in Fig. 3.

Figure 3: Recovered images after deblurring process
Text localization and detection is important part of any scene detection recognition proposes. In this paper, we have extended the standards MSER for text localization and detection from scenes it can be defined as [33]:
Enhanced Image  is a map
  . External region of an image is defined as if:
  is ordered as reflexive and transitive binary relation
  exists.in proposed work only
  is considered. Neighborhood relation
  is defined.
Region  is a contiguous subset of
  for each
  . For each there is a sequence
  .
.
Region Boundary  the boundary
  of
of  is the set of pixels that are adjacent to at least on pixel.
External Region  is a region such that
  and
and  the boundary
  is maximum intensity region.
Maximally Stable Extremal Regions (MSER): Let  be a sequence of nested external regions
  . External region
  is maximally stable if
  has a local minimum
  is a parameter of the method.
MSER algorithm that distinguishes the best-quality text candidates from stable areas that are extracted from different color channel images. Multi-resolution MSER gives better work to enormous scope changes and blurred images, which improves coordinating execution over large scale changes and for blurred images. To allow for detecting small letters in images of limited resolution, the complementary properties of canny edges and MSER are combined in our edge-enhanced MSER. In this paper, the K-means technique is extended before text detection to get more robust to distinct text from non-text for text detection. The output of MSER to K-means is shown in Fig. 4.
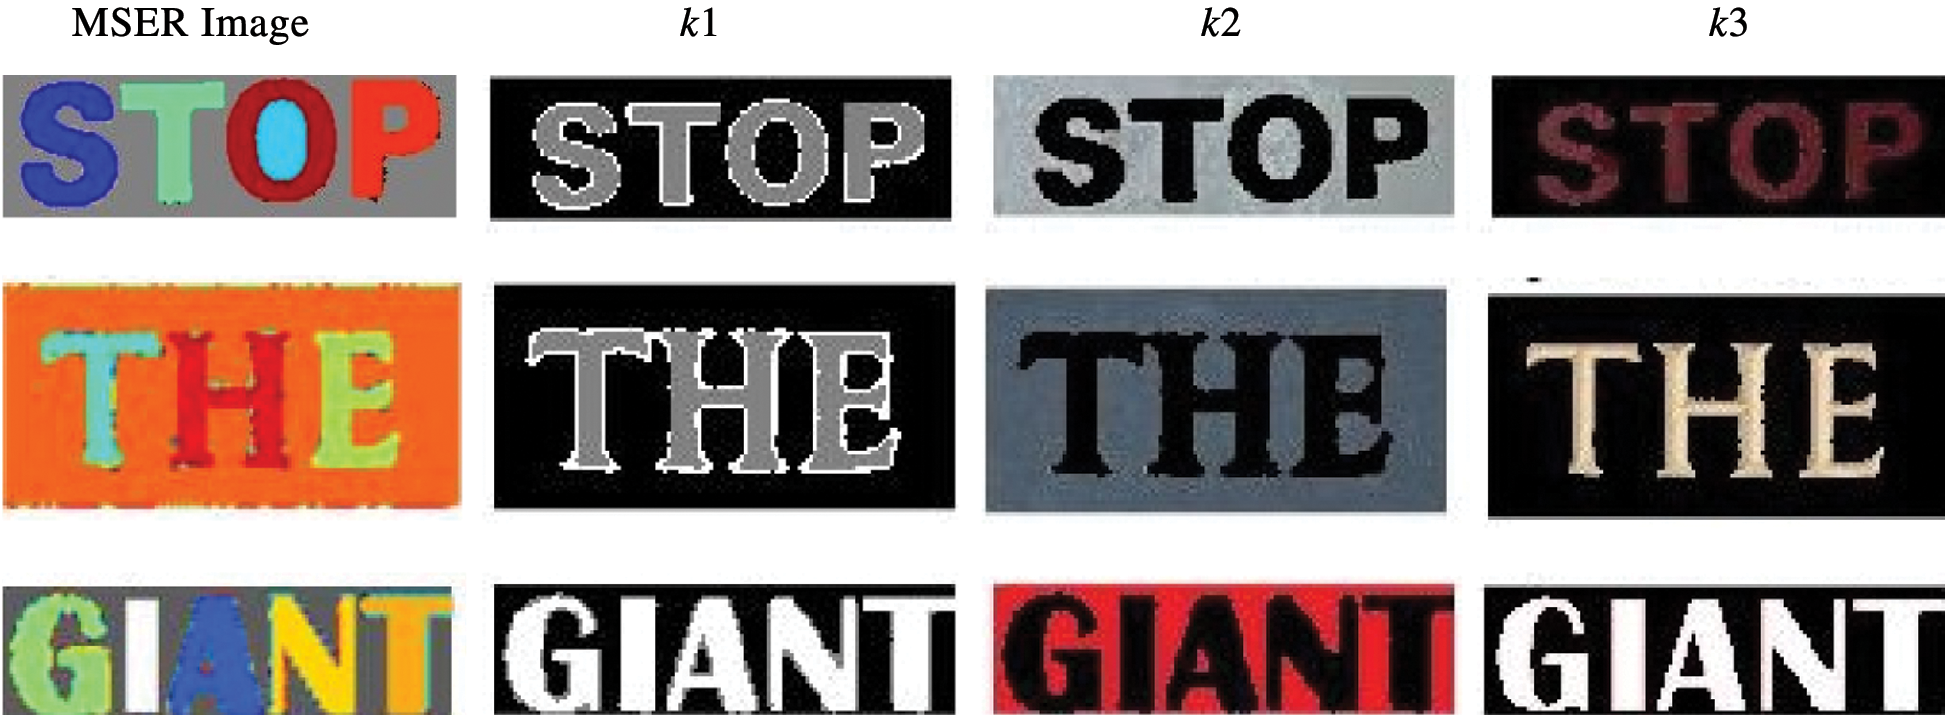
Figure 4: Separating foreground from background using K-means applied on the MSER images, where  is settled for obtaining clusters
In 2018 Yi et al. [34] have proposed a K-Means clustering for finding color of roadside replacement. They have used blur images, daylight or night time images, also images taken in bad weather, not bright or in the shadow. They have modified the images in LUV CIE color space. Inspired by this work, the proposed methodology employed to improve the quality of natural textual image. Since in many of scene text images we find blur which disrupts the character formation. Hence, in the proposed technique, K-Means seems to be the better choice not only to improve the image quality, but at the same time, it works fine for separating the foreground and background. K-Means converts the images into clusters based on colours. In the proposed methodology  is settled to 3 that is
  ,
,  and
and  . This approach is practical for text detection in the later stage.
3.3 Character Level Grouping and Text Detection
This section is based on the bounding box of detected characters from low-quality image. The standards are based on the geometric properties, which means widths (w1, w2) and heights (h1, h2) of bounding boxes will be considered for correct identification of the word. By definition of geometric properties, Eqs. (6), (7) and (8) are given as:


where,  will always be negative when two boxes correspond in
  direction. So they are well-suited and assumed as belonging to the same text. Hence, the explanation of character-bounding can easily be limited if conditions below are satisfied:


where,  , and
, and  are parameters for elements of character bounding. The third parameter
  is necessary for determining the group as character and non-character. A similar process is directed on all detected characters. Character bounding output is presented in Fig. 5 below:
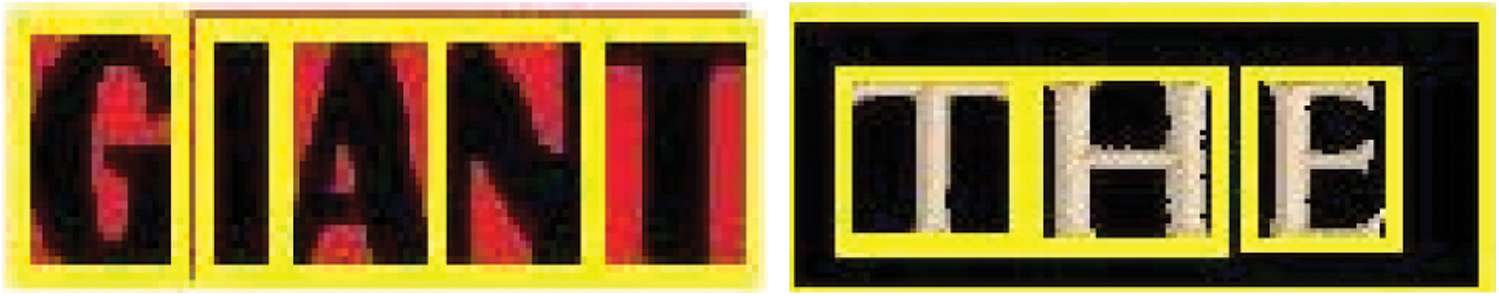
Figure 5: Character level grouping for different K-means images
3.4 Connected Components Classification Using CNN Framework
For straightforwardness, the primary function of this section is the classification of connected components in classes of text and non-text with labels (0/1). The main objective is to reduce FPR and eliminates FNR. Keeping the vague nature of images, a supervised CNN model with multi-layers is presented to obtain information of character, segmentation of character region, information of binary text and non-text. Additionally, precise features of textual data from low-level segmentation to high-level binary classification are found with the help of additional features. So the proposed model becomes powerful for understanding what, where and whether of character for taking advantage of formulating a consistent conclusion. Even though CNN is non-trivial because of information levels containing difficulties in learning and convergence rates. Hence, it proves to be suitable for sharing features. For N training examples represented by 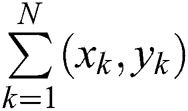 main goal of CNN is minimizing the following Eq. (12) and also make sure that
  is the image patch and
  is the label that maps to ‘0’ for non-text and ‘1’ for text.

where  in Eq. (12) is a function whose parameter is
  signifies loss function that is classically a soft-max loss for task of classification and least square loss for task of regression.
  and
and  work as learning rate and regularization, respectively, and shown in Eq. (13). The training procedure tries to implement binary classification, which finds a function of mapping to connect image patch as input with labels as output that is 0/1 lacking additional information.

Here  denotes the number of inputs,
  presents number of layers,
  is regularization parameter, and
  denotes weight matrix of
  layer. The primary goal is to recognize image patch
  containing label over the labels
  . The advantage of Eq. (12) is to avoid over fitting. Sometimes, during training process, the training error is reduced but testing error remains constant. Conversely, model is trained well but not produces expected results. So, regularization is a technique, which allows making specific changes in the learning algorithm such that the model generalized better and work fine on the unseen data. A stochastic gradient learning procedure is used to train a CNN model. A large number of CNN models have used this algorithm. The sequential optimization from the regression of low level to a binary classification of high level is the main feature of CNN model. This approach is more appropriate for identifying text and non-text components. So training of CNN model is done with the positive samples taken from Char74k, cropped images from ICDAR 2003, SVT and IIIT5K. Significant amount of distracters are also part of the training process.
The proposed model of CNN shown in Fig. 1 above as formulation used for binary classification. A series of image patches is used as input in the model, and every image is to be classified into text and non-text and labeled as ‘1’ for text or ‘0’ for non-text respectively. Two convolution layers with filters f1 and f2 are used by this network. The  and
and  filters are used to extract deep feature. A supervised learning process is used for training network by stochastic gradient descent of binary image patches with a given size of 26 × 26. A window size of
  is slide over the
  image patch in order to extract features to create input vectors
  where
where  . Multiple low-level filters
  are trained by Stochastic Gradient Descent (SGD). For each 11 × 11 patch
  , the first layer response
  is calculated by the implementation of an inner product with filter pool followed by scalar activation function:
  , where
  denotes hyper parameter. For 26 × 26 image patch,
  for every 11 × 11 window size is computed to get a response map of
  . Then, the reduction of response map up to
  is made by applying average pool. Same process is directed on second convolutional layer to get reduced response map of
  . Then, outputs are fully connected to classification layer. Training error is minimized with the help of back-propagating by applying SGD with an unchanged filter size throughout the classification process.
3.5 Text Correction after Recognition
In the proposed model presented in Fig. 1 every time, a character label is the output of the CNN model. The extracted labels are collected into a text file to a complete word and need to process for text correction. It is necessary because sometimes, CNN recognized the false label for a character, which might change the semantic meaning of the extracted text. Thus, the aim raised to recognize the correct scene text digitally, which can be further used in various IoT based applications. To tackle this issue, a hamming distance (an error correction technique) is used to correct the semantic meaning of scene text. It is defined as given below:
Given two vectors  and
and  , the hamming distance between
  and
and  is defined as
  to the number of places where
  and
and  differ. As per definition, it is clear that hamming distance is the number of bits changed in the observed string. The stored labels (complete word) in the text file are related to any natural scene text image for they are recognized. These labels are treated as a string for further processing. Therefore, the string is searched using the lexicon to calculate the Hamming distance. If the value of Hamming distance is 0, then it concludes that labels in the text file that are a complete word match with natural scene text. On the other hand, if hamming distance value results > 0, then it reflects that there exist false labels in the text, which do not match with the natural scene text. The hamming distance value also represents the total number of false recognized labels. In addition to this, the process also lists the optimized words which might have correct word scene text word. Finally, it clearly reflects that the proposed approach for scene text correction is very useful and worked effectively to generate correct scene text when few errors occur during recognizing and labelling in CNN.
In this section, proposed methodologies are evaluated based on various tests for their performance. The following sections discuss the experimental setup and implementation details, datasets description and evaluation metrics used in this context. Furthermore, comparisons of the results with existing benchmark techniques are the central part of this section. All the results are based on average calculations of the evaluation standards.
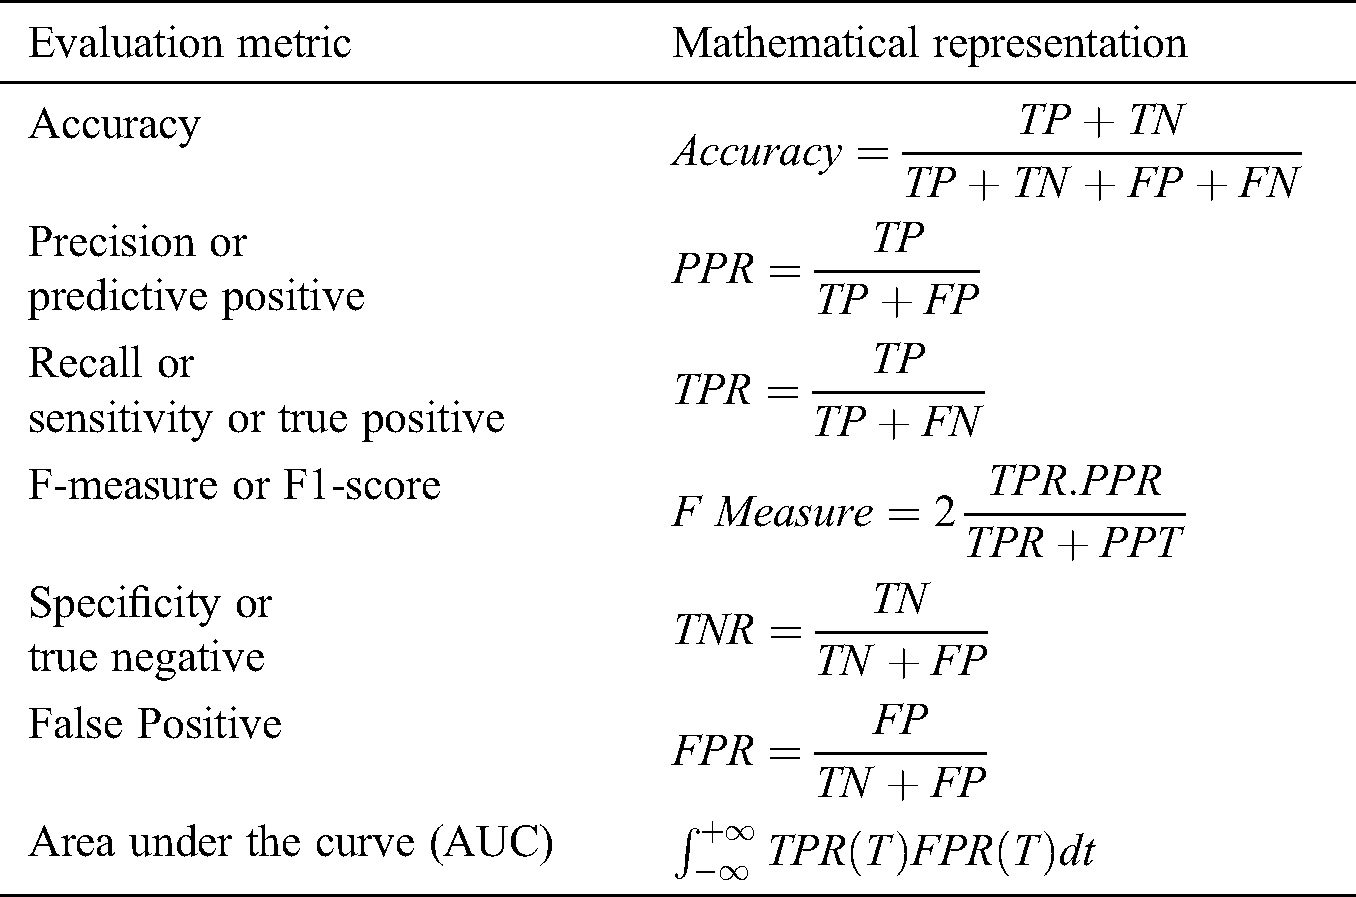
The following evaluation metrics are used in this study and are given in Tab. 1.
Table 1: Evaluation metrics for scene text detection and classification
The datasets evaluated in this study are the benchmark and publically available. These include ICDAR 2003, SVT, and IIIT5K. All datasets are challenging, which present text on the scene having different background scenic properties. Moreover, text also reflects various characteristics like random orientations, low contrast/resolution, blurry, hazy and arbitrary shapes and sizes. The descriptions of these datasets are given below:
• Chars 74K: The Chars 74k dataset is a collection of 7705 images comprised of English alphabetic characters, i.e., A to Z, 0 to 9 and a to z in Sixty-two (62) classes. Along with 647 classes of Kannada native language 3345 characters, which are segmented from 1922 scene text images manually [35].
• ICDAR 2003/2005: The ICDAR 2003 dataset was released for ICDAR 2003 Robust Reading Competition by Lucas et al. [36]. The same dataset with no change is used in the ICDAR 2005 Competition of Robust Reading. Therefore occasionally, the dataset is known as ICDAR 2005 [37]. It is a collection of 251 testing and 258 training character patches and word patches annotated by the bounded box and their text contents.
• SVT: The Street View Text dataset (SVT) was used explicitly for word spotting problems. This is a collection of 647 words from which 250 testing images (video frames) with the availability of bounding box locations and ground truth labels along with 100 training images (video frames). Also, the lexicon for each word is also available, and almost 50 words lexicon for each word is integrated. Each image is taken from Google Street View [38].
• IIIT5K: It is the biggest and most challenging dataset reported to date due to variation is font, color, layout, size and inclusion of noise, distortion, blur and varying illuminations. IIIT5K Word dataset [39] is a group of 5000 words collected from images found on the Internet, from which 3000 and 2000 words used to test and train subsets correspondingly.
4.3 Connected Components (CC) Classification Results Using Proposed CNN Framework
The classification of connected components is an important phase, which is done with the help of implemented CNN framework. For doing this, the classification is taken out with various distributions of the datasets into training and testing sets. Dataset is distributed with a ratio of 50–50, 60–40, 70–30 and 80–20 into training-testing samples. The results are computed on each dataset separately. The foremost objective is to test and monitor the classifier performance and also to overcome the false positives. It is observed that the classifier performance is improved gradually on all evaluation standards as an increase in the distribution samples. The reason is very simple that all deep learning algorithms are data-hungry algorithms. As a result, the model acts effectively for evaluation of unseen data.
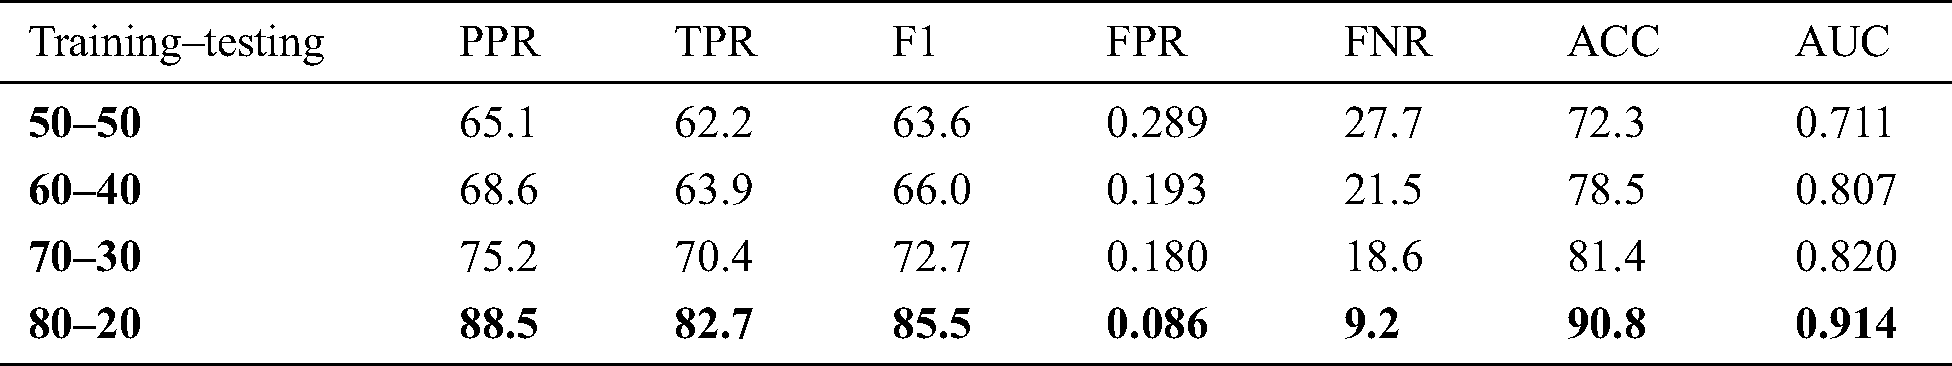
In Tab. 2, as per expectation, ICDAR 2003 attains 84.0% accuracy level with the highest distribution level that is 80–20. At the same time, significant improvement is also recorded to overcome false positive rate (FPR). The improvements in parameters advance at once, when a training sample is increased, which support the above notion. The other noteworthy factor is deduced, that increased training samples help to reduce FPR gradually. Also, false negative rate (FNR) is minimized, which improves the classifier accuracy gradually. In Tab. 3, SVT responses with the best accuracy level of 84.3%. However, significant improvement is gradually recorded in other parameters. The associated fact with SVT is that it is a complex dataset with almost a collection of all outdoor images. These images incorporate diversified scene text properties along with multiple sets of objects in the same image. On the other hand, IIIT5K performed well with the best result of accuracy level that is 90.8% shown in Tab. 4. This fact is unexpected because IIIT5K is the most tricky and challenging dataset reported till now. IIIT5K is a collection of images with variant illumination, low contrast/resolution, and random orientations. Despite these challenges, only 0.086% FPR is reported, showing the performance of proposed method that it works fine.
Table 2: Results of connected components classification on ICDAR 2003 dataset, where PPR denote positive predictive value, TPR denote true positive value, ACC denotes accuracy, and AUC denotes area under the curve
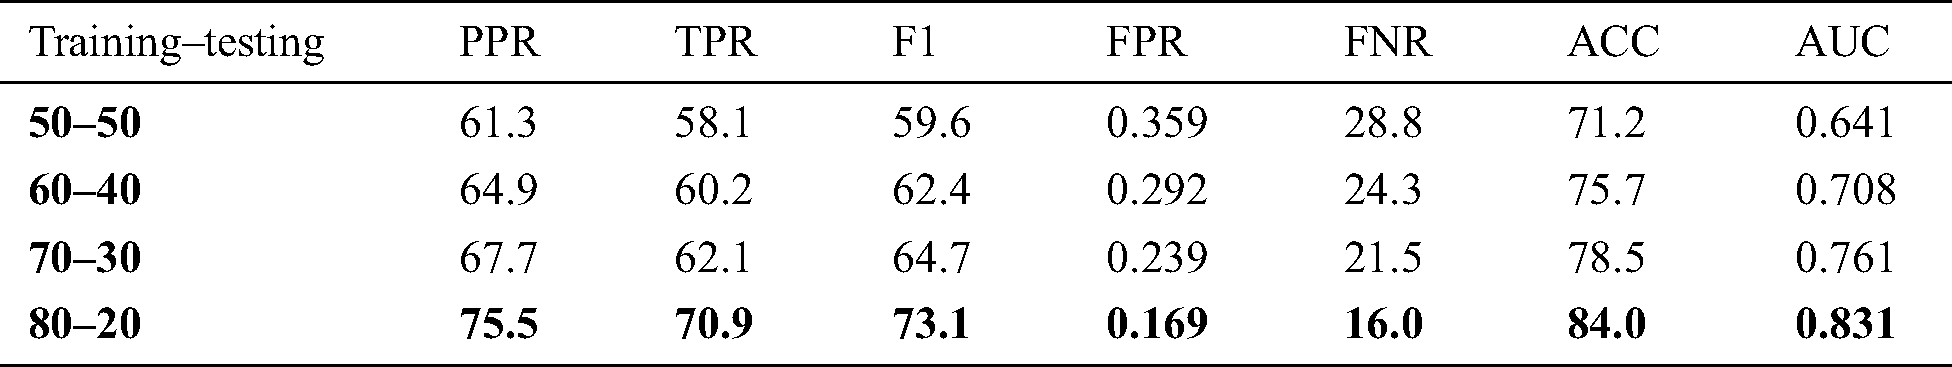
Table 3: Results of connected components classification on SVT dataset
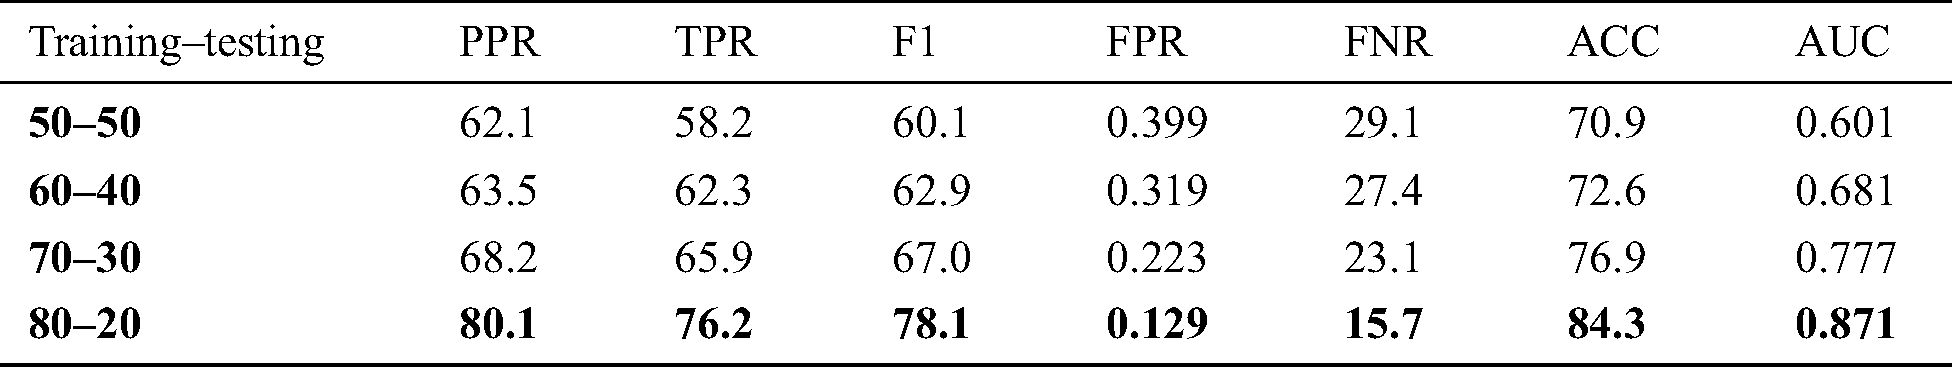
Table 4: Results of connected components classification on IIIT5K dataset
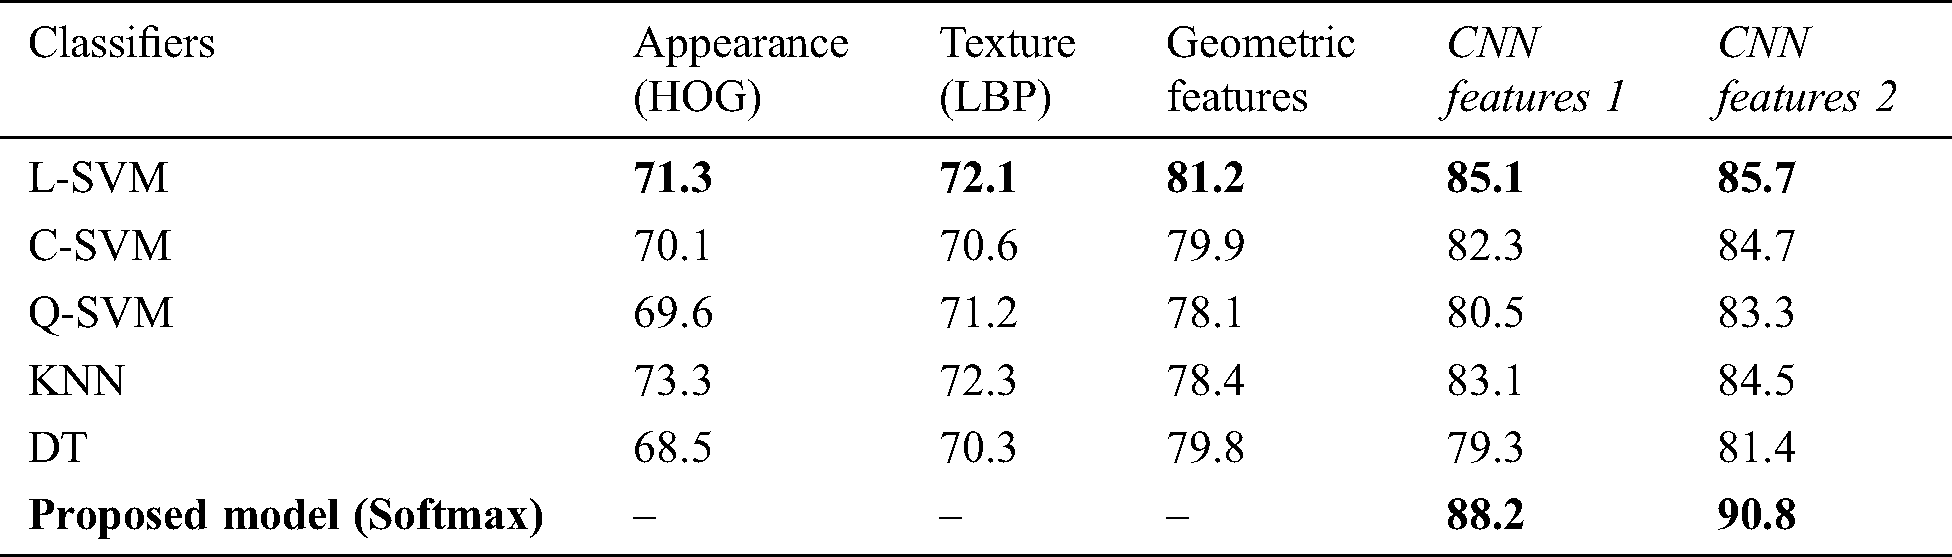
4.4 Connected Components (CC) Classification Using Deep and Separately Extracted Features
Taking a different scenario, the proposed technique is tested with separately extracted features on all selected mainstream datasets for connected component classifications. The purpose of this test is to present the legitimacy of the proposed technique, which extract deep features at two levels and then classify the connected components. The particular test (separately extracted features) is performed to visualize the classification process using support vector machine (SVM) and its variants (Linear-SVM, Cubic-SVM, and Quad-SVM) on extracted feature vector based on histogram oriented gradients (HOG), local binary patterns (LBP), and Geometric separately. Some other classifiers like Decision Tree (DT) and K-Nearest Neighbor (KNN) is also computed on the same set of features.
For this test, constant 80–20 sample distribution is adapted for all the competitive classifiers. Moreover, two levels of deep features maps after pooling layer 1 and pooling layer 2 named Deep Features 1 and Deep Features 2 is extracted for this, respectively. Both of these features sets are also fed to predetermined benchmark classifiers for monitoring their performance along with other separately extracted features. The results show that the pre-determined benchmark classifier works fine when compared to other extracted feature vectors. During this test, it is observed that Linear-SVM is the second good performer among all the other benchmark classifiers on all mainstream datasets. However, none of the classifiers beats the proposed technique at any level of deep features. Moreover, to avoid the biasness, each experiment is repeated ten times, and the mean score is reported in the Tabs. 5, and 7. In Tab. 5, the extracted Deep Features 1 and Deep Features 2 outperforms and gives 86.2% and 89.6% accuracy on ICDAR 2003, while SVT presented 84.9% and 85.3% accuracy on both levels of CNN features which is shown in Tab. 6. In Tab. 7, IIIT5K exhibits an accuracy level of 88.2% and 90.8% correspondingly. Henceforth, it is also confirmed that IIIT5K produced the best results on two levels of CNN features. Additionally, Tabs. 5, 6, and 7, clarify that all other benchmark classifiers also perform well on CNN features when compared to handcrafted features. Similarly, geometric features work fine and give intense competition to CNN features.
Table 5: Accuracy (%) results on ICDAR 2003 using separate feature extraction
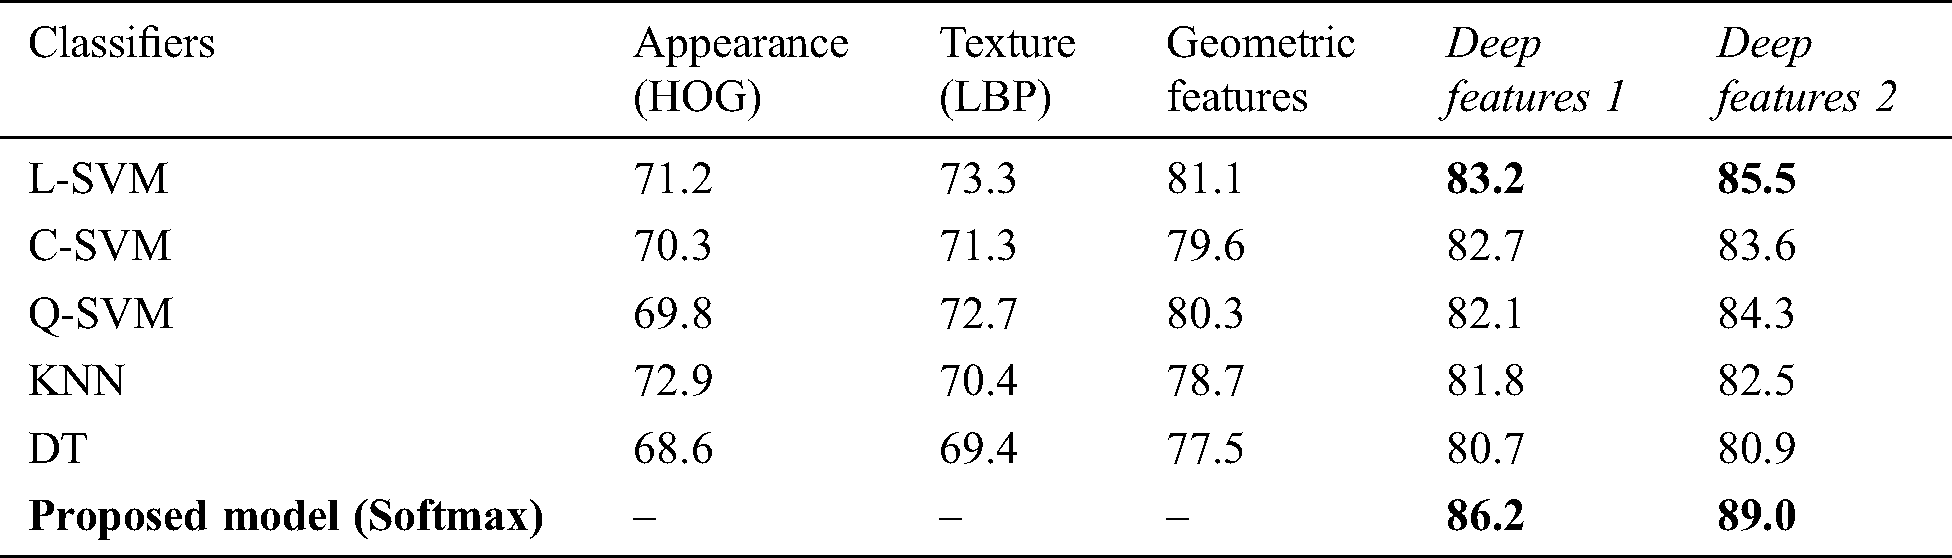
Table 6: Accuracy (%) results on SVT using separate feature extraction
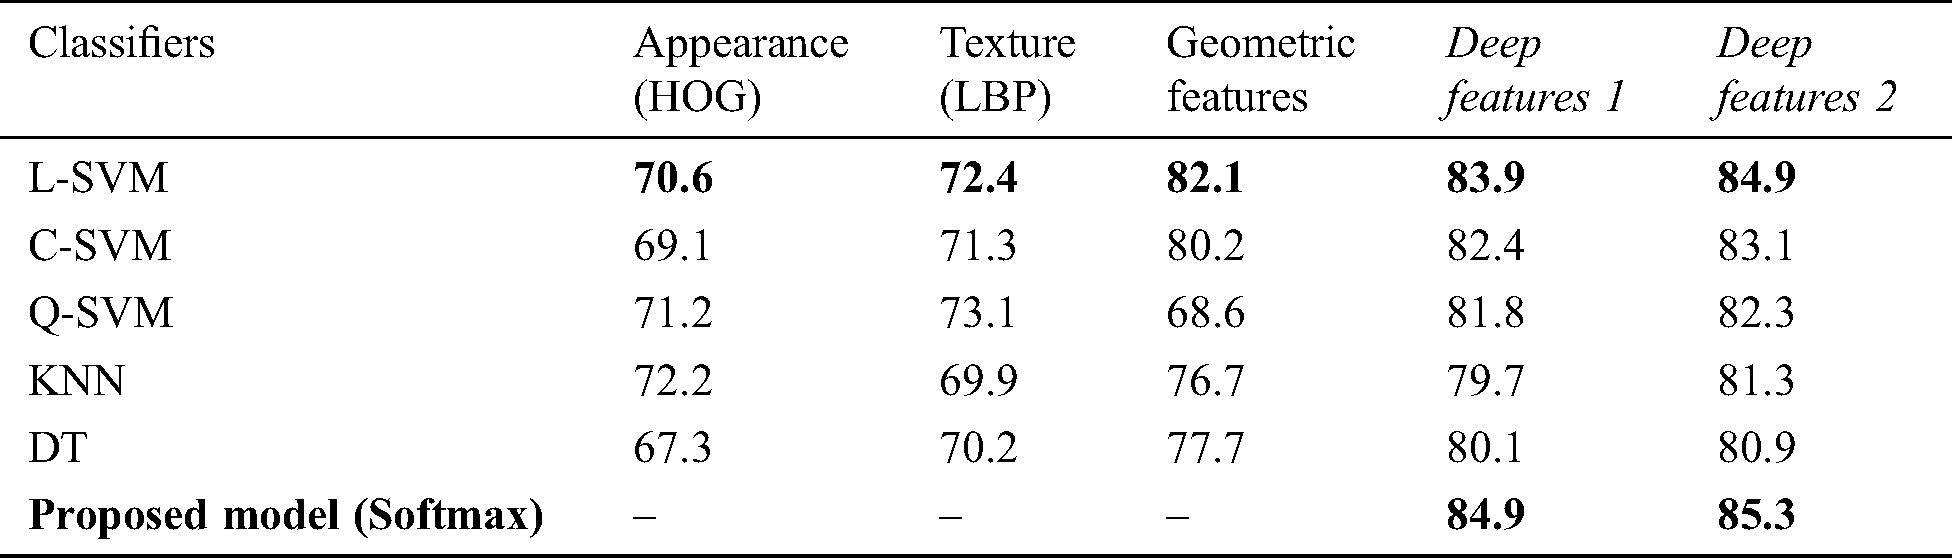
Table 7: Accuracy (%) results on IIIT5K using separate feature extraction
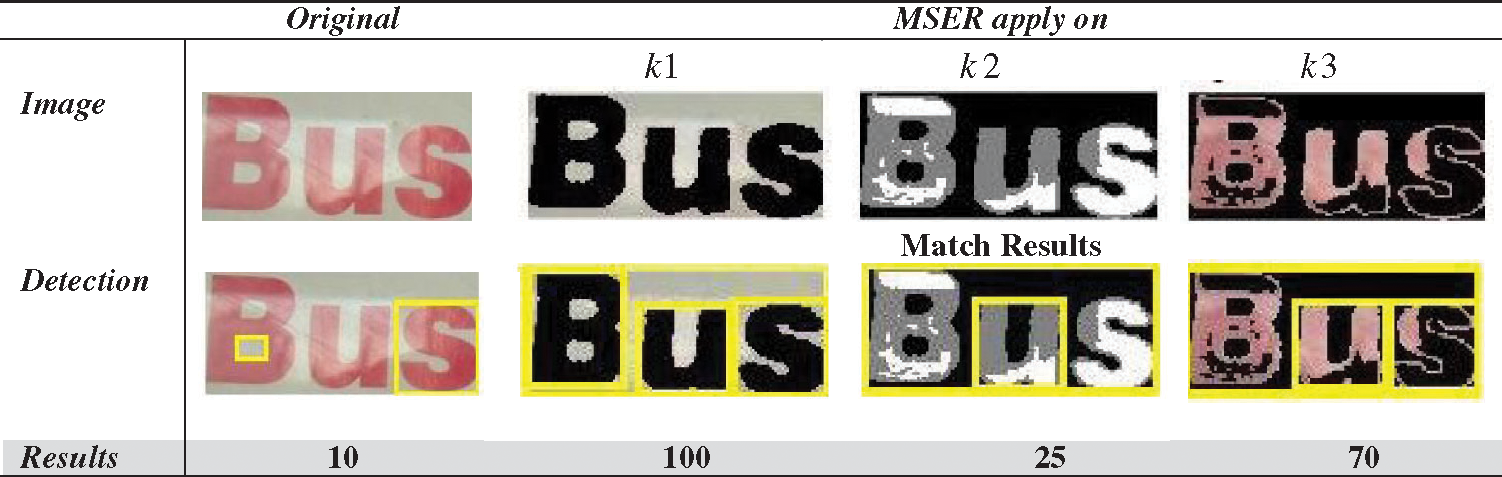
4.5 Comparison of Text Detection on Original Image and Clustered Image
The results in the above Tab. 7 that the detection of characters becomes easy after applying K-Means on images. In most of the images, MSER cannot detect all characters, but after applying clustering on the images, MSER detects characters without false positive values. The best results can be obtained using  clustered images. However, in some cases, both
  and
and  gave perfect results for detection. Therefore, it can be concluded that
  gives the best results while using
  and
and  MSER can detect some characters only. It is also evident that detection becomes easier after applying clustering on images. In the Tab. 8 below, MSER works better on clustered images as compared to original images.
Table 8: k-means based MSER character detection results
4.6 Comparison of Proposed Text Extraction Method with Existing Benchmark Technologies
To check eminence of proposed method, it is compared with existing benchmark methods proposed by different researchers in recent times. However, it is also a challenging process due to the heterogeneous nature of datasets, parameters, and natural scene text characteristics. Cater to these challenges, the commonalities are spotted in the evaluation metrics. The most common parameters used in this regard are positive predicted rate (PPR), true positive rate (TPR) and F1 score. The results are obtained on three benchmark datasets and organized in Tab. 9, which shows comparison results on ICDAR 2003, SVT and IIIT5K. This table worth mentioning comparisons of the proposed methodology with other benchmark techniques in the same domain with the same set of datasets. It is noticeable from Tab. 9 that few techniques are found to employ IIIT5K datasets for text extraction. The reason is IIIT5K is very challenging due to font size variation, color, layout, distortion occurrence, varying illumination, blur and noise. However, the proposed methodology produced PPR 0.85%, TPR 0.77% and F1 0.80% for IIIT5K. On widely used SVT complex dataset, this demonstrates high variability of outdoor scene text images. The proposed methodology remarkably performs by attaining the PPR 0.84%, TPR 0.76% and F1 0.80%. Similarly, for other datasets such ICDAR 2003, the proposed technique outperforms with values of PPR 0.85%, TPR 0.77% and F1 0.81%.
Table 9: (%) Results of proposed text extraction method with benchmark existing methods on ICDAR 2003, SVT and IIIT5K
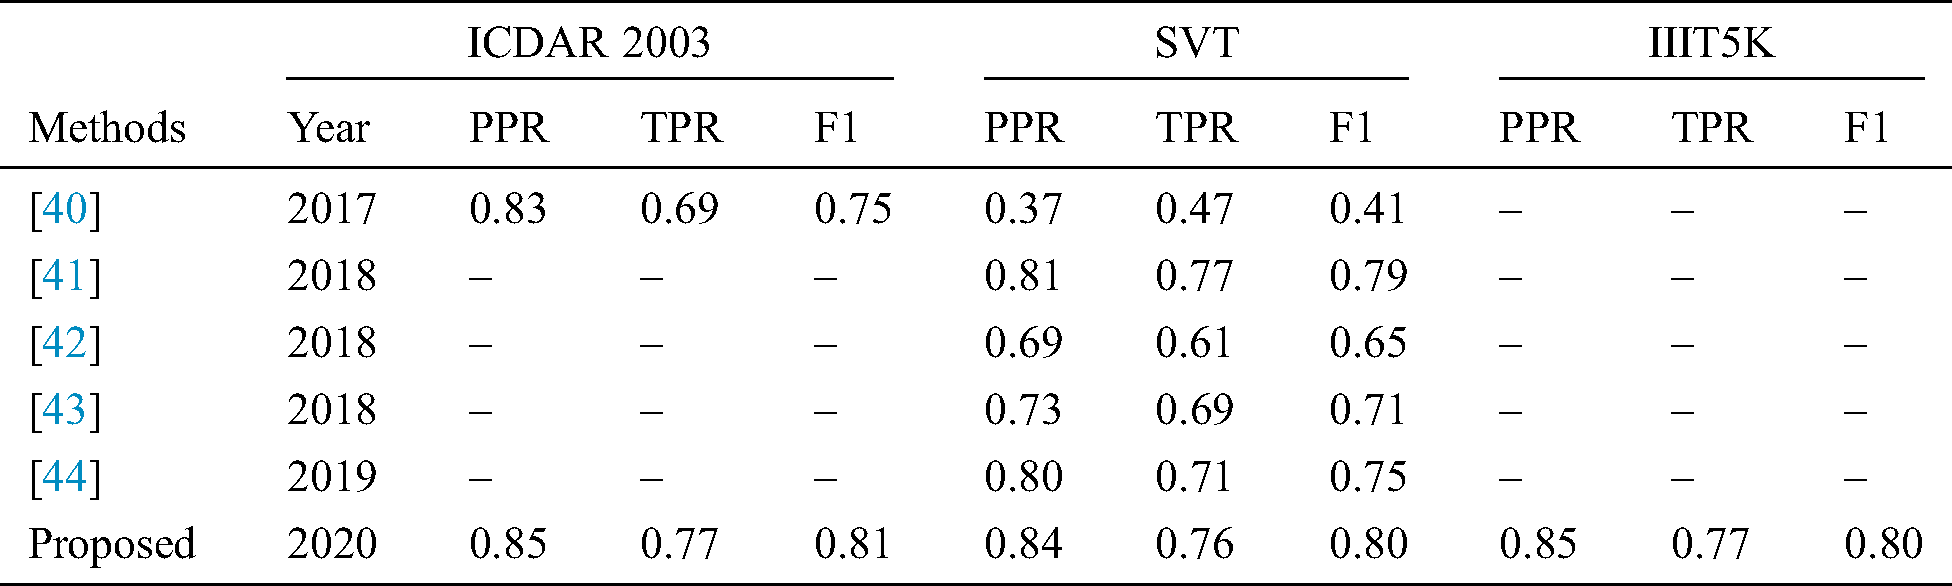
From the above-mentioned results, It is obvious that the proposed technique works fine and is more stable on the mainstream datasets when compared to other benchmark counterparts in terms of F1.
In this paper, a state-of-the-art technique to extract text from low quality natural scene images is presented. The query image is synthetically blurred using averaging filter. Further L*a*b color space is adapted for enhancing contrast followed by deblurring of images, where wiener filter is utilized as filtration function. Then MSER is applied for localizing and detecting text regions, while non-text areas are discarded with geometric properties. K-Means clustering is applied for better separation of foreground from background and it also has less false positive rate. In this process,  is settled to 3. Therefore, it can be seen that
  and
and  gives the best results for text detection, but
  can detect only some characters. This problem can also be solved in future work by using SWT technique on
  images to improve the results. The classification results are obtained on various distributions of training and testing sets. Furthermore, a different scenario that is separately extracted features and CNN features is also adapted to monitor the credibility of the CNN model. It is concluded that the proposed methodology works fine and responds well to all types of tests. Finally, it is observed that the proposed work outperforms in detecting text when compared with previous models in the same domain.
Acknowledgement: HITEC University Taxila
Funding Statement: This research was supported by the MSIT(Ministry of Science and ICT), Korea, under the ICAN(ICT Challenge and Advanced Network of HRD) program(IITP-2020-0-01832) supervised by the IITP (Institute of Information & Communications Technology Planning & Evaluation) and the Soonchunhyang University Research Fund.
Conflicts of Interest: The authors declare that they have no conflicts of interest to report regarding the present study.
1. H. Arshad, M. A. Khan, M. I. Sharif, M. Yasmin, J. M. R. S. Tavares et al. (2020). , “A multilevel paradigm for deep convolutional neural network features selection with an application to human gait recognition,” Expert Systems, vol. 21, no. 3, pp. e12541. [Google Scholar]
2. M. I. Sharif, J. P. Li, M. A. Khan and M. A. Saleem. (2020). “Active deep neural network features selection for segmentation and recognition of brain tumors using MRI images,” Pattern Recognition Letters, vol. 129, pp. 181–189. [Google Scholar]
3. M. Rashid, M. A. Khan, M. Alhaisoni, S. H. Wang and S. R. Naqvi. (2020). “A sustainable deep learning framework for object recognition using multi-layers deep features fusion and selection,” Sustainability, vol. 12, no. 12, pp. 5037. [Google Scholar]
4. D. Karatzas, L. Gomez-Bigorda, A. Nicolaou, S. Ghosh, A. Bagdanov et al. (2015). , “ICDAR 2015 competition on robust reading,” in 2015 13th Int. Conf. on Document Analysis and Recognition, Tunis, Tunisia, pp. 1156–1160. [Google Scholar]
5. D. Karatzas, F. Shafait, S. Uchida, M. Iwamura, L. G. i Bigorda et al. (2013). , “ICDAR 2013 robust reading competition,” in 2013 12th Int. Conf. on Document Analysis and Recognition, Washington, DC, USA, pp. 1484–1493. [Google Scholar]
6. A. Shahab, F. Shafait and A. Dengel. (2011). “ICDAR, 2011 robust reading competition challenge 2: Reading text in scene images,” in 2011 Int. Conf. on Document Analysis and Recognition, Beijing, China, pp. 1491–1496. [Google Scholar]
7. M. E. Maros, C. G. Cho, A. G. Junge, B. Kämpgen, V. Saase et al. (2020). , “Comparative analysis of machine learning algorithms for computer-assisted reporting based on fully automated cross-lingual RadLex® mappings,”. [Google Scholar]
8. Y. Liu, C. Yang, L. Jiang, S. Xie and Y. Zhang. (2019). “Intelligent edge computing for IoT-based energy management in smart cities,” IEEE Network, vol. 33, no. 2, pp. 111–117. [Google Scholar]
9. R. S. Alonso, I. Sittón-Candanedo, Ó García, J. Prieto and S. Rodríguez-González. (2020). “An intelligent edge-IoT platform for monitoring livestock and crops in a dairy farming scenario,” Ad Hoc Networks, vol. 98, pp. 102047. [Google Scholar]
10. P. Lyu, C. Yao, W. Wu, S. Yan and X. Bai. (2018). “Multi-oriented scene text detection via corner localization and region segmentation,” in Proc. of the IEEE Conf. on Computer Vision and Pattern Recognition, Beijing, China, pp. 7553–7563. [Google Scholar]
11. M. A. Khan, K. Javed, S. A. Khan, T. Saba, U. Habib et al. (2020). , “Human action recognition using fusion of multiview and deep features: An application to video surveillance,” Multimedia Tools and Applications, vol. 10, pp. 335. [Google Scholar]
12. A. Majid, M. A. Khan, M. Yasmin, A. Rehman, A. Yousafzai et al. (2020). , “Classification of stomach infections: A paradigm of convolutional neural network along with classical features fusion and selection,” Microscopy Research and Technique, vol. 83, no. 5, pp. 562–576. [Google Scholar]
13. M. A. Khan, M. A. Khan, F. Ahmed, M. Mittal, L. M. Goyal et al. (2020). , “Gastrointestinal diseases segmentation and classification based on duo-deep architectures,” Pattern Recognition Letters, vol. 131, pp. 193–204. [Google Scholar]
14. F. E. Batool, M. Attique, M. Sharif, K. Javed, M. Nazir et al. (2020). , “Offline signature verification system: A novel technique of fusion of GLCM and geometric features using SVM,” Multimedia Tools and Applications, pp. 1–20. [Google Scholar]
15. T. Akram, M. Sharif and T. Saba. (2020). “Fruits diseases classification: Exploiting a hierarchical framework for deep features fusion and selection,” Multimedia Tools and Applications, pp. 1–21. [Google Scholar]
16. A. Adeel, M. A. Khan, T. Akram, A. Sharif, M. Yasmin et al. (2020). , “Entropy‐controlled deep features selection framework for grape leaf diseases recognition,” Expert Systems, vol. 1, no. 1, pp. 1. [Google Scholar]
17. Q. Yang, M. Cheng, W. Zhou, Y. Chen, M. Qiu et al. (2018). , “Inceptext: A new inception-text module with deformable psroi pooling for multi-oriented scene text detection,” arXiv preprint arXiv: 1805. 01167. [Google Scholar]
18. M. S. Das, B. H. Bindhu and A. Govardhan. (2012). “Evaluation of text detection and localization methods in natural images,” International Journal of Emerging Technology and Advanced Engineering, vol. 2, no. 6, pp. 277–282. [Google Scholar]
19. J. Matas, O. Chum, M. Urban and T. Pajdla. (2004). “Robust wide-baseline stereo from maximally stable extremal regions,” Image and Vision Computing, vol. 22, no. 10, pp. 761–767. [Google Scholar]
20. A. Criminisi, P. Pérez and K. Toyama. (2004). “Region filling and object removal by exemplar-based image inpainting,” IEEE Transactions on Image Processing, vol. 13, no. 9, pp. 1200–1212. [Google Scholar]
21. S. Zhao, Y. Wang and Y. Wang. (2007). “Extracting hand vein patterns from low-quality images: A new biometric technique using low-cost devices,” in Fourth Int. Conf. on Image and Graphics, Sichuan, China, pp. 667–671. [Google Scholar]
22. D. J. Ittner, D. D. Lewis and D. D. Ahn. (1995). “Text categorization of low quality images,” in Sym. on Document Analysis and Information Retrieval, pp. 301–315. [Google Scholar]
23. K. Iqbal, M. Odetayo, A. James, R. A. Salam and A. Z. H. Talib. (2010). “Enhancing the low quality images using unsupervised colour correction method,” in 2010 IEEE Int. Conf. on Systems, Man and Cybernetics, Istanbul, Turkey, pp. 1703–1709. [Google Scholar]
24. S. Rudrani and S. Das. (2011). “Face recognition on low quality surveillance images, by compensating degradation,” in Int. Conf. Image Analysis and Recognition, Berlin, Heidelberg: Springer, pp. 212–221. [Google Scholar]
25. N. Neverova, D. Muselet and A. Trémeau. (2012). “Lighting estimation in indoor environments from low-quality images,” in European Conf. on Computer Vision, Berlin, Heidelberg: Springer, pp. 380–389. [Google Scholar]
26. V. T. H. Tuyet and N. T. Binh. (2016). “Edge detection in low quality medical images,” in Int. Conf. on Nature of Computation and Communication, Cham: Springer, pp. 351–362. [Google Scholar]
27. C. Zhu, T. H. Li and G. Li. (2017). “Towards automatic wild animal detection in low quality camera-trap images using two-channeled perceiving residual pyramid networks,” in Proc. of the IEEE Int. Conf. on Computer Vision Workshops, Sichuan, China, pp. 2860–2864. [Google Scholar]
28. M. S. Al-Shemarry, Y. Li and S. Abdulla. (2018). “Ensemble of adaboost cascades of 3L-LBPs classifiers for license plates detection with low quality images,” Expert Systems with Applications, vol. 92, pp. 216–235. [Google Scholar]
29. G. J. Ansari, J. H. Shah, M. Sharif and S. ur Rehman. (2019). “A novel approach for scene text extraction from synthesized hazy natural images,” Pattern Analysis and Applications, vol. 23, no. 3, pp. 1–18. [Google Scholar]
30. J. Kostková, J. Flusser, M. Lébl and M. Pedone. (2019). “Image invariants to anisotropic Gaussian blur,” in Scandinavian Conf. on Image Analysis, Cham: Springer, pp. 140–151. [Google Scholar]
31. D. P. P. Mesquita, Jão P. P. Gomes, F. Corona, A. H. Souza Junior, J. A. S. Nobre et al. (2019). , “Gaussian kernels for incomplete data,” Applied Soft Computing, vol. 77, pp. 356–365. [Google Scholar]
32. P. K. Rana and D. Jhanwar. (2019). “Image deblurring methodology using wiener filter & genetic algorithm,” International Journal of Advanced Engineering Research and Science, vol. 6, no. 9, pp. 1–18. [Google Scholar]
33. H. Chen, S. S. Tsai, G. Schroth, D. M. Chen, R. Grzeszczuk et al. (2011). , “Robust text detection in natural images with edge-enhanced maximally stable extremal regions,” in 2011 18th IEEE Int. Conf. on Image Processing, Brussels, Belgium, pp. 2609–2612. [Google Scholar]
34. Q. Yi, D. Shen, J. Lin and S. Chien. (2018). “The color specification of surrogate roadside objects for the performance evaluation of roadway departure mitigation systems,” SAE Technical Paper, 01–0506. [Google Scholar]
35. T. de Campos, B. R. Babu and M. Varma. (2009). “Character recognition in natural images,” VISAPP, vol. 2, no. 7, pp. 23–38. [Google Scholar]
36. S. M. Lucas, A. Panaretos, L. Sosa, A. Tang, S. Wong et al. (2003). , “ICDAR 2003 robust reading competitions”, in Seventh Int. Conf. on Document Analysis and Recognition, Brussels, Belgium, pp. 682–687. [Google Scholar]
37. S. M. Lucas. (2005). “ICDAR, 2005 text locating competition results,” in Eighth Int. Conf. on Document Analysis and Recognition, Seoul, South Korea, pp. 80–84. [Google Scholar]
38. K. Wang, B. Babenko and S. Belongie. (2011). “End-to-end scene text recognition,” in 2011 Int. Conf. on Computer Vision, Barcelona, Spain: IEEE, pp. 1457–1464. [Google Scholar]
39. B. Shi, X. Bai and C. Yao. (2016). “An end-to-end trainable neural network for image-based sequence recognition and its application to scene text recognition,” IEEE Transactions on Pattern Analysis and Machine Intelligence, vol. 39, no. 7, pp. 2298–2304. [Google Scholar]
40. Y. Wang, C. Shi, B. Xiao, C. Wang and C. Qi. (2018). “CRF based text detection for natural scene images using convolutional neural network and context information,” Neurocomputing, vol. 295, pp. 46–58.
41. K. Fan and S. J. Baek. (2018). “A robust proposal generation method for text lines in natural scene images,” Neurocomputing, vol. 304, pp. 47–63.
42. S. Huang, D. Wu, Y. Yang and H. Zhu. (2018). “Image dehazing based on robust sparse representation,” IEEE Access, vol. 6, pp. 53907–53917.
43. S. Salazar-Colores, I. Cruz-Aceves and J. M. Ramos-Arreguin. (2018). “Single image dehazing using a multilayer perceptron,” Journal of Electronic Imaging, vol. 27, no. 4, 043022.
44. R. Minetto, N. Thome, M. Cord, N. J. Leite and J. Stolfi. (2014). “SnooperText: A text detection system for automatic indexing of urban scenes,” Computer Vision and Image Understanding, vol. 122, pp. 92–104.
 | This work is licensed under a Creative Commons Attribution 4.0 International License, which permits unrestricted use, distribution, and reproduction in any medium, provided the original work is properly cited. |