
 Submit a Paper
 Propose a Special lssue
 Open Access
ARTICLE
Numerical Investigation on Thermal Performance of Single-Phase Immersion Cooling Systems Using Oil Coolant
1 Huadong Engineering Corporation Limited, Power Construction Corporation of China, Hangzhou, 310014, China
2 Institute of Refrigeration and Cryogenics, Zhejiang University, Hangzhou, 310027, China
3 Zhejiang Key Laboratory of Clean Energy and Carbon Neutrality, Hangzhou, 310027, China
* Corresponding Author: Ruisheng Liang. Email:
(This article belongs to the Special Issue: Fluid Flow, Heat and Mass Transfer within Novel Cooling Structures)
Frontiers in Heat and Mass Transfer 2025, 23(1), 279-298. https://doi.org/10.32604/fhmt.2025.059637
Received 13 October 2024; Accepted 02 December 2024; Issue published 26 February 2025
 View Full Text
 Download PDF
Abstract
Data center cooling systems are substantial energy consumers, and managing the heat generated by electronic devices is becoming more complex as chip power levels continue to rise. The single-phase immersion cooling (SPIC) server with oil coolant is numerically investigated using the validated Re-Normalization Group (RNG) k-ε model. For the investigated scenarios where coolant velocity at the tank inlet is 0.004 m/s and the total power is 740 W, the heat transfer between the heat sinks and the coolant is dominated by natural convection, although forced convection mediates the overall heat transfer inside the tank. The maximum velocity of coolant through the heat sink is 0.035 m/s and the average heat transfer coefficient is up to 75.8 W/(m2·K). The geometry of the heat sink is important for the cooling performance. Increasing both the fin thickness and number enhances the natural convection effect of the heat sink, but also increases the flow resistance. The heat sink with a fin thickness of 3 mm performs the best, reducing the average graphics processing unit (GPU) temperature from 71.3°C to 68.6°C. A heat sink with an optimal fin number of 16 reduces the average GPU temperature to 67.7°C. As for the effect of fin height, increasing it from 15 to 30 mm results in increases in the heat transfer area and flow rate by about 72% and 32%, respectively, which reduces the average GPU temperature to 65.2°C. Therefore, the importance of fin parameters ranks in the following order: fin height, number, and thickness. This study highlights the potential application of oil coolants in SPIC systems and offers theoretical guidance for the efficient design of natural convection cooling solutions.Keywords
Technologies like the Internet of Things, 5G, and automation have significantly contributed to the growing energy demands of data centers. By 2030, communication technologies are projected to account for approximately 20% of global electricity consumption [1], with cooling systems contributing nearly 30%–50% of total power usage in data centers [2,3]. Therefore, developing efficient and reliable heat dissipation technologies is a key research area for improving data center energy efficiency.
Data center cooling methods include air cooling [4], heat pipe cooling [5], and liquid cooling [6]. Traditional air-cooling systems are characterized by high energy consumption and low efficiency, making them inadequate for data centers aiming to meet carbon neutrality and peak carbon goals. Besides, its thermal performance makes it difficult to meet increasingly higher chip powers. Heat pipes have limitations for cooling the entire system, which can only effectively dissipate localized heat [7]. In this context, liquid cooling methods have gained widespread attention through indirect (cold plates) or direct contact (immersion cooling). Parida et al. [8] experimentally compared traditional air-cooled servers with liquid-cooled plates. The findings indicate that liquid-cooled plates can lower cooling energy consumption by more than 90% when compared to air-cooling. The coolants employed in cold plates are typically electrically conductive, which presents a leakage risk that could potentially harm electronic components. In contrast, immersion cooling offers good reliability and improves server efficiency.
The current body of literature categorizes immersion cooling technology into two types: single-phase immersion cooling (SPIC) [9–13] and two-phase immersion cooling (TPIC) [14–18], depending on whether the coolant undergoes boiling. Kanbur et al. [19] experimentally analyzed SPIC and TPIC system performance, showing that TPIC systems’ performance trend coefficient is 72%–79% higher than that of SPIC systems. Due to the more complex maintenance, design, and cost challenges of TPIC systems, SPIC systems have a higher potential for large-scale application [20,21]. Chen et al. [22] proposed a figure of merit (FOM) to evaluate the thermal performance impact of different electronic fluorinated liquids (EFLs) on SPIC systems. Results indicated that low dynamic viscosity EFLs in SPIC systems can increase the Nusselt number by 57.3% and reduce the pressure drop by 59%. Recent studies have also explored nanofluid behaviors in the context of heat transfer applications [23]. Wen et al. [24] conducted a numerical study on five different nanofluids using FC-40 as the base fluid in an SPILC system. Their results demonstrated that the Al-FC-40 nanofluid exhibited the highest overall heat transfer performance and the lowest friction factor. Jithin et al. [25] numerically investigated the cooling performance of various coolants in a SPIC system and demonstrated that the viscosity of deionized water is lower than that of mineral oil and fluorinated liquids, reducing the temperature rise of electronic equipment by 74.4% and 69.4%, respectively. Shrigondekar et al. [26] experimentally analyzed the performance of various inlet and outlet structures in an SPILC system. Their conclusions indicated that a T-type SPILC system using FC-40 coolant performs better than a Z-type configuration, with a 12.6% reduction in thermal resistance.
Comprehensive studies on SPIC systems cover aspects such as coolants [27–29], operating conditions [30], operational parameters [31–33], and performance enhancement [34–37]. Currently, coolant research mainly focuses on electronic fluorinated liquids. However, electronic fluorinated liquids pose serious environmental hazards and are expensive. In contrast, the affordability and stability of oil-based coolants make them a promising option for the widespread adoption of immersion cooling. However, research on oil coolant-based SPIC systems remains limited at present. Moreover, flow rates are low in a typical SPIC-cooled server. Given the low Reynolds number flow, it is crucial to assess whether heat transfer is primarily governed by natural convection, forced convection, or a combination of both (mixed convection). Mixed convection typically occurs in systems with very low coolant flow rates [38]. In this type of flow, buoyancy has a significant effect on flow behavior and heat transfer rates. Therefore, the effect of low flow rates on flow and heat transfer in SPIC systems needs to be further refined. To address these issues, this study investigates flow and heat transfer mechanisms in a SPIC system using oil coolant. A three-dimensional model of a server using oil coolant is developed. The study primarily focuses on examining the effects of oil coolant on the SPIC system. Additionally, it delves into the impact of heat sink structural parameters on the cooling efficiency of oil, offering valuable insights to support the practical operation of SPIC systems in engineering applications.
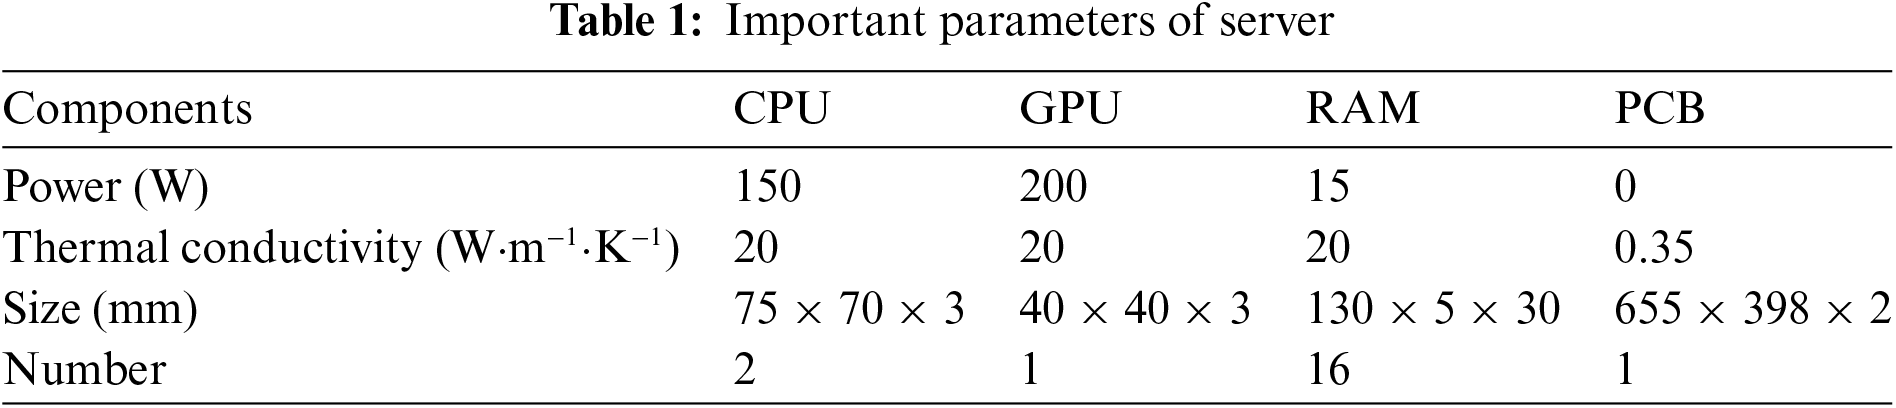
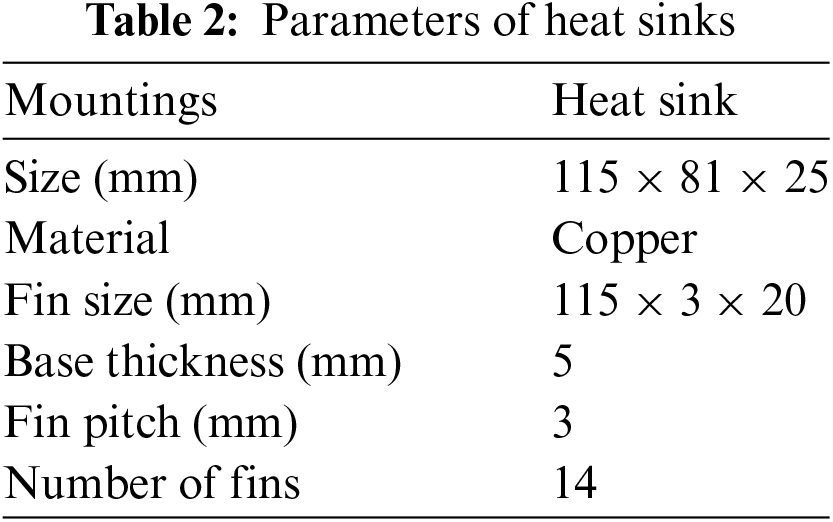
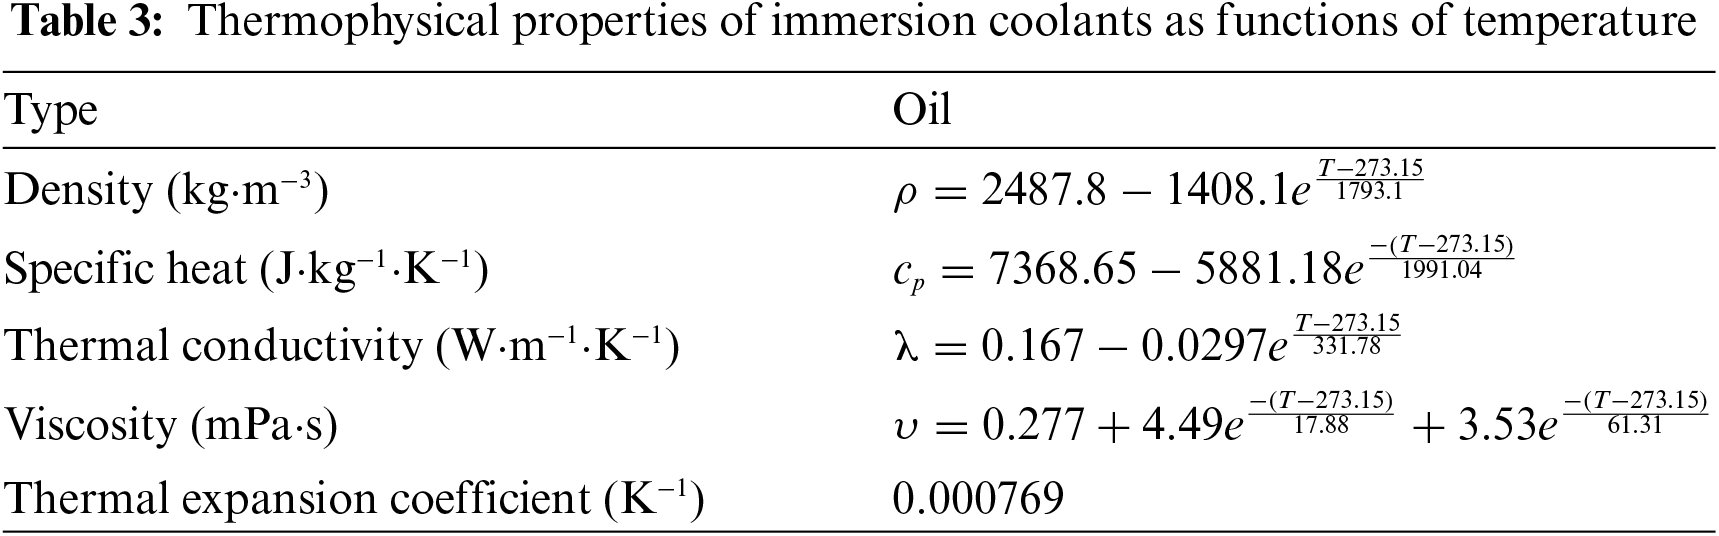
A simplified server as illustrated in Fig. 1 is adopted to investigate the performance of a SPIC system using oil coolant. The system includes CPU, GPU, RAM, and PCB, with the CPU and GPU requiring heat sinks for effective heat dissipation due to their high power consumption and limited surface area. Table 1 lists the relevant parameters of the heat sinks. The computational domain has dimensions of 815 mm (z) × 408 mm (y) × 45 mm (x), with the outlet diameter of 25 mm. The key parameters of the main components and heat sinks are provided in Tables 1 and 2, with details on the oil coolant and its temperature-dependent thermal properties listed in Table 3 [7].
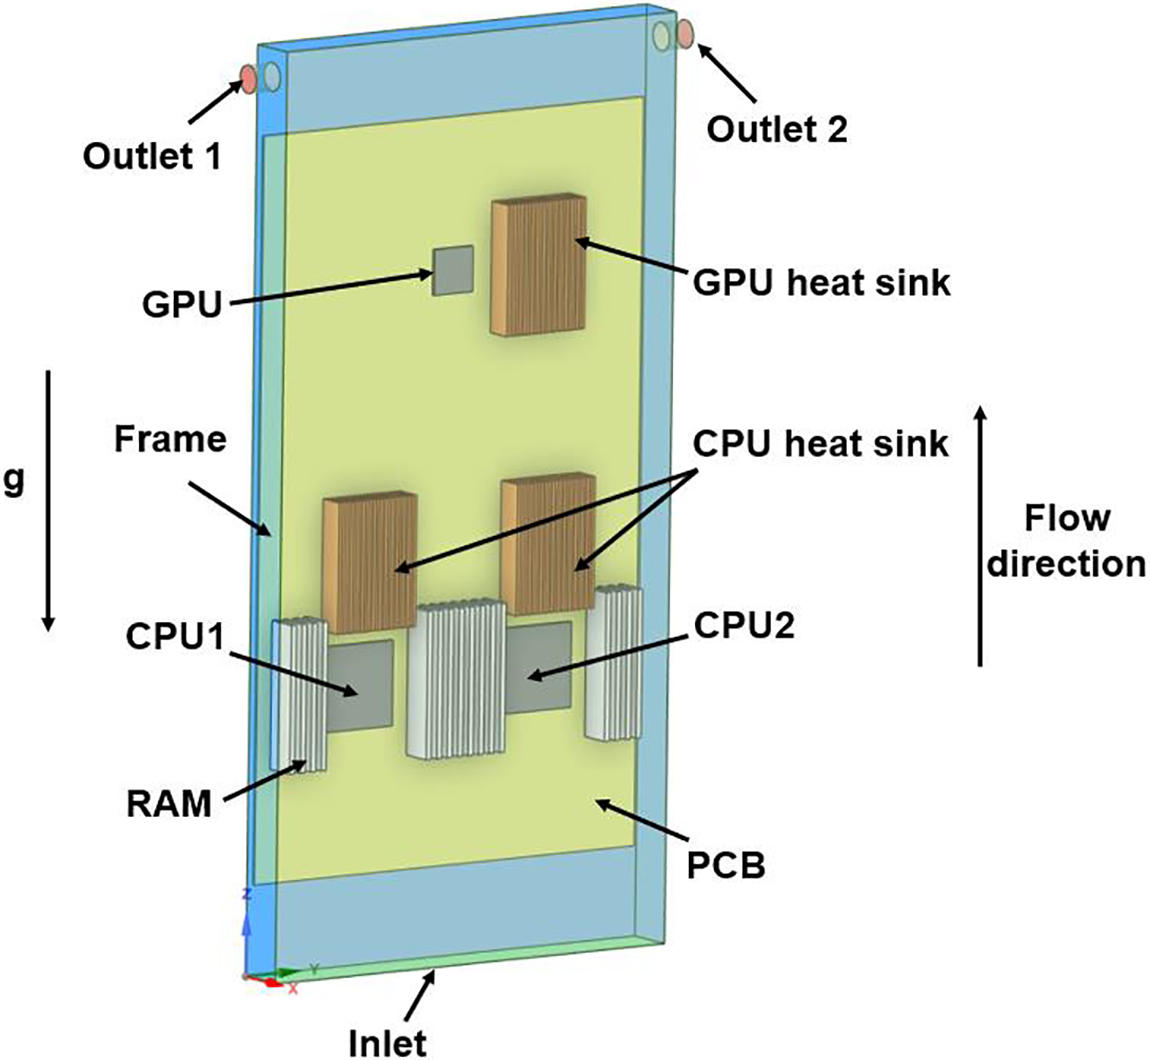
Figure 1: Illustration of the sever model
This study develops a three-dimensional steady-state flow and heat transfer model to evaluate the cooling performance of a SPIC system using oil coolant. To simplify the analysis, several assumptions are made: the flow is steady and incompressible, thermal radiation effects are neglected, and heat dissipation due to viscous forces is ignored. Consequently, the governing equations for mass conservation, momentum, and energy are as follows:
Continuity equation:
Momentum equation:
Energy equation:
where
A turbulence model is necessary for the closure of the above equations. The RNG k-
where
where

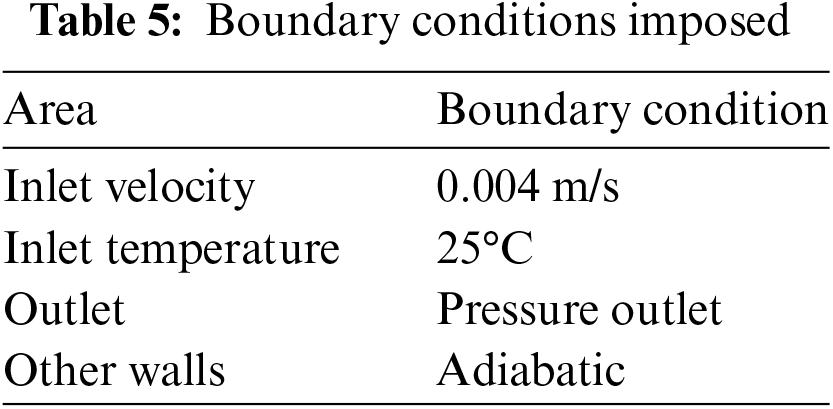
2.3 Meshing and Numerical Settings
This paper employs an unstructured grid to mesh the server, with grid refinement around high-power devices (e.g., GPU, CPU) to ensure calculation accuracy. The boundary conditions applied to the server are outlined in Table 5. The fluid-solid interfaces were treated with thermal boundary conditions of couple. Thermal interface material (TIM) is applied to the contact surfaces between the CPU/GPU and the heat sinks. The TIM’s thickness and thermal conductivity are 0.5 mm and 5 W⋅K−1⋅m−1, respectively. This study uses an unstructured mesh and performs local refinement on the main components. Using the ANSYS FLUENT software package, the finite volume method solves the SPIC system. The SIMPLE scheme is used for iterative calculations of pressure-velocity coupling in differential equations. The PRESTO scheme is used to discretize the pressure term, while the equations for momentum, energy, turbulent kinetic energy, and dissipation rate are discretized using the second-order upwind scheme. A pressure-based double-precision solver is selected to enhance computational accuracy. Iterative calculations are stopped once the residuals of all equations fall below 10−6, indicating convergence of the numerical solution.
This study performs a grid independence test for the SPIC system’s heat transfer capacity. The average temperature of the CPU and GPU in the SPIC system under different grid sizes are shown in Fig. 2. When the number of grid cells is not less than 4.9 million, the maximum deviation of the average CPU and GPU temperature values is about 0.6% and grid size has almost no influence on the temperature changes of the CPU and GPU.
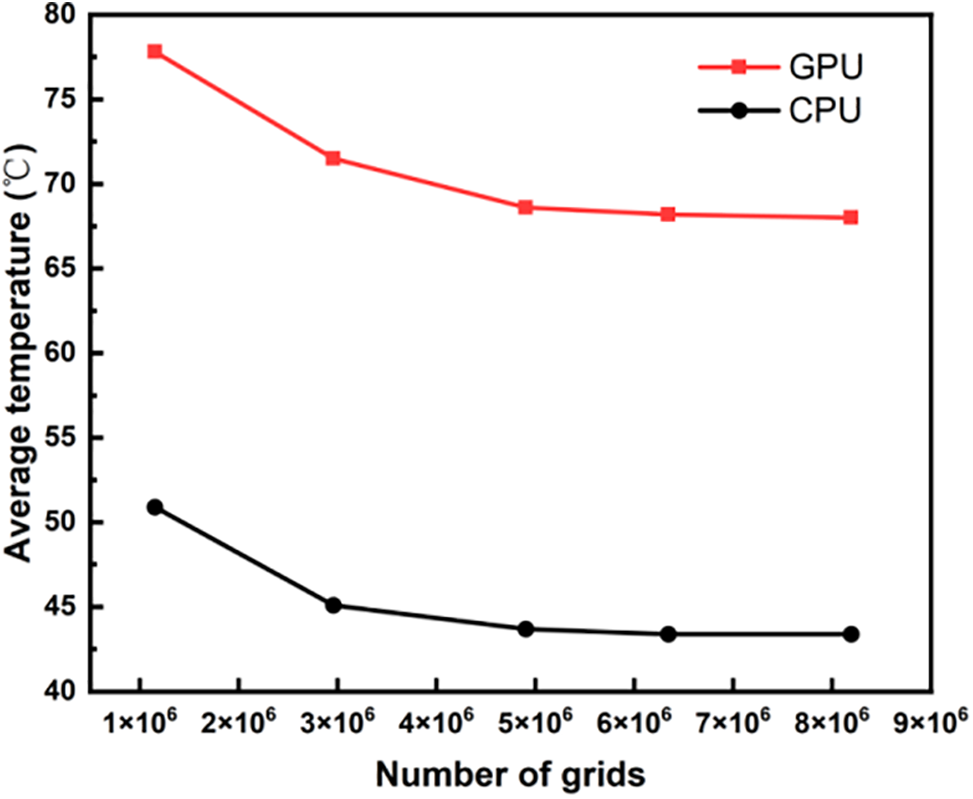
Figure 2: Independence tests for numerical models
Validating the turbulence model is essential to ensure the accuracy of the simulation results. Therefore, a comparative study is conducted by establishing a numerical model based on Luo et al.’s [39] immersion cooling experiment. As shown in Fig. 3a, the experimental setup has a heat source, an epoxy resin plate, and an immersion tank. Mineral oil was used as the cooling medium with an inlet temperature of 25°C. The heat source had dimensions of 50 mm × 50 mm × 2 mm and a power output of 60 W. All model parameters are consistent with the experimental conditions. The model was subjected to a range of inlet flow rate boundary conditions, spanning from fully natural convection to highly forced flow. Mixed convection is characterized by the Richardson number (Ri), a dimensionless number that quantifies the ratio of buoyancy-induced flow to forced flow within a fluid system. It helps assess the relative significance of natural convection compared to forced convection. A value of Ri < 0.1 indicates the heat transfer is dominated by forced convection, natural convection dominates if Ri > 10. The Richardson Number is expressed as:
where
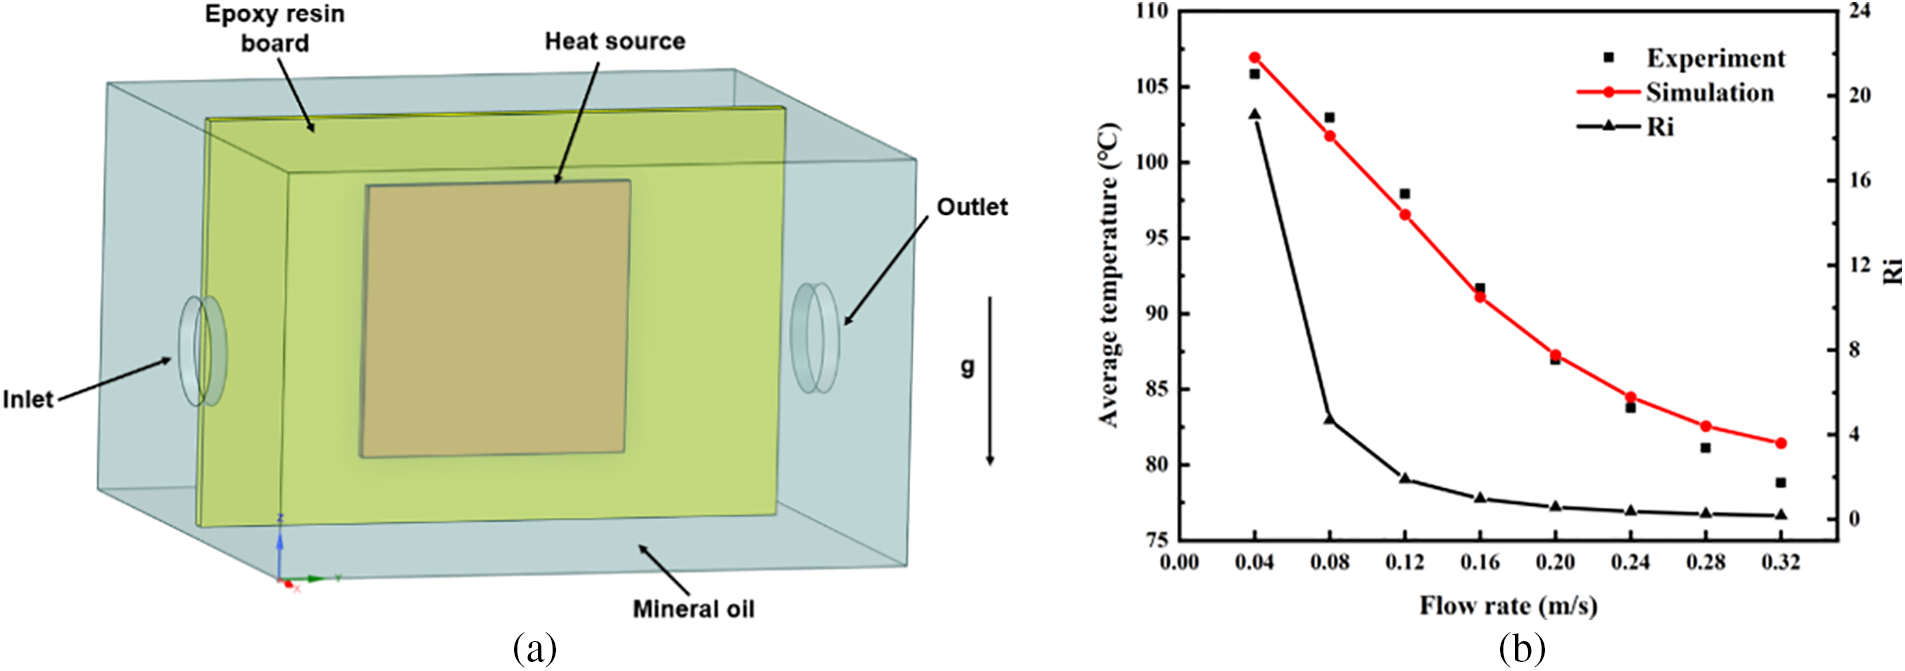
Figure 3: Model validation: (a) physical model; (b) comparison of simulation and experiment
Fig. 3b presents a comparison between the numerical simulation data and the experimental data for the heat source temperature. The results indicate that the average heat source temperature from the numerical simulations closely matches the experimental data. At different flow velocities, the maximum deviation between them is only 4%. Therefore, the present numerical model is considered reliable and accurate for studying SPIC system performance.
3.1 Natural Convection Dominating the Performance of SPIC System
In all investigated scenarios, the Richardson number (Ri) ranged between 10 and 15, indicating that natural convection dominated heat transfer around the server’s GPU. To describe the natural convection-dominated cooling process above heat sinks, we detail the flow field and heat transfer characteristics of an oil-immersed cooling server. The reference states at x = 15 mm along the x-direction and local cross-sections are examined.
Flow characteristics: The velocity magnitude contour at the cross-section x = 15 mm is depicted in Fig. 4. As shown in Fig. 4a, oil coolant enters from the heat sink’s outer region. At this point, the inlet flow velocities for the CPU and GPU heat sinks are 0.003 and 0.004 m/s, respectively. The oil coolant traverses the fin channels, removing heat from the heat sink. Buoyancy forces drive the fluid to ascend through the heat sink channels. As a result, fluid velocity around the heat sink is lower than within the channels. Additionally, fluid from each channel accelerates and converges at the heat sink’s terminal area, forming a prominent upward-accelerating thermal plume. To maintain flow continuity, voids left by the rising fluid are filled by cooler surrounding fluid that enters the fin channels. Sections I and II demonstrate that fluid velocity in the central heat sink channels is predominantly influenced by natural convection. Fig. 4b reveals that fluid velocity within the fin channels increases continuously along the flow direction, peaking at the heat sink outlet. Here, the peak flow velocities at the GPU and CPU heat sink outlets are 0.035 and 0.026 m/s, respectively. Velocity distribution along the fin height displays smaller values at the ends and larger values at the middle. This pattern occurs as fluid velocity is zero at the fin roots due to viscous effects, and approaches the heat sink top’s velocity near the fin tops where the temperature gradient diminishes. Peak velocity is observed near the middle of the fins.
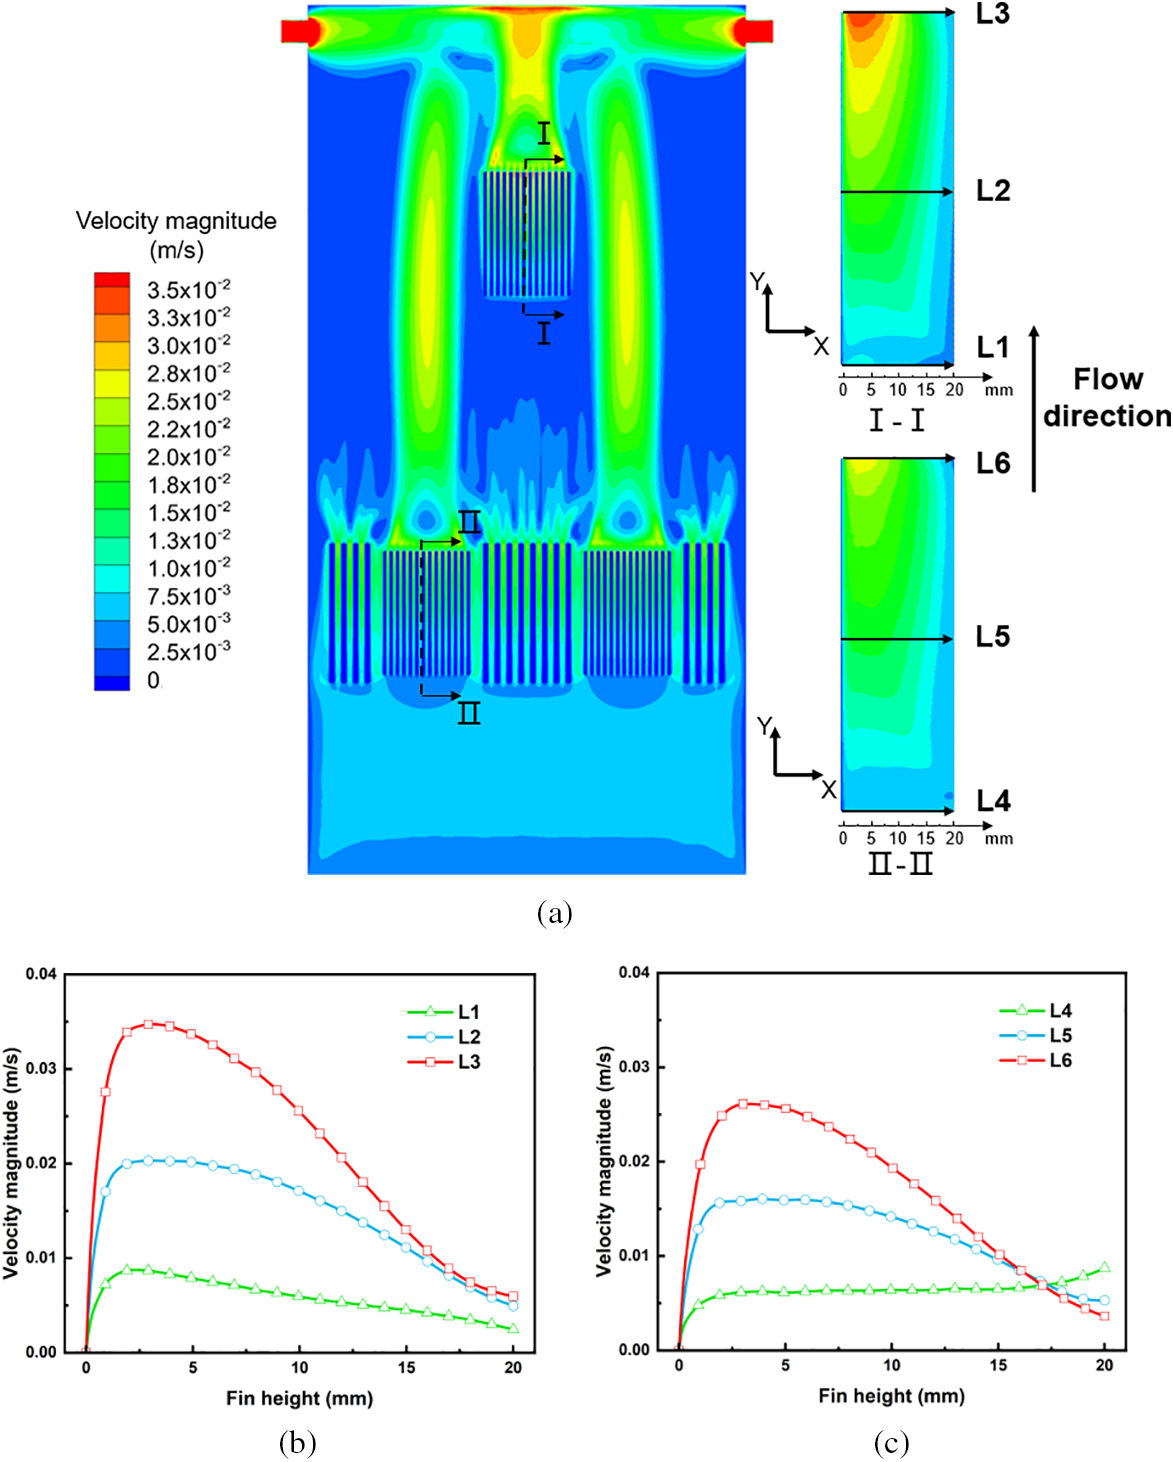
Figure 4: Characteristics of the velocity field: (a) velocity distribution inside the server (x = 15 mm); (b) GPU heat sink center section I; (c) GPU heat sink center section II
Heat transfer performance: Fig. 5 depicts the temperature distribution within the server. Fig. 5a shows how flow and heat transfer interactions heat the oil coolant in electronic component channels, enhancing buoyancy and accelerating the fluid’s ascent. Consequently, the fluid temperature outside these channels is lower than inside. High power density areas around devices like CPUs and GPU are significantly hotter than other server parts. At this stage, average temperatures are approximately 68°C for the GPU and 43°C for the CPU. This results from the GPU’s high-power output and smaller surface area, which yield higher temperature compared to the CPU. Additionally, the GPU downstream is strongly influenced by the thermal cascade from upstream components, such as the CPU. Consequently, the fluid temperature near the GPU heat sink inlet reaches approximately 29°C. At the heat sink inlet, a thin thermal boundary layer maintains the oil coolant’s temperature close to the external temperature as it passes between the fins. As the fluid ascends within the heat sink, a thermal boundary layer develops, increasing the fluid’s temperature. As the temperature difference between the fins and the fluid decreases, the natural convection effect is reduced. As a result, this leads to an uneven temperature distribution across the heat sink. Meanwhile, Fig. 5b indicates that the highest temperature gradients within the GPU and CPU heat sinks occur in sections IV and VII, respectively. This occurs because the GPU and CPU are located at the central bottom of the heat sink, where heat accumulation in the center reduces the heat transfer efficiency. Fig. 6 shows the distribution of heat flux across the surface of the GPU heat sink. Simultaneously, average heat transfer coefficient(h) up to 75.8 W/(m2·K). Higher heat flux densities at the heat sink inlet and fin tops indicate increased heat transfer coefficients and enhanced heat transfer efficiency. This results from the cooler oil coolant entering near the inlet and top, which enhances heat exchange. However, near the fin roots, heat flux density is very low. Combined with the velocity field analysis in Fig. 4, the thermal boundary at the fin roots reduces flow velocity, weakening natural convection and significantly lowering the heat transfer coefficient. Additionally, heat flux distribution becomes increasingly uneven near the heat sink center. The central area of Fin 7 shows a significant increase in heat flux density. This further suggests that heat accumulation near the heat sink center intensifies the temperature gradient across the fins. Therefore, optimizing the SPIC system’s heat sink is essential to enhance its natural convection cooling capacity further.
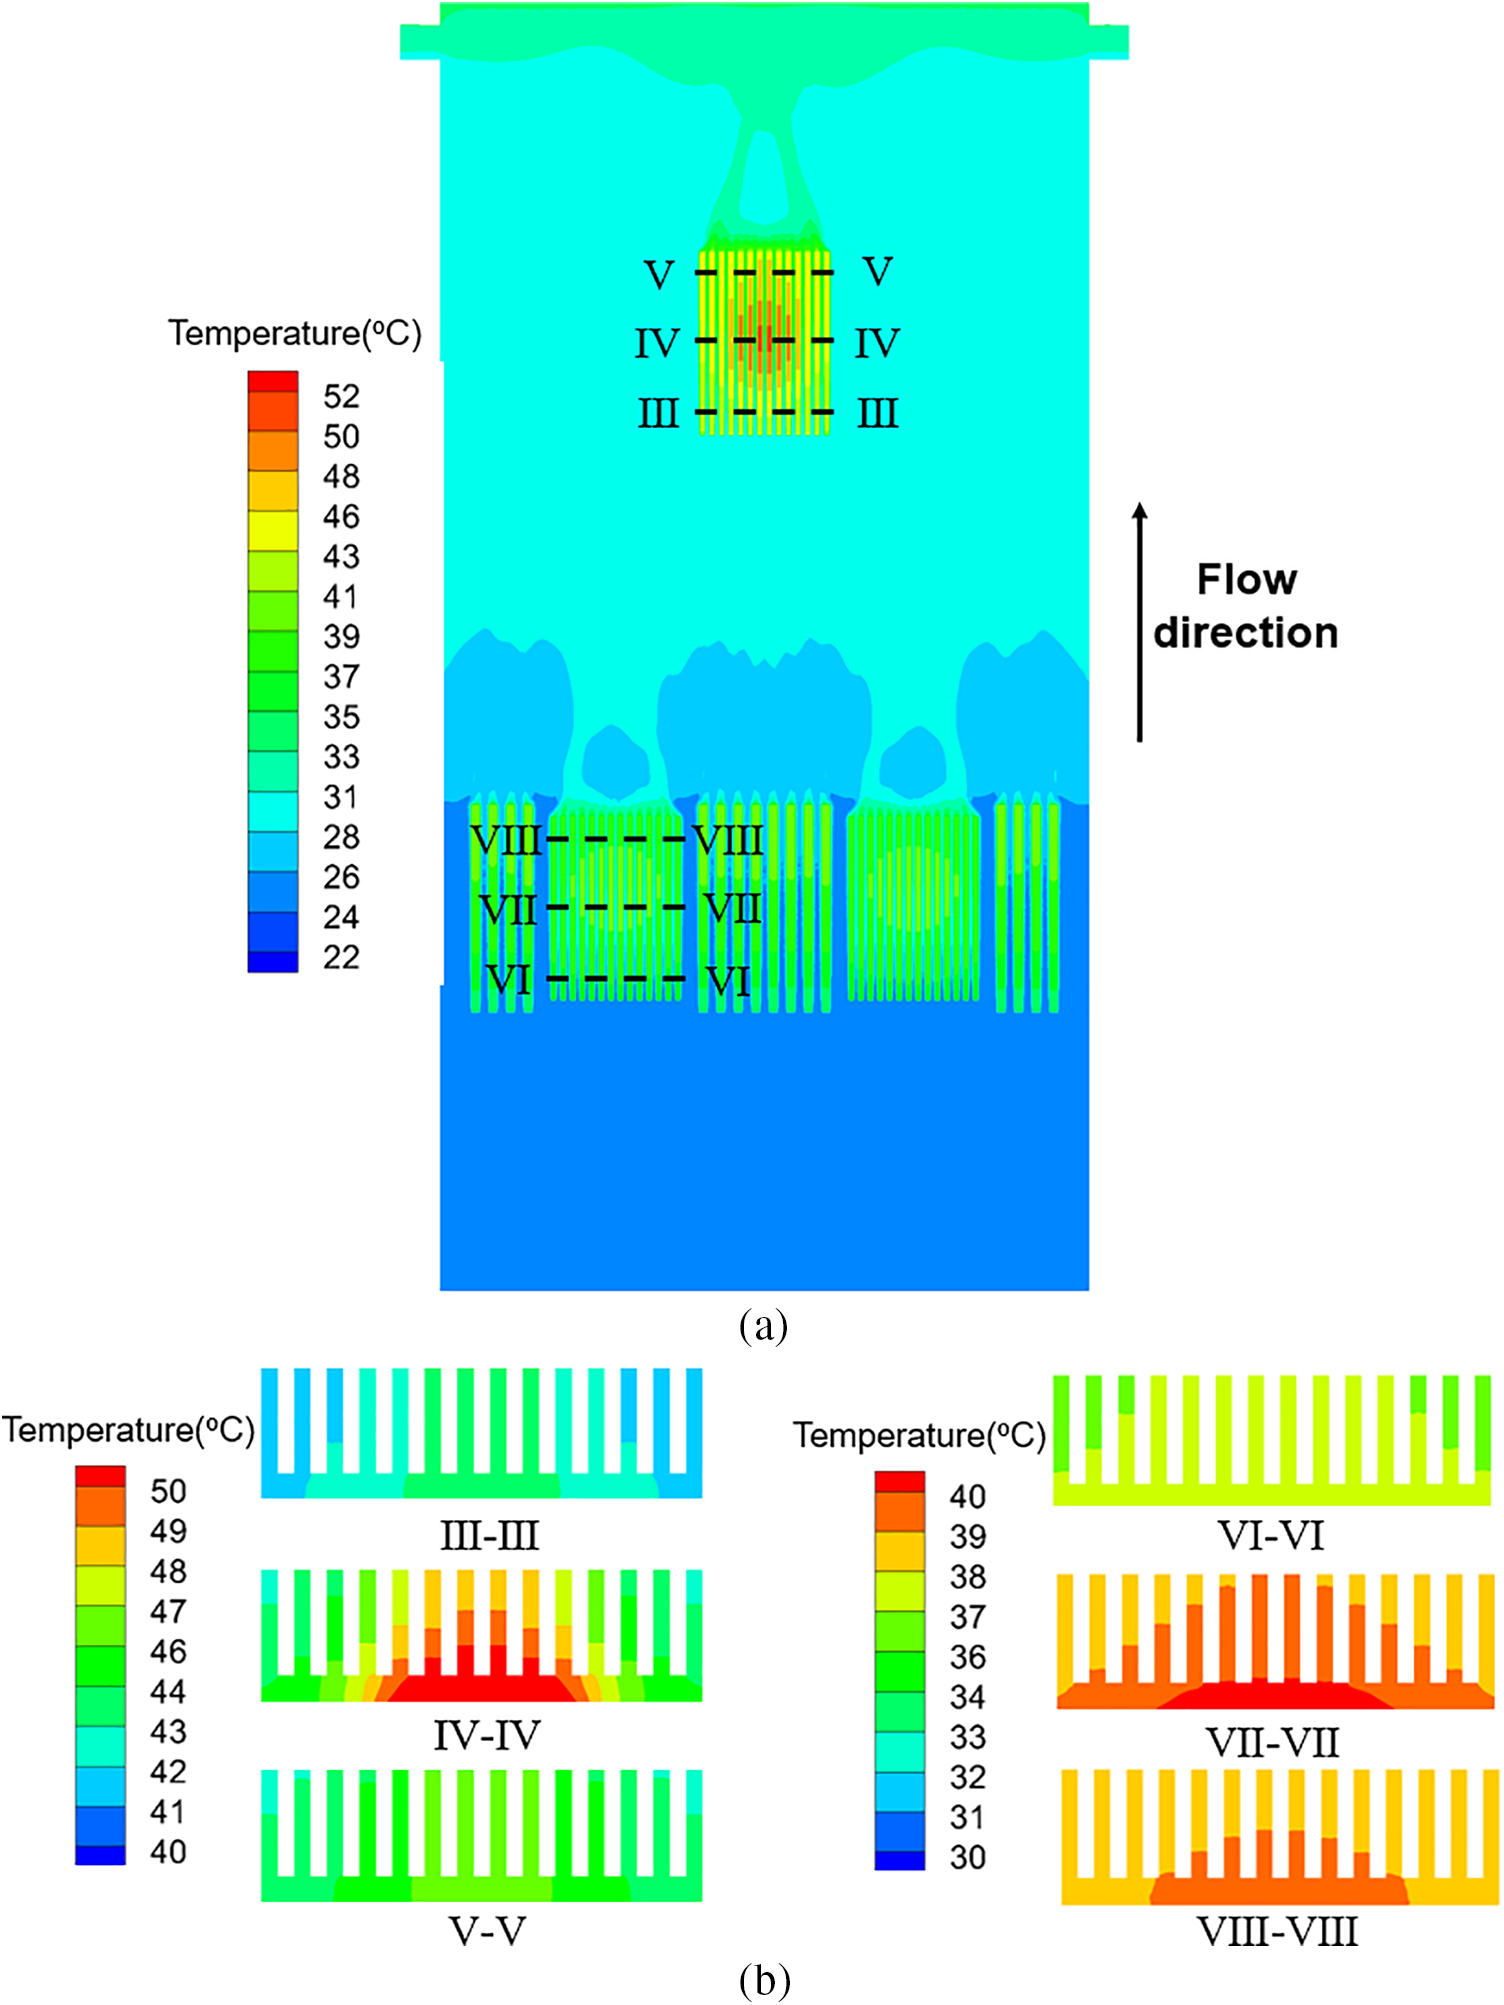
Figure 5: (a) Temperature distribution inside the server (x = 15 mm); (b) temperature distribution across heatsink sections
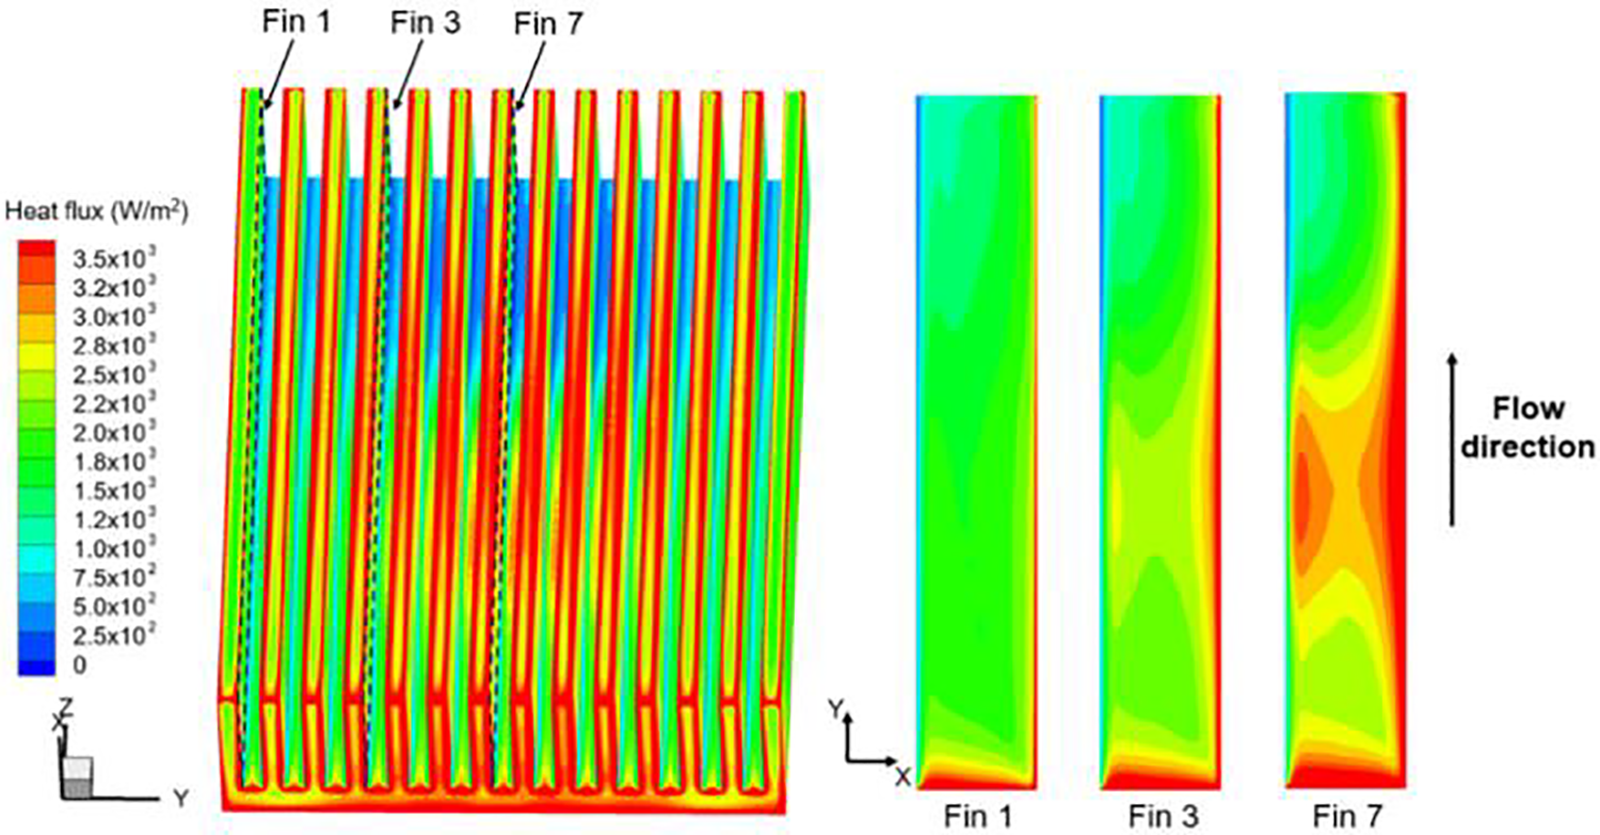
Figure 6: Heat flux density distribution of the GPU heatsink
3.2 Influence of Heat Sink Structure
The geometric parameters of the heat sink have a significant impact on the surrounding flow dynamics and heat transfer characteristics. The influence of fin thickness, number, and height on the cooling performance of GPU heat sinks are investigated numerically.
Influence of fin thickness: Fig. 7 shows the effect of fin thickness on the temperature, flow velocity, and heat transfer coefficient of the heat sink. Fig. 7a,b demonstrates that both GPU and heat sink temperatures initially decrease and then increase with rising fin thickness. The average flow velocity at the heat sink outlet initially increases and subsequently decreases. Figs. 7c and 8 reveal that the heat transfer area slightly increases when fin thickness is less than 2 mm. Thicker fins effectively heat the fluid, thereby increasing the flow velocity within the fin channels. Consequently, this enhances the h, bolstering the natural convection effect. When fin thickness exceeds 2 mm, reduced fin spacing leads to increased flow resistance and lower flow velocities within the channels, ultimately diminishing the h. Given that the reduced heat transfer coefficient impacts more than the increased heat transfer area, the average heat sink temperature begins to rise. However, the GPU’s lowest average temperature occurs at a fin thickness of 3 mm. At a fin thickness of 3 mm, compared to 2 mm, the GPU transfers more heat to the heat sink, lowering its average temperature by approximately 1°C. Thus, an optimal fin thickness results in the lowest average GPU temperature.
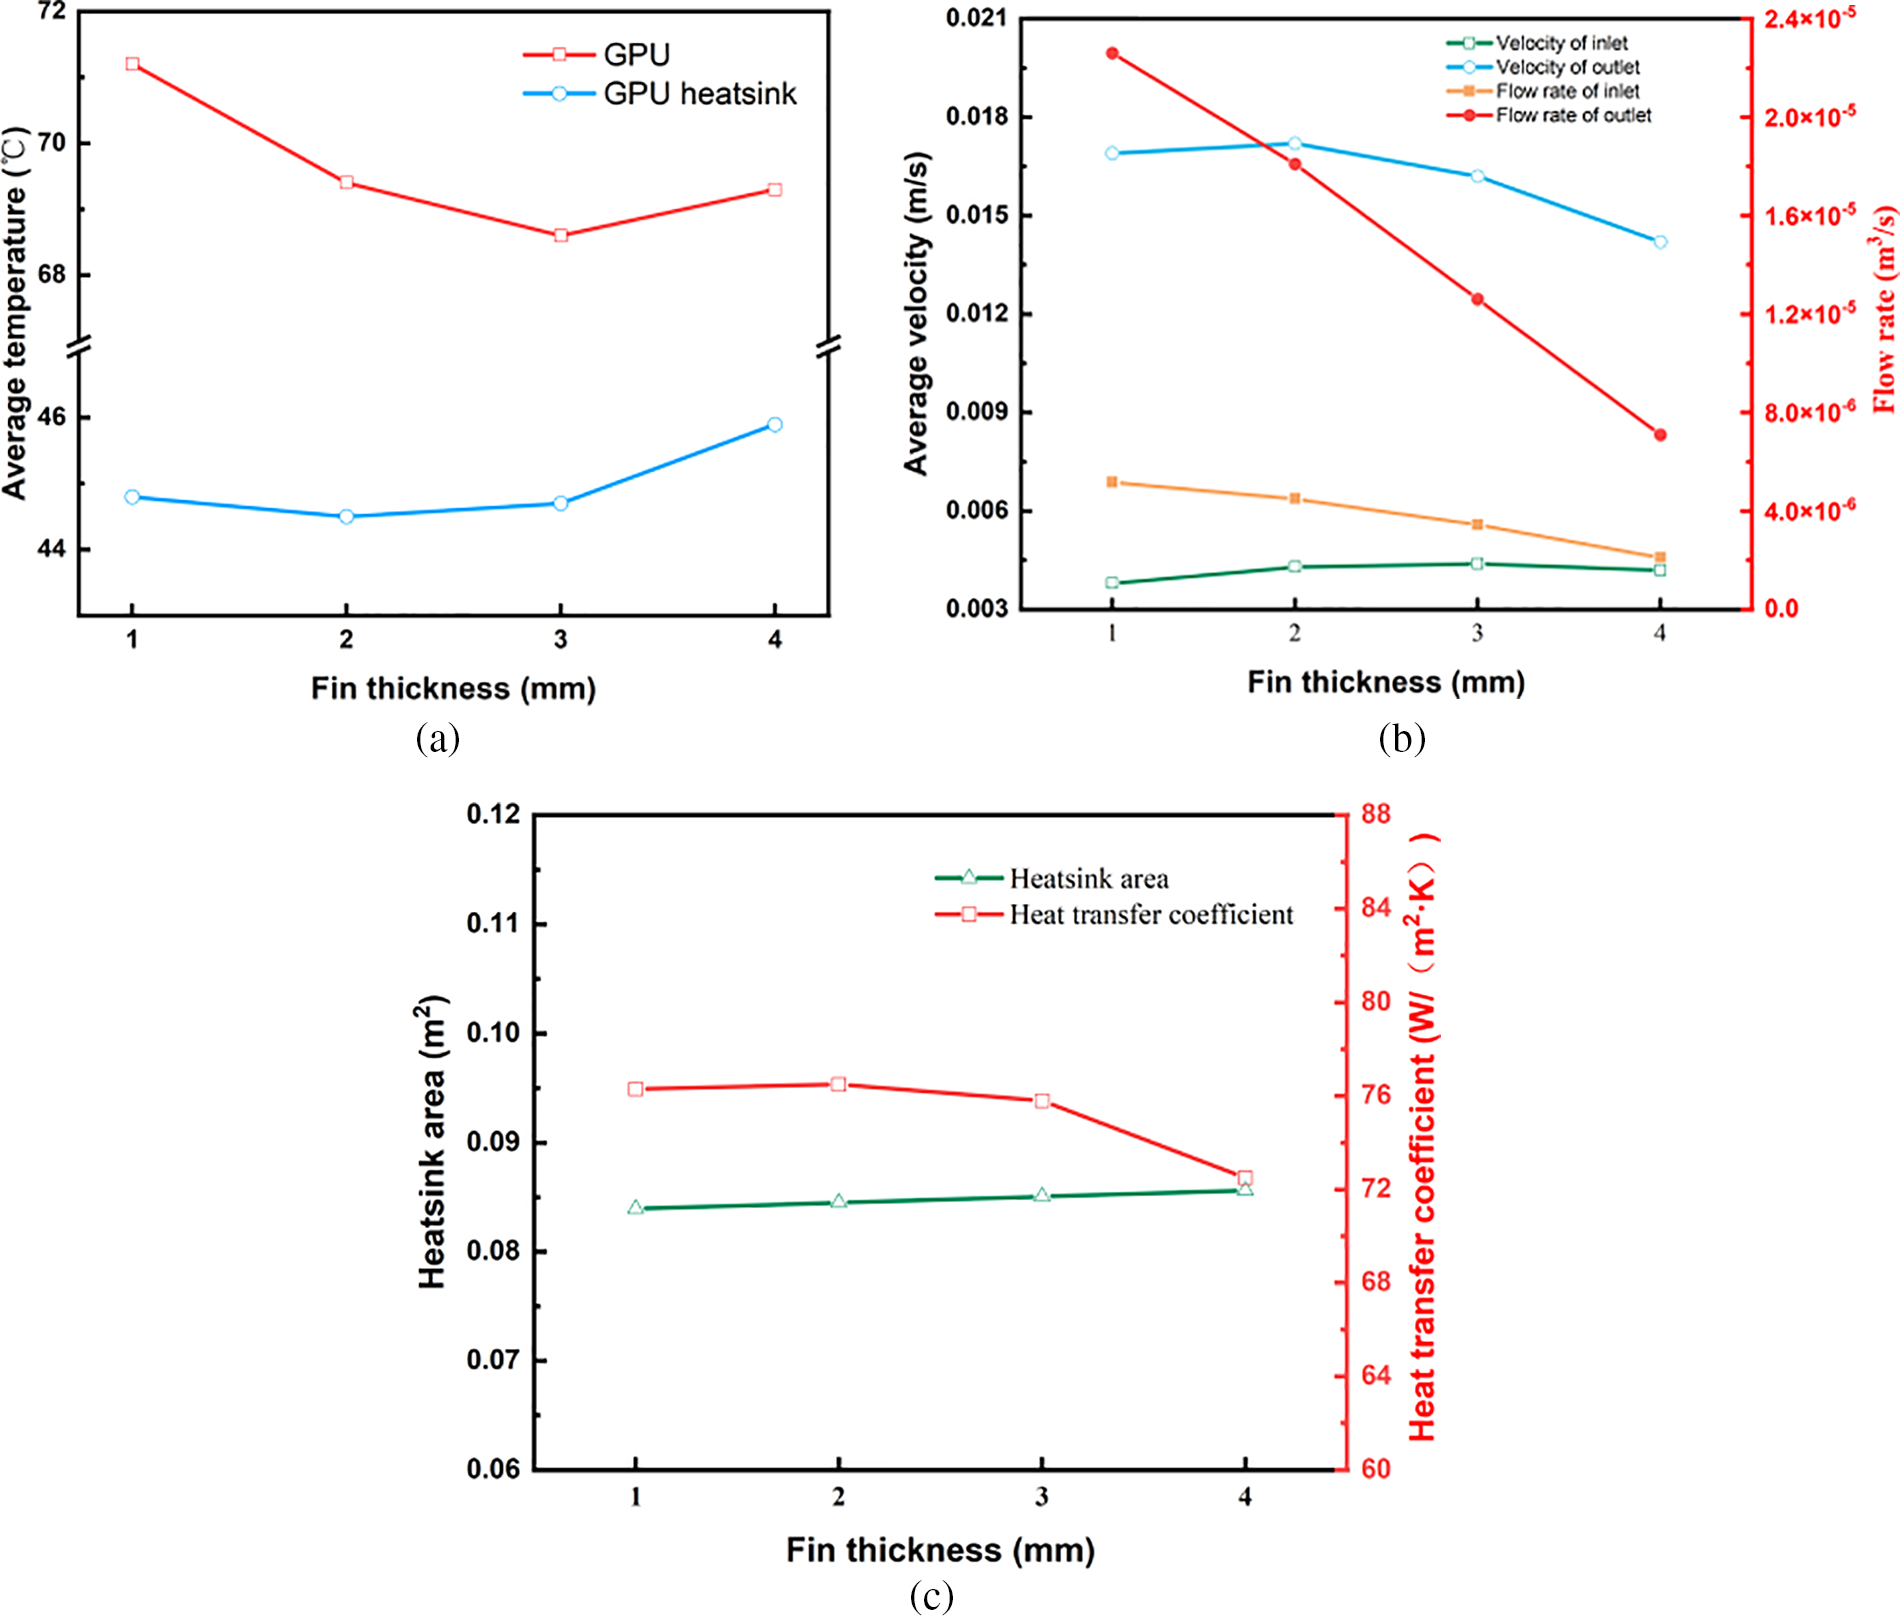
Figure 7: Influence of fin thickness on thermal performance and flow of heat sinks: (a) average temperatures of GPU and GPU heat sink; (b) average velocity and flow rate at the heat sink; (c) heat sink area and average heat transfer coefficient

Figure 8: Variation of flow velocity in heat sink channels under different fin thicknesses: (a) velocity contour of heat sink section (x = 15 mm); (b) variation of flow velocity in middle channel of heatsink along the flow direction
Influence of fin number: Fig. 9a reveals that the number of fins is a critical parameter influencing heat sink performance. With fewer than 16 fins, both the GPU and heat sink exhibit decreasing average temperatures as the fin number increases. Compared to 12 fins, the average temperatures decrease by about 3°C for the GPU and 1.3°C for the heat sink. Fig. 9b,c further elucidates this phenomenon. As number of fins increases, both average velocity and flow rate at the heat sink outlet decrease. Reduced fin spacing increases flow resistance within the fin channels, lowering the h by approximately 14%. However, a higher number enlarges the heat transfer area by 25%. Here, the benefits of increased heat transfer area outweigh drawbacks of reduced h. Consequently, the improved natural convection effect lowers the GPU’s average temperature. When the fin count exceeds 16, the overly narrow fin spacing further reduces average flow velocity and significantly lowers the h. The enlarged area fails to offset the negative impact of the reduced h. As a result, the GPU’s average temperature rises with an increase in fin count. In summary, optimizing fin count can effectively boost the heat sink’s natural convection effect and lower the GPU’s average temperature. Optimal performance is achieved with 16 fins.
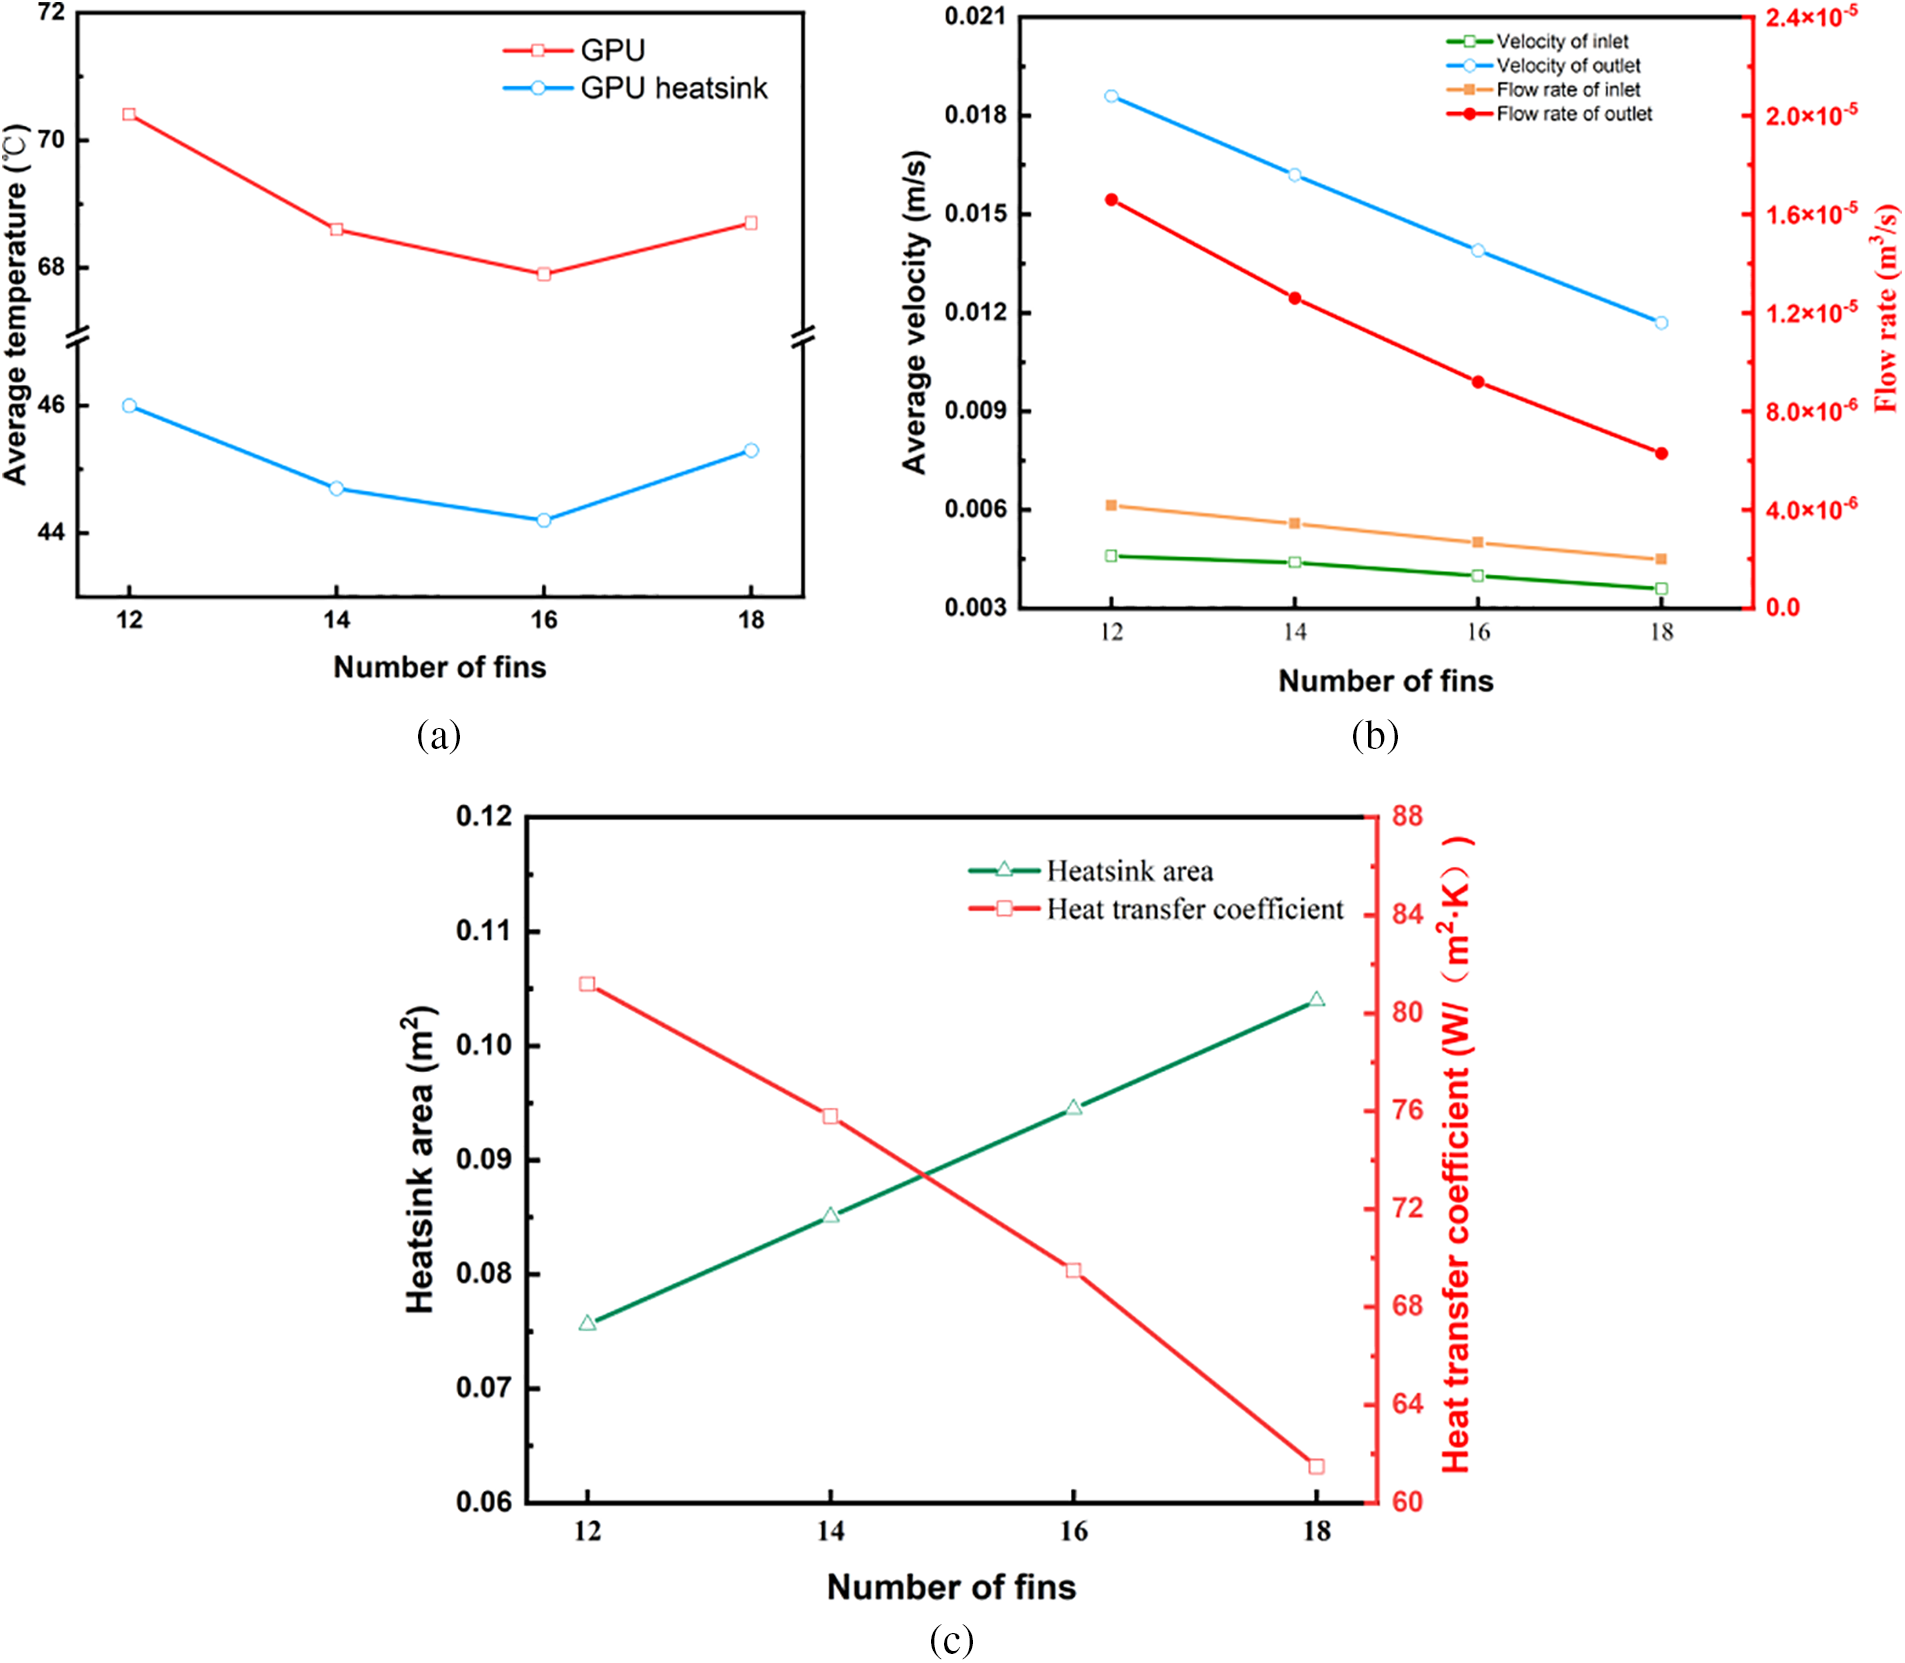
Figure 9: Influence of the number of fins on thermal performance and flow of heat sinks: (a) average temperatures of GPU and GPU heatsink; (b) average velocity and flow rate at the heatsink; (c) heat sink area and average heat transfer coefficient
Influence of fin height: Fin height plays a crucial role in determining the heat sink’s performance. Fig. 10a demonstrates that increasing fin height markedly reduces the average temperatures of the GPU and heat sink. At fin height of 30 mm, temperatures decrease by approximately 6.4°C for the GPU and 6.6°C for the heat sink, compared to fin height of 15 mm. Fig. 10b,c explains these results. At fin height of 30 mm, the gap between the heat sink top and the server wall narrows to just 2 mm. Consequently, minimizing fluid bypass at the top significantly increases the average inlet flow velocity by about 75%. Moreover, the expanded fin channel area substantially increases the fluid flow rate. However, greater fin height also elevates fluid resistance within the channels, diminishing the average outlet flow velocity. As a result, the h continues to fall, dropping by 27% at a fin height of 30 mm. Simultaneously, the heat transfer area expands by nearly 72%. This enhanced natural convection effect significantly lowers the average temperatures of the GPU and heat sink. In summary, a greater fin height significantly increases the heat sink’s cooling performance.
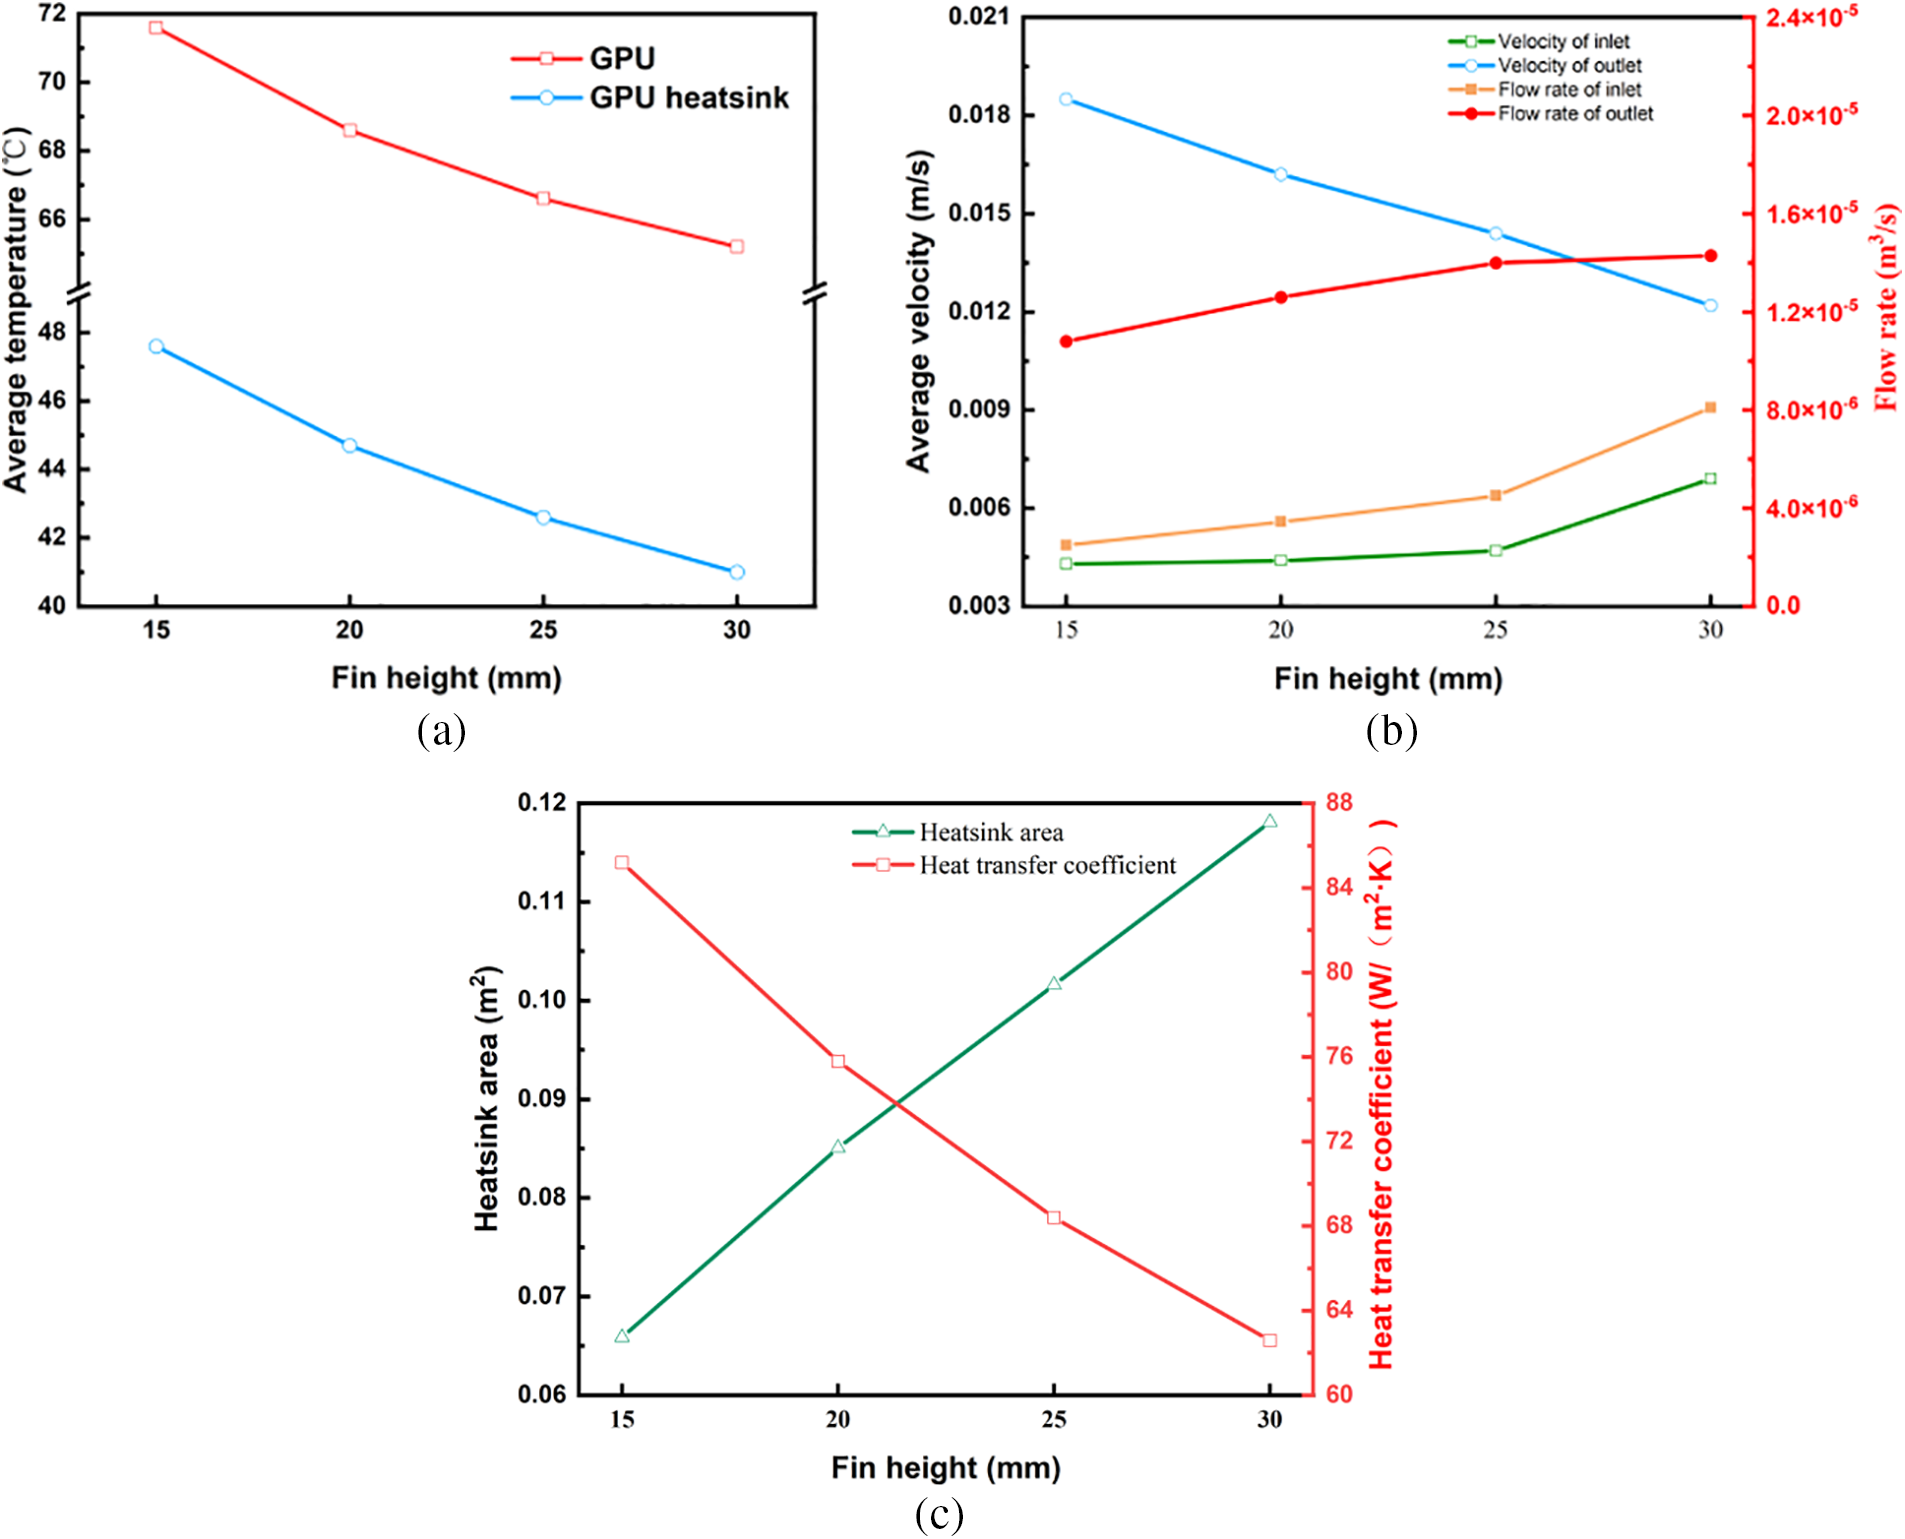
Figure 10: Influence of fin height on thermal performance and flow of heat sinks: (a) average temperatures of GPU and GPU heatsink; (b) average velocity and flow rate at the heatsink; (c) heat sink area and average heat transfer coefficient
In this paper, the heat transfer of oil coolant cooled SPIC system are investigated. It is known that immersion cooled servers require low coolant flow rates. The formation of thermal plumes near the heat sink was observed to improve fluid movement upward. The study demonstrated that natural convection dominates heat transfer at lower flow rates, where the Ri exceeded 10. This is due to the buoyancy force generated by temperature-induced density variations in the oil coolant, which enhances vertical fluid motion and facilitates heat removal from the server components. In addition, oil coolants provide important advantages for server heat dissipation such as high specific heat capacity, high thermal conductivity, low cost, and low environmental hazards compared to ordinary liquid coolants. The viscosity is a key factor in determining its cooling capacity. Thus higher viscosity also reduces the fluidity of the oil coolant which leads to increased flow losses. The thermophysical parameters of oil coolant are sensitive to temperature. When the oil coolant is heated, the viscosity is significantly reduced and the flow rate is accelerated, thus improving the natural convective heat transfer. Reducing the viscosity of the oil coolant is crucial for enhancing the cooling efficiency of the system. Flow rate is another critical factor that influences the cooling effectiveness. For lower oil coolant flow rates, natural convection dominates, in which case increasing the flow rate improves the cooling performance, as reflected by a decrease in the temperature of the electronic components as the flow rate increases. However, up to a certain value, increasing flow rate is less effective in improving natural convection, while increasing the pressure drop.
The temperature distribution analysis showed that a thin thermal boundary layer develops at the inlet regions of the heat sink fins. This layer gradually thickens as the fluid ascends due to heat absorption, which diminishes the temperature gradient and weakens the convective heat transfer further downstream. Understanding this development is essential for optimizing fin spacing to maintain a strong temperature gradient and sustain natural convection throughout the entire fin height. This study explores effect of heat sink geometrical parameters (fin thickness, number of fins, and fin height) on the natural convection. The degree of influence of these structural parameters on the heat sink performance varies, using the average temperature of the GPU as an evaluation metric. As can be obtained from Figs. 7a and 9a, the temperature of the GPU both decreases and then increases with the increase of fin thickness and number of fins. The heat sink with an optimal fin thickness of 3 mm reduces the GPU temperature from 71.3°C to 68.6°C, and the optimal number of fins 16 reduces the GPU temperature from 70.5°C to 67.7°C. Also, increasing the number of fins significantly increases the heat transfer area compared to the fin thickness. Increasing the fin thickness from 1 to 3 mm increases the heat transfer area by only 1.3%. However, increasing the number of fins from 12 to 16 increases the heat transfer area by approximately 25%. Therefore, the number of fins may be a more significant parameter influencing the performance of the heat sink than fin thickness. While increasing the number of fins improved the total heat transfer area, it also increased flow resistance, which reduced the flow velocity within the fin channels. This trade-off highlights the importance of balancing the number of fins to optimize the h without significantly impeding coolant flow. Wu et al. [40] explored the geometrical optimization of air-cooled heat sinks and found that the minimum thermal resistance is achieved by increasing both the number of fins and the fin thickness. They determined that the minimum thermal resistance of the heat sink reaches 0.263°C/W for the former and 0.3°C/W for the latter. Elsayed et al. [41] determined the optimal design parameters, including the number of fins and fin thickness, through a combination of experiments and simulations. Thickness and other optimal design parameters. It was found that the optimum fin thickness reduced the heat sink thermal resistance by about 0.06°C/W and the optimum number of fins reduced the thermal resistance by 0.15°C/W. These results further validate that the number of fins has a greater effect on the cooling effect than the fin thickness. From Fig. 10a, it is found that the temperature of GPU is reduced from 71.6°C to 65.2°C when the fin height is increased from 15 to 30 mm. The heat transfer area and outlet location flow rate of the heat sink increased by about 75% and 32%. The improved cooling performance with increasing fin height is attributed to the enhanced vertical channeling of buoyant flows, which reinforces natural convection. Therefore, the fin height had the most significant effect on the cooling effect of the heat sink compared to the number of fins. The effect of fin height has been discussed in previous studies. Tari et al. [42] studied air-cooled vertical heat sinks with natural convection and found that an increase in fin height to 25 mm resulted in lower radiator temperatures (about 30°C) compared to the optimum fin spacing of 12 mm obtained by varying the number of fins. Saini et al. [43] investigated the multivariate optimization of heat sinks for immersed servers The effect of fin thickness and number was found to be significantly reduced but fin height has the most dominant effect in natural convection. Yu et al. [44] conducted experimental and numerical studies on natural convection in heatsinks and the results showed that thermal resistance and heat transfer coefficients were generally reduced with the increase in the number of fins and fin height. However, there exists the highest number of fins reduces the thermal resistance to 2.3°C/W, and fin height can reduce the thermal resistance to below 1.7°C/W. The geometric parameter studies in the above literature are consistent with the patterns obtained in this paper, which further validates the accuracy of the results of this paper for the geometric parameters. Based on the analysis of the influence of heat sink geometric parameters in this study, the importance of fin parameters is ranked as follows: fin height, number, and thickness.
There are some limitations of the study in this paper. For single-phase immersion cooling heat sink performance can be affected by many parameters. Although some work has been done to optimize the fin thickness, number of fins, and fin height respectively, it is still not enough. In future studies, it is necessary to analyze the interaction effects of multiple parameters to further find the geometrical parameters for optimal heat sink performance. Meanwhile, there is still a great challenge for oil coolant to maintain the temperature of higher-power GPUs below the safe operating temperature (85°C) with natural convection cooling. In addition, the viscosity of the oil coolant has a large impact on the cooling capacity, and the law of reducing the viscosity on the heat transfer efficiency of the system needs to be further evaluated. Future research should investigate the use of advanced cooling fluids, such as nanofluids, which offer enhanced thermal conductivity and improved convective heat transfer properties. Additionally, incorporating phase-change materials could provide effective thermal buffering by leveraging latent heat storage during phase transitions. These innovations could significantly enhance the efficiency and scalability of SPIC systems, making them suitable for more demanding and larger-scale applications. The scalability of SPIC systems for larger-scale data centers presents a promising path for future data center cooling solutions. While challenges such as coolant distribution, facility integration, and maintenance logistics remain, advancements in modular system design, coolant technology, and real-time optimization tools can facilitate broader implementation. Future work should focus on these aspects to ensure that SPIC systems can meet the demands of high-density, large-scale data centers.
This study aims to tackle the challenges of cooling servers in data centers and provides a comprehensive performance analysis of a SPIC system utilizing oil as the cooling medium. The heat transfer performance and flow characteristics of the SPIC system with the low flow rate are analyzed through the establishment of a three-dimensional model of the server and numerical solution. Additionally, the study examines the impact of different heat sink structures on the thermal performance of the SPIC system, providing valuable data to support the engineering application of the system. For the scenarios investigated, the coolant velocity at the tank inlet is 0.004 m/s and the total power of the server is 740 W. In summary, the following conclusions can be drawn.
Evaluation of the flow regime around the heat sink by the Ri indicates that the natural convective behavior dominates in the SPIC system with low flow rates. The geometrical parameters of the heat sinks varied in their effect on the cooling performance of the heat sinks. The average temperatures of GPU and GPU heat sinks decreased and then increased with increasing thickness and number of fins. Fin thickness of 3 mm performs the best, reducing the average GPU temperature from 71.3°C to 68.6°C. With an optimal fin number of 16, the heat transfer area increases by about 25% and the average temperature of the GPU reduces to 67.7°C. However, when the thickness and number of fins continue to increase, there is no further improvement in heat transfer, the flow resistance increases significantly, and natural convection effect decreases. The average temperature of the GPU and the heat sink reduces significantly with the increase in fin height. The average temperature of the GPU reduces to 65.2°C when the fin height is 30 mm. Increasing the fin height increases the flow resistance, resulting in a lower flow rate. At the same time, the area and flow rate increase by about 72% and 32%, and the natural convection is significantly enhanced. Finally, the ranking of the importance of fin parameters when cooling the heat sink with natural convection is in the following order: fin height, number, and thickness. Future research should investigate the use of nanofluids or phase-change materials to further enhance cooling performance and thermal efficiency.
Acknowledgement: The authors would like to thank the Basic Research Funds for the Central Government “Innovative Team of Zhejiang University”.
Funding Statement: This study was financially supported by the Basic Research Funds for the Central Government “Innovative Team of Zhejiang University” under contract number (2022FZZX01-09).
Author Contributions: Study conception and design: Yiming Rongyang, Zhenyue Yu; data collection: Ruisheng Liang, Wei Su; analysis and interpretation of results: Zhenyue Yu, Wei Su; draft manuscript preparation: Yiming Rongyang, Ruisheng Liang, Jianjian Wei. All authors reviewed the results and approved the final version of the manuscript.
Availability of Data and Materials: The data that support the findings of this study are available from the corresponding author upon reasonable request.
Ethics Approval: Not applicable.
Conflicts of Interest: The authors declare no conflicts of interest to report regarding the present study.
References
1. Andrae A, Edler T. On global electricity usage of communication technology: trends to 2030. Challenges. 2015;6(1):117–57. doi:10.3390/challe6010117. [Google Scholar] [CrossRef]
2. Han Z, Sun X, Wei H, Ji Q, Xue D. Energy saving analysis of evaporative cooling composite air conditioning system for data centers. Appl Therm Eng. 2021;186(5):116506. doi:10.1016/j.applthermaleng.2020.116506. [Google Scholar] [CrossRef]
3. Haghshenas K, Taheri S, Goudarzi M, Mohammadi S. Infrastructure aware heterogeneous-workloads scheduling for data center energy cost minimization. IEEE Trans Cloud Comput. 2022;10(2):972–83. doi:10.1109/TCC.2020.2977040. [Google Scholar] [CrossRef]
4. Hnayno M, Chehade A, Klaba H, Polidori G, Maalouf C. Experimental investigation of a data-centre cooling system using a new single-phase immersion/liquid technique. Case Stud Therm Eng. 2023;45:102925. [Google Scholar]
5. Wu JF, Shi MH, Chen YP, Li X. Visualization study of steam condensation in wide rectangular silicon microchannels. Int J Therm Sci. 2010;49(6):922–30. doi:10.1016/j.ijthermalsci.2010.01.007. [Google Scholar] [CrossRef]
6. Wang ZP, Zhao RJ, Wang SZ, Huang D. Heat transfer characteristics and influencing factors of immersion coupled direct cooling for battery thermal management. J Energy Storage. 2023;62:106821. doi:10.1016/j.est.2023.106821. [Google Scholar] [CrossRef]
7. Wang H, Yuan X, Zhang K, Lang X, Chen H, Yu H, et al. Performance evaluation and optimization of data center servers using single-phase immersion cooling. Int J Heat Mass Transf. 2024;221:125057. doi:10.1016/j.ijheatmasstransfer.2023.125057. [Google Scholar] [CrossRef]
8. Parida PR, David M, Iyengar M, Schultz M, Gaynes M, Kamath V, et al. Experimental investigation of water cooled server microprocessors and memory devices in an energy efficient chiller-less data center. In: 2012 28th Annual IEEE Semiconductor Thermal Measurement and Management Symposium (SEMI-THERM), 2012; San Jose, CA, USA: IEEE; p. 224–31. [Google Scholar]
9. Pires IA, Silva RA, Pereira ITO, Faria OA, Maia TAC, Filho BDJC. An assessment of immersion cooling for power electronics: an oil volume case study. IEEE Trans Ind Appl. 2019;56(3):3231–7. doi:10.1109/IAS41445.2019. [Google Scholar] [CrossRef]
10. Li Y, Bai ML, Zhou ZF, Lv JZ, Hu CZ, Gao LS, et al. Experimental study of liquid immersion cooling for different cylindrical lithium-ion batteries under rapid charging conditions. Therm Sci Eng Prog. 2023;37(10):101569. doi:10.1016/j.tsep.2022.101569. [Google Scholar] [CrossRef]
11. Han X, Guo Y, Wang Q, Phelan P. Optical characterization and durability of immersion cooling liquids for high concentration III-V photovoltaic systems. Sol Energy Mater Sol Cells. 2018;174:124–31. doi:10.1016/j.solmat.2017.08.034. [Google Scholar] [CrossRef]
12. Li XQ, Xu ZM, Liu SC, Zhang XY, Sun HW. Server performance optimization for single-phase immersion cooling data center. Appl Therm Eng. 2023;224(3):120080. doi:10.1016/j.applthermaleng.2023.120080. [Google Scholar] [CrossRef]
13. Cheng CC, Chang PC, Li HC, Hsu FI. Design of a single-phase immersion cooling system through experimental and numerical analysis. Int J Heat Mass Transf. 2020;160:120203. doi:10.1016/j.ijheatmasstransfer.2020.120203. [Google Scholar] [CrossRef]
14. Wang YA, Ren LY, Yang ZH, Deng ZC, Ding WD. Application of two-phase immersion cooling technique for performance improvement of high power and high repetition avalanche transistorized subnanosecond pulse generators. IEEE Trans Power Electron. 2022;37(3):3024–39. doi:10.1109/TPEL.2021.3111348. [Google Scholar] [CrossRef]
15. Birbarah P, Gebrael T, Foulkes T, Stillwell A, Moore A, Pilawa-Podgurski R, et al. Water immersion cooling of high power density electronics. Int J Heat Mass Transf. 2020;147(4):118918. doi:10.1016/j.ijheatmasstransfer.2019.118918. [Google Scholar] [CrossRef]
16. Perez S, Arroba P, Moya JM. Energy-conscious optimization of edge computing through deep reinforcement learning and two-phase immersion cooling. Futur Gener Comp Syst. 2021;125(6):891–907. doi:10.1016/j.future.2021.07.031. [Google Scholar] [CrossRef]
17. Kibushi R, Yuki K, Unno N, Ogushi T, Murakami M, Numata T, et al. Enhancement of the critical heat flux of saturated pool boiling by the breathing phenomenon induced by lotus copper in combination with a grooved heat transfer surface. Int J Heat Mass Transf. 2021;179(3):121663. doi:10.1016/j.ijheatmasstransfer.2021.121663. [Google Scholar] [CrossRef]
18. Zhang C, Sun XQ, Han ZW, Li XM, Dong JX. Energy saving potential analysis of two-phase immersion cooling system with multi-mode condenser. Appl Therm Eng. 2023;219(6481):119614. doi:10.1016/j.applthermaleng.2022.119614. [Google Scholar] [CrossRef]
19. Kanbur BB, Wu C, Fan S, Duan F. System-level experimental investigations of the direct immersion cooling data center units with thermodynamic and thermoeconomic assessments. Energy. 2021;217:119373. doi:10.1016/j.energy.2020.119373. [Google Scholar] [CrossRef]
20. Sundin DW, Sponholtz S. Thermal management of Li-ion batteries with singlephase liquid immersion cooling. IEEE Open J Veh Technol. 2020;1:82–92. doi:10.1109/OJVT.2020.2972541. [Google Scholar] [CrossRef]
21. Zhang Y, Zhao Y, Dai S, Nie B, Ma H, Li J, et al. Cooling technologies for data centres and telecommunication base stations–A comprehensive review. J Clean Prod. 2022;334:130280. doi:10.1016/j.jclepro.2021.130280. [Google Scholar] [CrossRef]
22. Chen X, Huang YP, Xu SJ, Bao CJ, Zhong YF, Chen YP, et al. Thermal performance evaluation of electronic fluorinated liquids for single-phase immersion liquid cooling. Int J Heat Mass Transf. 2024;220:124951. doi:10.1016/j.ijheatmasstransfer.2023.124951. [Google Scholar] [CrossRef]
23. Akram M, Ala’yed O, Saadeh R, Qazza A, Obalalu AM, Khan U, et al. Exploring the dynamic behavior of the two-phase model in radiative non-Newtonian nanofluid flow with Hall current and ion slip effects. J Radiat Res Appl Sci. 2024;17(4):101112. doi:10.1016/j.jrras.2024.101112. [Google Scholar] [CrossRef]
24. Wen S, Chen G, Wu Q, Liu Y. Simulation study on nanofluid heat transfer in immersion liquid-cooled server. Appl Sci. 2024;13(13):7575. [Google Scholar]
25. Jithin KV, Rajesh PK. Numerical analysis of single-phase liquid immersion cooling for lithium-ion battery thermal management using different dielectric fluids. Int J Heat Mass Transf. 2022;188(1–2):122608. doi:10.1016/j.ijheatmasstransfer.2022.122608. [Google Scholar] [CrossRef]
26. Shrigondekar H, Lin YC, Wang CC. Investigations on performance of single-phase immersion cooling system. Int J Heat Mass Transf. 2023;206(22):123961. doi:10.1016/j.ijheatmasstransfer.2023.123961. [Google Scholar] [CrossRef]
27. Roe C, Feng XN, White G, Li RH, Wang HB, Rui XY, et al. Immersion cooling for lithium-ion batteries—a review. J Power Sour. 2022;525(2):231094. doi:10.1016/j.jpowsour.2022.231094. [Google Scholar] [CrossRef]
28. Luo QY, Wang CH, Wu CL. Study on heat transfer performance of immersion system based on SiC/white mineral oil composite nanofluids. Int J Therm Sci. 2023;187(6481):108203. doi:10.1016/j.ijthermalsci.2023.108203. [Google Scholar] [CrossRef]
29. Shah JM, Padmanaban K, Singh H, Asokan SD, Saini S, Agonafer D. Evaluating the reliability of passive server components for single-phase immersion cooling. J Electron Packag. 2021;144(2):021109. doi:10.1115/1.4052536. [Google Scholar] [CrossRef]
30. Saylor JR, Avram BC, Lee TY, Simon TW, Tong W, Wu PS. Fluid selection and property effects in single- and two-phase immersion cooling (of electronic components). IEEE Trans Compon Hybrids Manuf Technol. 1988;11(4):557–65. doi:10.1109/33.16697. [Google Scholar] [CrossRef]
31. Siriwardana J, Jayasekara S, Halgamuge SK. Potential of air-side economizers for data center cooling: a case study for key Australian cities. Appl Energy. 2013;104:207–19. doi:10.1016/j.apenergy.2012.10.046. [Google Scholar] [CrossRef]
32. Huang YP, Ge JL, Chen YP, Zhang CB. Natural and forced convection heat transfer characteristics of single-phase immersion cooling systems for data centers. Int J Heat Mass Transf. 2023;207(6481):124023. doi:10.1016/j.ijheatmasstransfer.2023.124023. [Google Scholar] [CrossRef]
33. Misra PA, Manousakis I, Choukse E, Jalili M, Goiri I, Raniwala A, et al. Overclocking in immersion-cooled datacenters. IEEE Micro. 2022;42(4):10–7. doi:10.1109/MM.2022.3163107. [Google Scholar] [CrossRef]
34. Muneeshwaran M, Lin YC, Wang CC. Performance analysis of single-phase immersion cooling system of data center using FC-40 dielectric fluid. Int Commun Heat Mass Transf. 2023;145(1):106843. doi:10.1016/j.icheatmasstransfer.2023.106843. [Google Scholar] [CrossRef]
35. Takahashi K, Miyazato I, Maeda S, Takahashi L. Designing transformer oil immersion cooling servers for machine learning and first principle calculations. PLoS One. 2022;17(5):e0266880. doi:10.1371/journal.pone.0266880. [Google Scholar] [PubMed] [CrossRef]
36. MirhoseiniNejad S, Moazamigoodarzi H, Badawy G, Down DG. Joint data center cooling and workload management: a thermal-aware approach. Futur Gener Comp Syst. 2020;104(8):174–86. doi:10.1016/j.future.2019.10.040. [Google Scholar] [CrossRef]
37. Patil MS, Seo JH, Lee MY. A novel dielectric fluid immersion cooling technology for Li-ion battery thermal management. Energy Convers Manag. 2021;229(14):113715. doi:10.1016/j.enconman.2020.113715. [Google Scholar] [CrossRef]
38. Taji SG, Parishwad GV, Sane NK. Enhanced performance of horizontal rectangular fin array heat sink using assisting mode of mixed convection. Int J Heat Mass Transf. 2014;72:250–9. doi:10.1016/j.ijheatmasstransfer.2014.01.012. [Google Scholar] [CrossRef]
39. Luo Q, Wang C, Wen H, Liu L. Research and optimization of thermophysical properties of sic oil-based nanofluids for data center immersion cooling. Int Commun Heat Mass Transf. 2022;131(6):105863. doi:10.1016/j.icheatmasstransfer.2021.105863. [Google Scholar] [CrossRef]
40. Wu HH, Hsiao YY, Huang HS, Tang P-H, Chen S-L. A practical plate-fin heat sink model. Appl Therm Eng. 2011;31(5):984–92. doi:10.1016/j.applthermaleng.2010.10.014. [Google Scholar] [CrossRef]
41. Elsayed ML, Mesalhy O, Kizito JP, Leland QH, Chow LC. Performance of a guided plate heat sink at high altitude. Int J Heat Mass Transf. 2020;147(1):118926. doi:10.1016/j.ijheatmasstransfer.2019.118926. [Google Scholar] [CrossRef]
42. Tari I, Mehrtash M. Natural convection heat transfer from inclined plate-fin heat sinks. Int J Heat Mass Transf. 2013;56(1–2):574–93. doi:10.1016/j.ijheatmasstransfer.2012.08.050. [Google Scholar] [CrossRef]
43. Saini S, Wagh T, Bansode P, Shahi P, Herring J, Lamotte-Dawaghreh J, et al. A numerical study on multi-objective design optimization of heat sinks for forced and natural convection cooling of immersion-cooled servers. J Enhan Heat Transf. 2022;29(8):15–35. doi:10.1615/JEnhHeatTransf.2022043805. [Google Scholar] [CrossRef]
44. Yu SH, Lee KS, Yook SJ. Natural convection around a radial heat sink. Int J Heat Mass Transf. 2010;53(13–14):2935–8. doi:10.1016/j.ijheatmasstransfer.2010.02.032. [Google Scholar] [CrossRef]
Cite This Article
 Copyright © 2025 The Author(s). Published by Tech Science Press.
This work is licensed under a Creative Commons Attribution 4.0 International License , which permits unrestricted use, distribution, and reproduction in any medium, provided the original work is properly cited.
 Downloads
 Citation Tools