
 Submit a Paper
 Propose a Special lssue
 Open Access
ARTICLE
Modeling and Experimental Study of an Open Two-Phase Loop Driven by Osmotic Pressure and Capillary Force
1 National Key Laboratory of Spacecraft Thermal Control, Beijing Institute of Spacecraft System Engineering, China Academy of Space Technology, Beijing, 100094, China
2 School of Aeronautical Science and Engineering, Beihang University, Beijing, 100083, China
3 School of Energy and Environment Engineering, University of Science and Technology Beijing, Beijing, 100083, China
* Corresponding Author: Hongxing Zhang. Email:
(This article belongs to the Special Issue: Recent Advances in Loop Heat Pipe)
Frontiers in Heat and Mass Transfer 2025, 23(1), 55-70. https://doi.org/10.32604/fhmt.2024.057933
Received 31 August 2024; Accepted 07 November 2024; Issue published 26 February 2025
 View Full Text
 Download PDF
Abstract
As space technology advances, thermal control systems must effectively collect and dissipate heat from distributed, multi-source environments. Loop heat pipe is a highly reliable two-phase heat transfer component, but it has several limitations when addressing multi-source heat dissipation. Inspired by the transport and heat dissipation system of plants, large trees achieve stable and efficient liquid supply under the influence of two driving forces: capillary force during transpiration in the leaves (pull) and root pressure generated by osmotic pressure in the roots (push). The root pressure provides an effective liquid supply with a driving force exceeding 2 MPa, far greater than the driving force in conventional capillary-pumped two-phase loops. Research has shown that osmotic heat pipes offer a powerful driving force, and combining osmotic pressure with capillary force has significant advantages. Therefore, this paper designs a multi-evaporator, dual-drive two-phase loop, using both osmotic pressure and capillary force to solve the multi-source heat dissipation challenge. First, a transmembrane water flux model for the osmotic pressure-driven device was established to predict the maximum heat transfer capacity of the dual-drive two-phase loop. Then, an experimental setup for a multi-evaporator “osmotic pressure + capillary force” dual-drive two-phase loop was constructed, capable of transferring at least 235 W of power under a reverse gravity condition of 20 m. The study also analyzed the effects of reverse gravity height, heat load distribution among the three evaporators, startup sequence, and varying branch resistances on the performance of the dual-drive two-phase loop.Keywords
With the advancement of space technology, the integration level of spacecraft payloads continues to increase, requiring thermal control systems to efficiently manage heat collection and dissipation across distributed and multi-device setups. As the functionality and performance of spacecraft payloads improve, both number of heat sources and heat flux are rising, necessitating an integrated thermal design approach for multiple payloads and the platform. Consequently, it is crucial to develop effective methods for heat collection, transfer, and dissipation that address the challenge of distributed, high heat flux, and multiple heat sources [1,2].
Loop heat pipe is a passive two-phase heat transfer component known for its high reliability, strong heat transfer capacity, and long heat transfer distance [3–5]. When addressing the issue of multiple heat sources, loop heat pipe with multiple parallel evaporators is often used [6–10]. However, existing studies have found that the number of parallel evaporators in a loop heat pipe is limited [11,12] (typically no more than four), and the parallel branches can interfere with each other. Additionally, the failure of a single evaporator can lead to the entire loop failing [13–15]. Therefore, relying solely on multi-evaporator loop heat pipe is insufficient to effectively address the challenge of distributed, high heat flux, multiple heat sources systems [16–18].
Inspired by the transport and heat dissipation system of plants, large trees achieve stable and efficient liquid supply under the influence of two driving forces: capillary force during transpiration in the leaves (pull) and root pressure generated by osmotic pressure in the roots (push). The root pressure provides an effective liquid supply with a driving force exceeding 2 MPa, far greater than the driving force in conventional capillary-pumped two-phase loops. Hughes Aircraft Company [19] previously proposed the concept of an osmotic heat pipe. Compared to traditional capillary-pumped two-phase loops, where capillary forces from wicks with a diameter of 1 µm provide a driving force of 96 kPa, even a 0.5 mol/L NaCl solution can easily generate an osmotic pressure exceeding 2.5 MPa. This significantly enhances the driving force, thereby improving heat transfer capacity, heat transfer distance, and other thermal performance [20,21].
Therefore, this paper combines capillary force and osmotic pressure together as driving forces, adopting a “capillary force + osmotic pressure” dual-drive approach to address the challenges of distributed multi-heat-source systems.
Compared to loop heat pipes, the dual-driven loop offers the following advantages:
(1) It utilizes a dual-drive system, which significantly increases the driving force.
(2) The effect of osmotic pressure ensures that the reservoir remains fully filled with liquid, providing a stable and reliable liquid supply. This makes the evaporator easier to start and results in more stable operation.
(3) It helps mitigate the issue of interference between multiple evaporators.
2 Design of the “Osmotic Pressure + Capillary Force” Dual-Drive Open Two-Phase Loop
In this study, an open system for the “osmotic pressure + capillary force” dual-drive two-phase loop was designed and constructed, as illustrated in Fig. 1. The primary components of the two-phase loop include an osmotic pressure-driven component, liquid lines, vapor lines, a reservoir, and three copper capillary wick evaporators arranged in parallel. The osmotic pressure driven component is positioned at the bottom of the dual-drive two-phase loop, while the evaporators and reservoir are placed at the top. The height difference between the evaporators and the osmotic pressure-driven component is 20 m, meaning the dual-drive two-phase loop operates with an anti-gravity height of 20 m. Since the system designed in this paper is an open-loop system, the vapor line is quite short, approximately 50 mm. Once the vapor exits the evaporator and enters the vapor line, it is directly vented to the atmosphere. The liquid line is about 25 m long. Both the liquid and vapor line are made of stainless steel 316L, with an inner diameter of 4 mm.
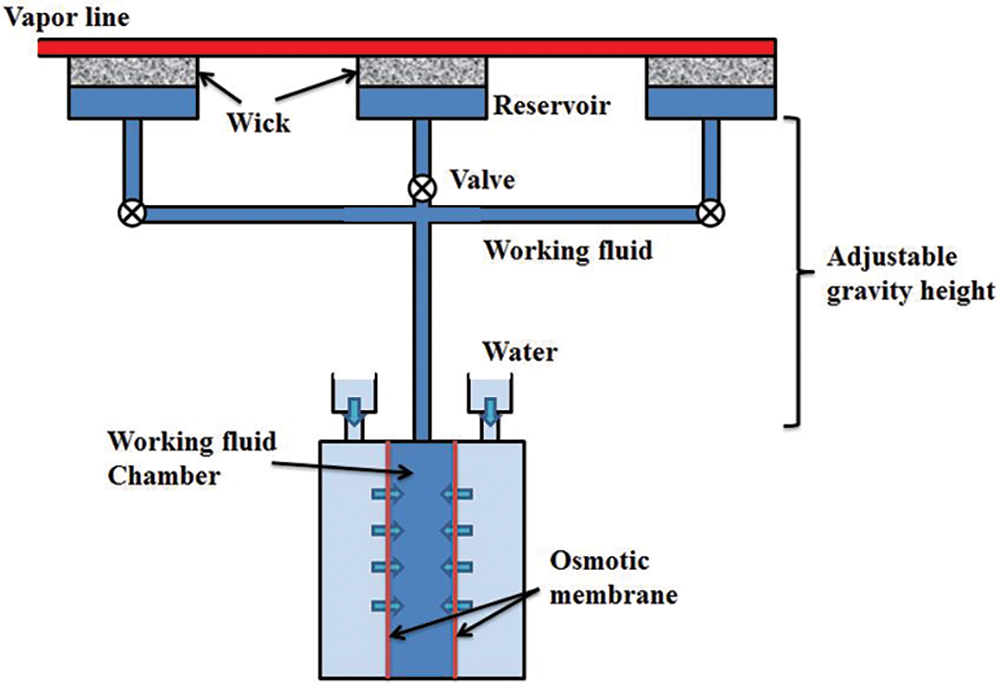
Figure 1: Structural diagram of the “osmotic pressure + capillary force” dual-drive two-phase loop
2.2 Design of the Osmotic Pressure-Driven Component
The osmotic pressure-driven component is the core element of the dual-drive two-phase loop, primarily responsible for providing the osmotic pressure driving force and enabling liquid supply against gravity. Its schematic diagram is shown in Fig. 2a, and its structural diagram is presented in Fig. 2b. The forward osmosis membrane used in this study is selectively permeable, allowing only water molecules from the solution to pass through, while blocking electrolyte ions and large molecules.
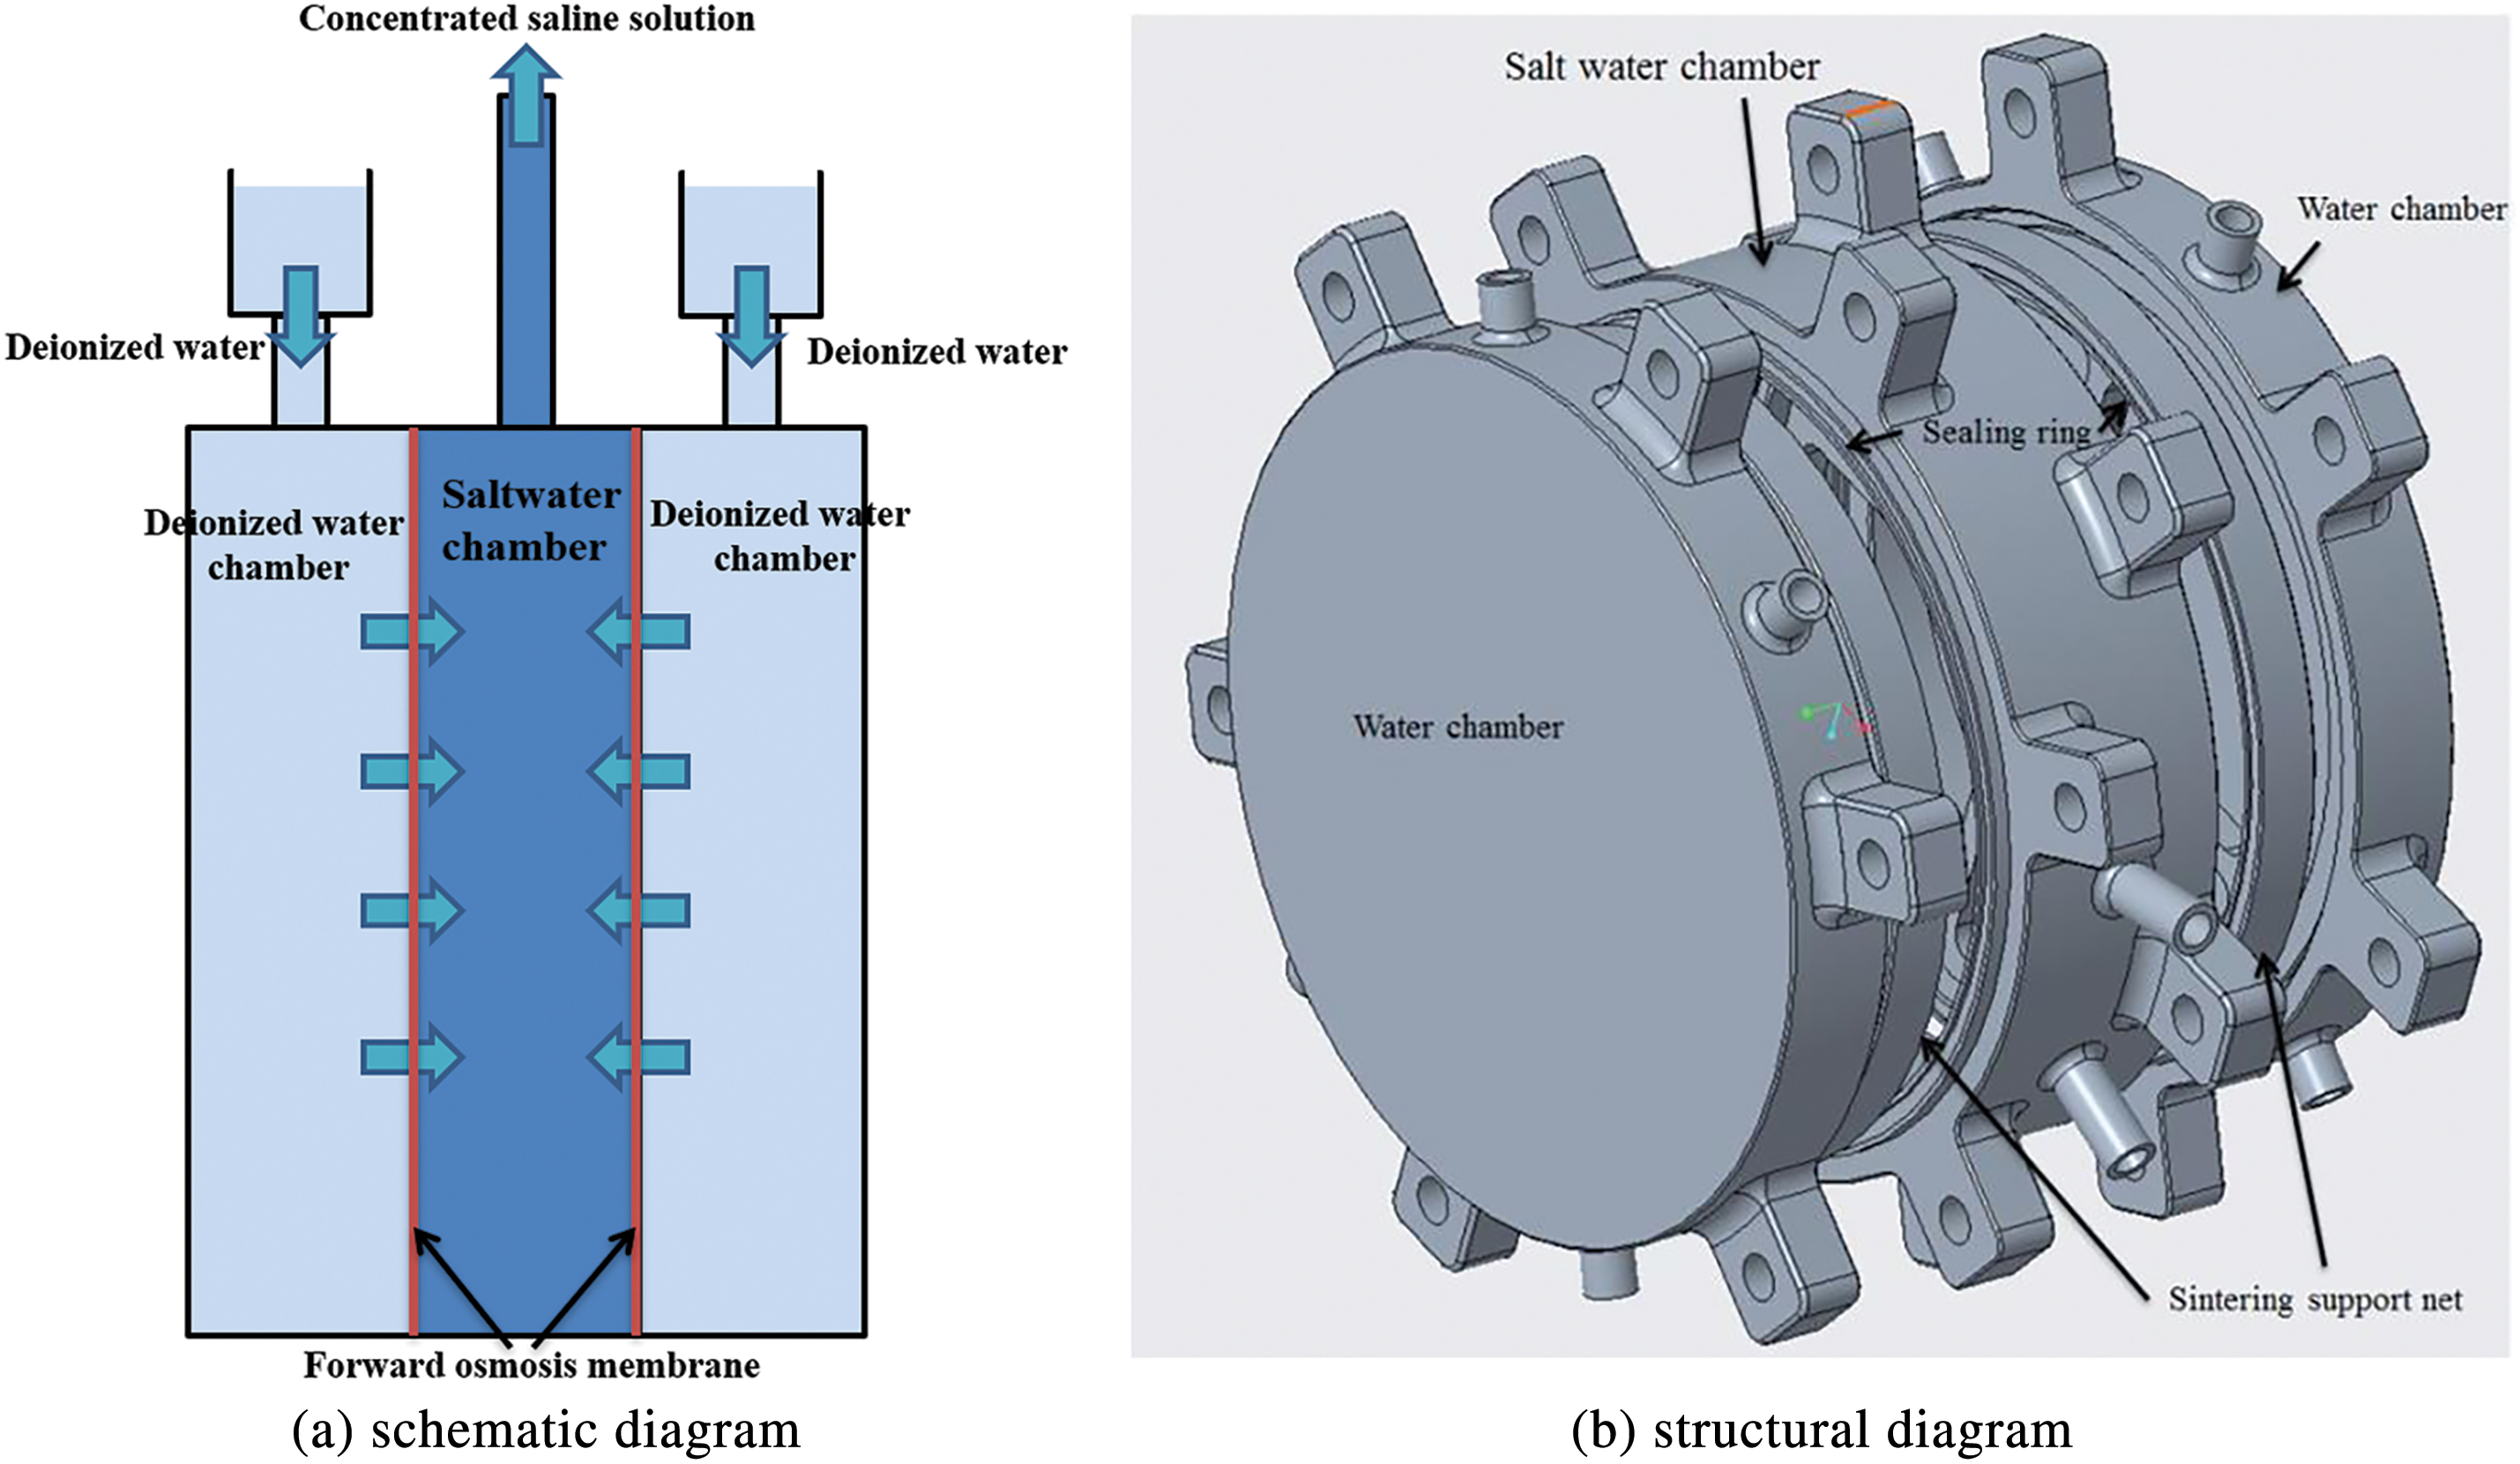
Figure 2: The osmotic pressure-driven component
Water is a common solvent with a high Dunbar quality factor above 100°C. NaCl solution can generate significant osmotic pressure and is safe for both humans and the environment. Therefore, this study selects NaCl solution as the working fluid for the dual-drive two-phase loop.
Due to the lower concentration in the deionized water chambers on either side compared to the central driving fluid chamber, water molecules spontaneously diffuse through the forward osmosis membrane into the central saline chamber, increasing the mass of the central solution. This increase causes the solution to rise against gravity, supplying liquid to the evaporator.
Because the pressure in the central chamber is very high, it can deform or tear the membrane. To prevent this, a sintered metal mesh is placed near the membrane inside the water chambers, providing additional support to the membrane. This study uses the cellulose triacetate (CTA) forward osmosis membrane developed and produced by Hydration Technology Innovations (HTI) [22]. The active layer of the osmotic membrane is only about 50 nanometers thick, which reduces resistance during water flow and enhances the permeability of the forward osmosis membrane.
In the experiment, the total area of the two membranes used reached 286 cm2. The salt water chamber is a cylinder with a diameter of 135 mm and a height of 15 mm, while the deionized water chamber is also a cylinder with a diameter of 135 mm but a height of 5 mm. The chambers are fastened together with bolts, with several Teflon sealing rings and two forward osmosis membranes sandwiched between them.
The amount of water supplied to the evaporators by the osmotic pressure-driven component within time determines the maximum heat transfer capacity of the dual-drive two-phase loop. The maximum osmotic pressure that the component can provide determines the maximum heat transfer distance and the height against gravity. The osmotic pressure generated by the device is primarily dependent on the solution concentration, while the water flux is influenced by factors such as solution concentration, membrane area, concentration polarization, and the pore size of the supporting mesh.
2.3 Design of Copper Wick Evaporator
The evaporator’s function is to provide a location for the phase change of the working fluid and to generate capillary force. The structure of the copper capillary wick evaporator used in the experiment is shown in Fig. 3. The parameters of the copper capillary wick evaporator are shown in Table 1. The working fluid is first filled into the reservoir via the liquid line, then enters the capillary wick. The evaporator has a left-right structure, and to enhance liquid supply, a 3 mm thick secondary wick is placed below the wick. This secondary wick has a higher permeability than the wick, allowing the working fluid to first fill the reservoir and then spread laterally across the secondary wick before moving upward into the wick. Above the wick is a ribbed top cover made of 316L stainless steel, which is in direct contact with the wick. A heater is placed on top of the cover, with thermal grease applied between the heater and the cover to improve heat transfer.
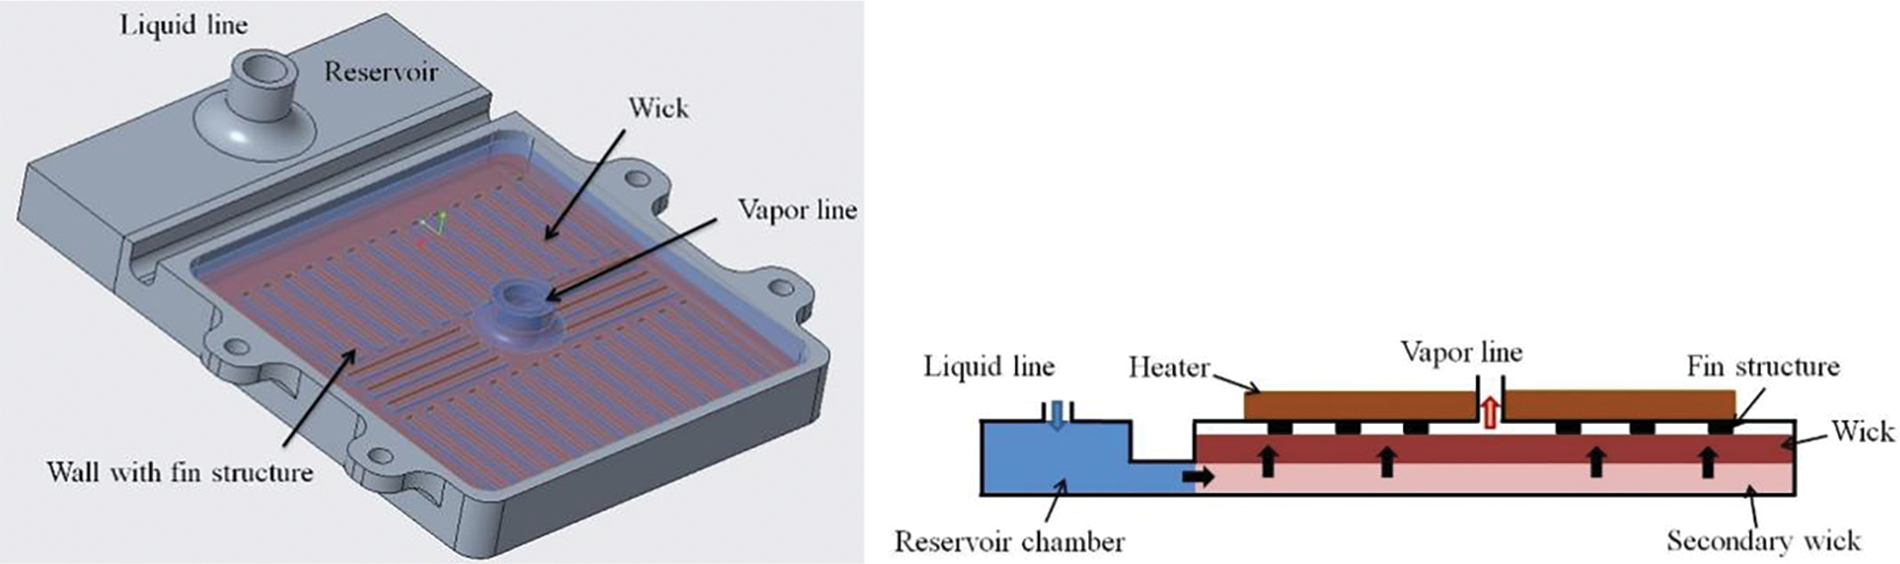
Figure 3: Diagram of the copper capillary wick evaporator

3 Modeling and Analysis of Osmotic Pressure-Driven Component Liquid Supply Performance
The water flux of the osmotic pressure-driven component determines the maximum heat transfer capability of a dual-drive two-phase loop. Therefore, it is essential to develop an accurate model for osmotic membrane water flux to predict both the maximum heat transfer capacity of the dual-drive two-phase loop and the decline in water flux over time. This will help estimate the duration for which the osmotic pressure-driven component can stably supply liquid to the evaporator.
In osmotic phenomena, if the effects of concentration polarization are not considered, the water flux per unit area is typically calculated using the following formula [23]:
In this formula,
The accuracy of the above formula is high when the water flux is small, indicating a lower concentration in the saline solution chamber. As the water flux increases, the effects of concentration polarization become more pronounced, including both internal concentration polarization (ICP) and external concentration polarization (ECP). Research indicates that, during forward osmosis, the impact of ICP is significantly greater than that of ECP [24–26]. ICP occurs mainly because most forward osmosis membranes have an asymmetric structure, with a thin active layer supported by a thick, porous polymer and fabric support layer, leading to solute accumulation within the support layer. In this study, the membrane’s active layer faces the draw side, so water flows through the active layer from the feed side, while salts are retained within the membrane support layer, causing a concentration polarization effect and a reduction in water flux. ECP occurs because the water entering the solution across the membrane dilutes the draw side solution, leading to a decrease in water flux. ECP can be simulated using membrane theory to quantify its negative effects on osmotic driving force and water flux [27,28].
First, an exponential term correction equation for the concentration and dilution effects in ECP is introduced. The exponential term here represents the ECP modulus on both the dilute side and the concentrated side. It is a function dependent on water flux and the mass transfer coefficient
In this equation,
In this equation,
The average mass transfer coefficient
Additionally, since an asymmetric forward osmosis membrane is used in this experiment, the effect of ICP on water flux
Gerstandt [30] introduced the concept of membrane structural parameters:
The exponential term in Eq. (10) represents a correction factor for the effect of ICP on water flux. Therefore, Eq. (10) accounts for the impacts of both ECP and ICP, providing higher accuracy in calculations.
Reverse Solute Diffusion (RSD) refers to the phenomenon where solutes diffuse from a high-concentration solution to a low-concentration solution due to the concentration gradient, as forward osmosis membranes cannot block 100% of the solutes (with typical rejection rates of 97%–98%). In forward osmosis, RSD is often considered a disadvantage because it reduces the osmotic pressure generated by the high-concentration solution, increases the concentration of the feed solution, and shortens the lifespan of the osmotic pressure-driven component [31,32].
Several researchers have predicted the reverse solute diffusion flux
It is necessary to first calculate
In this study, the working fluid used in the osmotic pressure-driven device was NaCl solution. The physical parameters required for calculations, such as osmotic pressure, solution density, dynamic viscosity, and diffusion coefficient, were all calculated and fitted using Oli Corporation’s Stream Analyzer software [35–38]. The pure water permeability coefficient of the membrane, A, was set to
3.4 Solution Process and Result Analysis
MATLAB was used as the computational tool, with the input variables being the initial concentrations
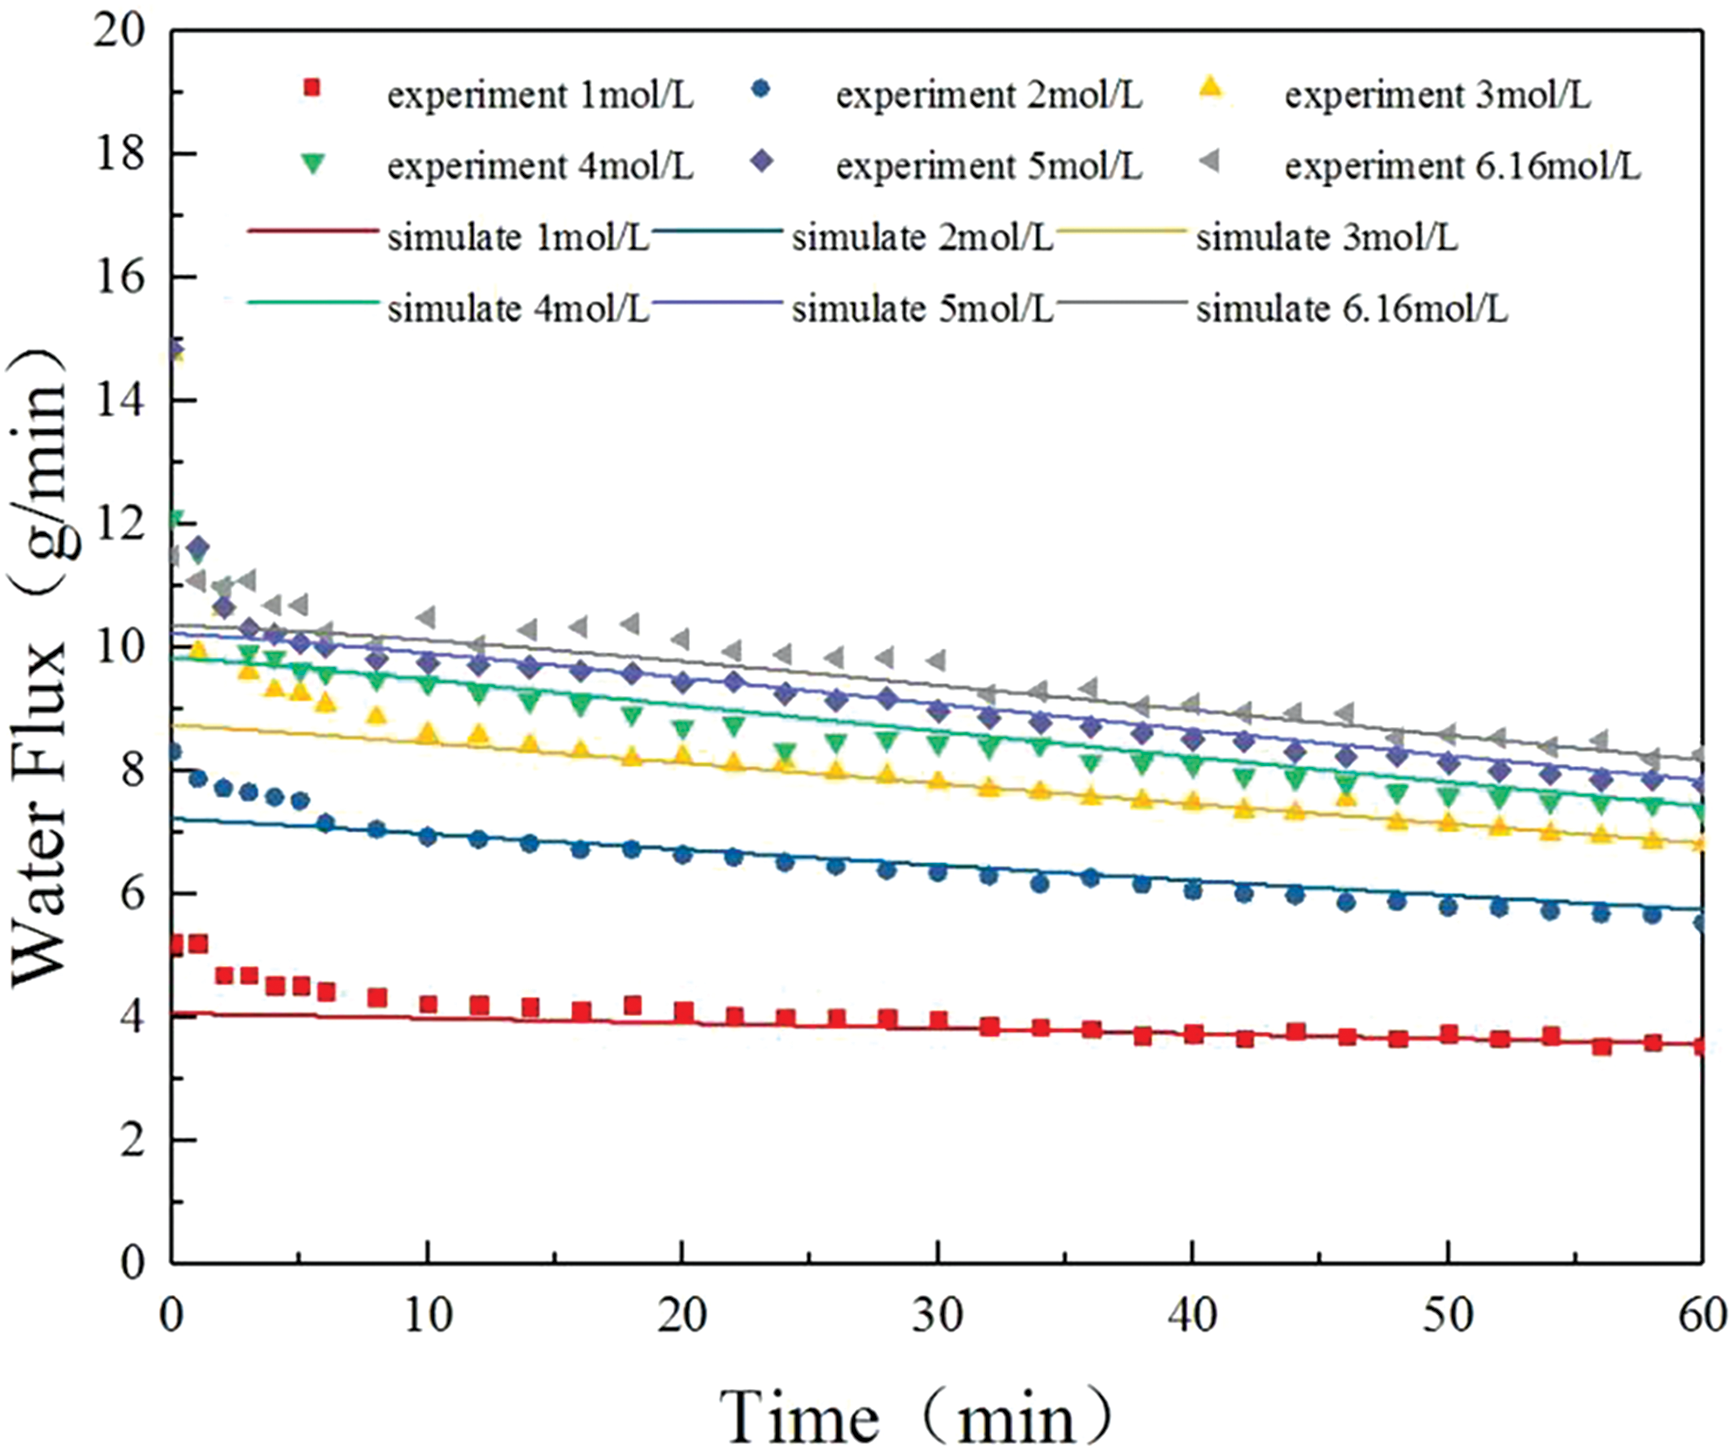
Figure 4: Graphs of water flux at different concentrations
As shown in the figure above, the experimental values closely match the simulated values. The increase in water flux from 3 mol/L to the saturated solution concentration is minimal, primarily due to the influence of ICP. Additionally, the feed solution to the evaporator causes a continuous decrease in the concentration within the salt water chamber, and the RSD causes solutes into the water chamber. These factors together result in a downward trend in water flux over time, with the rate of decline being almost identical between the 3 mol/L and saturated solution concentrations.
The model initially failed to simulate the abrupt drop in water flux, because the effect of concentration polarization was not significant immediately after the device was assembled. However, after 10 min, as the feed stabilized, the model was able to more accurately predict the water flux and its changing trend. Since the solvent evaporates in the evaporator while the solutes accumulate and cannot be discharged, a higher solution concentration is not necessarily better. In subsequent experiments, a 3 mol/L NaCl solution was selected. The model results can be used to calculate the theoretical maximum heat transfer value of the dual-driven two-phase loop, which is the latent heat absorbed when the entire feed solution from the osmotic pressure-driven component undergoes phase change in the evaporator, as given by the following equation:
The osmotic pressure greatly exceeds the resistance caused by gravity, the height against gravity has little effect on the heat transfer capacity of the dual-drive two-phase loop. The osmotic pressure-driven device can supply the evaporators with stable liquid flow even under experimental conditions with a 20 m reverse gravity.
4 Results and Analysis of the Anti-Gravity Experiment with Multiple Evaporators
First, the evaporator was positioned at the top of the loop, with the osmotic pressure-driven device at the bottom, creating a maximum anti-gravity height of 20 m between them. The ambient temperature during the experiment was 20°C, and the initial loading power applied to the evaporator was 56 W. After allowing the temperature to stabilize, the power was gradually increased several times until it reached 247 W, at which point the temperature spiked. The maximum stable power was approximately 235 W. The temperature variation curve during the anti-gravity operation of the evaporator is shown in Fig. 5.
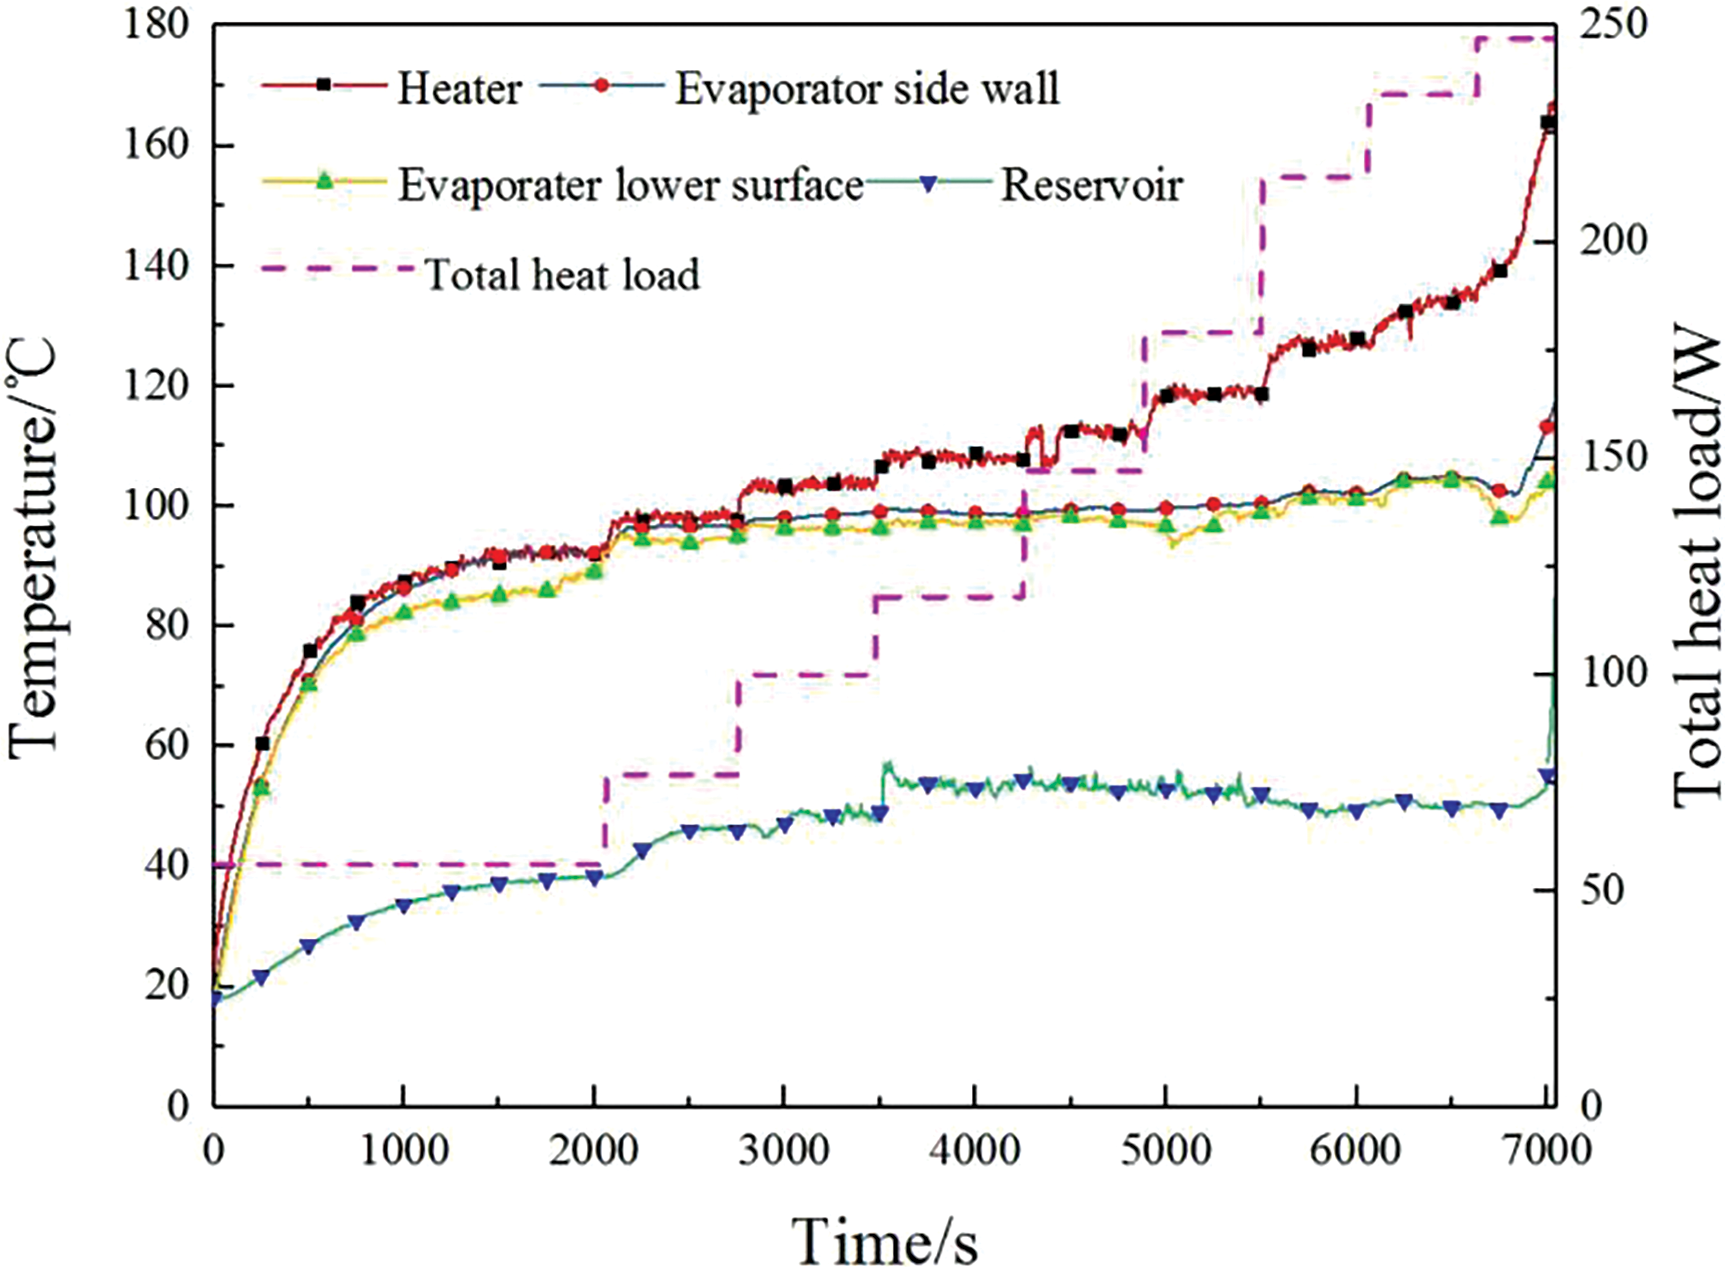
Figure 5: Temperature variation of the evaporator
From the figure above, it can be observed that after applying the initial loading power, the temperatures of the evaporator, heater, and reservoir in the dual-driven two-phase loop all rise and stabilize simultaneously. The temperature measurements on the evaporator show minimal variation and consistent trends. After startup, as power is further increased, the temperature of the heater changes most obviously. The evaporator temperature stabilizes around 100°C, while the liquid reservoir temperature remains steady near 50°C.
Before reaching the maximum loading power of the dual-driven two-phase loop, liquid continuously exits from the vapor pipe connected to the evaporator. The exit quality is less than 1, and the flow rate of the exiting liquid decreases as the loading power increases. At this stage, the evaporator operates relatively stably with minimal temperature fluctuations in the loop. When the loading power reaches 247 W, the heater experiences a temperature spike first, followed by the evaporator, and finally the liquid reservoir. This indicates that the loading power of the evaporator exceeds the supply capacity of the osmotic pressure-driven component. Initially, the liquid on the capillary wick surface of the evaporator evaporates to dryness, causing the heater temperature to spike. Subsequently, the evaporation of liquid within the capillary wick raises the evaporator temperature, eventually leading to the liquid reservoir transitioning to a two-phase state. Consequently, the temperature in the reservoir sharply rises from 50°C to 100°C.
Sun [23] suggested that when the loading power of the evaporator is too high, the heat leakage from the evaporator to the reservoir increases rapidly, causing the reservoir temperature to rise quickly and leading to a phase change of the working fluid, which results in a temperature spike. However, in this experiment, once the loading power exceeds 100 W, the temperature of the reservoir does not increase with the loading power. Additionally, the osmotic pressure-driven component continuously pumps the liquid working fluid into the reservoir, and the cooling effect of the incoming liquid stabilizes the reservoir temperature. Therefore, this study concludes that the temperature spike in the reservoir is not due to heat leakage from the evaporator but rather due to insufficient supply capacity.
The experiment with a single evaporator validated the maximum heat transfer capacity predicted by both the model and experimental results presented in Section 3 of this paper.
In the performance testing experiment of multiple evaporators in parallel, the study investigated the performance of dual-drive two-phase loop by applying both identical and varying power loads to the individual evaporators.
In the experiment, an initial power of 50 W was simultaneously applied to evaporators A, B, and C. The temperature variation curves for the three evaporators operating simultaneously are shown in Fig. 6, while the changes in power loading for the three evaporators during the experiment are detailed in Table 2.
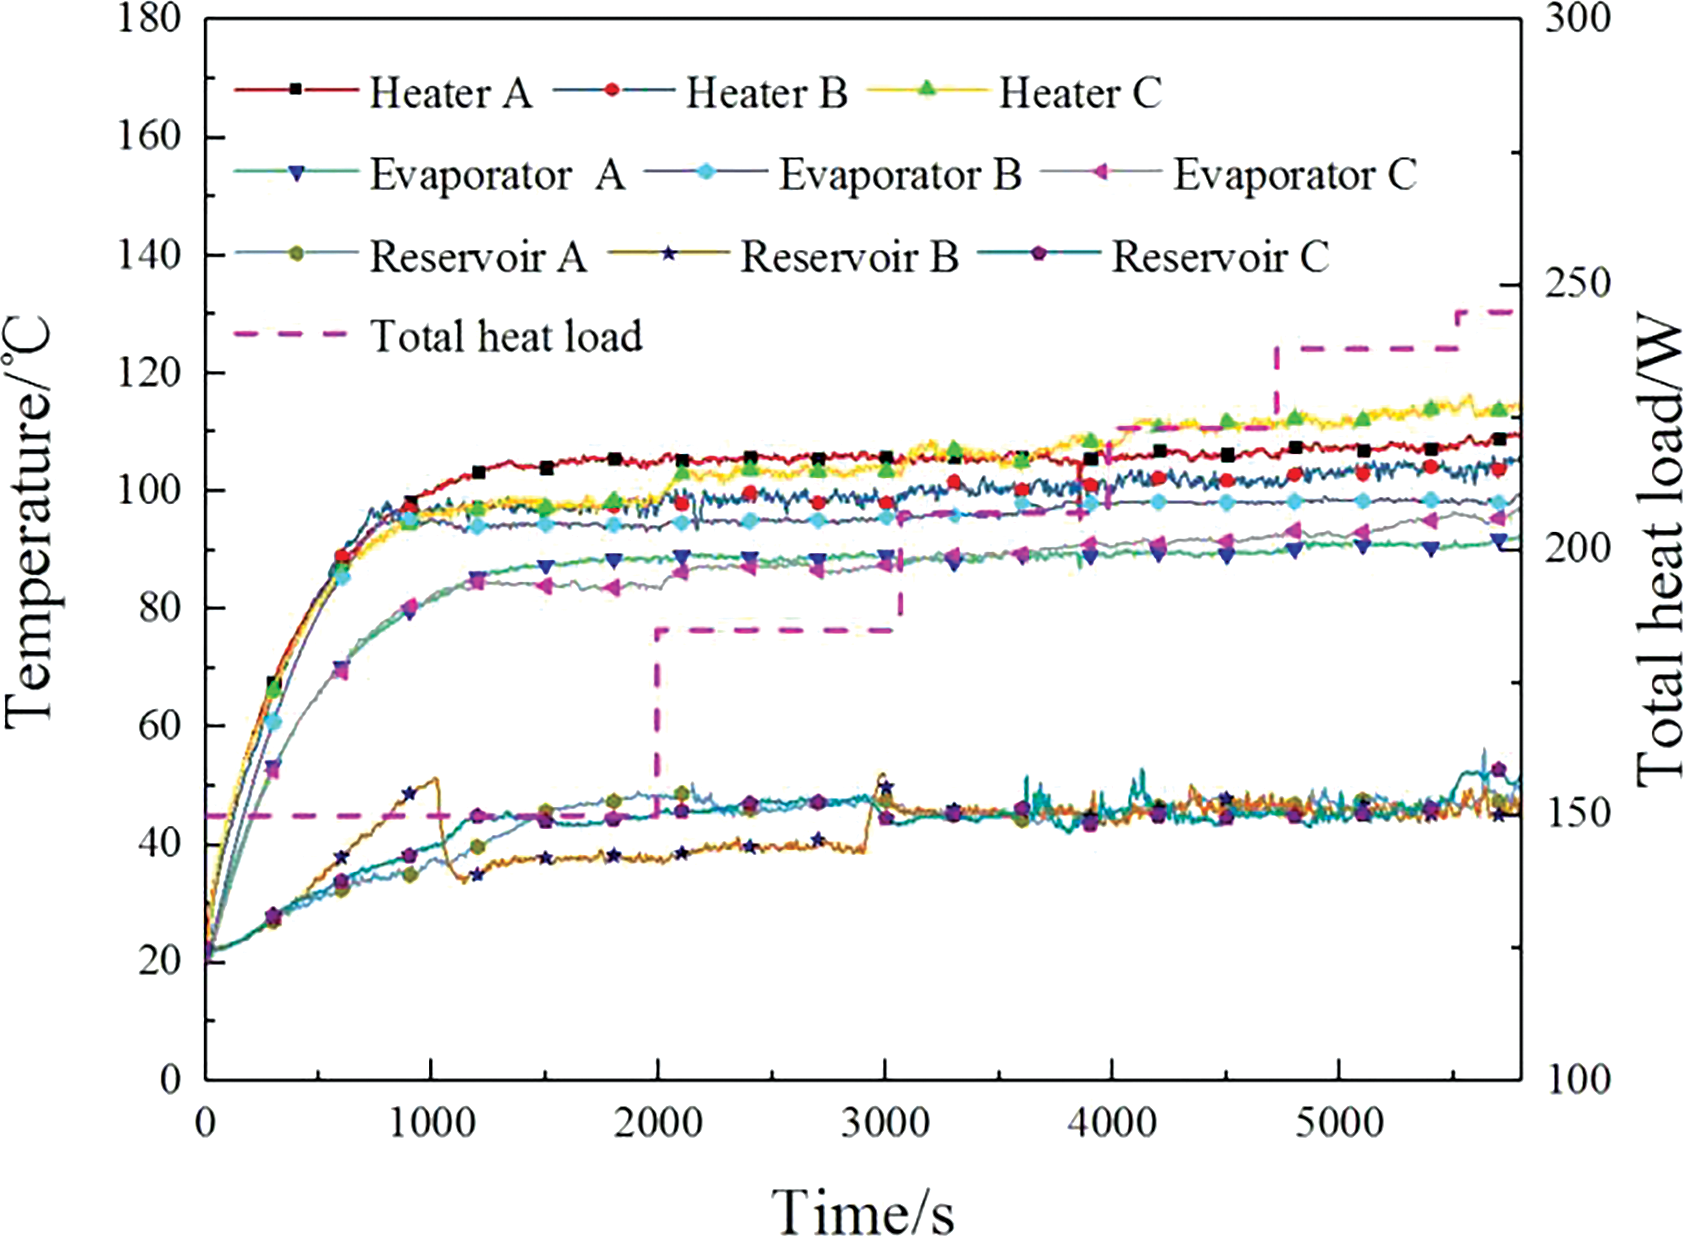
Figure 6: Temperature variation of the parallel evaporators

After allowing the temperatures of the three evaporators to stabilize, higher power was then applied to evaporators B and C, while the power to evaporator A was increased gradually. The three evaporators reached temperature equilibrium with a total heat power of 238 W, which is nearly the same as the maximum power that a single evaporator can reach. When the power was increased to 245 W, the temperature of evaporator C gradually rose and eventually spiked. The temperatures of the three liquid reservoirs did not exceed 55°C.
In traditional capillary pumped two-phase loops with multiple evaporators in parallel, the randomness of vapor-liquid distribution often makes it difficult to ensure that the reservoir and the evaporator wicks contain enough working fluid during startup, leading to startup failure. The dual-driven two-phase loop studied in this paper is typically able to start successfully, primarily because the osmotic pressure-driven components ensure that the parallel evaporators remain fully filled with liquid before startup. Once power is applied to the evaporators, there is sufficient working fluid available for evaporation to remove the heat.
Additionally, the experiment found that the maximum heat transfer capacity of the dual-drive two-phase loop does not increase with the number of evaporators. Instead, it is solely dependent on the water flux through the membrane.
During the experiment, the oxidation of the evaporators was quite severe, as shown in Fig. 7. The three evaporators shown above are from before the experiment, while those below are after the experiment. The figure also reveals significant salt accumulation on the evaporator surfaces and the casing. The presence of salt exacerbates the oxidation of copper, and the resulting copper oxides and verdigris can increase the resistance in the evaporator, thereby affecting the maximum power that can be loaded onto the evaporator in this loop.
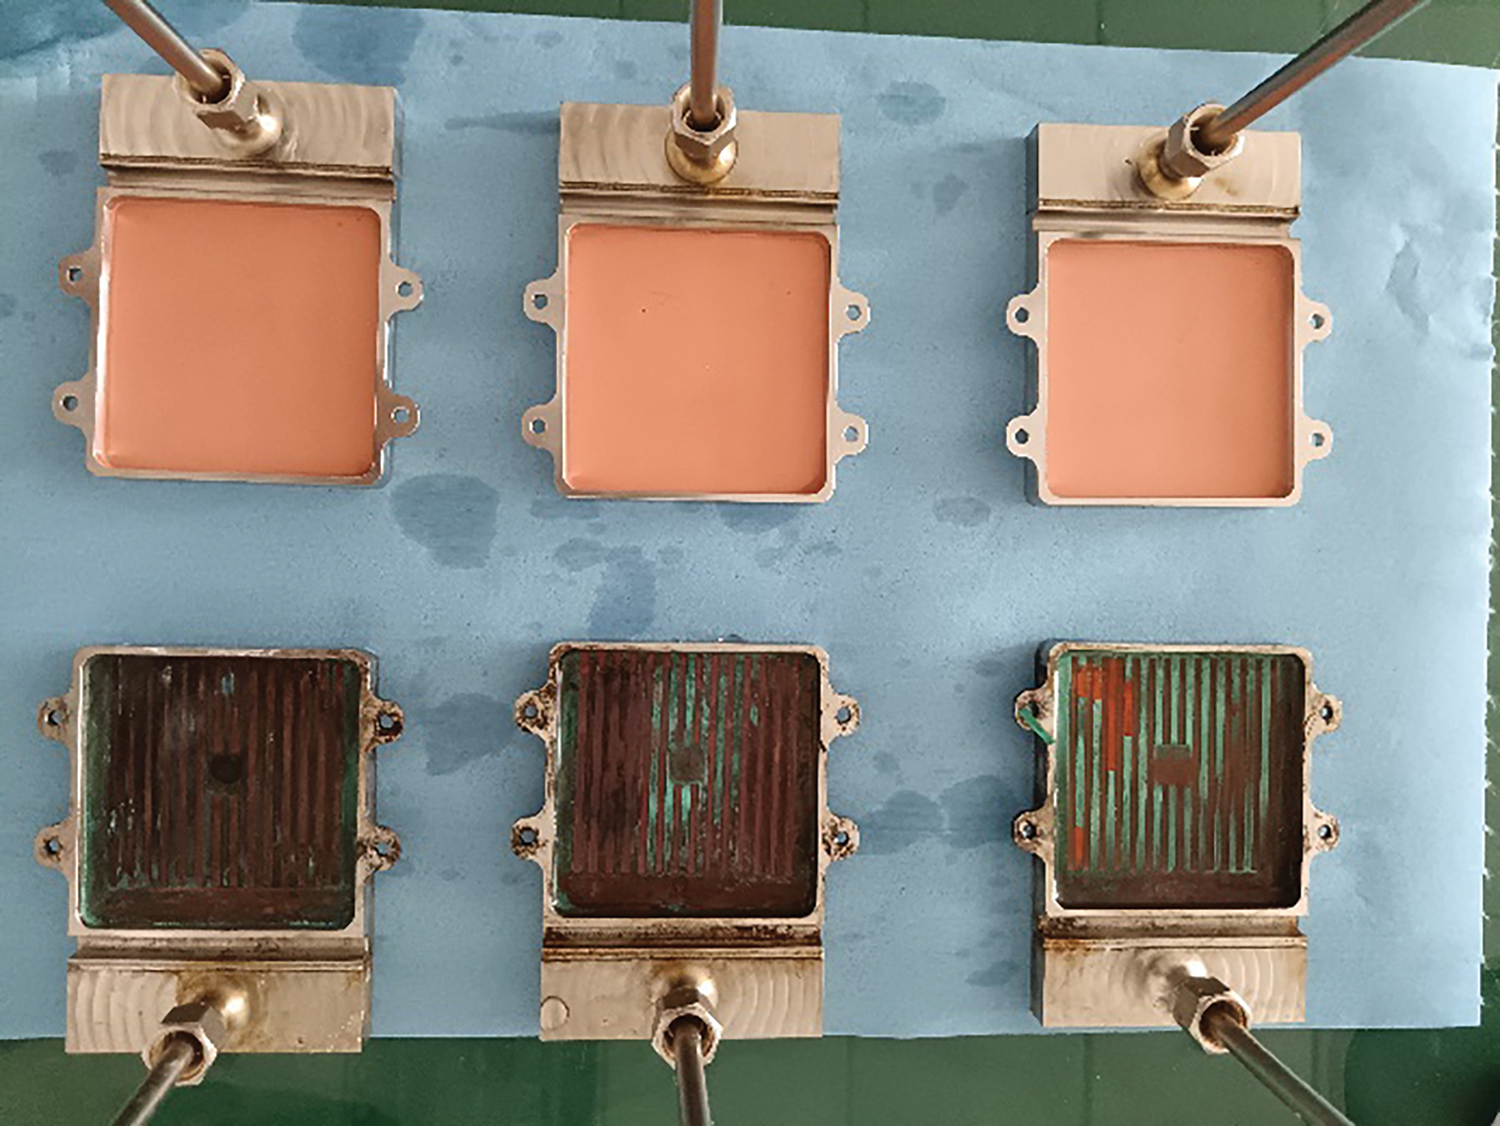
Figure 7: The oxidation of the evaporator
In the following experiment, power was first applied to a single evaporator to initiate its operation. Once it was started, power was then applied to the other two evaporators. Subsequently, different power was applied to each evaporator until the temperature of one evaporator spiked. The temperature variation curves for the three evaporators are shown in Fig. 8, and the changes in power loading for the three evaporators are detailed in Table 3.
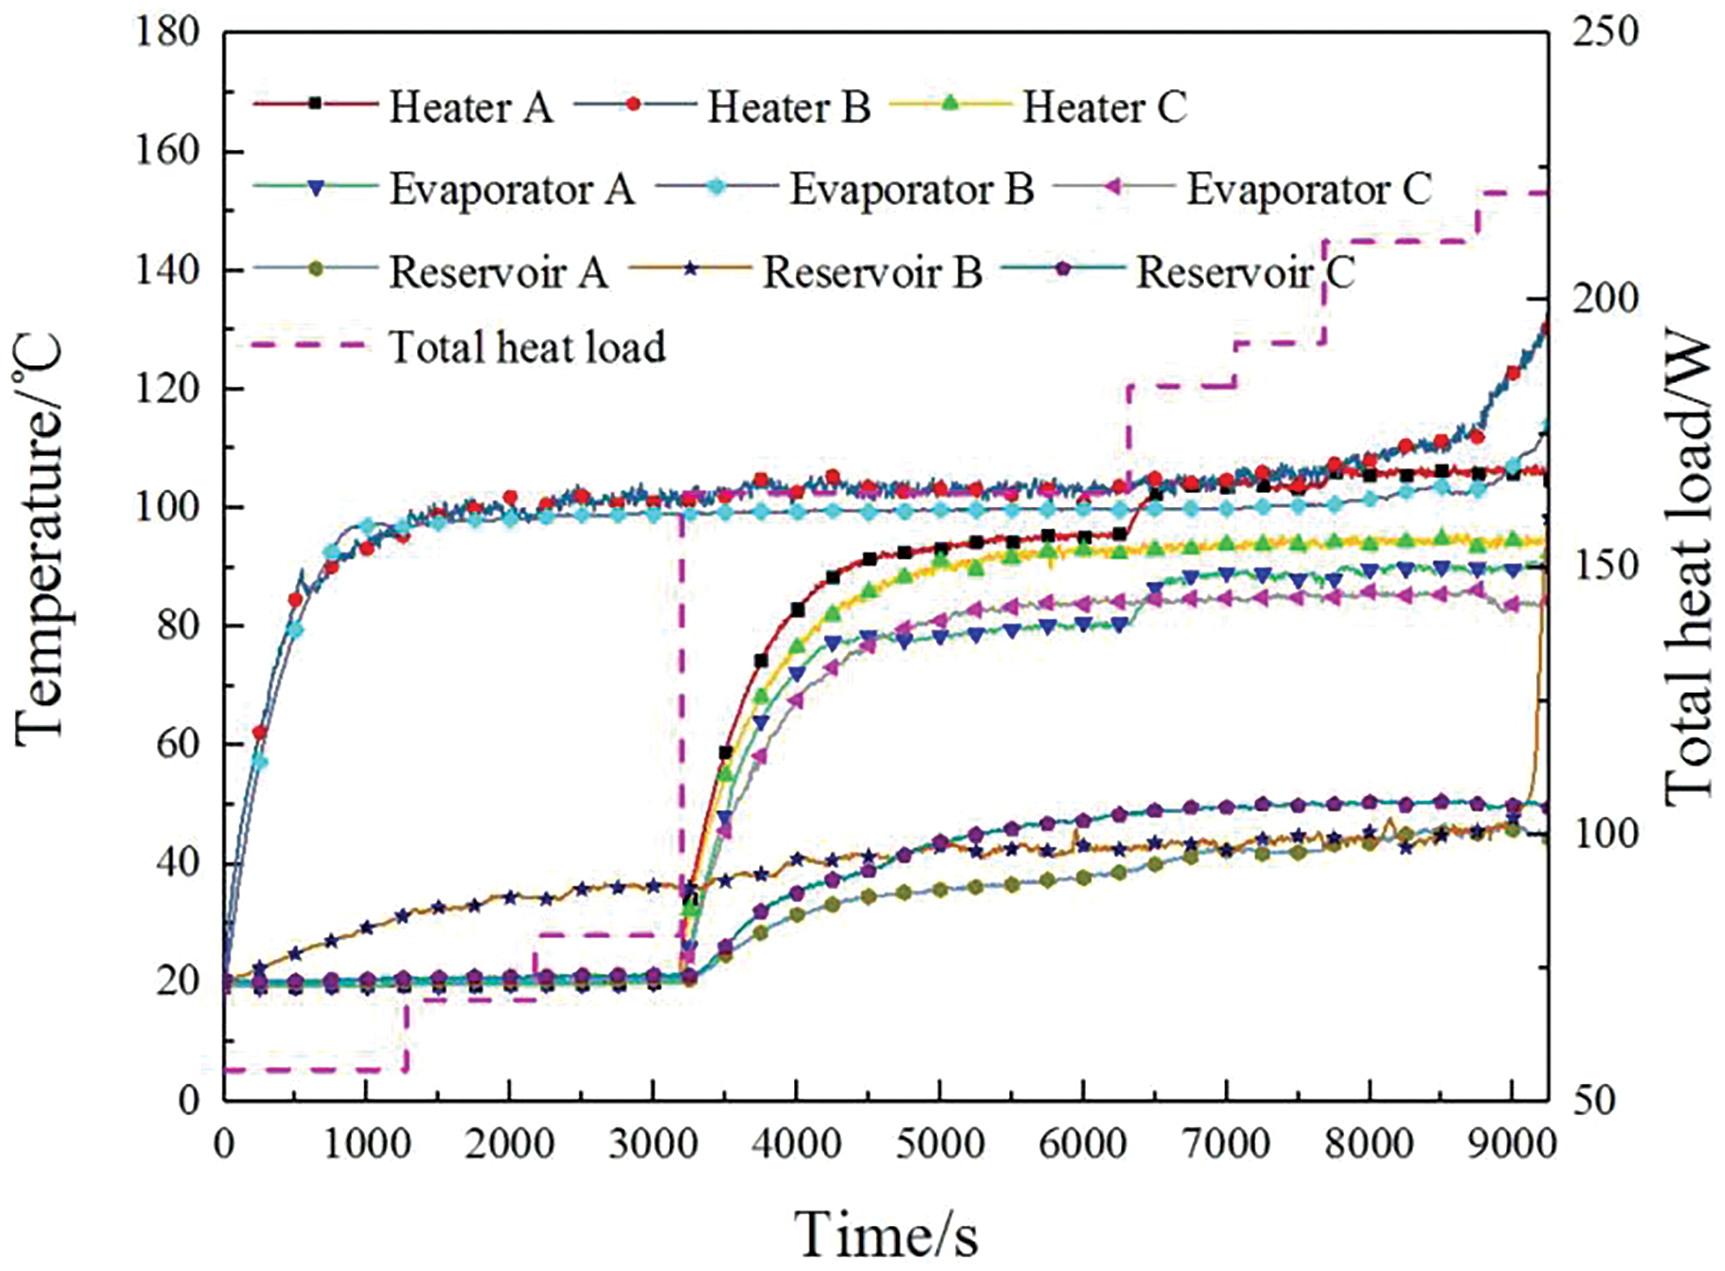
Figure 8: Temperature variation of the parallel evaporators

As shown in the figure, after applying power to evaporator B, the temperatures of the reservoir, heater, and evaporator in the B loop gradually increased until they stabilized. This process had no effect on the other two evaporators, A and C, whose reservoirs, heaters, and evaporators remained at ambient temperature. Therefore, during the startup process, there was no interference between the parallel evaporators.
Additionally, applying a higher power of 81 W to evaporator B still did not interfere with the other two evaporators. Subsequently, when low power was applied to evaporators A and C, the temperatures at various points in the loop increased and stabilized, successfully starting all three evaporators. The startup processes of evaporators A and C were similar to that of evaporator B, with evaporator B maintaining temperature balance throughout and no signs of mutual interference. However, when 118 W was applied to evaporator B, the heater and evaporator temperatures continued to rise without stabilizing, leading to a spike in the temperature of the reservoir.
Therefore, it is evident that there is almost no flow self-regulation among the three evaporators, and each branch operates independently. Even if the other two branches do not start, the liquid in the evaporators will continue to flow at the same rate as before, and the flow rate of the evaporator with applied power will not increase. In this experiment, the outlet quality is often less than 1 due to the osmotic pressure-driven device, which continuously pumps liquid into the evaporator. When the power applied to the evaporator is less than the heat absorbed by the evaporation flow rate, excess liquid will overflow at the evaporator outlet, resulting in quality that is not equal to 1. The outlet quality gradually increases with the increase in applied power to the evaporator; it starts at 0 when no power is applied and approaches 1 as the power approaches the limits of the heat transfer capability. The heat transfer limit of each branch is determined by the matching power for the given flow rate, unless changes in branch resistance alter the flow rate. During this process, capillary force does not play a significant role in flow regulation.
The role of capillary forces is not significant in this study for the following reasons:
(1) The capillary force generated by the evaporator is around 90 kPa, while the osmotic pressure produced by the solution is more than 10,000 kPa. Therefore, the influence of capillary forces on the system is limited compared to osmotic pressure.
(2) When the flow rate in the branch does not match the power loaded on the evaporator, two situations can occur: first, liquid may continuously overflow from the evaporator, and second, the evaporator may dry out completely. In the first case, the heating and evaporation occur away from the outer surface of the capillary wick, so no capillary force is generated. In the second case, direct drying also does not produce any capillary force. Thus, the key to enabling capillary forces to play a role is to match the supply flow rate with the power applied to the evaporator.
(3) Severe oxidation of the capillary wick can adversely affect its wettability.
This paper designed a two-phase loop driven by osmotic pressure and capillary force to address the thermal management challenges of distributed multi-heat source systems. By utilizing osmotic pressure, the circulation driving force of the loop heat pipe is enhanced, improving the operational stability of the system. A transmembrane water flux model for the osmotic pressure-driven device is established to predict the maximum heat transfer capacity of the two-phase loop. An experimental setup for a dual-drive two-phase loop was constructed to conduct experiments on reverse gravity flow and multi-evaporator flow distribution. Based on simulation results, experimental data, and theoretical analysis, the following conclusions can be drawn:
(1) The model used in this study can accurately predict the time-dependent water flux curves at different concentrations once the osmotic pressure-driven device achieves a stable supply. This model can serve as a valuable reference for the design and experimentation of dual-drive two-phase loop.
(2) The capillary force provided by the wick is limited, osmotic pressure is the primary driving force in the two-phase loop. Since the osmotic pressure greatly exceeds the resistance caused by gravity, the height against gravity has little effect on the heat transfer capacity of the dual-drive two-phase loop. The osmotic pressure-driven device can supply the evaporators with stable liquid flow even under experimental conditions with a 20-m reverse gravity.
(3) The total heat transfer capacity of the three evaporators in the experiment exceeds 235 W, with a single branch evaporator capable of handling up to 109 W.
(4) Adding multiple evaporators in parallel does not enhance the system’s overall heat transfer capacity. The maximum heat transfer capability of the two-phase loop is determined by the transmembrane water flux.
(5) During startup and operation, the three evaporators operate independently without any mutual interference.
In the future, experiments with 10 evaporators in parallel under 20 m of reverse gravity will be conducted. Additionally, there are plans to increase the membrane area in the osmotic pressure-driven device to enable it to transfer and dissipate over 1000 W of heat. We will also consider adding a condenser to create a closed-loop system. This configuration will enable the system to reuse the circulating working fluid, thereby addressing the heat dissipation issues caused by multiple heat sources in spacecraft and enhancing the reliability and lifespan of the device.
Acknowledgement: The author thanks the National Key Laboratory of Spacecraft Thermal Control and Dr. Hongxing Zhang.
Funding Statement: Science Foundation for Distinguished Young Scholars 2020-JCJQ-ZQ-042 Intelligent and Bionic Spacecraft Thermal Control Technology Inspired by Tree Sap Transport Principle.
Author Contributions: The authors confirm contribution to the paper as follows: study conception and design: Hanli Bi, Hongxing Zhang, Yuandong Guo, Jianyin Miao; data collection: Hanli Bi, Chenpeng Liu, Zheng Peng; analysis and interpretation of results: Hanli Bi, Chenpeng Liu, Zhichao Jia, Guoguang Li; draft manuscript preparation: Hanli Bi, Zheng Peng. All authors reviewed the results and approved the final version of the manuscript.
Availability of Data and Materials: Data and material sharing are not available.
Ethics Approval: Not applicable.
Conflicts of Interest: The authors declare no conflicts of interest to report regarding the present study.
References
1. Xiang Y, Li J, Zhang J. Testing of loop heat pipe with dual-evaporator. Chin Space Sci Technol. 2006;26(3):27. [Google Scholar]
2. Zheng K, Xiang YC, Rao W. Design and verification of thermal control system for Tianwen-1 Mars entry capsule. Chin Space Sci Technol. 2022;42(5):108–16. [Google Scholar]
3. Jia ZC, Li GG, Wu Q, Liu CP, Liu C, Liu SX, et al. Review of propylene loop heat pipes for spacecraft. Chin J Space Sci. 2023;43(4):670–82 (In Chinese). doi:10.11728/cjss2023.04.2023.04.yg06. [Google Scholar] [CrossRef]
4. Zhang Z, Zhao R, Liu Z, Liu W. Application of biporous wick in flat-plate loop heat pipe with long heat transfer distance. Appl Therm Eng. 2021 Feb 5;184:116283. doi:10.1016/j.applthermaleng.2020.116283. [Google Scholar] [CrossRef]
5. Ahmed S, Pandey M, Kawaji M. Loop heat pipe design: an evaluation of recent research on the selection of evaporator, wick, and working fluid. J Therm Sci Eng Appl. 2022 Jul 1;14(7):070801. doi:10.1115/1.4052593. [Google Scholar] [CrossRef]
6. Qu Y, Wang S, Tian Y. A review of thermal performance in multiple evaporators loop heat pipe. Appl Therm Eng. 2018 Oct 1;143(5):209–24. doi:10.1016/j.applthermaleng.2018.07.070. [Google Scholar] [CrossRef]
7. Chang X, Watanabe N, Nagano H. Visualization study of a loop heat pipe with two evaporators and one condenser under gravity-assisted condition. Int J Heat Mass Transf. 2019 Jun 1;135(5–6):378–91. doi:10.1016/j.ijheatmasstransfer.2019.01.121. [Google Scholar] [CrossRef]
8. Goncharov KA, Golovin OA, Kolesnikov VA. Multi-evaporator loop heat pipe. AIP Conf Proc. 2000 Jan 19;504(1):778–84. doi:10.1063/1.1302575. [Google Scholar] [CrossRef]
9. Qu Y, Zhou D, Qiao S, Zhou K, Tian Y. Experimental study on the startup performance of dual-evaporator loop heat pipes. Int J Therm Sci. 2021 Dec 1;170(6):107168. doi:10.1016/j.ijthermalsci.2021.107168. [Google Scholar] [CrossRef]
10. Wu T, Wang T, Ma Z, Zhang Z, Liu W, Liu Z. Experimental investigation on the start-up performance of a loop heat pipe with three flat disk evaporators combined. Appl Therm Eng. 2022 Nov 5;216(1):119128. doi:10.1016/j.applthermaleng.2022.119128. [Google Scholar] [CrossRef]
11. Bugby D, Wrenn K, Wolf D, Kroliczek E, Yun J, Krein S, et al. Multi-evaporator hybrid loop heat pipe for small spacecraft thermal management. In: 2005 IEEE Aerospace Conference, 2005 Mar 5; Big Sky, MT, USA, IEEE; p. 810–23. [Google Scholar]
12. Goncharov K, Golovin O, Kolesnikov V. Loop heat pipe with several evaporators. In: SAE Technical Paper. 2000 Jul 10. doi:10.4271/2000-01-2407. [Google Scholar] [CrossRef]
13. Lu D, Xie R, Wen J, Liu C. Startup characteristics of a multi-evaporator cryogenic loop heat pipe. Chin Sci Bull. 2020;65(12):1141–50 (In Chinese). [Google Scholar]
14. Ku J, Birur GC. An experimental study of the operating temperature in a loop heat pipe with two evaporators and two condensers. In: SAE Technical Paper. 2001 Jul 9. doi:10.4271/2001-01-2189. [Google Scholar] [CrossRef]
15. Ku J, Ottenstein L. Thermal vacuum testing of a proto-flight miniature loop heat pipe with two evaporators and two condensers. In: 42nd AIAA Thermophysics Conference, 2011 Jun 27; Honolulu, HI, USA. [Google Scholar]
16. Lee M, Park C. Mechanical-capillary-driven two-phase loop: numerical modeling and experimental validation. Int J Heat Mass Transf. 2018 Oct 1;125:972–82. [Google Scholar]
17. Jiang C, Liu W, Wang HC, Wang DD, Yang JG, Li JY, et al. Experimental investigation of pump-assisted capillary phase change loop. Appl Therm Eng. 2014 Oct 5;71(1):581–8. [Google Scholar]
18. Setyawan I, Putra N, Hakim II. Experimental investigation of the operating characteristics of a hybrid loop heat pipe using pump assistance. Appl Therm Eng. 2018 Feb 5;130:10–6. [Google Scholar]
19. Minning CP, Perrygo CM, Fleischman GL, Anderson RA. Design and test of a prototype osmotic heat pipe. Reston, VA, USA: American Institute of Aeronautics and Astronautics; 1979 Jun. [Google Scholar]
20. Basiulis A, Fleischman G, Minning C. Design, development and test of a 1000-watt osmotic heat pipe. In: 15th Thermophysics Conference, 1980 Jul; Snowmass, CO, USA. [Google Scholar]
21. Ippohshi S, Imura H, Konya K, Yamamura H. Study on heat transport rate of an osmotic heat pipe: III. Estimation of heat transport limits. Heat Trans. 2000 Nov;29(7):559–72. doi:10.1002/1523-1496(200011)29:7<559::AID-HTJ3>3.0.CO;2-P29:7<559::AID-HTJ3>3.0.CO;2-P. [Google Scholar] [CrossRef]
22. Herron J inventor. Hydration Technologies Inc, assignee. Asymmetric forward osmosis membranes. United States Patent US 7445712; 2008 Nov 4. Available from: https://www.freepatentsonline.com/7445712.html. [Accessed 2024]. [Google Scholar]
23. Sun BY. Experimental Research on High Anti-Gravity Bionic Loop Heat Pipe (M.D. Thesis). Beihang University: China; 2021. [Google Scholar]
24. Lonsdale HK, Merten U, Riley RL. Transport properties of cellulose acetate osmotic membranes. J Appl Polym Sci. 1965 Apr;9(4):1341–62. [Google Scholar]
25. McCutcheon JR, Elimelech M. Influence of concentrative and dilutive internal concentration polarization on flux behavior in forward osmosis. J Membr Sci. 2006 Nov 1;284(1–2):237–47. [Google Scholar]
26. Cath TY, Childress AE, Elimelech M. Forward osmosis: principles, applications, and recent developments. J Membr Sci. 2006 Sep 15;281(1–2):70–87. [Google Scholar]
27. Tan CH, Ng HY. Modified models to predict flux behavior in forward osmosis in consideration of external and internal concentration polarizations. J Membr Sci. 2008 Oct 31;324(1–2):209–19. [Google Scholar]
28. McCutcheon JR, Elimelech M. Modeling water flux in forward osmosis: implications for improved membrane design. AIChE J. 2007 Jul;53(7):1736–44. [Google Scholar]
29. Welty J, Rorrer GL, Foster DG. Fundamentals of momentum, heat, and mass transfer. New York: John Wiley & Sons; 2014 Sep 9. [Google Scholar]
30. Gerstandt K, Peinemann KV, Skilhagen SE, Thorsen T, Holt T. Membrane processes in energy supply for an osmotic power plant. Desalination. 2008 Apr 15;224(1–3):64–70. doi:10.1016/j.desal.2007.02.080. [Google Scholar] [CrossRef]
31. Wei Y, Wang Y, Wang L, Yang H, Jin H, Lu P, et al. Simultaneous phase-inversion and crosslinking in organic coagulation bath to prepare organic solvent forward osmosis membranes. J Membr Sci. 2021 Feb 15;620(79):118829. doi:10.1016/j.memsci.2020.118829. [Google Scholar] [CrossRef]
32. Field RW, Wu JJ. Mass transfer limitations in forward osmosis: are some potential applications overhyped? Desalination. 2013 Jun 3;318(1):118–24. doi:10.1016/j.desal.2013.01.025. [Google Scholar] [CrossRef]
33. Phillip WA, Yong JS, Elimelech M. Reverse draw solute permeation in forward osmosis: modeling and experiments. Environ Sci Technol. 2010 Jul 1;44(13):5170–6. doi:10.1021/es100901n. [Google Scholar] [PubMed] [CrossRef]
34. Lee KL, Baker RW, Lonsdale HK. Membranes for power generation by pressure-retarded osmosis. J Membr Sci. 1981 Jan 1;8(2):141–71. doi:10.1016/S0376-7388(00)82088-8. [Google Scholar] [CrossRef]
35. Suwaileh W, Pathak N, Shon H, Hilal N. Forward osmosis membranes and processes: a comprehensive review of research trends and future outlook. Desalination. 2020 Jul 1;485:114455. [Google Scholar]
36. Ibraheem BM, Aani SA, Alsarayreh AA, Alsalhy QF, Salih IK. Forward osmosis membrane: review of fabrication, modification, challenges and potential. Membranes. 2023 Mar 26;13(4):379. [Google Scholar]
37. Kahrizi M, Gonzales RR, Kong L, Matsuyama H, Lu P, Lin J, et al. Significant roles of substrate properties in forward osmosis membrane performance: a review. Desalination. 2022 Apr 15;528:115615. [Google Scholar]
38. Anh-Vu N, Nomura Y, Hidaka T, Fujiwara T. Forward osmosis membrane process: a review of temperature effects on system performance and membrane parameters from experimental studies. J Environ Chem Eng. 2024 Jun 28;12(5):113429. [Google Scholar]
Cite This Article
 Copyright © 2025 The Author(s). Published by Tech Science Press.
This work is licensed under a Creative Commons Attribution 4.0 International License , which permits unrestricted use, distribution, and reproduction in any medium, provided the original work is properly cited.
 Downloads
 Citation Tools