 Open Access
ARTICLE
Modification and Experimental Verification of the Performance Improvement of Domestic Dehumidifiers
1 Key Laboratory of Thermo-Fluid Science and Engineering of MOE, School of Energy and Power Engineering, Xi’an Jiaotong University, Xi’an, 710049, China
2 China Household Electric Appliance Research Institute, Beijing, 100037, China
* Corresponding Author: Yingwen Liu. Email:
(This article belongs to the Special Issue: Microscale Heat and Mass Transfer and Efficient Energy Conversion)
Frontiers in Heat and Mass Transfer 2024, 22(6), 1661-1678. https://doi.org/10.32604/fhmt.2024.058959
Received 25 September 2024; Accepted 19 November 2024; Issue published 19 December 2024
Abstract
After optimizing the compressor design, condenser tube diameter, and tube row arrangement, air supply volumetric flow rate, and refrigerant charge of the domestic dehumidifier. The optimized design schemes were obtained from the original combinations by non-dominated sorting, and the optimized design schemes were experimentally verified under three environmental conditions according to the test method of T/CAS 342-2020 to obtain a complete idea of dehumidifier multi-component improvement. The results show that the dehumidifying capacity of Scheme 5 is slightly increased by 2.5% at 27°C/60% RH, and its energy factor is significantly increased by 24.6%. When the air supply volumetric flow rate was increased from 210 to 268 m3·h−1, the air supply temperature was reduced by 1.7°C, improving comfort. Under environmental conditions with higher dehumidification demand, i.e., at 35°C/90% RH, the energy factor of Scheme 4 can reach 4.3 L·kW−1·h−1, which is 34.4% higher than the original scheme, and the gap is further widened. The application of the 5 mm tube diameter condenser in dehumidifiers reduces the amount of refrigerant charge by 25.9%, reduces the cost by 7.5%, and strengthens the heat transfer effect and the homogeneity of the two-phase mixing, which shows the great application potential.Keywords
Nomenclature
| OD | Outside diameter |
To improve the air quality in the built environment, in addition to temperature control, humidity control is critical. Additionally, many industries, such as food processing and textile drying, rely on dehumidification as a critical process. Unfortunately, dehumidification consumes a large amount of energy. Buildings alone account for 40% of primary energy consumption in the United States, with one-third consumed globally [1]. Of this, 12.6% to 22.4% is used for dehumidification [2]. The refrigeration and dehumidification system based on the vapor compression cycle cools the wet air below the dew point, thus condensing water vapor to reduce the relative humidity of the air. Due to its simple structure and easy realization, it has been widely used in agriculture drying, industrial manufacturing and other fields [3,4]. In the domestic space of the built environment, the scale of dehumidifiers is also growing rapidly. According to statistics, from 2019 to 2021, China’s dehumidifier industry has achieved a sustained high growth rate of more than 16%, with sales of 11,589,000 units and sales of more than 8.3 billion yuan in 2021 [5].
Currently, the main research on home dehumidifiers includes increasing the dehumidification capability, improving the dehumidification efficiency, and lowering the air supply temperature to improve comfort. In this regard, Wu et al. [6] conducted researches on the compressor displacement, air discharge channels, refrigeration oil and maximum power point of the specialized compressors for dehumidifiers, providing selection principles for improving the energy efficiency of dehumidifiers. Xiong et al. [7] tested the frequency of compressors, and results showed that lowering the compressor frequency under certain conditions can help the dehumidifier save more energy. Jin et al. [8] conducted experimental researches on the relationship between the inlet air volumetric flowrate of the dehumidifier and the amount of removed moisture, and results showed that moisture extraction peaked at an optimal air volumetric flowrate and that too much/little air volumetric flowrate would affect the dehumidification effect to a certain extent. Meanwhile, related literature also showed a similar correlation between dehumidification capacity per unit of power consumption and air inlet volumetric flowrate [9]. Choi et al. [10] developed a transient simulation model to study the optimal compressor frequency and heat exchanger length of the dehumidification system. And results showed that more moisture was extracted but energy efficiency was reduced with the increase of the compressor frequency and that the heater exchange length should match the compressor frequency. In compound dehumidifiers, Wang [11] employed a heat pump in conjunction with a desiccant wheel to provide an efficient drying capability and supply low dew point conditions, resulting in great increase of system’s dehumidification. Chung et al. [12] tested and analyzed the performance of the hybrid dehumidifier by varying the ambient temperature, the bypass air volumetric flowrate, and the power consumption of the heater. In terms of pipe optimization, researchers have focused mainly on the optimization of condensing coil configurations. Yang et al. [13] studied the effect of the capillary tubes’ size and in-tube roughness on the performance of dehumidifiers. Liu et al. [14] increased the energy efficiency coefficient of the dehumidifier by more than 6.5% through changing rows and diameters of condenser tubes.
In the refrigeration and air-conditioning industry, heat exchangers with an outside diameter (OD) of 5 mm or less are called small diameter heat exchangers [15]. By reducing the tube diameter, not only the cost is reduced, but also the reduction of the inner volume will bring about a reduction in the refrigerant charge, which can reduce the impact of refrigerant on the environment. This also plays a great role in promoting the application of R290, a flammable and environmentally friendly refrigerant. At the same time, the reduction of tube diameter leads to the reduction of heat transfer area and the increase of flow resistance, which are two problems that need to be solved by flow path optimization and other methods. Joppolo et al. [16] utilized their condenser model to canvass the influence of different circuit arrangements on the condenser performance and discovered that with the same refrigerant pressure drop and lower refrigerant charge, efficient circuitry designs can improve heat capacity. Ma et al. [17] analyzed the performance characteristics and cost of dehumidifiers with 7/5 mm OD evaporator through experiments. It is found that the optimal refrigerant charge of 5 mm OD evaporator is at least 4.76% lower than that of 7 mm evaporator dehumidifier, and the cost of 5 mm OD evaporator can be reduced by 9.66% compared with that of 7 mm OD evaporator under the same requirement of dehumidification capacity and energy factor value. Small OD will bring about an increase in the flow resistance, due to the evaporator refrigerant is in the low-pressure region, the refrigerant saturation temperature slip is highly sensitive to the pressure drop in this region, this phenomenon significantly reduces the heat transfer temperature difference, resulting in a slight deterioration of its heat transfer capacity [18]. Therefore, this paper mainly focuses on the optimization objective of the condenser rather than the evaporator, the condenser OD is reduced to 5 mm and the tube configuration is optimized to explore the impact of condenser optimization on the dehumidifier dehumidification performance.
Currently, for the dehumidifier optimization, most of the research focuses on the impact of a single variable on the dehumidification performance. Few studies have focused on the combined effects of multiple variables or components on the energy factor and air supply temperature of dehumidifiers, and there is no complete set of dehumidifier optimization process guidance. For the application of 5 mm OD heat exchanger in dehumidifier, there is also a research blind spot. In this paper, based on the above research shortcomings, through the improvement of the compressor, condenser tube arrangement, air supply volumetric flowrate and refrigerant charge, through experiments combined with the vapor compression refrigeration simulation tool VapCyc [19], simulation calculations of air supply temperature and energy factor were carried out according to the Table 1. And during the experimental process, the poor combinations that make the refrigeration system operate inefficiently can be excluded based on engineering experience, which reduces the amount of computation and shortens the development time. It is a dual-objective optimization for energy factor and air supply temperature, and it is necessary to make compromises for these two objectives in different optimized schemes. However, in dehumidifiers, we usually pay more attention to the improvement of energy factor. For the two objectives of energy factor and air supply temperature, based on the results obtained from the calculation of the Table 1, the original combinations in Table 1 are non-dominated sorted [20] to obtain Table 2.


In this paper, a 5 mm OD condenser is applied in the dehumidifier, which reduces the refrigerant charge by 25.9% and the cost by 7.5%, creating favorable conditions for the future promotion of low GWP environmentally friendly refrigerants. The improvement effects of different optimized design schemes on the operating parameters, dehumidification performance and air supply temperature of the dehumidifier are verified by experiments. Therefore, the overall idea of multi-component improvement of dehumidifier is obtained: energy factor is taken as the upper target for component improvement, when the energy factor reaches the optimal value, then air supply temperature is taken as the lower target for component improvement. It is ensured that the energy factor is not reduced excessively (not more than 5% of the maximum energy factor), and the difference between the condensation temperature and the evaporation temperature always shows a reasonable decreasing trend in the process. The results of this paper can provide valuable insights for the optimal design of dehumidifiers.
2 Experimental Setup and Design Schemes
2.1 Experimental Setup and Testing Components
Fig. 1 shows a complete test system for a dehumidifier, where the dry bulb temperature sensors and wet bulb temperature sensors are arranged at the inlet of the dehumidifier to measure the temperature and humidity of the inlet air. Similarly, the dry bulb temperature sensors and wet bulb temperature sensors are arranged at the outlet of the dehumidifier to measure the temperature and humidity of the supply air. The temperature sensors used in the test system are all of platinum resistance (PT100) type, and the measurement range and accuracy of which are 0°C–60°C and ±0.1°C, respectively. When the refrigerant is in a two-phase state inside the heat exchanger, the refrigerant temperature is constant. We arrange several thermocouples along the surface of the heat exchanger tubes of the evaporator and condenser to observe the change of the refrigerant temperature. When it is observed that the refrigerant temperature tends to be constant, the evaporating temperature (condensing temperature) is obtained by taking the average value of the refrigerant temperature along the two-phase zone. All thermocouples are T-type, and the accuracy of them is ±0.5°C. Differential pressure transducers are placed before and after the nozzle to detect the difference in the duct. The air supply volumetric flowrate is calculated based on the Bernoulli equation and the air pressure difference before and after the nozzle. The formula for calculating the air volumetric flowrate can be referred to GB/T 7725-2022 [21]. The range and accuracy of the differential pressure transducer are 0−1000 Pa and ±0.25% of full scale, respectively. The dehumidifier is placed on an electronic balance with the range and accuracy of 0–30 kg and 1 g.
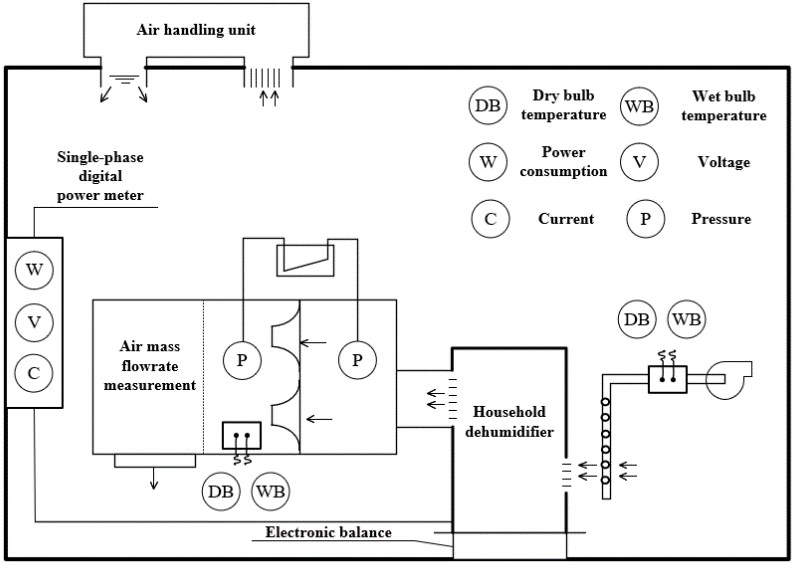
Figure 1: The test system of the dehumidifier
For the optimized design schemes in Table 2, parameters such as dehumidification capacity, power consumption, suction and discharge temperatures, evaporation and condensation temperatures, etc., were experimentally tested according to the test standards of T/CAS342-2020 [22]. By collecting the weight of condensed water from the dehumidifier during one day of uninterrupted operation, the dehumidification capacity is obtained by observing the weight changes in the electronic balance. The entire experimental system is placed in an Ambient chamber, where the inlet air state of the dehumidifier is strictly controlled by means of the dry bulb temperature sensor and wet bulb temperature sensor at the dehumidifier inlet.
Energy factor in the tests will be calculated according to the following equation based on the actual results of dehumidification capacity and the power consumption.
In Eq. (1), Ef stands for energy factor (L·kW−1·h−1); G stands for dehumidification capacity (L·D−1); Q stands for the power consumption (kW).
The core components of the dehumidifier and the principle of condensation dehumidification are shown in Fig. 2, the core of which is a vapor compression refrigeration system, including the compressor, condenser, air supply fan, throttle device, evaporator. The evaporator cools the air to the dew point temperature, removes water vapor from the air through condensation. The dehumidified air is heated via a condenser and then air with the right temperature and humidity is brought into the room. The refrigeration system plays an important role in the operational stability and performance of the product.

Figure 2: The appearance and structure of the dehumidifier
2.2 Acquisition and Comparison of Optimized Design Schemes
Considering that key components, such as the compressor, condenser, fan, and refrigerant charge, are decisive to the performance of dehumidifiers, the Table 1 was designed after the improvement of the compressor. As shown in Table 1, there are three main influencing factors, including condenser type, refrigerant charge, and air supply volumetric flowrate. The condenser type is limited to 4 rows of 5 mm OD condensers and 3 rows of 7 mm OD condensers. The range of the refrigerant charge is constrained to enable the dehumidifier to operate normally, and the optimal charge is usually determined based on experiments and engineering experience. Since the refrigerant type and charge are different in different refrigeration dehumidification systems, so the specific limits of the refrigerant charge should be quantified according to the actual refrigeration system, the refrigerant charge of this paper ranges from 190–290 g. The air supply volumetric flowrate is mainly determined by the fan and the pressure resistance loss, this paper uses an inverter fan, the pressure resistance loss mainly comes from the heat exchanger and the HEPA filter. The fan in this paper is capable of supplying air volumetric flowrate in the range of 190–280 m3·h−1.
The main objectives in the paper are energy factor and air supply temperature. The energy factor integrates the dehumidification capacity and power consumption, the energy factor is increased to meet the dehumidification performance requirement and the air supply temperature is decreased to meet the comfort requirement. Since the same factor may have different tendencies to influence the two objectives, it leads to the need for the final optimized scheme to make compromises for these two objectives. Optimized design Schemes 3–5 are obtained by non-dominated sorting [20] of the Table 1. Non-dominated sorting is an idea in genetic algorithm optimization, for all objectives, when all objective values of solution A are better than or equal to all objective values of solution B; and there exists at least one objective such that the objective value of solution A is strictly better than that of solution B, which is defined that A dominates B. For the two objectives described in the paper, the priorities of all the original combinations are ranked, from the set of the first three priorities, a solution is chosen to form Scheme 5, Scheme 4, and Scheme 3, respectively, according to the principle of energy factor preference, with the former strictly dominating the latter. As shown in Table 2, Scheme 1 is the original design for the dehumidifier, and Schemes 2–5 are optimized design schemes, Scheme 2 improves the refrigerating capacity of the compressor; Scheme 3 adjusts the diameter and rows of condenser tubes while reducing the refrigerant charge; Scheme 4 increases the fan speed but decreases the refrigerant charge; and Scheme 5 removes the HEPA filter to increase the air supply volumetric flowrate without increasing the energy consumption. By experimentally validating different optimized design schemes in Table 2 and analyzing their effects on different dehumidification objectives, the overall idea of multi-component improvement for dehumidifiers is obtained.
In addition, in the process of obtaining the Table 2 from the Table 1, the air supply temperature and energy factor of different original combinations are obtained through experiments in combination with the vapor compression refrigeration simulation tool VapCyc [19]. And at the same time, poor combinations that make the refrigeration system operate inefficiently are ruled out based on the engineering experience, which reduces the amount of computation and shortens the development time. Specific implementation plan is to determine the condenser type and air supply volumetric flowrate, through the experimental test to make the evaporator outlet superheat located in the reasonable interval [23], the refrigerant charge is thus determined. Then the refrigerant charge is taken as the benchmark, simulation results are obtained through VapCyc to observe the impact of air supply volumetric flowrate on the dehumidification objectives. It can be found that the energy factor generally shows an increasing and then decreasing trend with increasing air supply volumetric flowrate, which is consistent with the paper [24], and the increasing air supply volumetric flowrate brings about a monotonic decrease in the air supply temperature.
After products are optimized according to the schemes described in Table 2, the performance will be tested indoors under different conditions of 27°C/60% RH, 30°C/80% RH, and 35°C/90% RH according to the test method in T/CAS342-2020. The data of the power consumption, current, dehumidification capacity, suction and discharge temperature of the compressor, evaporator temperature, etc., are collected during the test, and the energy factor is determined according to CNS 12492-2017 [25] implemented in Taiwan. Specific conditions and requirements are shown in Table 3.

2.4 Calculation of Maximum Uncertainty
This paper focuses on evaluating the dehumidification performance of this dehumidifier through dehumidification capacity and energy factor. In addition, the air supply temperature and air supply volumetric flowrate are also important parameters for evaluating the comfort performance of dehumidifiers. The uncertainty of these computational parameters is evaluated by the root-sum-square formula [26], and the formula is shown below:
where Y denotes the dependent variable, and x denotes the independent variable obtained by the measuring instrument.

3.1 Dehumidification Capacity and Energy Factor
The five schemes are tested under Condition 1 according to Table 2. Changes in the dehumidification capacity, energy factor and power consumption of the Schemes 1–5 are shown in figures below.
The overall trends in Figs. 3 and 4 indicate that measures such as improving the compressor, optimizing condensing coil arrangement, adjusting fan speed, and reducing refrigerant charge have a positive effect on increasing dehumidification capacity and energy factor to varying degrees. Based on the effects of Schemes 1–5, the following conclusion can be drawn:
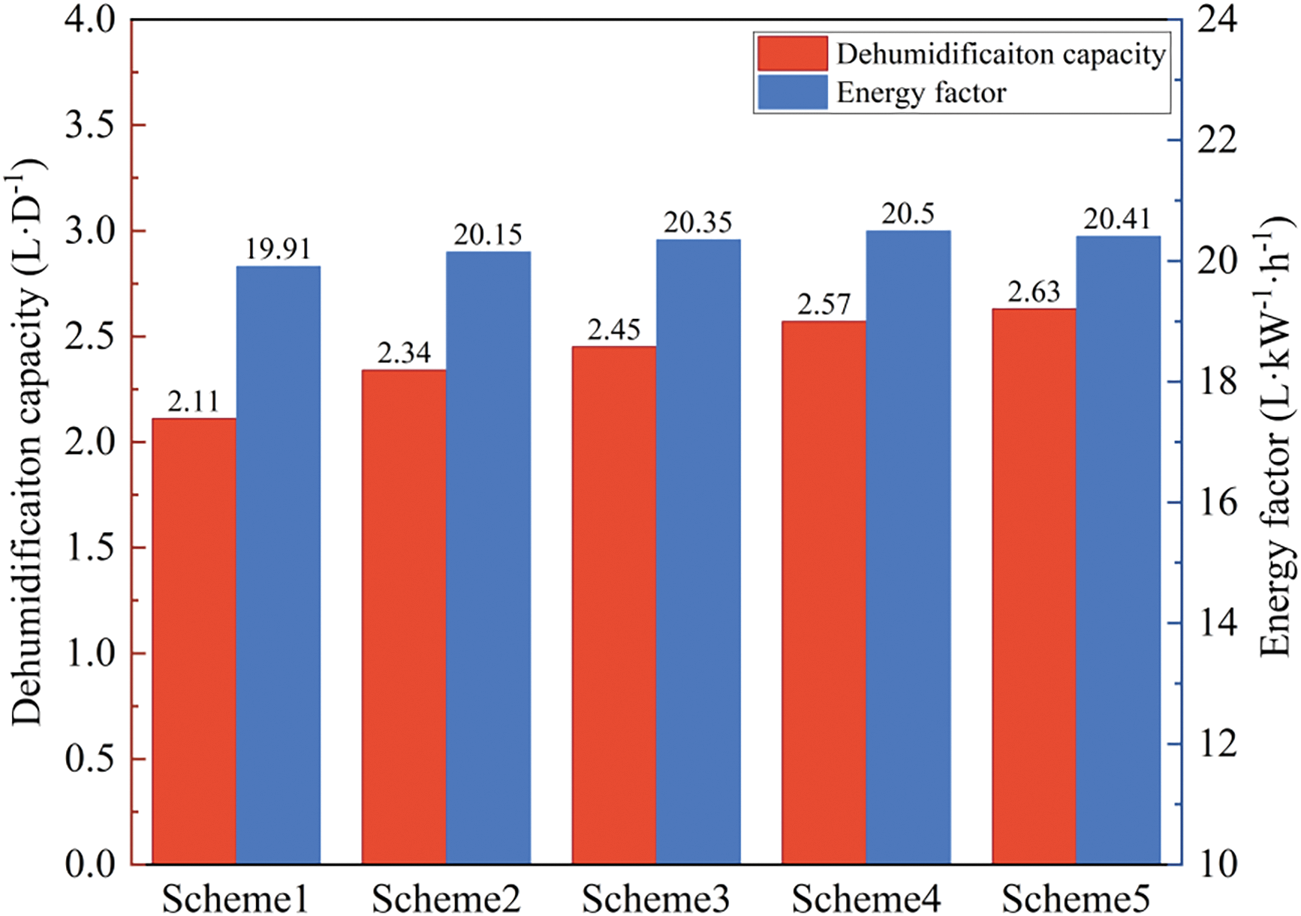
Figure 3: Dehumidification capacity and energy factor
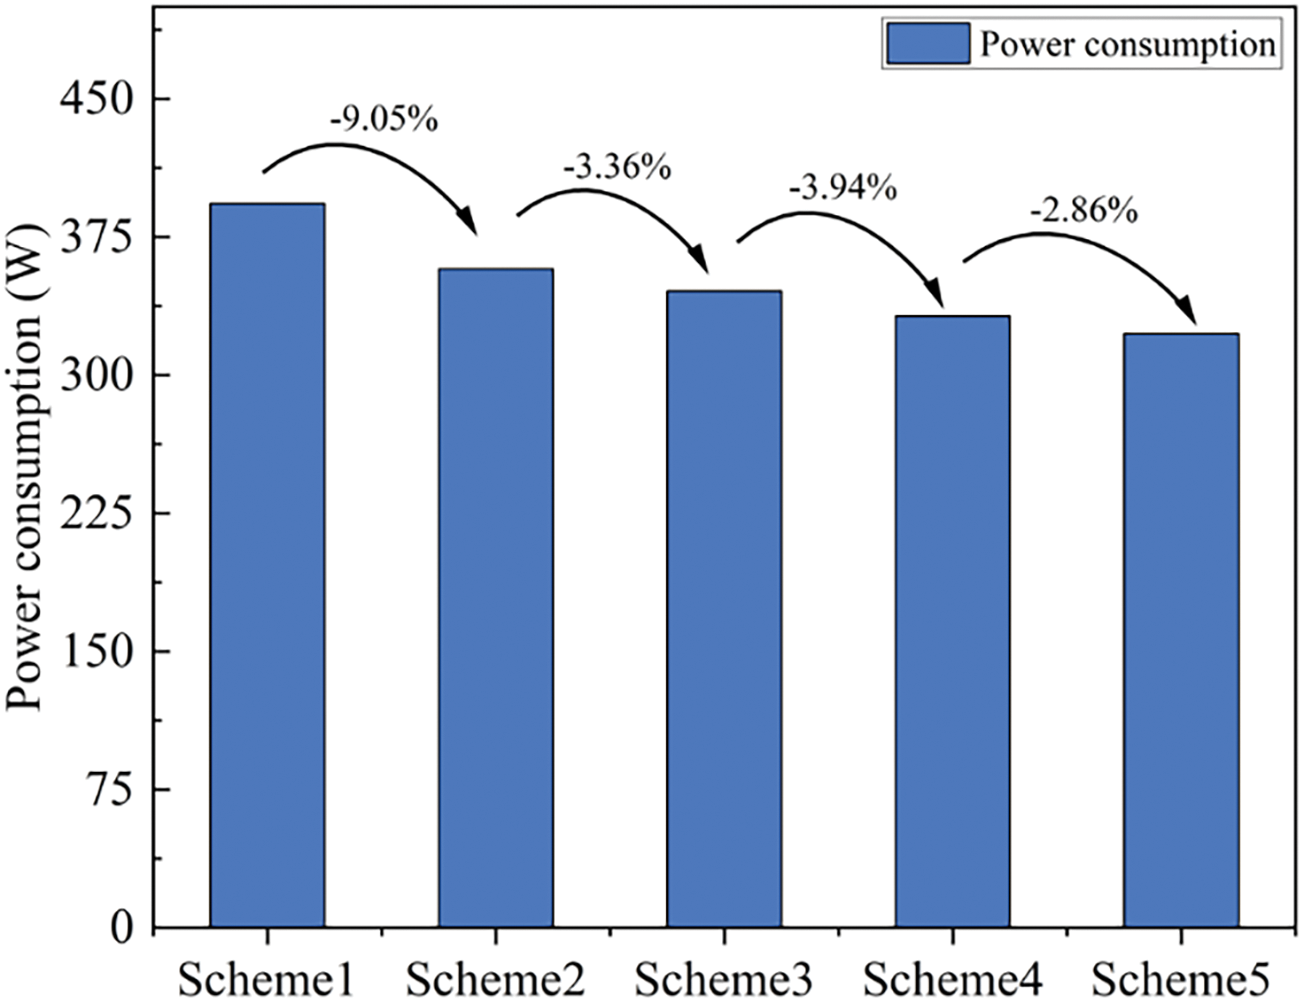
Figure 4: Power consumption
The dehumidification capacity of Schemes 1–4 successively increases by 1.2%, 1.0% and 0.7% while that of Scheme 5 decreases by 1.3%, with the maximum increase of 3.0%. The dehumidification capacity fluctuates within a narrow range between 19.91 and 20.50 L·D−1. Comparing all the modification schemes, improving the compressor refrigeration capacity, optimizing the condenser flow path arrangement, and reducing the refrigerant charging provide the most significant increase in dehumidification capacity for dehumidifiers.
The 3 rows of 7 mm OD condensers have been optimized to 4 rows of 5 mm OD condensers. At the same time, the reduction of the inner volume of the condenser requires that the optimal refrigerant charge be reduced as well. Smaller pipe diameter increases refrigerant flowrate and is more likely to form a ring flow, generating a larger shear force to make the liquid film thinning, which helps to improve the heat transfer between the refrigerant and the inner surface of the condenser [27]. At the same time, the increased number of tube rows also leads to an increase in the external surface area of the condenser, which improves the efficiency of heat exchange between the condenser and the wet air. Although the reduced charge may have a negative effect on the heat transfer of the system, this can be compensated for by optimizing the heat exchanger. On the other hand, removing the HEPA filter does reduce the dehumidification capacity to a certain extent, but it has a minimal impact on the overall results. On the other hand, the HEPA filter in the article will bring large wind resistance loss, the removal of the HEPA filter increases the air supply volumetric flowrate without increasing the energy consumption. However, this can also lead to insufficient heat exchange time between the wet air and the evaporator, which cuts down on the dehumidification capacity.
Fig. 4 illustrates that the power consumption of optimized schemes drops obviously by 9.0%, 3.3%, 3.9%, and 2.9%, with the maximum drop of 17.7% and within the range from 322.51 to 393.2 W. Since the power supply voltage is basically stable at 115 V, changes of current are consistent with that of the power consumption. Some conclusions can be drawn from the above results. The compressor is optimized to operate at a significantly higher efficiency, and the power consumption at the same refrigeration capacity is significantly reduced, which positively affects the energy efficiency of the dehumidifier operation. 3 rows of 7 mm OD condenser coil is optimized for 4 rows of 5 mm OD condenser coil, the increase of the row number can make up for the decline in the heat transfer area. Although smaller pipe diameter will accelerate the flow, so that the flow resistance increases, but also easier to produce turbulence, enhance the two-phase fluid mixing and heat transfer rate, thus improving the condensing efficiency. Besides, because of the great contribution of HCFC and HFC refrigerants to the direct greenhouse effect, it is urgent to reduce their atmospheric emissions. There a reduction of the refrigerant charge in the systems is a significant goal to achieve [28]. As the authors explained in the paper [29], most of the refrigerant charge of the chiller can be found in the condenser and the liquid lines, thus charge reduction should be primarily focused on condenser optimization. Thirdly, a reasonable increase in the speed of the fan will reduce the time of the heat exchange, but the higher inlet air volumetric flowrate will lead to a more adequate heat exchange between the air and the evaporator. Under this operating condition, compared to the reduction of heat transfer time, the improvement of heat transfer effect has a dominant influence on the power consumption of dehumidifiers. Therefore, by adjusting the fan speed and the refrigerant charge, the refrigeration capacity of the compressor and the airflow can be optimally matched, and the operation efficiency of the whole system is higher.
According to the results of the different schemes and Eq. (1), the energy factors of Schemes 1–5 are calculated to be 2.11, 2.34, 2.45, 2.57 and 2.63 L·kW−1·h−1, respectively, with a maximum increase of 24.6%. Combined with the previous analysis, several components of the dehumidifier are improved, which brings a small increase in dehumidification capacity, but it dramatically improves power consumption. Although the optimization of the compressor, the optimization of the condenser, the reduction of the refrigerant charge and the increase of the fan speed have a significant effect in reducing the energy consumption, this improves the matching effect of the compressor refrigeration capacity and the inlet air heat transfer capacity, which is particularly important in the improvement of dehumidifiers. Also, according to the limit of energy factor in CNS 12492-2017 (Energy factor > 2.5 L·kW−1·h−1), both Schemes 4 and 5 are qualified for Benchmark Level 1.
Considering the actual design and product production, compressor optimization usually brings about a substantial increase in cost. However, optimizing the heat exchanger by replacing the 7 mm OD tubes with 5 mm OD tubes not only reduces the inner volume, but also has fewer consumables, which reduces the production cost. If the tube diameter is reduced from 9.52 to 5 mm, the surface area per unit length of copper tube is reduced by 47.4%. This means that even if the thickness of the copper tube remains the same, the amount of copper used per unit length of tube decreases by 47.4%. In practice, the reduction in copper material can be up to 62.9% due to the increase in compressive strength and the reduction in the wall thickness of the copper tubes. Since copper tubing accounts for more than 80% of the material cost of a heat exchanger [30], this means that the material cost of the heat exchanger can be reduced by more than 50% by using smaller diameter tubes.
Detailed copper tube costs for two different OD condensers are analyzed in Table 5. There is no change in fin cost as there is no change in fin length, width and spacing. The price and mass of copper tubes are referenced in the paper [18]. The application of 5 mm OD condenser leads to 7.5% cost reduction.

The reasonable reduction of the refrigerant charge will promote the decline in the power consumption and reduce the harmful effects of refrigerants on the environment. The refrigerant charge reduction also leads to a cost reduction. Therefore, taking cost control and performance improvement into account, condenser optimization combined with charge reduction shows greater potential for improvement in domestic dehumidifiers.
3.2 Air Supply Volumetric Flowrate and Air Supply Temperature
The air supply volumetric flowrate is a key variable that affects the dehumidification performance and comfort indicators. Increasing the air supply volumetric flowrate is an intuitive way to reduce the air supply temperature, but its over-increase leads to an ineffective increase in power consumption. Particularly in environments of high humidity often coupled with high temperature, which will result in higher air supply temperature and a significant increase in ambient temperature during dehumidifier operation, affecting spatial comfort. A reduction in the air supply temperature can significantly improve personnel comfort. Therefore, effectively controlling the air temperature is also a core concern for manufacturers. Fig. 5 shows the air supply temperature and air supply volumetric flowrate of schemes under Condition 1.
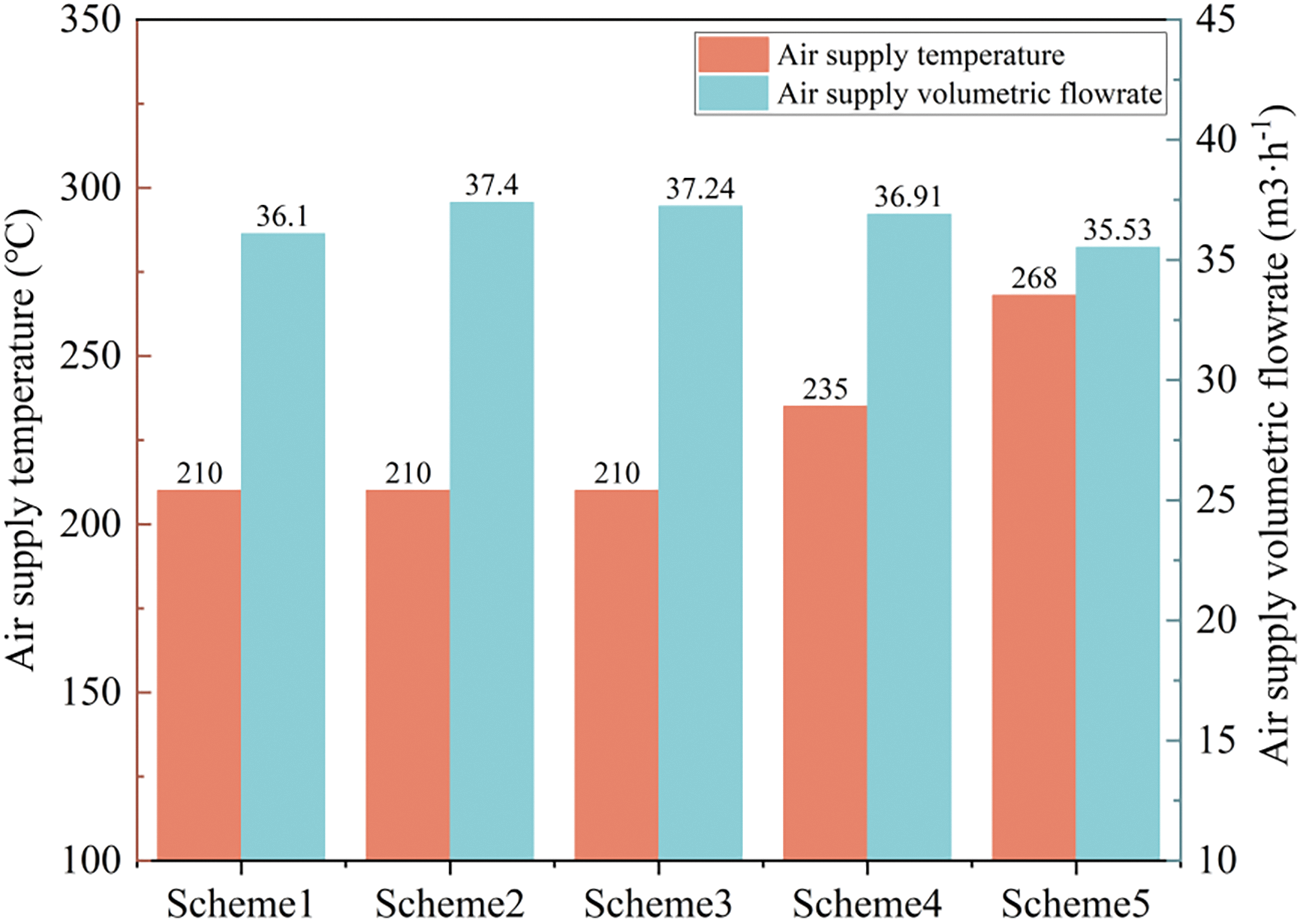
Figure 5: Air supply temperature and air supply volumetric flowrate
Combined with Figs. 3 and 5, after adjusting the fan speed in the Scheme 4, the air supply volumetric flowrate is increased from 210 to 235 m3·h−1, and the dehumidification capacity is increased by 0.7%, which is not a significant change. This indicates that under the operating Condition 1, by adjusting the compressor refrigeration capacity and the inlet air volume heat transfer capacity to improve the match between the two, the operating efficiency can be improved to a certain extent, thus saving energy, but the heat transfer effect has not been significantly enhanced. When the heat exchange effect does not change much, the increase in air volumetric flowrate will lead to an increase in the relative humidity of the air sent into the space. In addition, after the removal of the HEPA filter in the Scheme 5, the air volumetric flowrate was further increased from 235 to 268 m3·h−1, but the dehumidification capacity decreased by 1.3%, which is because the wind speed was too fast at this time, resulting in insufficient heat exchange time.
From the perspective of air supply temperature, the measured values of each group are between 35.5°C–37.4°C, and the overall fluctuation is not big. The main reason for this is that the evaporating and condensing temperature are always within a reasonable range after improvements have been made under the various schemes. However, it is worth mentioning that the air supply temperature shows a decreasing trend in the case of gradually increasing air volumetric flowrate, and the increase of 58 m3·h−1 air volumetric flowrate brings about a 1.8°C decrease in air supply temperature. Increased air volumetric flowrate means that more air is fed into the dehumidifier for treatment, and the treated air is returned to the environment more quickly. The increased air flowrate helps to reduce the contact time between the air and the condenser during the dehumidification process, which reduces the air supply temperature. Therefore, the larger the air volumetric flowrate, the closer the air supply temperature is to the ambient temperature, so the ambient temperature rises less. In view of this factor, without structural improvement, the air supply temperature can be effectively reduced by boosting the air supply volumetric flowrate, thus alleviating the increase in the ambient temperature during the operation of the dehumidifier. However, it should be noted that the enhancement of the air supply volumetric flowrate should not be too large, which will destroy the heat exchange effect of the evaporator and the inlet airflow and deteriorate the dehumidification performance.
Currently, the most widely used dehumidifier standards in China include QB/T 5688-2022 “household dehumidifier” [31], T/CAS 342-2020 “household dehumidifier” and so on, which evaluate the dehumidification performance based on rated dehumidification capacity and do not take the air supply volumetric flowrate into account. Considering the comfort and dehumidification performance of the dehumidifier in actual use, the above division method is still worth exploring.
3.3 Comparison of Refrigeration System Operating Parameters
The refrigeration system plays an important role in the operational stability and performance of the dehumidifier. Figs. 6 and 7 show the changes in the suction and discharge temperature of the compressor, the evaporation temperature and condensing temperature of the refrigeration system of Schemes 1–5 under Condition 1.
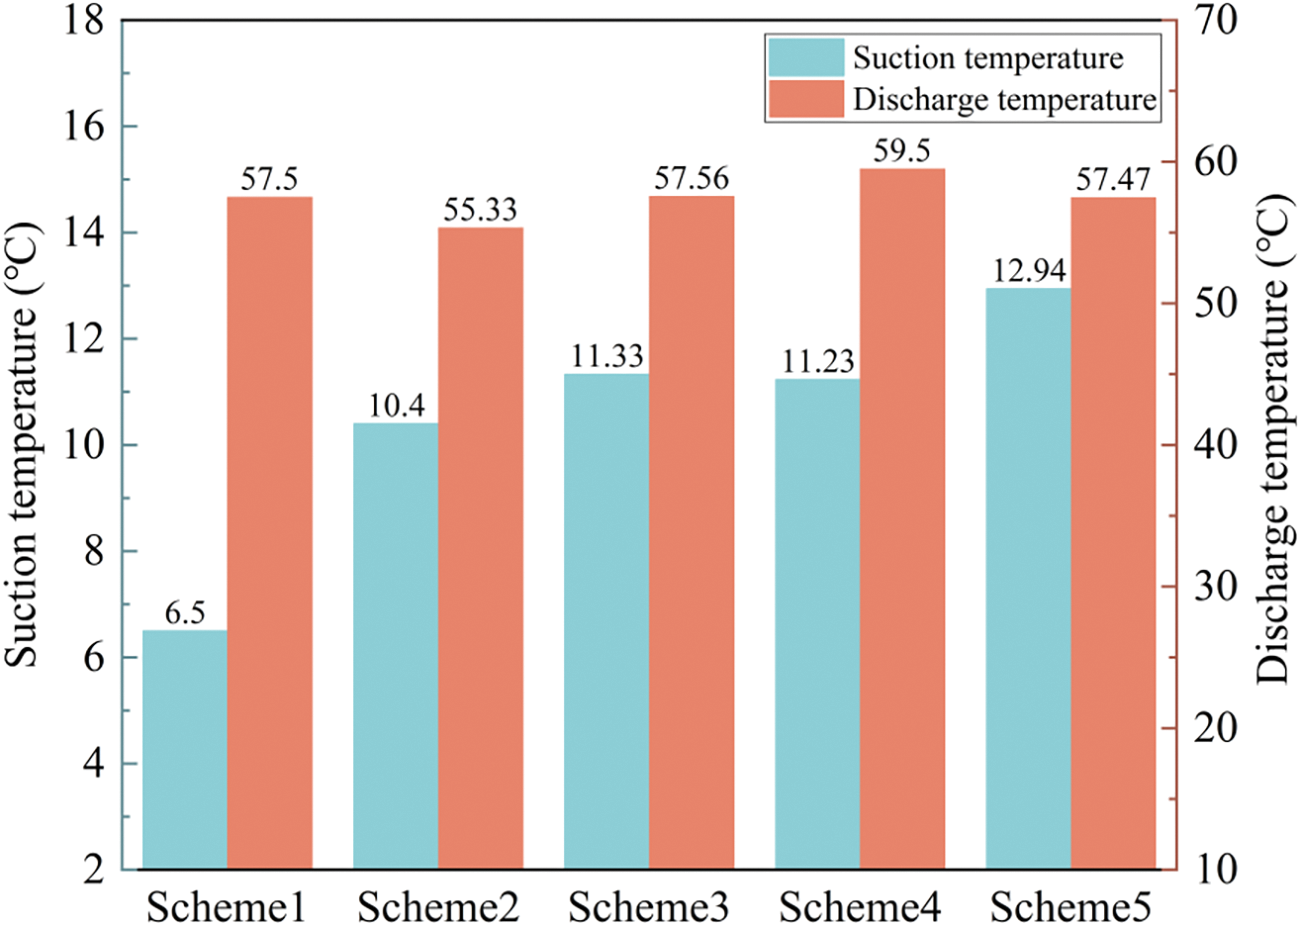
Figure 6: Suction temperature and discharge temperature of the compressor
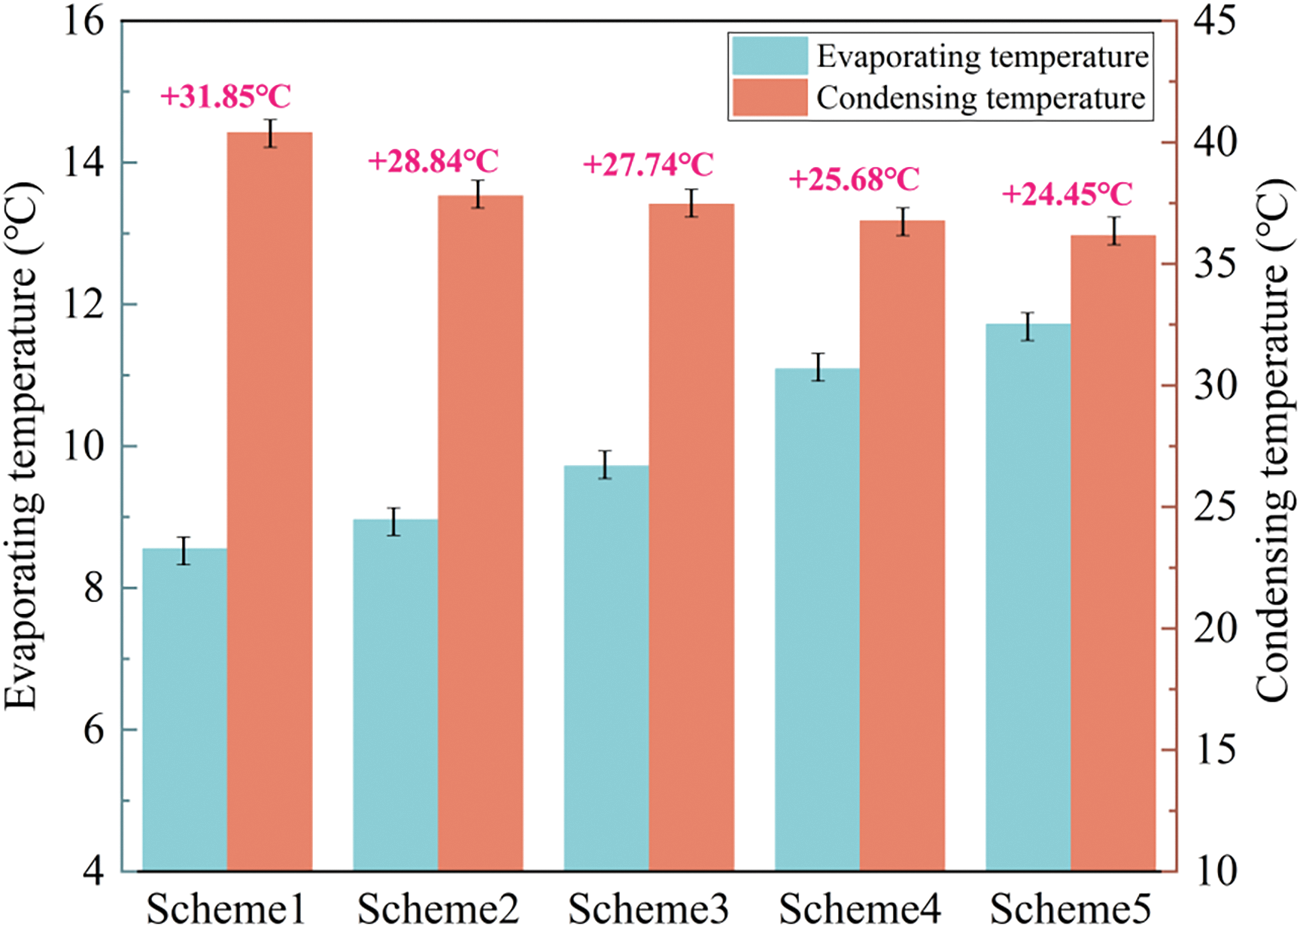
Figure 7: Evaporating temperature and condensing temperature
As shown in Fig. 6, according to the results after the stabilization of the dehumidifier, the discharge temperature is hardly influenced by changing the compressor and condenser structure, fan speed, and reducing refrigerant charge. Overall, it remains between 55.3°C and 57.5°C, and the system works stably at this temperature range. However, when the condition is changed to Condition 3 (not shown in the figure), the discharge temperature of Scheme 1 increases to 90.2°C, while that of Scheme 4 increases to 76.7°C. The maximum operating temperature of the dehumidification system has been reduced significantly, which improves operational stability and safety to a certain extent.
With the modification of the dehumidifier, the suction temperature of the compressor approximates a gradual increasing trend. The results from the Scheme 1 to Scheme 5 are 6.5°C, 10.4°C, 11.3°C, 11.2°C, and 11.2°C, respectively. The primary contributor to the variation is the compressor performance optimization. Besides, after replacing the 4-row 5 mm condenser, reasonably reducing the refrigerant charge and increasing the air supply volumetric flowrate can reduce the flow resistance to a certain extent, which will help the refrigerant phase change more fully in the evaporator and condenser, and make the suction temperature rise slightly, thus reducing the compressor operating load. When the test condition is given as Condition 3, the suction temperature increases to 30.8°C in test Group 1 and 22.5°C in Scheme 4.
The optimized design has a positive impact on the reasonable control of the compressor suction and discharge temperature, especially in high temperature and high humidity environment with higher dehumidification needs. The modification of suction and discharge temperature can enhance operational safety, extend compressor life, and avoid the interruption of the dehumidification caused by the compressor overheating.
Fig. 7 shows the effect of different optimized schemes on evaporating temperature and condensing temperature. The average evaporating temperature increases from 8.55°C to 11.09°C, and the average condensing temperature decreases from 40.4°C to 36.77°C after the optimized design. It can also be found that each optimized scheme increases the evaporating temperature with changes in the order of 4.8%, 8.4%, 14.1%, and 5.68%. However, in the Scheme 4 where the fan speed is increased, the increase of the evaporating temperature is very significant and far exceeds the change of the suction temperature. This is because changes in the air supply volumetric flowrate will have a direct impact on the heat exchange effect between inlet air and evaporator, resulting in changes in the evaporating temperature. In addition, the charge is significantly reduced in conjunction with condenser optimization, which results in a more adequate heat exchange with the evaporator for the same inlet air volumetric flowrate, a large amount of refrigerant enters the superheated zone in advance, and the evaporation temperature increases.
And condensing temperature is reduced with each optimization scheme, the change range is in the order of 6.4%, 0.9%, 1.8%, 1.6%. It can be found that the optimization of the condenser configuration has less effect on the condenser heat exchanging than they do on the evaporating temperature. The optimization of the compressor is the primary reason for the reduction of condensing temperature. This is mainly due to the lower maximum operating temperature (compressor discharging temperature) with the compressor optimization, which leads to a simultaneous reduction of the condenser inlet temperature, and the condensing temperature is also reduced with no change in the heat transfer structure of the condenser. The increase of air volumetric flowrate can also enhance the condensation effect and reduce the condensation temperature, the increase of 58 m3·h−1 air volumetric flowrate brings 1.2°C condensation temperature reduction.
As shown in Fig. 7, with the updating of the scheme, the difference between the evaporating temperature and condensing temperature shows a steady decrease, and the compression ratio of the compressor decreases, which reduces the energy consumption. Compared with the 7 mm OD condenser, although the 5 mm OD condenser forces the refrigerant to flow at a relatively high flow rate and thus intensifies the resistance to flow, this also enhances the turbulence effect in the tube, which leads to a more uniform two-phase distribution of the refrigerant. This is consistent with the findings in the paper [18,32]. At the same time, the reasonable reduction of the refrigerant charge can prevent the liquid phase from accumulating too much, avoid local blockage and uneven flow in the pipeline, and thus reduce the flow resistance. In addition, when the evaporating temperature increases and the condensing temperature decreases, the temperature difference between the two components and the environment decreases, the exergy loss decreases, and the total irreversibility rate decreases, which ultimately improves the overall energy efficiency of the refrigeration system. This is consistent with the findings in the paper [33]. Therefore, the optimization scheme in this paper also verifies the core direction of energy efficiency improvement of the refrigeration and dehumidification system.
3.4 Comparison of Performance under Different Operating Conditions
Figs. 8 and 9 present the results of further researches on significant parameters such as the power consumption, dehumidification capacity, air supply temperature and evaporating temperature of Schemes 1 and 4 tested under the different conditions.
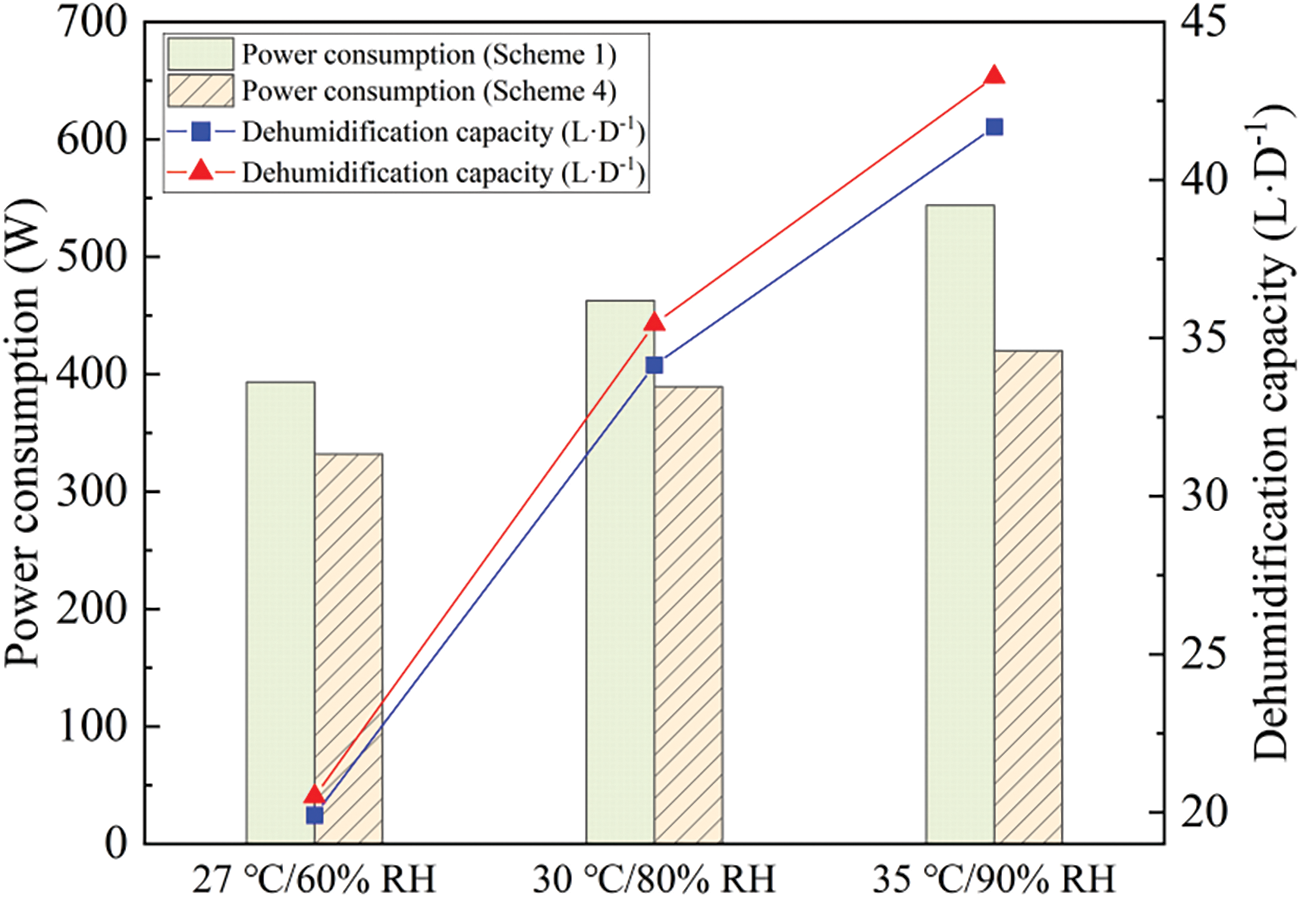
Figure 8: Input power and dehumidification capacity
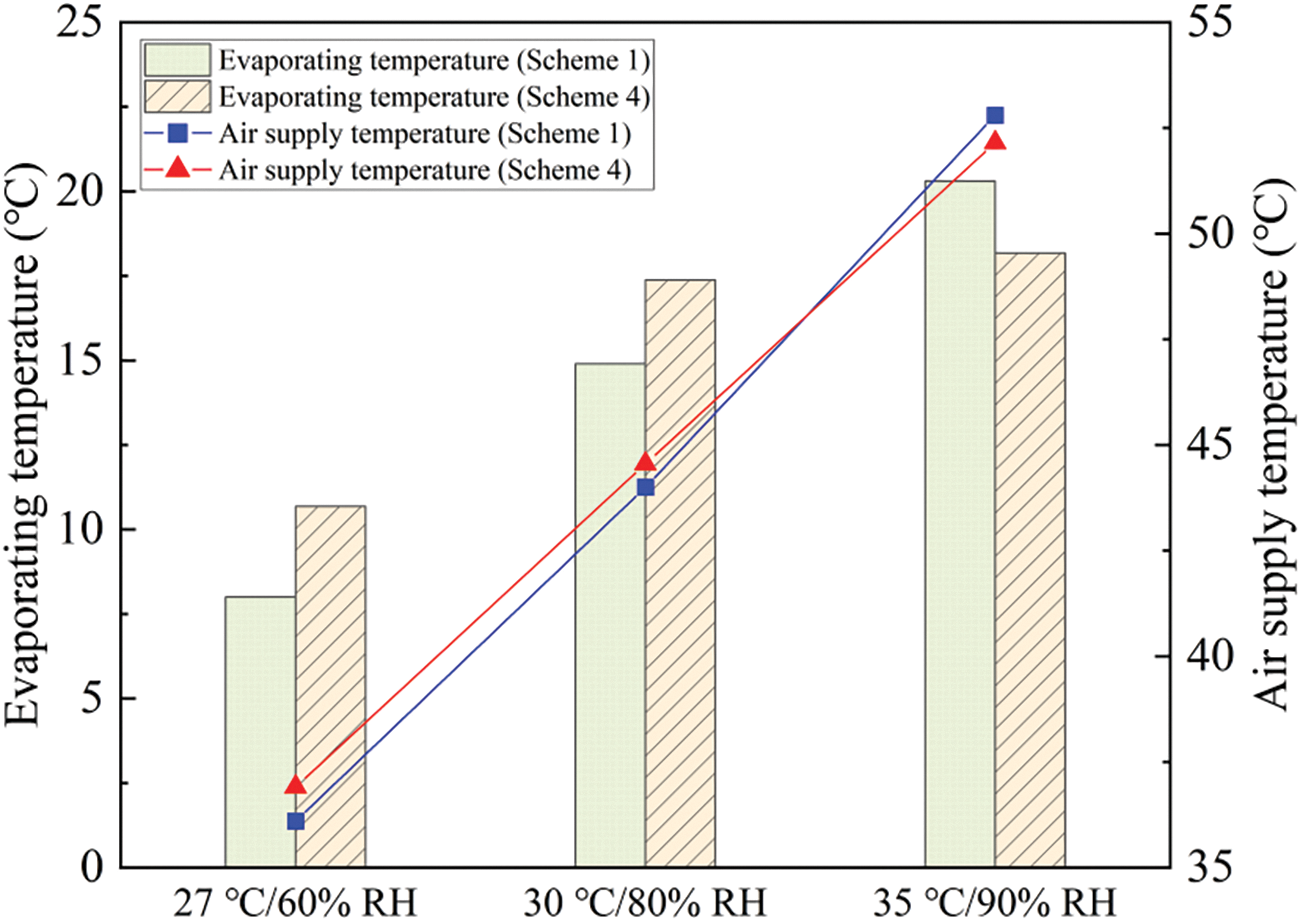
Figure 9: Evaporating temperature and air supply temperature
Fig. 8 illustrates the comparison between Schemes 1 and 4 under Condition 1 (27.0°C/60% RH), Condition 2 (30.0°C/80% RH), and Condition 3 (35.0°C/90% RH). The data illustrates that the difference in the dehumidification capacity of the two schemes under Condition 1 is about 3.0%. The dehumidification capacity of the two schemes under Condition 3 are 41.7 and 43.3 L·D−1, respectively, with a slight increase of 3.8%. However, Scheme 4 sees a decrease of 22.8% in the input power from Scheme 1 under Condition 3, higher than the decrease of 15.6% under Condition 1, which helps the energy factor of the optimized product increase to 4.29 L·kW−1·h−1 under Condition 3, proving that the optimized scheme is more likely to deliver good performance under worse conditions. Synthesizing the conclusion of Chapter 3.3, the optimized product has a greater advantage over the original product in environments with higher dehumidification needs, both in terms of operational stability and energy-saving characteristics.
Fig. 9 compares air supply temperature and evaporating temperature of Schemes 1 and 4 under three conditions. Under the Condition 3, the dehumidifier of Scheme 1 blows air at about 52.8°C, and that of Scheme 4 is 52.2°C, so the optimized design scheme fails to result in a significant reduction in the air supply temperature, and no significant difference between the air supply temperature of Schemes 1 and 4 is found among three conditions. In addition, the evaporating temperature is not apparently correlated with the optimization. Under the Condition 2, the evaporating temperature of Scheme 1 is about 2.5°C, lower than that of Scheme 4. Under Condition 3 (worse condition), the former is 2.2°C, higher than the latter. Therefore, there are some uncertainties in adjusting the evaporating temperature of the dehumidifier only by optimizing components.
In this paper, for the objectives of energy factor and air supply temperature of the household dehumidifier, the dehumidifier is improved from multiple perspectives, including compressor, condenser, air supply volumetric flowrate and refrigerant charge. And the optimized design table is obtained by non-dominated sorting of the original combinations. According to the standard of T/CAS342-2020, the optimized design schemes are experimentally verified and analyzed under three conditions, the complete implementation idea of the multi-component improvement of dehumidifiers is obtained to achieve the dual-objective optimization of the energy factor and the air supply temperature. And the following conclusions are obtained:
(1) The dehumidifier multi-component improvement idea: with the energy factor as the upper target, the compressor, condenser piping arrangement, refrigerant charge is improved; when the energy factor reaches the optimal value, with the air supply temperature as the lower target, the air supply volumetric flowrate and refrigerant charge is improved while ensuring that the energy factor does not deteriorate too much. During the improvement process, the difference between the condensing temperature and evaporating temperature always shows a reasonable reduction trend.
(2) Under the condition of 27°C/60% RH, the energy factor of the optimized Scheme 5 is 24.6% higher than that of the original scheme. The main reason for the increase in the energy factor is the significant decrease in energy consumption, and the dehumidification capacity is increased by 2.5%. Compared with the component modification, the increase in air supply volumetric flowrate plays a decisive role in the reduction of air supply temperature.
(3) The application of 5 mm OD condenser in dehumidifiers reduces the refrigerant charge by 25.9% and the cost by 7.5%, creating favorable conditions for the future promotion of low GWP environmentally friendly refrigerants. Although the smaller OD accelerates the flow and increase the flow resistance, turbulence is more likely to arise to enhance the mixing uniformity of two-phase fluids and heat transfer rate, thus improving the condensation efficiency.
(4) Under the environmental conditions with higher dehumidification demand, i.e., at 35°C/90% RH, the energy factor of the Scheme 4 can reach 4.3 L·kW−1·h−1, which is 34.4% higher than the original scheme, and the gap is further widened. Meanwhile, the operational stability of the Scheme 4 is also superior to the original scheme.
Acknowledgement: The authors acknowledge the support of China Household Electric Appliance Research Institute.
Funding Statement: The authors received no specific funding for this study.
Author Contributions: The authors confirm contribution to the paper as follows: data curation, investigation and writing—original draft: Xin Qi; methodology, formal analysis, visualization and writing—review & editing: Xingtao Shi; validation and supervision: Yingwen Liu. All authors reviewed the results and approved the final version of the manuscript.
Availability of Data and Materials: There is no data that is unavailable in this study.
Ethics Approval: Not applicable.
Conflicts of Interest: The authors declare no conflicts of interest to report regarding the present study.
References
1. Luo N, Wang Z, Blum D, Weyandt C, Bourassa N, Piette MA, et al. A three-year dataset supporting research on building energy management and occupancy analytics. Sci Data. 2022;9(1):156. doi:10.1038/s41597-022-01257-x. [Google Scholar] [PubMed] [CrossRef]
2. Shehadi M. Review of humidity control technologies in buildings. J Build Eng. 2018;19:539–51. doi:10.1016/j.jobe.2018.06.009. [Google Scholar] [CrossRef]
3. Liu SL, Ma GY, Jia XY, Xu SX, Wu GQ, Zhang YM. The thermal performance and applicability analysis of the composite ventilation system with heat recovery in ultra-low energy buildings. Energy. 2022;263:125942. [Google Scholar]
4. Zhang T, Yan ZW, Wang LY, Zheng WJ, Wu Q, Meng QL. Theoretical analysis and experimental study on a low-temperature heat pump sludge drying system. Energy. 2021;214:118985. doi:10.1016/j.energy.2020.118985. [Google Scholar] [CrossRef]
5. Chinaiol.com. Why does dehumidifier market expand rapidly for three years consecutively. Available from: http://www.chinaiol.com/News/Content/202205/8037644. [Accessed 2024]. [Google Scholar]
6. Wu XJ, Sun M. Design of R410A refrigerant compressor used for dehumidifiers. Fluid Mach. 2011;39:79–82+49 (In Chinese). [Google Scholar]
7. Xiong YY, Liu SB, Liu H. A study on properties of variable frequency dehumidifier. Refrig Air Conditioning. 2009;23(6):98–101 (In Chinese). [Google Scholar]
8. Jin SM, Zhao ZH, Tian XD, Zhu ZT. Air volume’s influence on dehumidification capacity of low-temperature dehumidifiers. In: Proceedings of the 10th National Symposium on Cold/Hot Water Units and Heat Pump Technology, 2002; China; p. 269–71 (In Chinese). [Google Scholar]
9. Geng SB, Yuan L, Fan LK, Wang QW, Diao SM. Test and analysis on the performance of energy-saving refrigerant dehumidifiers. Heat Vent Air Cond. 2013;43:161–5 (In Chinese). [Google Scholar]
10. Choi JY, Lee DC, Park MH. Effects of compressor frequency and heat exchanger geometry on dynamic performance characteristics of heat pump dryers. Energy. 2021;235:121391. doi:10.1016/j.energy.2021.121391. [Google Scholar] [CrossRef]
11. Wang WC. Design and analysis of an energy efficient dehumidification system for drying applications. UK: University of Hertfordshire; 2015. [Google Scholar]
12. Chung HJ, Jeon Y, Kim D, Kim S, Kim Y. Performance characteristics of domestic hybrid dehumidifier combined with solid desiccant rotor and vapor compression system. Energy. 2017;141:66–75. doi:10.1016/j.energy.2017.09.084. [Google Scholar] [CrossRef]
13. Yang Z, Shao SQ, Liu YL, Shen XY, Gao JZ, Yang YJ. Experimental investigation on effect of inner surface roughness of capillary on performance of dehumidifier. Fluid Mach. 2011;39:65–8+61 (In Chinese). [Google Scholar]
14. Liu FS, Zhang ZM, Yu MC. Research and application on improving heat exchange effect of single-row tandem multi-row condenser based on dehumidifier. J Appl Sci Technol. 2023;308–13. [Google Scholar]
15. Ding GL, Wu GM, Liu T. Development of heat exchanger for refrigeration and air-conditioning (1)—fin-and-tube heat exchangers using small diameter tubes. J Appl Sci Technol. 2019;4:40–5+58 (In Chinese). doi:10.19784/j.cnki.issn1672-0172.2019.04.001. [Google Scholar] [CrossRef]
16. Joppolo CM, Molinaroli L, Pasini A. Numerical analysis of the influence of circuit arrangement on a fin-and-tube condenser performance. Case Stud Therm Eng. 2015;6:136–46. doi:10.1016/j.csite.2015.09.002. [Google Scholar] [CrossRef]
17. Ma PP, Tan YH, Guo S, Tian J, Liu DH. Performance and cost analysis of a dehumidifier using a small tube diameter evaporator. J Appl Sci Technol. 2023;2:94–7+102 (In Chinese). [Google Scholar]
18. Ma D, Chen Q, Yan G. Optimization study of the circuitry for 5 mm small-diameter finned-tube heat exchanger in air-source heat pumps. Appl Therm Eng. 2024;248:123359. [Google Scholar]
19. Winkler J, Aute V, Radermacher R. Component-based vapor compression simulation tool with integrated multi-objective optimization routines. In: International Refrigeration and Air Conditioning Conference, 2006. [Google Scholar]
20. Sun JX, Zhang RB, Wang MJ, Zhang J, Qiu SZ, Tian WX, et al. Multi-objective optimization of helical coil steam generator in high temperature gas reactors with genetic algorithm and response surface method. Energy. 2022;259:124976. [Google Scholar]
21. National Standardization Administration of China. GB/T 7725-2022, room air conditioner. Beijing: China Standard Press; 2022. [Google Scholar]
22. China Association for Standardization. T/CAS 342-2020, household dehumidifiers. Beijing: China Association for Standardization; 2020. [Google Scholar]
23. Wang DD, Zhang ZY, Yu BB, Wang XN, Shi JY, Chen JP. Experimental research on charge determination and accumulator behavior in trans-critical CO2 mobile air-conditioning system. Energy. 2019;183:106–15. [Google Scholar]
24. Shi XT, Qi X, Wang XS, Lu HT, Zhong YJ, Yang P, et al. Parametric influence and optimization of the dehumidification performance of a variable-frequency dehumidifier. Sci Technol Built En. 2024;30:1–13. [Google Scholar]
25. Bureau of Standards. CNS 12492-2017, dehumidifiers. Taiwan, Bureau of Standards, Metrology and Inspection. 2017. [Google Scholar]
26. Chen WJ, Chan MY, Weng W, Yan H, Deng S. An experimental study on the operational characteristics of a direct expansion based enhanced dehumidification air conditioning system. Appl Energ. 2018;225:922–33. doi:10.1016/j.apenergy.2018.05.074. [Google Scholar] [CrossRef]
27. Wang C. Study on condensation performance of 5 mm diameter copper tube heat exchanger application. Refrig. 2013;32:30–3. [Google Scholar]
28. Poggi F, Macchi-Tejeda H, Leducq D, Bontemps A. Refrigerant charge in refrigerating systems and strategies of charge reduction. Int J Refrig. 2008;31(3):353–70. doi:10.1016/j.ijrefrig.2007.05.014. [Google Scholar] [CrossRef]
29. Carrillo JAE, Payá IG, Pérez BP, de La Flor FJS, Lissén JMS. Experimental performance analysis of a novel ultra-low charge ammonia air condensed chiller. Appl Therm Eng. 2021;195:117117. doi:10.1016/j.applthermaleng.2021.117117. [Google Scholar] [CrossRef]
30. Wang TT, Ren T, Ding GL, Song J, Gao YF, Zheng YX. Optimal design of room air conditioner with smaller diameter copper tube. Chin J Refrig Technol. 2012;4:1–4 (In Chinese). [Google Scholar]
31. Ministry of Industry and Information Technology. QB/T 5688-2022, household dehumidifier. Beijing: Ministry of Industry and Information Technology; 2022. [Google Scholar]
32. Yao YF, Hrnjak P. Visualization of refrigerant two-phase flow before and through distributor and evaluation of its performance. Int J Refrig. 2021;125:122–31. doi:10.1016/j.ijrefrig.2021.01.001. [Google Scholar] [CrossRef]
33. Ahamed JU, Saidur R, Masjuki HH. A review on exergy analysis of vapor compression refrigeration system. Renew Sust Energ Re. 2011;15(3):1593–600. doi:10.1016/j.rser.2010.11.039. [Google Scholar] [CrossRef]
Cite This Article
 Copyright © 2024 The Author(s). Published by Tech Science Press.
This work is licensed under a Creative Commons Attribution 4.0 International License , which permits unrestricted use, distribution, and reproduction in any medium, provided the original work is properly cited.


 Submit a Paper
 Propose a Special lssue
 View Full Text
 Download PDF
 Downloads
 Citation Tools