 Open Access
ARTICLE
Flow and Heat Transfer Features of Supercritical Pressure CO2 in Horizontal Flows under Whole-Wall Heating Conditions
1 College of Mechanical and Electrical Engineering, Beijing University of Chemical Technology, Beijing, 100029, China
2 Institute of Engineering Thermophysics, Chinese Academy of Sciences, Beijing, 100190, China
3 Department of Chemical Engineering, Imperial College London, London, SW7 2AZ, UK
* Corresponding Author: Jiangfeng Guo. Email:
Frontiers in Heat and Mass Transfer 2024, 22(6), 1575-1595. https://doi.org/10.32604/fhmt.2024.058179
Received 06 September 2024; Accepted 09 October 2024; Issue published 19 December 2024
Abstract
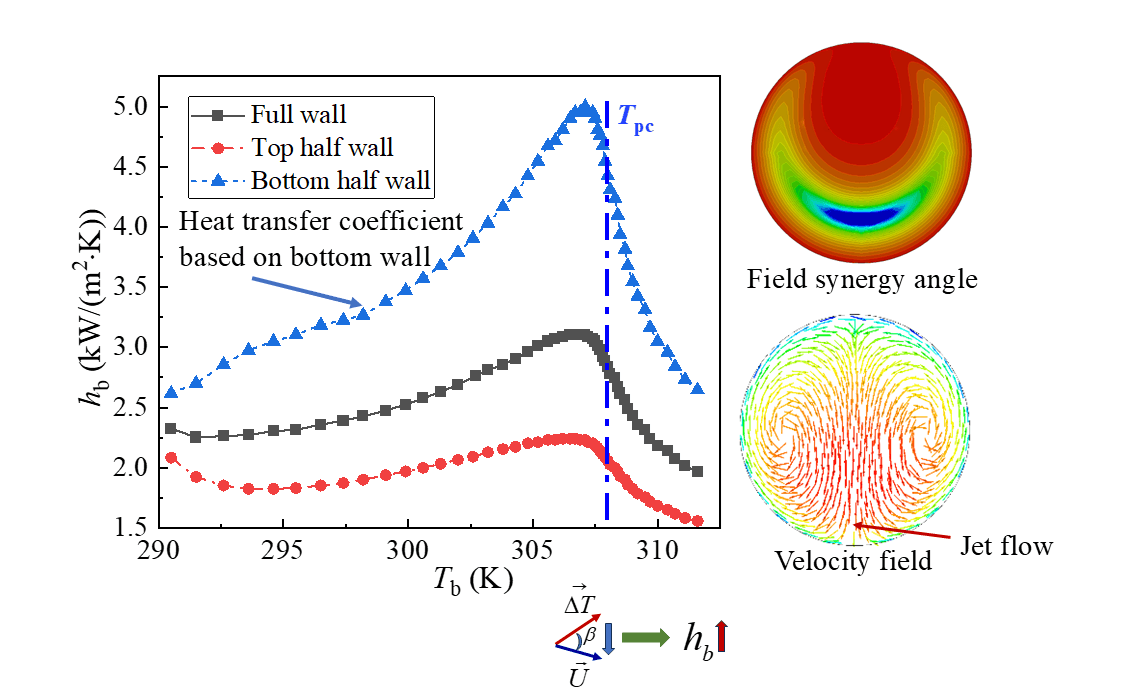
Based on the first and second laws of thermodynamics, the heat transfer and flow (thermohydraulic) characteristics of horizontal supercritical pressure CO2 (S-CO2) in a circular pipe under heating conditions were investigated numerically. Heating flows in two different diameters (d) of 4 and 6 mm were simulated in pipes with pressures of 8 MPa, mass fluxes (G) of 300 and 400 kg/(m2·s), and heat fluxes (q) of 50, 75 and 100 kW/m2. In the d = 4 mm pipe, the peak heat transfer coefficient (hb) was about 3 times higher than in the d = 6 mm pipe, while the entropy production due to fluid friction in the 4 mm pipe was on average 1.1 times higher, and the entropy production due to heat transfer was on average about 67% lower. A 4 mm tube was employed to further evaluate the influence of the applied wall heat flux, the results demonstrated that the irreversibility due to heat transfer was on average more than 4 times higher when heat flux density was 100 kW/m2 than when the heat flux density was 50 kW/m2, while the peak of heat transfer coefficient increased by 1.4 times as q was decreased from 100 to 50 kW/m2. The effect of thermal acceleration was ignored, while the buoyancy effect resulted in secondary flow and significantly affected the flow and heat transfer features. The jet flows were found in the vicinity of the lower wall of the pipe, which made the two fields of velocity and temperature gradient more synergistic, leading to an enhancement in heat transfer in the vicinity of the upper wall. The aggravation of heat transfer resulted in high irreversibility of heat transfer in the cross-sectional area near the wall, while the local friction irreversibility was less affected by the buoyancy effect, and the distribution was uniform. The uneven distribution of thermophysical properties also confirmed that the enhanced heat transfer occurred near the wall area at the bottom of the pipe.Graphic Abstract
Keywords
Nomenclature
| Abbreviations | |
| cp | Specific heat, J/(kg·K) |
| d | diameter of tube, m |
| Dω | Term of orthogonal divergence, kg/(m·s4) |
| g | Acceleration of gravity, 9.81 m/s2 |
| G | Mass flux, kg/(m2·s) |
| Gk | Production of k, kg/(m·s3) |
| Gω | Generation of ω, kg/(m·s4) |
| Gr | Grash of number |
| k | Turbulent kinetic energy, m2/s2 |
| hb | Heat transfer coefficient, W/(m2·K) |
| Kv | Criterion of thermal acceleration |
| P | Pressure of fluid, Pa |
| Pr | Prandtl number of fluid |
| q | Heat flux on wall, W/m2 |
| Re | Reynolds number in tube |
| Ri | Dimensionless buoyance effect criterion |
| Sg | Entropy generation, W/(m3·K) |
| Sk | Term of turbulent kinetic energy, kg/(m·s3) |
| Sω | Term of turbulent dissipation, kg/(m·s4) |
| T | Temperature, K |
| u | Velocity of fluid, m/s |
| x,y,z | x, y, z directions |
| y+ | Dimensionless wall distance, m |
| Yk, Yω | Dissipation of k and ω related to turbulence, kg/(m·s3) |
| Symbols | |
| α | Expansion coefficient, 1/K |
| β | Synergy (coordination) angle, ° |
| Г | Diffusivity, Pa·s |
| λ | Heat conductivity, W/(m·K) |
| μ | Viscosity, Pa·s |
| ρ | Density, kg/m3 |
| Φ | Energy dissipation rate, W/m3 |
| ω | Specific dissipation, s−1 |
| Subscripts | |
| b | Bulk |
| eff | Effective |
| in | Inlet |
| i,j,l | Tensor index symbols |
| k | Turbulent kinetic energy |
| pc | Pseudocritical |
| t | Turbulent |
| w | Wall |
| ∆T | Temperature difference |
| ∆P | Pressure drop |
| ω | Specific dissipation |
In recent decades, clean and efficient energy conversion technologies have become increasingly attractive as a way to reduce excessive consumption of fossil fuels and greenhouse gas emissions in response to the energy crisis and climate change. Supercritical CO2 Brayton cycle system is recognized as one of the most promising energy conversion technologies in various fields such as solar energy and geothermal energy [1,2]. In addition, carbon dioxide is already used in various energy systems because it is chemically stable, non-flammable, and non-toxic [3–6]. However, the drastically varying thermophysical properties of S-CO2 and the associated complex thermohydraulic characteristics pose serious challenges to S-CO2 systems and the related equipment [7–10]. Therefore, the study of the thermohydraulic properties of S-CO2 under different conditions has aroused widespread interest in order to capture complex features and promote relevant basic understanding [11–13].
The characteristics of heat transfer and flow in vertical S-CO2 flows are of interest because the flow direction can be the same or opposite to the buoyancy. Bruch et al. [14] experimentally studied the heat transfer and flow characteristics of S-CO2 in vertical pipes under cooling conditions, and reported that the heat transfer coefficient increased with the increase of mass flow in upward flow, and increased with the decrease of mass flow in downward flow after mass flow reached a threshold. Kim et al. [15,16] conducted an experimental study on the thermohydraulic characteristics of vertical S-CO2 flow under heating conditions, and the results showed that the temperature of wall raised monotonically in the flow direction for downward flow, while it showed an obvious peak value during upward flow. Lei et al. [17] conducted experimental research on the heat transfer characteristics of vertical S-CO2 flow under different heat-flux and mass-flux conditions. The results showed that the buoyancy effect had a key influence on the heat transfer performance, and the difference was significant when the heat flux varied between 38 and 234 kW/m2. It has also been reported that under low heat flux conditions, the increase in pressure led to a significant decrease in the heat transfer coefficient, while when the heat flux was high, the effect of pressure was not significant because the fluid temperature in the near-wall region was far away from the pseudo-critical temperature (Tpc). Guo et al. [18] conducted a numerical study on the heat transfer and flow characteristics of S-CO2 flow in a vertical pipeline. The results showed that under cooling conditions, the buoyancy effect enhanced heat transfer in upward flow, but impeded heat transfer in downward flow, and the effect of buoyancy effect was opposite under heating conditions. Wang et al. [19] carried out numerical studies on the flow and heat exchanger features of S-CO2 vertically upward flow with a lattice structure array, with results showing that the lattice structure could suppress the heat transfer deterioration and reduce the wall temperature peak, since vortexes generated by lattice structure enhanced turbulent and weakened the buoyancy effect and flow acceleration.
Horizontal S-CO2 flows are more ubiquitous in practical applications. Lin et al. [20] summarised existing heat transfer correlations for S-CO2 horizontal flows at cooling conditions, and reported that most correlations had a good agreement with experimental data at low heat-flux conditions, while the correlations were not applicable when the heat flux was high as the buoyancy effect became significant. Oh et al. [21] performed experimental studies on the heat transfer performance of S-CO2 in horizontal pipes with inner diameters of 4.6 and 7.8 mm under cooling conditions, the results showed that the increasing pressure resulted in a decrease in the heat transfer coefficient, and the heat transfer coefficient further decreased as the mass flux increased. Liu et al. [22] experimentally studied the heat exchange performance of S-CO2 in horizontal pipes with inner diameters of 4, 6 and 10.7 mm under the condition that fluid was cooled, and they reported that the pipe diameter affected the heat exchange performance significantly. Moreover, the correlations developed for small pipes presented notable deviations from the experimental data for large pipes, and hence a new correlation was proposed for large-diameter pipes. The thermal-hydraulic characteristics of S-CO2 in a non-uniform heating horizontal tube was experimentally investigated based on pseudo-critical theory in [23], the experimental results demonstrated that heat transfer deterioration was more prone to appear near the pseudo-critical pressure at smaller heat-flux condition, and horizontal flow under non-uniform heating exhibited similar heat transfer characteristics to that in vertical tubes.
To further enhance the heat transfer performance, a modified aerofoil fin was proposed, which enabled an increase of 6% in heat transfer factor and a decrease of 4% in pressure drop relative to the NACA 0020 aerofoil fin [24]. Han et al. [25] further demonstrated that the design of front-dense and rear-sparse fins could intensify heat transfer by 23%–29% as compared to the uniform fin distribution. Altering the cross-section of heat exchange tube was also employed to enhance heat transfer of S-CO2, with resulting showing that the converging tube exceeded the diverging tube in terms of heat transfer coefficient [26]. Non-uniform twisted inserts was equipped in conical horizontal tube to enhance heat transfer of S-CO2 in [27], the numerical results indicated that diverging conical tube with twisted inserts could enhance heat transfer by 43.1%. Obviously, the tube diameter, heat-flux mode, etc., have a significant effect on the heat transfer performance and flow characteristics of S-CO2 in horizontal pipes. The heating and cooling conditions have opposite influences on the heat transfer performance of vertical S-CO2 flows, and the heat transfer difference of S-CO2 in horizontal flows between the conditions in which fluid was cooled and heated still needs to be further studied.
The existing literature indicates that the thermohydraulic properties of S-CO2 flow are complex and its underlying mechanism of heat transfer is not fully recognised. In addition, previous studies have focused on analyses based on the first law of thermodynamics, and as Bejan [28] pointed out, the second law (i.e., entropy production) would play a key role, since the amount of available energy lost during heat transfer is directly depended on the irreversibility. Heating conditions are very common in engineering applications, so in this work, we aim to comprehensively study the flow and heat transfer features of S-CO2 horizontal flows under heating conditions based on the first- and second-law of thermodynamics, including exploring the effect of pipe diameter and heat flux, determining the laws of local irreversibility associated with heat flux, and revealing the heat transfer mechanism. The present work will deepen the field of understanding in the thermo-hydraulic characteristics of S-CO2 flow and provide meaningful theoretical references for the design of heat exchangers and other related components using supercritical fluids as working fluids.
2 Model and Setting Conditions
Fig. 1 shows a 3D physical model of the horizontal tube used in this study, with a length of 1600 mm. To eliminate the influence of unsteady flow on the heat transfer performance, two sections with a length of 150 and 100 mm established in the outlet and inlet regions are assumed adiabatic, respectively. S-CO2 flows up on the positive side of the z-axis, and gravity is set up on the negative side of the y-axis. To locate the position on the cross-section, the negative direction along the y-axis is set to 0°, and the positive direction along the y-axis is set to 180°. The pressure is set at 8.0 MPa, at which the corresponding Tpc is about 308 K. Consider the two diameters of 4 and 6 mm to assess their impact on heat transfer performance.

Figure 1: The physical model of the horizontal tube. The pipe length is set to 1600 mm, with two insulated areas of 150 and 100 mm at the inlet and outlet
It is assumed that the flow in the pipe is steady in the present work, ignoring the thermal resistance of the metal wall (much less than that of the fluid), as well as the heat transfer between the pipe wall and the environment (achieved through ideal insulation), the flow is three-dimensional and single-phase flow.
The governing equations are [29,30]:
Equation of Continuity:
Momentum conservation equation:
Energy conservation equation:
where T and P are temperature and pressure, u denotes velocity, g denotes the gravitational acceleration, cp represents the specific heat at constant pressure, ρ denotes the density, λ denotes the thermal conductivity, μeff denotes the effective viscosity coefficient that can be obtained by summing the turbulent viscosity μt and the molecular viscosity μ, Φ represents the energy dissipation related to viscosity.
The SST k-ω turbulent model is employed in this study, which is verified to be valid for S-CO2 heat transfer and flow problems. This model has the advantage of k-ω turbulent model in accurate prediction in the vicinity of wall, and the robustness of k-ε model in the core region of the fluid (namely, the region that is far away from the pipe wall). The current simulations are conducted under steady state, so the specific dissipation rate ω and the turbulent kinetic energy k can be calculated through the following transport equations [30]:
Equation for specific dissipation rate:
Equation for turbulent kinetic energy:
where Dω denotes the orthogonal divergence term, Gω and Gk denote the production of ω and k, Sω and Sk represent the source terms, Yω and Yk represent the dissipations of ω and k related to turbulence, and Γω and Γk represent the effective diffusivities of ω and k.
The mesh density of the established computational grid system in the boundary layer is enhanced to make sure that y+ < 1, otherwise the accuracy of simulation results cannot be guaranteed. Numerical calculations were conducted by using the software of ANSYS CFX, and the thermophysical properties of S-CO2 (density, specific heat, and so on) were obtained from the National Institute of Standards and Technology (NIST) database [31]. To ensure high simulation accuracy, the high-resolution advection is employed. The universal convergence criterion is set to 1 × 10⁻⁶, that is, when all the residuals of the variables in the governing equation above are less than this criterion, the calculation is automatically terminated and the result is considered to be convergent.
In this study, four mesh systems are used to test the grid independence. Fig. 2 shows the change in wall temperature (Tw) with the overall fluid temperature (Tb) for Pin = 8.0 MPa, q = 50 kW/m2, G = 400 kg/(m2·s) and Tin = 288.15 K. Taking the grid system with the largest number of elements (1.82 million) as the baseline case, one can see that when the mesh system whose element number is 1.24 million is employed, the average relative error of Tw from the baseline system is less than 0.1%, suggesting that when the element number is higher than 1.24 million, the increasing number of elements has little influence on the numerical results. Thereby, considering the computational resources and time as well as the acceptable simulation accuracy, the mesh system whose element number is 1.24 million is adopted in the present work.
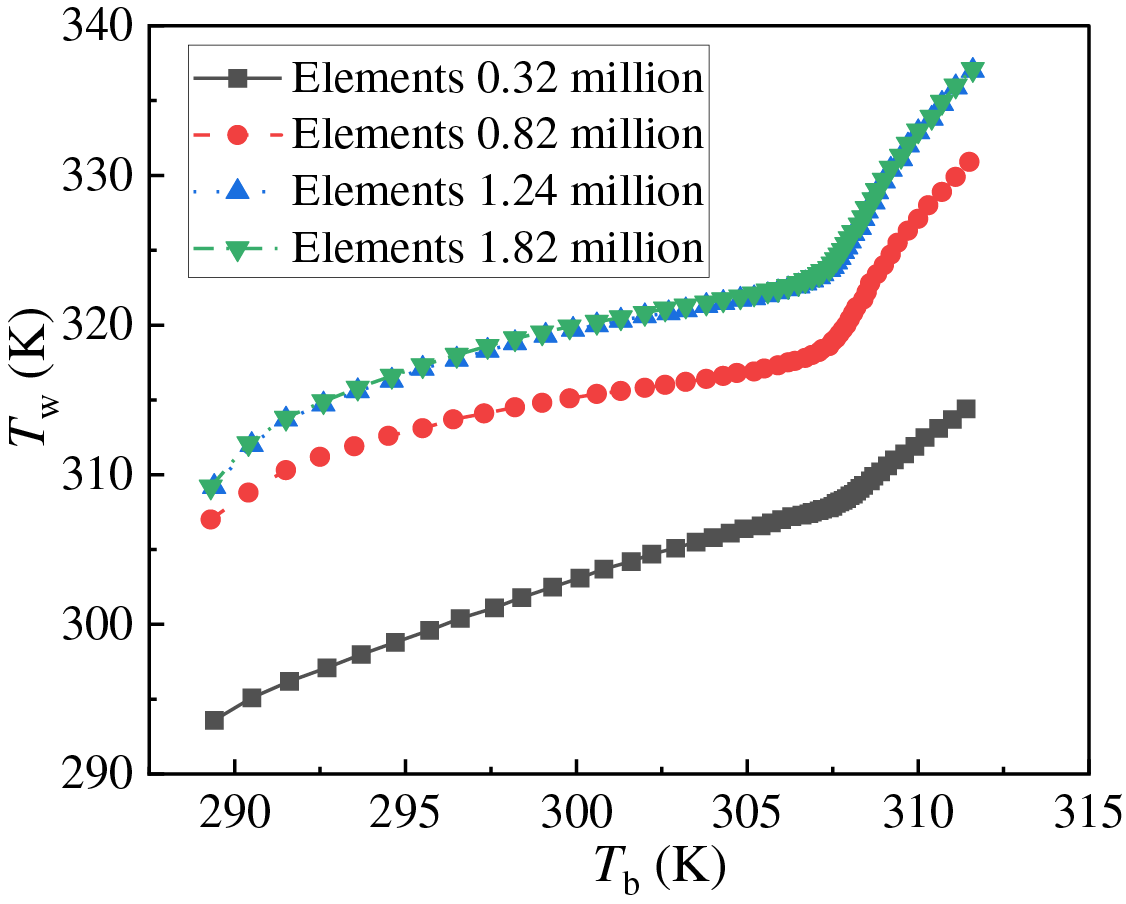
Figure 2: Under the boundary conditions of Tin = 288.15 K, Pin = 8.0 MPa, G = 400 kg/(m2·s), and q = 50 kW/m2, the change of wall temperature in horizontal flow against the overall fluid temperature
Model verification is also carried out, and the results are obtained through experiments in [32]. When the conditions are set as follows: Tin = 288.15 K, Pin = 8.0 MPa, G = 400 kg/(m2·s), q = 50 kW/m2, and the numerical results obtained using the adopted model and empirical results are shown in Fig. 3. It can be seen that the simulated value of Tw is almost consistent with the results in [32], and the relative error is no more than 1.5% (on average). More information on the validation of the numerical model can be referred to our papers [33–35], which will not be repeated for simplicity. This shows that the model adopted in this work is reliable and its accuracy is acceptable.
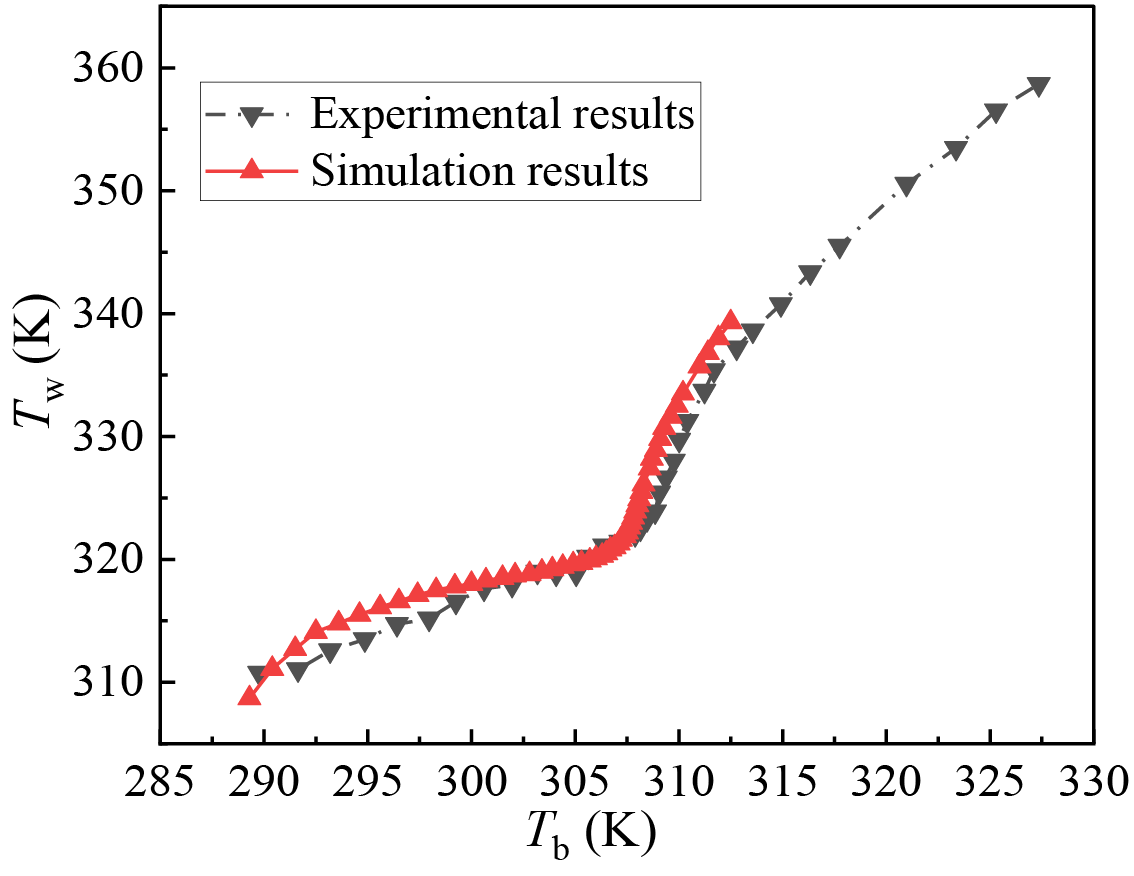
Figure 3: Comparison of wall temperature between numerical results obtained using the adopted model in this study and experimental results reported in Reference [32] with boundary conditions of Tin = 288.15 K, q = 50 kW/m2, Pin = 8.0 MPa, and G = 400 kg/(m2·s)
Full-wall heating conditions are considered in this work, with heat flux on the nonadiabatic (i.e., heated) section of the pipe whose z-value ranging from 150 to 1500 mm as shown in Fig. 1. The inlet pressure and inlet temperature are set to 8.0 MPa and 288.15 K, respectively. Various slices are established in the heated region (between z = 150 mm and z = 1500 mm) along the positive direction of the z-axis (flow direction), with an interval space of 25 mm. Local parameters, including entropy generation, fluid bulk temperature and wall temperature, can be obtained based on these transverse slices (sections). Accordingly, the local heat transfer coefficient (hb) can be obtained:
where q denotes the local heat flux, and subscripts “w” and “b” denote pipe wall and fluid bulk, respectively. Local wall temperature Tw is the linear average temperature based on the intersection line of the inner wall and the transverse section, and the fluid bulk temperature Tb on the transverse section can be written as:
Bejan [28] stated that the local irreversibility in heat transfer processes is associated with two factors, i.e., heat transfer (temperature difference) and flow resistance, these are written as:
Under the action of gravity, the drastic changes in thermophysical properties lead to the buoyancy effect, which will have an important impact on the heat transfer performance and flow characteristics of S-CO2. To quantitatively assess the buoyancy effect, a dimensionless criterion is usually employed for S-CO2 in horizontal flows, and the criterion is written as [36,37]:
here d denotes the pipe’s diameter, Re denotes the Reynolds number of flows, Gr denotes the Grashof number. It is generally acknowledged that the effect of buoyancy needs to be considered in the case of Ri > 0.001, and the effect becomes more important with the increase of Ri.
The drastic change of thermophysical properties may also lead to the effect of thermal acceleration, which impacts the heat transfer features of S-CO2 greatly by influencing the boundary layers. The criterion of Kv is employed to assess the influence of thermal acceleration for S-CO2 flow in this study [38]:
where α is the coefficient of thermal expansion. In general, when the criterion of Kv is less than 3 × 10⁻⁶, the thermal acceleration effect can be neglected in the studies of S-CO2 flows.
Notable differences can be observed in flow and heat transfer features of S-CO2 flows when the boundary conditions are slightly different, since the thermophysical properties vary drastically. In this section, the influences of pipe diameter and heat-flux conditions on the heat transfer features are investigated, and the irreversibilities associated with heat transfer and pressure drop in the S-CO2 flows are explored, along with a detailed discussion on the underlying mechanism.
3.1 Influence of Pipe Diameter
To analyse the effect of the tube diameter on the thermal-hydraulic features in S-CO2 flows, two tubes of 4 and 6 mm are considered, and the other geometric parameters of the pipe are kept the same as shown in Fig. 1. To keep the same inlet Reynolds number for the two pipes, the inlet mass flux is set to be 400 kg/(m2·s) for the 4 mm pipe, and 300 kg/(m2·s) for the 6 mm pipe, respectively. The other conditions are set as follows: Tin = 288.15 K, q = 50 kW/m2, and Pin = 8.0 MPa. Variations of Tw and hb in response to Tb along the flow direction (in the positive direction of the z-axis in Fig. 1) are presented in Fig. 4. In can be seen from Fig. 4a that the Tw gradually increases upstream of where Tb is ~1 K below Tpc and then increases significantly. Moreover, Tw is ~24 K higher in the 6 mm pipe than the 4 mm pipe on average. Fig. 4b shows that the hb generally increases after a slight decrease in the entrance of the diabatic section, and reaches a peak where Tb is ~1 K below Tpc. The heat transfer coefficient (hb) is increased by an average of 1.3 times in the 4 mm pip, and the peak value is about 3 times as much as that in the 6 mm pipe.
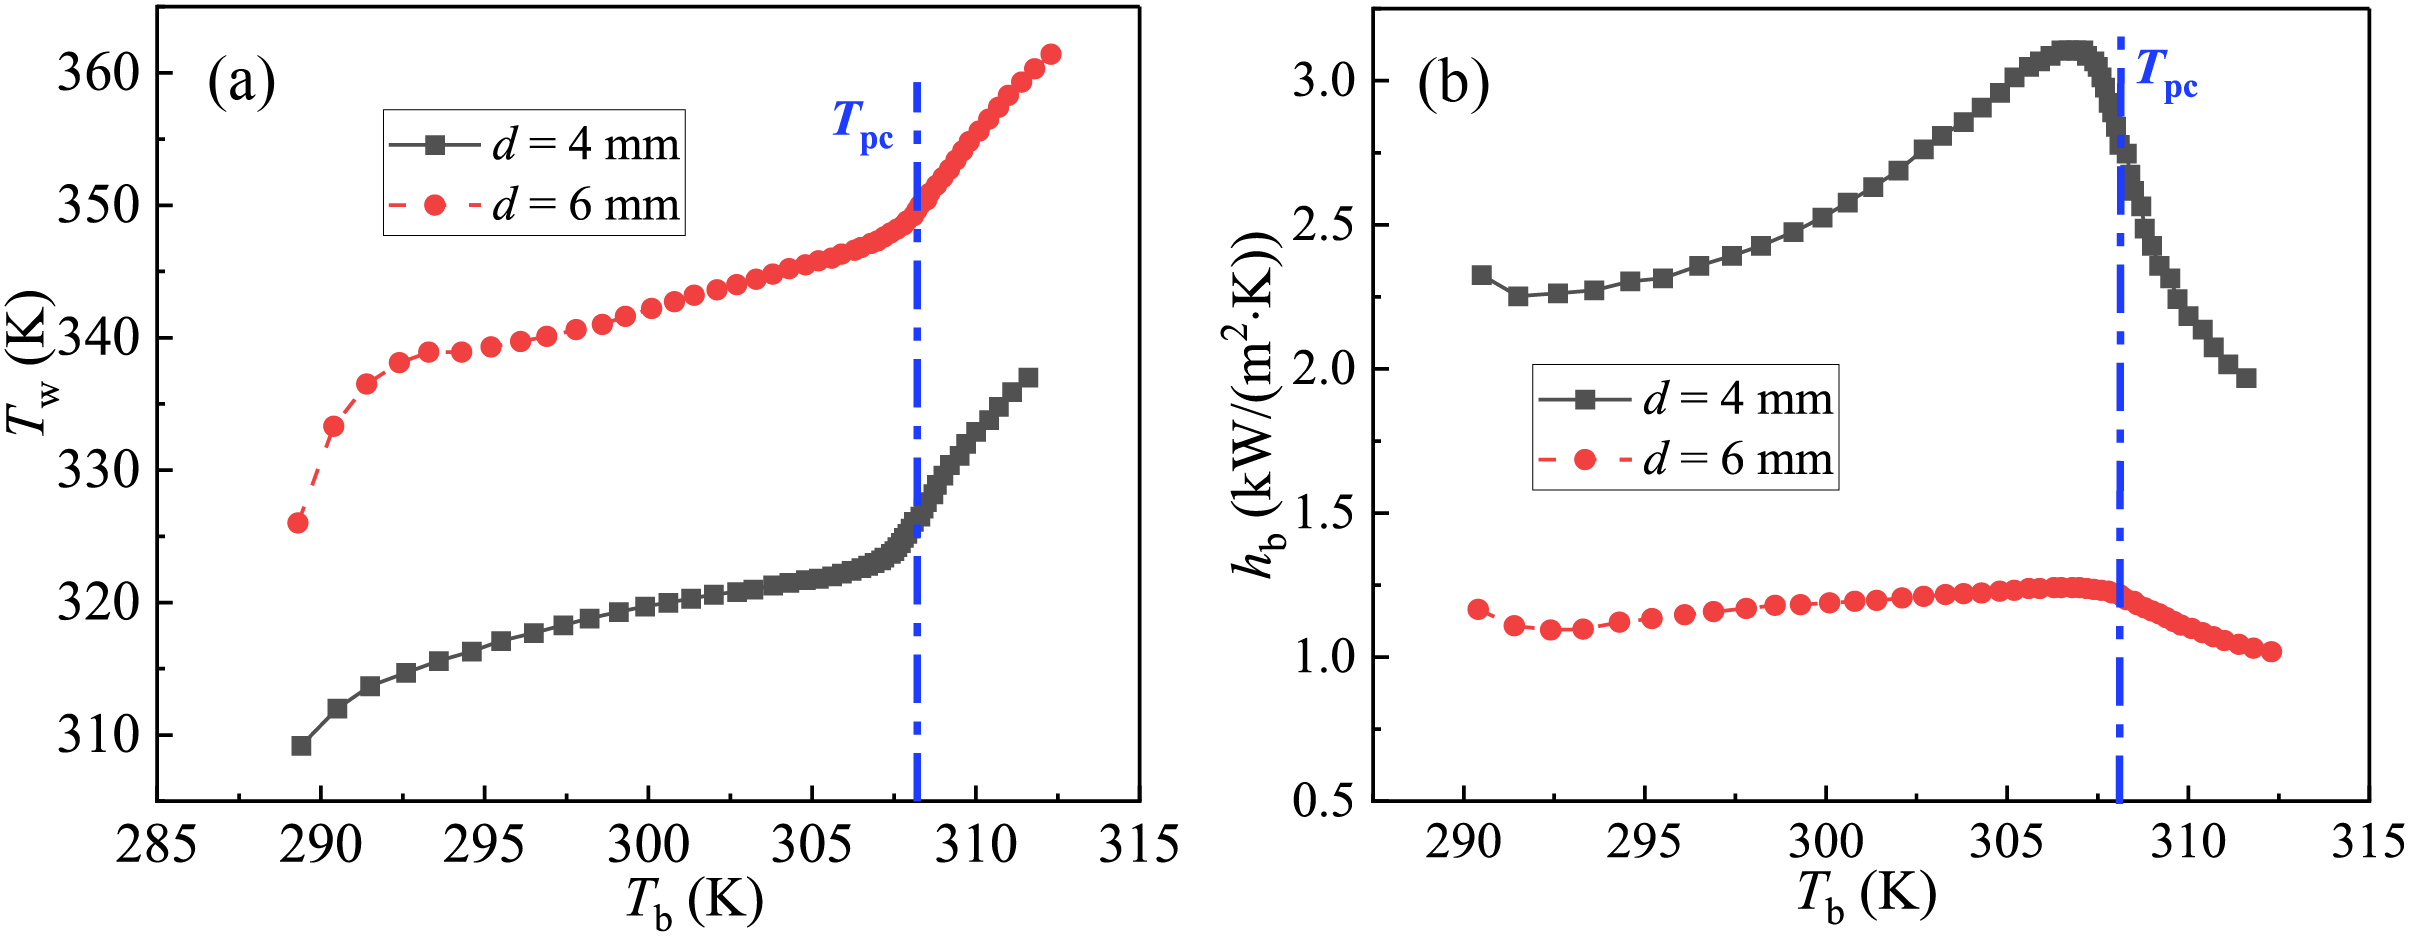
Figure 4: In two pipes with d = 4 mm and 6 mm, (a) wall temperature and (b) heat transfer coefficient against the bulk fluid temperature in the flow direction (namely, the positive direction of the z-axis in Fig. 1). The mass flux is set to 300 and 400 kg/(m2·s) to maintain the same inlet Reynolds number
The variation of entropy generation caused by heat transfer (Sg,ΔT) and flow resistance (Sg,ΔP) with the fluid bulk temperature in the two pipes is demonstrated in Fig. 5. In the 6 mm pipe, Sg,ΔT increases significantly to a peak where Tb is ~292 K, tends to be stable after a slight decrease, and drops drastically downstream of Tb = 303 K. In the 4 mm pipe, Sg,ΔT increases greatly to a peak where Tb is ~294 K, decreases to a trough when Tb is ~1 K below Tpc, and increases significantly downstream of where Tb is ~1 K lower than Tpc, and Sg,ΔT is ~67% lower on average in the 4 mm pipe relative to the 6 mm pipe. Fig. 5b shows that the two flows deliver similar changing trends in Sg,ΔP, which increases slightly and then significantly downstream of where Tb is ~2 K below Tpc, and Sg,ΔP is ~1.1 times higher on average in the 4 mm pipe. It can be seen that Sg,ΔT is higher in 6 mm pipe upstream of the pseudo-critical point, while Sg,ΔP is higher in the 4 mm pipe over the whole diabatic region, and also, Sg,ΔT is more than 100 times higher than Sg,ΔP in both flows, indicating that heat transfer is the dominant factor for local entropy generation.
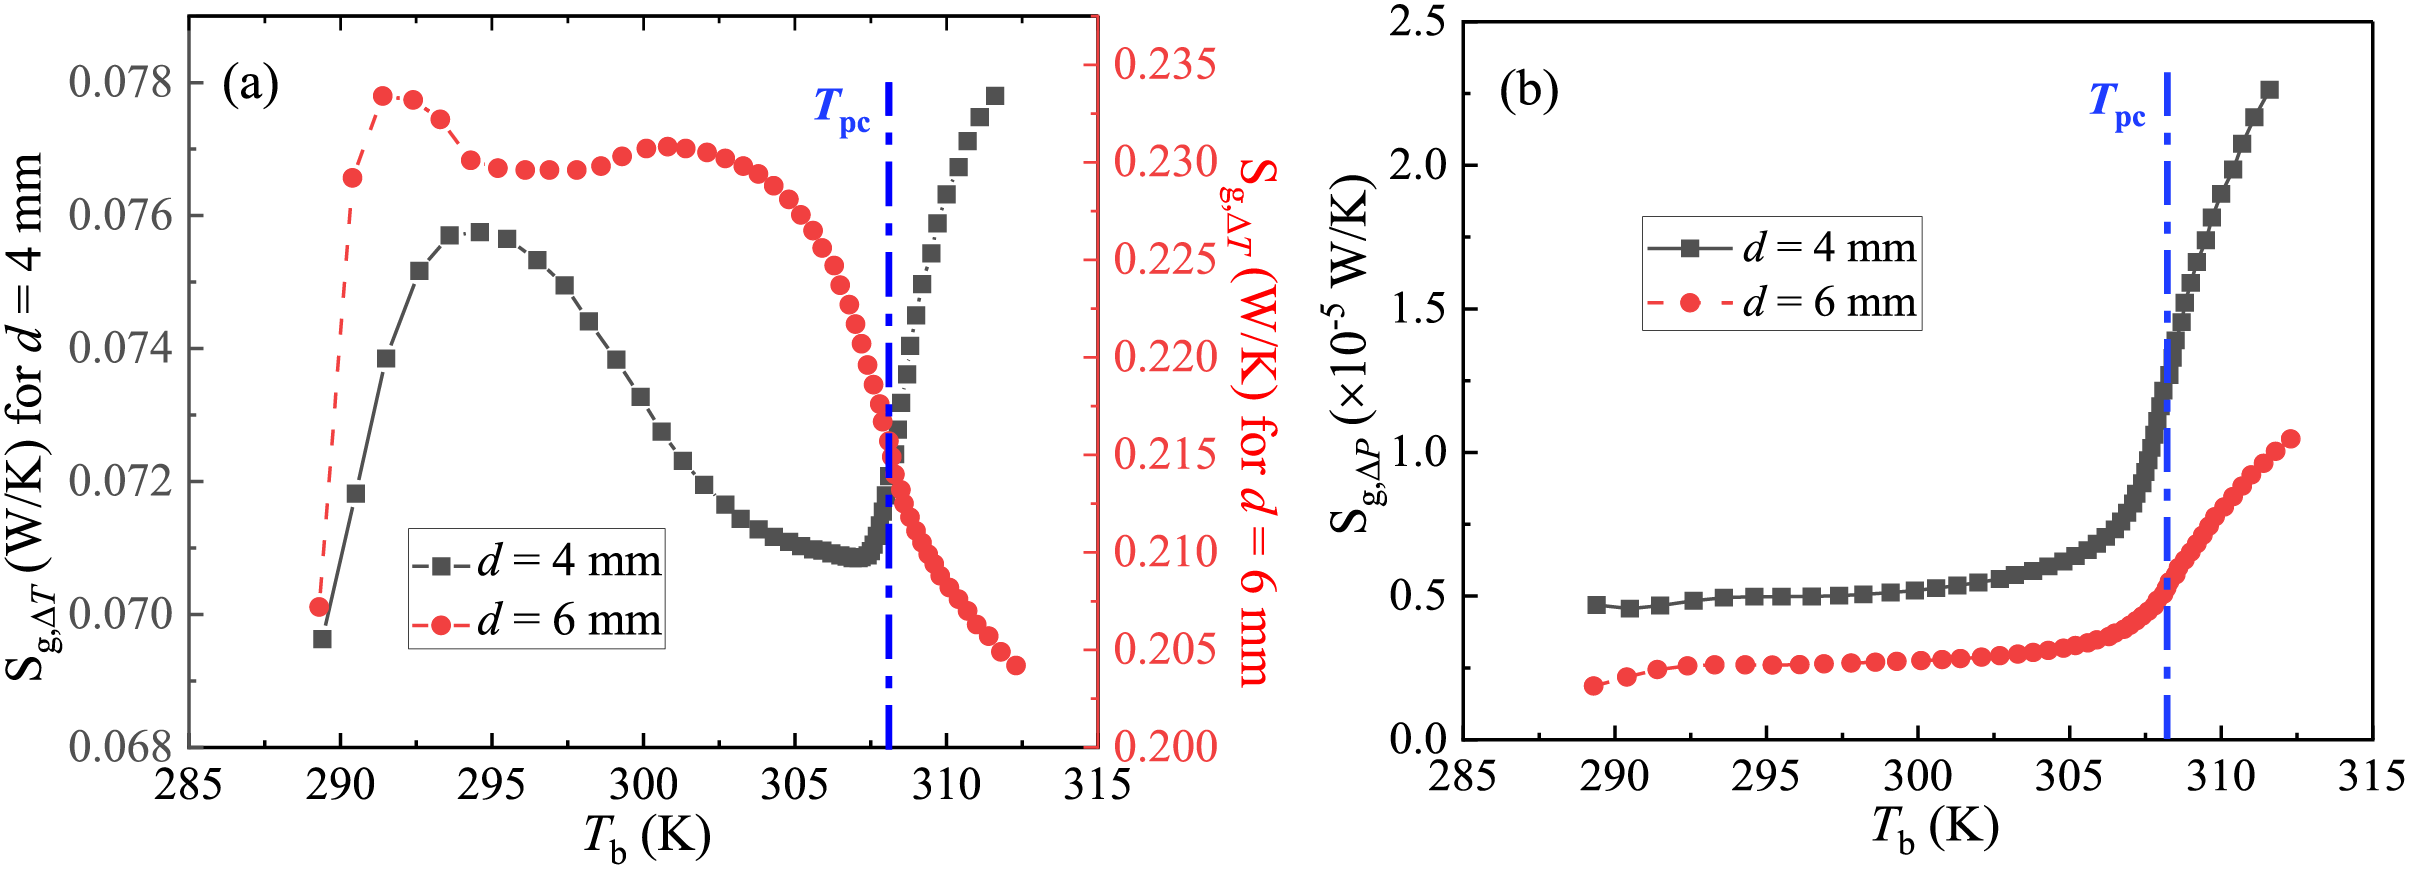
Figure 5: Variation of entropy generations that caused by (a) temperature difference, and (b) flow resistance, with bulk fluid temperature in the positive z-axis in Fig. 1 in the two pipes with d = 4 mm and 6 mm. Mass fluxes are set to be 300 and 400 kg/(m2·s), respectively, to keep the same inlet Reynolds number, and the other conditions are: Tin = 288.15 K, Pin = 8.0 MPa, and q = 50 kW/m2
Fig. 6 shows the relationships of criteria of thermal acceleration and buoyancy effect with Tb in the two pipes. Generally, Ri decreases in both flows as Tb rises, and the value of Ri is larger than 0.001 (the threshold value) in the whole diabatic region. Of note is that Ri is higher in the 6 mm pipe than the 4 mm pipe, so the buoyancy effect is more remarkable in the larger pipe. Fig. 6b shows that Kv increases firstly and then decreases as Tb rises, there exists a peak in the region at which Tb is about 2 K lower than Tpc, it is worth noting that Kv is always lower than the threshold value of 3 × 10⁻⁶, indicating that the effect of thermal acceleration can be ignored.
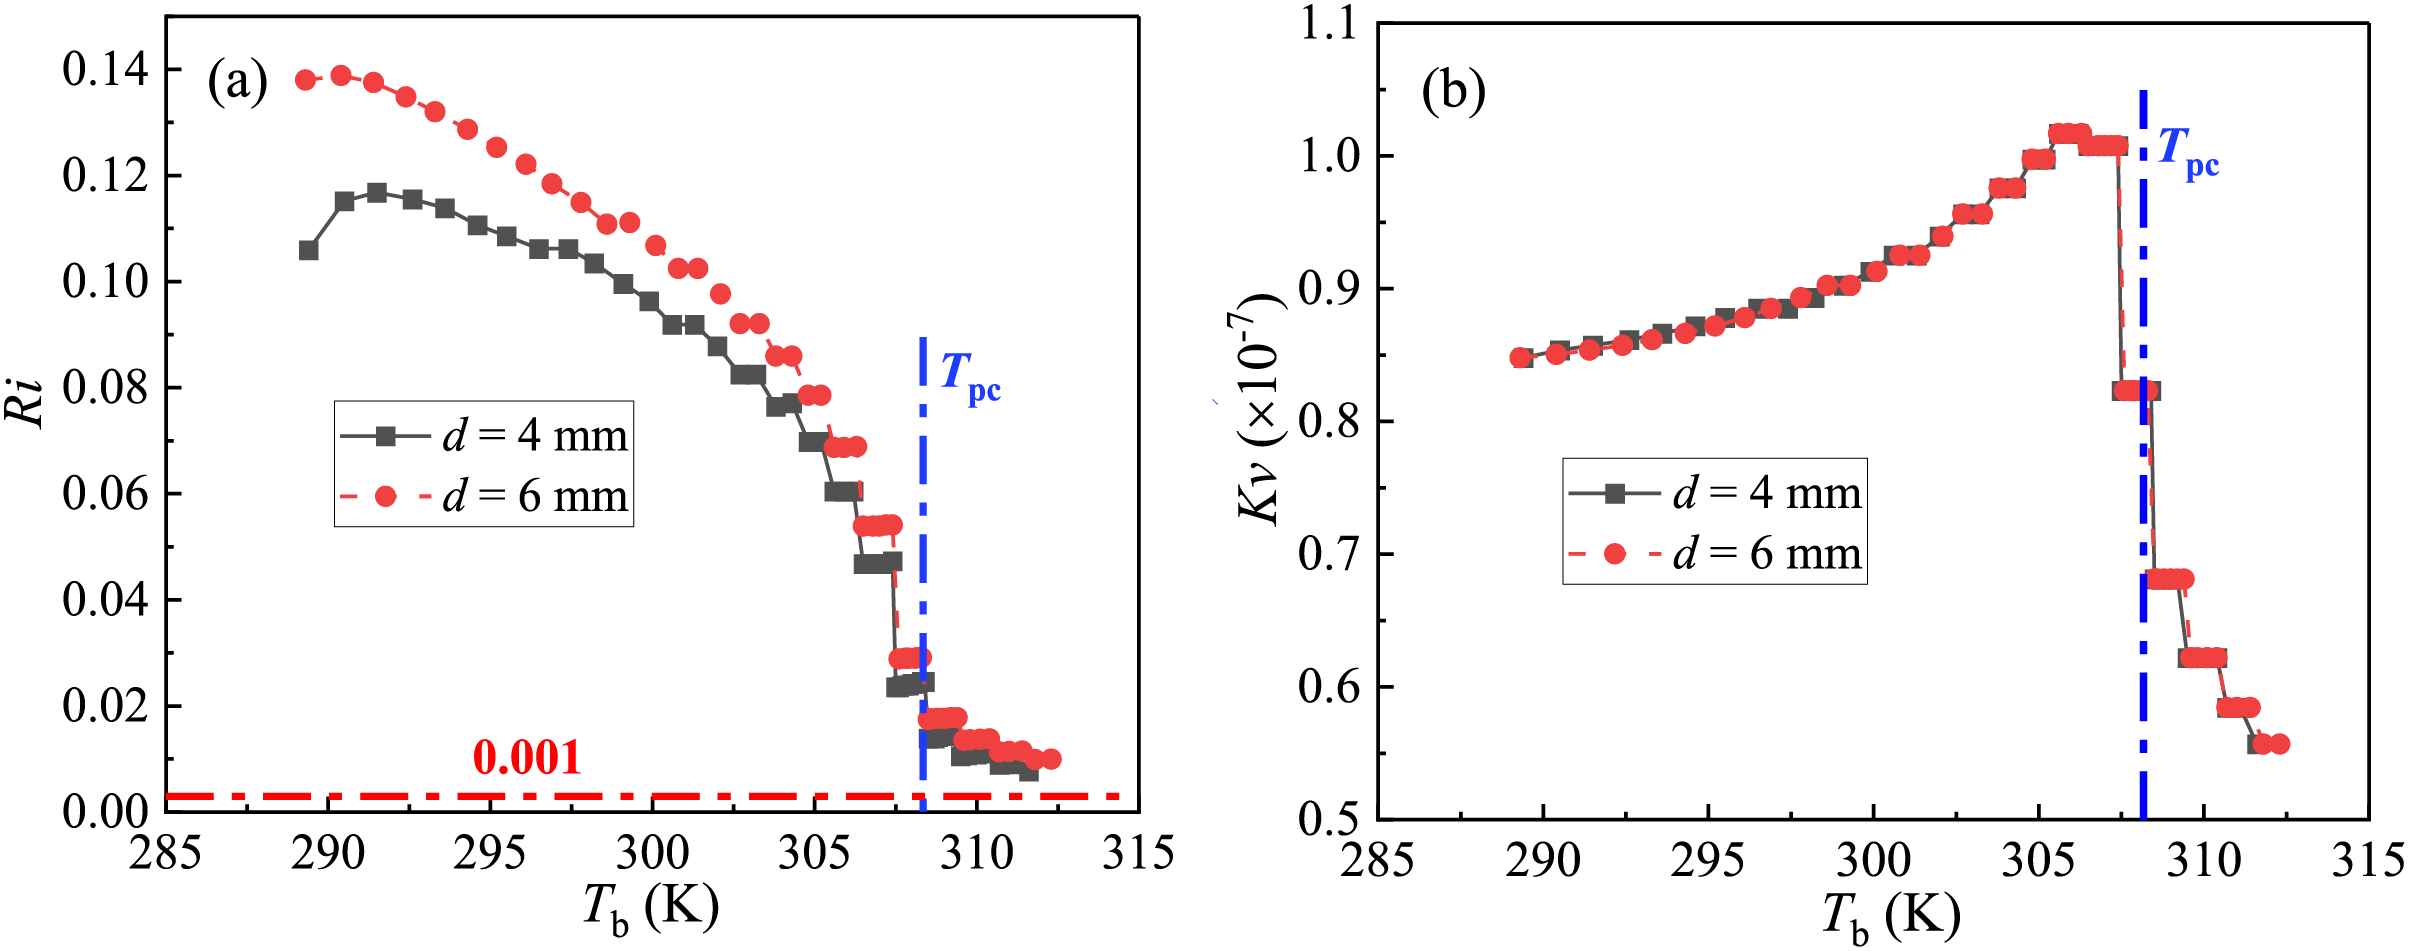
Figure 6: The relations of criteria of (a) Buoyancy effect and (b) thermal acceleration with the fluid bulk temperature in the two tubes of d = 4 mm and 6 mm. The mass flux is set to 300 and 400 kg/(m2·s) to maintain the same inlet Reynolds number
3.2 Influence of Imposed Heat Flux
Three types of heat fluxes of 50, 75 and 100 kW/m2, are considered to investigate the influence on flow and heat transfer features of horizontal S-CO2 flows. The pipe with a diameter of 4 mm is selected, with other conditions fixed at Tin = 288.15 K, Pin = 8.0 MPa and G = 400 kg/(m2·s).
Fig. 7 shows that Tw increases gradually with Tb upstream of Tpc, and rises greatly downstream of Tpc when the heat fluxes are 50 and 75 kW/m2. While under the highest heat flux of q = 100 kW/m2, Tw rises to a peak at which Tb is ~300 K and decreases to a trough where Tb is ~2 K above Tpc, and increases again along the flow direction. Fig. 7b shows that under the lowest heat flux of 50 kW/m2, hb increases after a slight decrease in the entrance of the diabatic section, and reaches a peak where Tb is 1.5 K below Tpc, and drops sharply downstream of Tpc. When the heat fluxes are 75 and 100 kW/m2, hb decreases to a trough and increases to a peak when Tb approaches Tpc, and also decreases downstream of Tpc. Of note is that the trough and the peak of hb shift to the positions with a higher Tb as heat flux rises. More precisely, the peak of hb occurs where Tb is 1.5 K below Tpc with q = 50 kW/m2, where Tb is 0.5 K below Tpc with q = 75 kW/m2, and where Tb is ~2 K above Tpc with q = 100 kW/m2, respectively. The peak of hb rises by 1.4 times with the reduction of heat flux from 100 to 50 kW/m2.
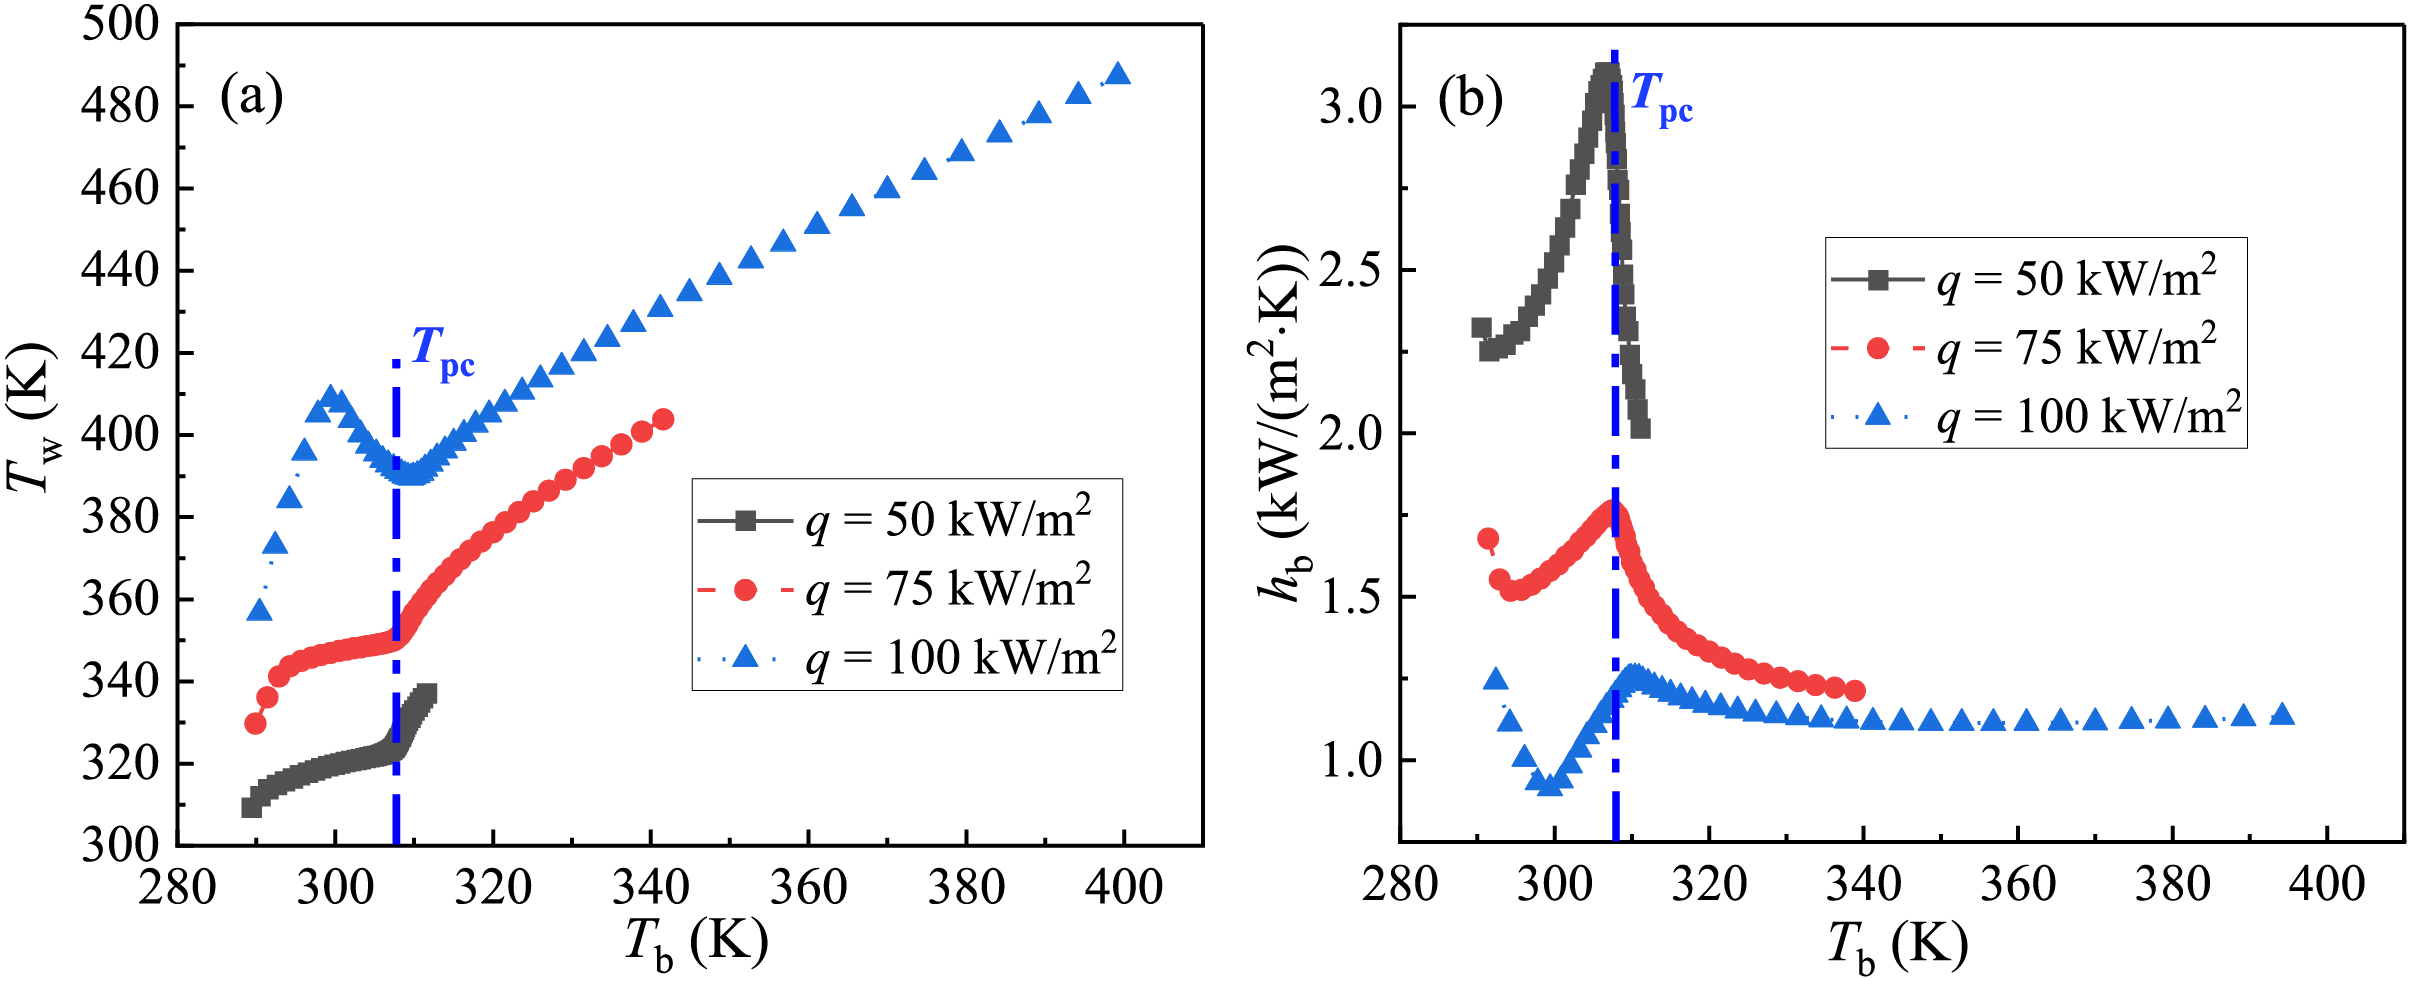
Figure 7: (a) Wall temperature and (b) heat transfer coefficient against bulk fluid temperature in positive z-axis in the 4 mm pipe with heat fluxes of 50, 75 and 100 kW/m2
The variation of entropy generation caused by temperature difference (Sg,ΔT) and flow resistance (Sg,ΔP) with the fluid bulk temperature is presented in Fig. 8. Fig. 8a shows that Sg,ΔT generally reduces as Tb grows with heat fluxes of 75 and 100 kW/m2. When the heat flux is 50 kW/m2, Sg,ΔT increases and decreases afterwards, and then increases again with the increase in Tb. Of note is that Sg,ΔT at q = 100 kW/m2 is more than 4 times higher than that at q = 50 kW/m2 on average. Fig. 8b shows that Sg,ΔP increases steadily upstream of Tpc and increases significantly downstream of Tpc, and almost coincides with the three heat fluxes, indicating the effect of heat flux on Sg,ΔP is very little. The heat flux has a more significant effect on Sg,ΔT, and also, Sg,ΔT is more than 3 orders of magnitude higher than Sg,ΔP under the conditions selected in the present work.
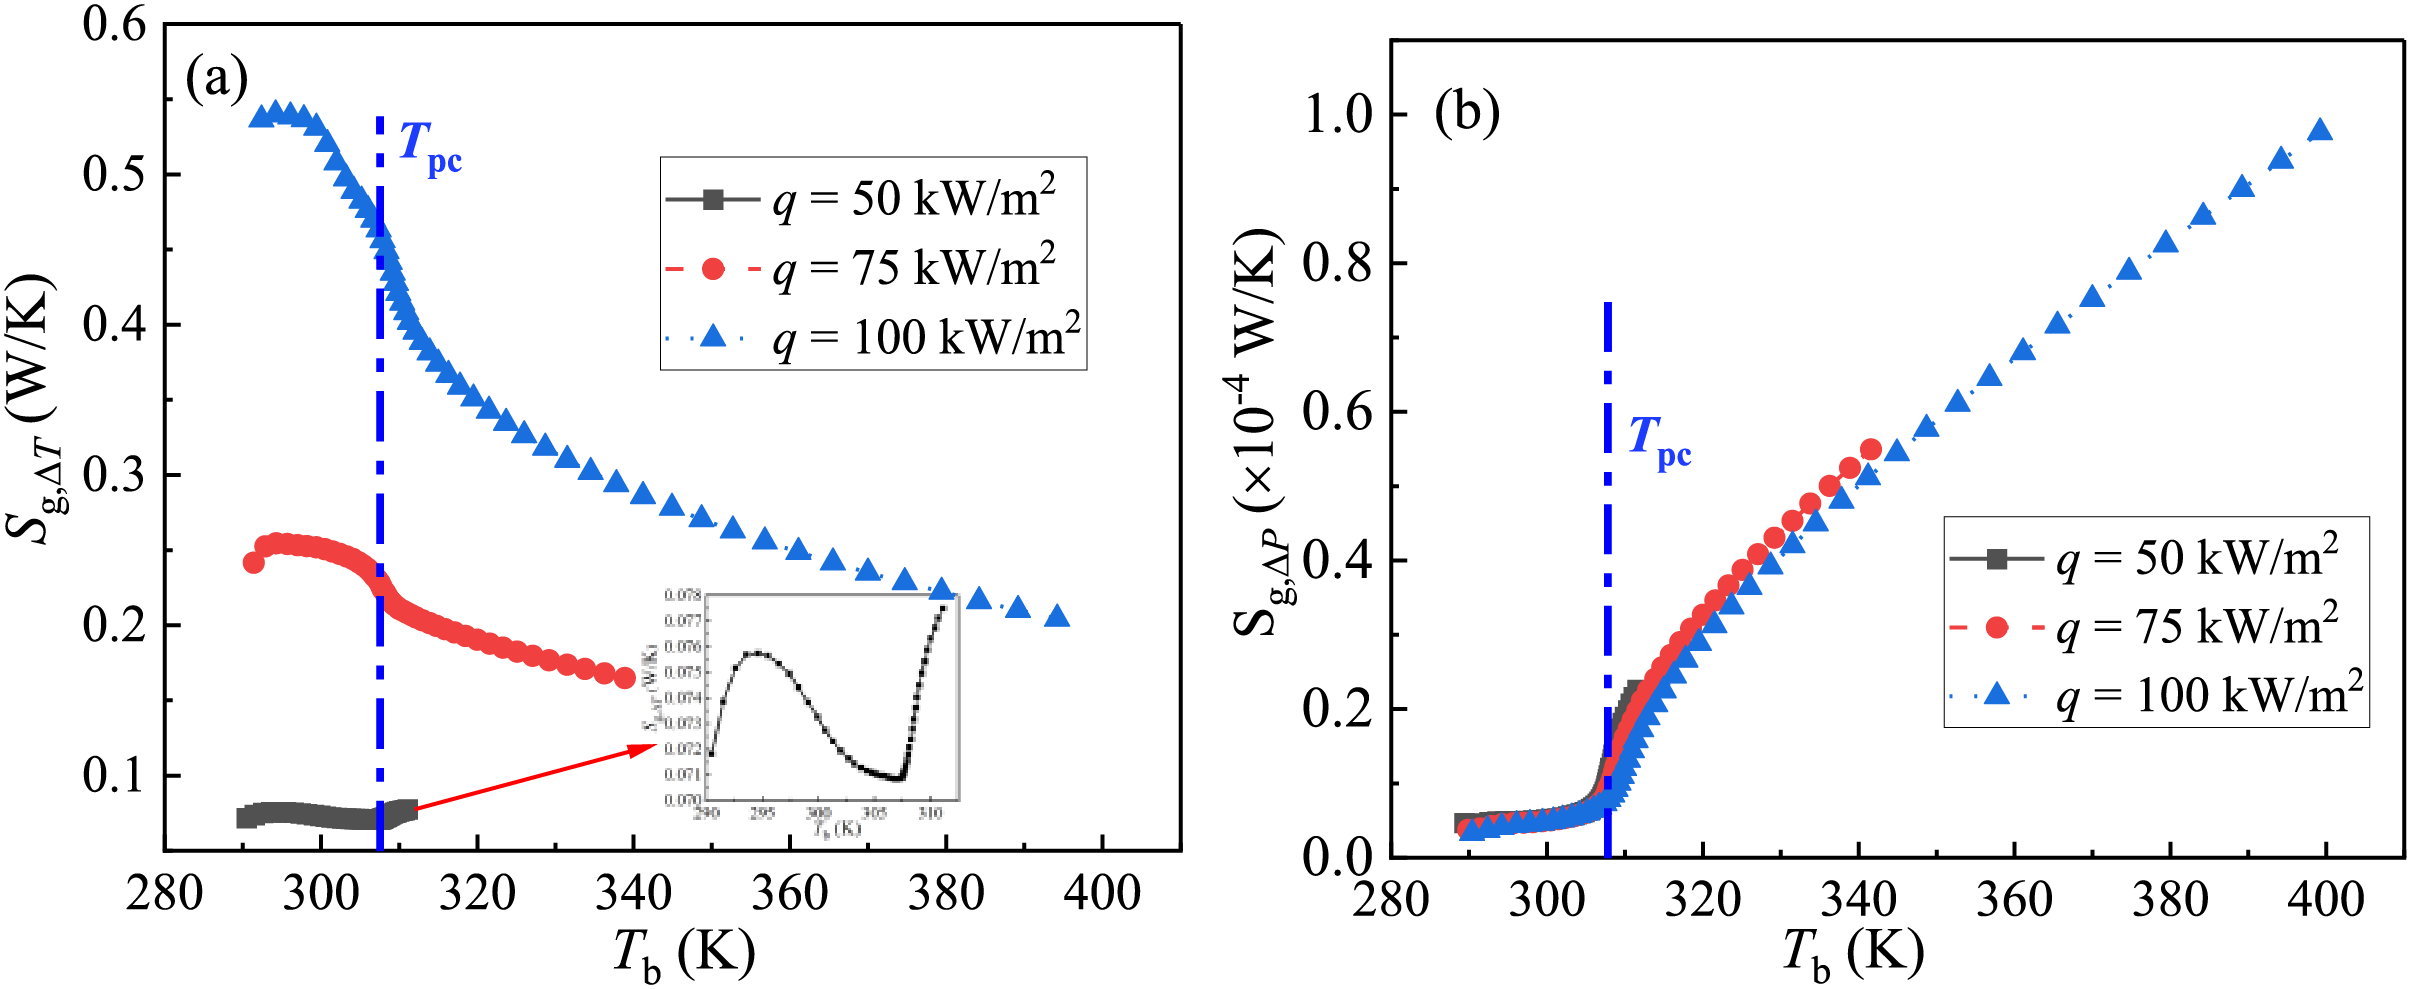
Figure 8: Variations of entropy generations caused by temperature difference and flow resistance against the fluid bulk temperature in positive z-axis in Fig. 1 with heat fluxes of 50, 75 and 100 kW/m2
From Fig. 9a, one can see that the buoyancy effect criterion Ri drops significantly upstream of where Tb is ~2 K above Tpc, and decreases to nearly zero downstream of Tpc. Moreover, Ri is always above the threshold value (0.001) in the region at which Tb is less than 340 K, and it becomes higher as heat flux rises, this demonstrates that the buoyancy effect must be considered and is strengthened as the heat flux increases. Fig. 9b shows that the thermal acceleration criterion Kv yields a similar changing trend for the three heat fluxes, which increases firstly and then decreases, there exists a peak in the region at which Tb is ~2 K below Tpc, with a drastic drop observed near the pseudo-critical point. One can see that the criterion Kv is always lower than 3 × 10⁻⁶ (the threshold value), indicating that the effect of thermal acceleration can be ignored under the conditions selected in the present work, although the influence of heat flux on the Kv value is significant.
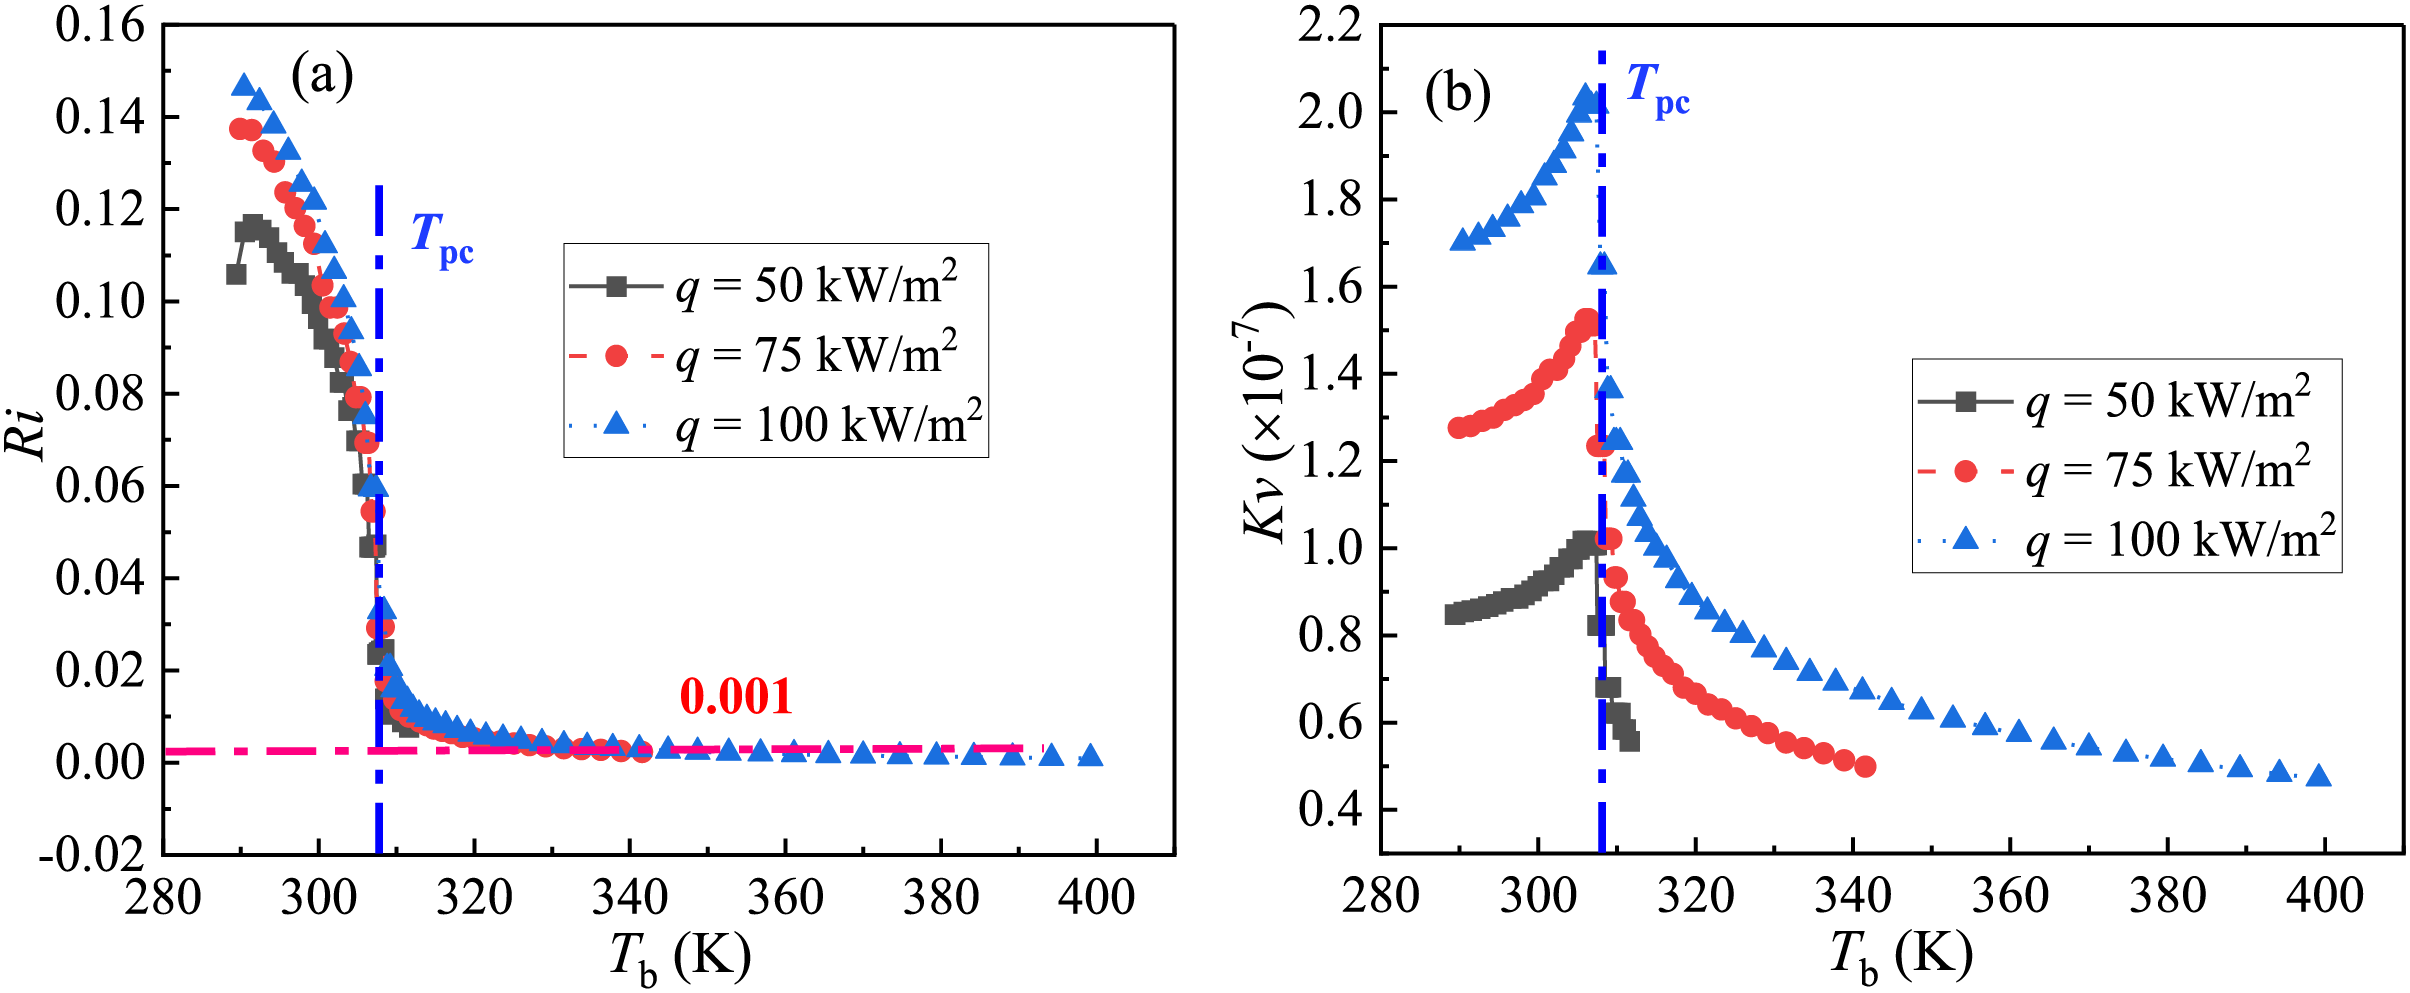
Figure 9: The relationships of change of (a) Buoyancy effect criterion, and (b) thermal acceleration criterion against bulk temperature in positive z-axis in Fig. 1, the three heat fluxes are 50, 75 and 100 kW/m2
3.3 The Difference between Heat Transfer and the Underlying Mechanism
The results above show that the criterion of the buoyancy effect is much larger than the critical value (which is 0.001), indicating that the buoyancy effect will greatly affect the local thermal-hydraulic features of S-CO2 flows. To further identify the difference of local heat transfer performance in horizontal S-CO2 flows at heating conditions, average hb based on full wall, top-half wall and bottom-half wall as a function of Tb is presented in Fig. 10 under conditions of Tin = 288.15 K, G = 400 kg/(m2·s), q = 50 kW/m2, and Pin = 8.0 MPa.
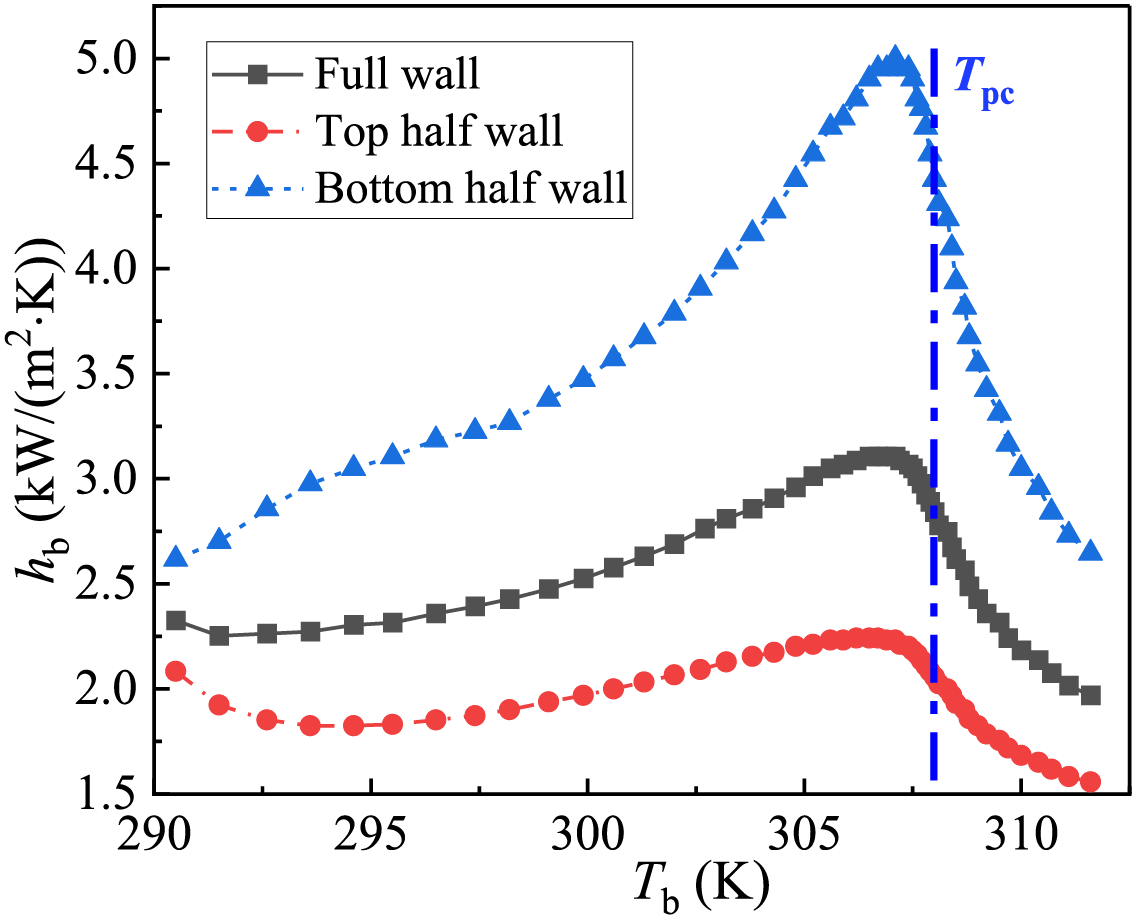
Figure 10: Average heat transfer coefficient based on full, top-half, and bottom-half walls against fluid bulk temperature in positive z-axis in Fig. 1 at conditions of Tin = 288.15 K, G = 400 kg/(m2·s), q = 50 kW/m2, and Pin = 8.0 MPa
There exists a peak of where Tb is ~1 K below Tpc under the three conditions, and hb based on the bottom-half wall of the pipe is far higher than that based on the top-half wall (more than 2 times in peak value) and full wall. This indicates that there exists a huge difference in the performance of heat transfer on the same transverse section, and the heat transfer is augmented in the vicinity of the lower wall of pipe.
To explore the underlying mechanism in the heat transfer difference shown in Fig. 10, four transverse sections whose z values are 800, 900, 1000 and 1100 mm are selected to analyse the distributions of key parameters including the fluid temperature and velocity in the flow.
The temperature contours on the four transverse sections are shown in Fig. 11, indicating that temperature distributions are severely nonuniform and the fluid temperature in the vicinity of the upper wall of pipe is higher than that at the bottom. Moreover, the high-temperature region at the top enlarges along the flow direction, and Tw is higher in the top region than in the bottom region.
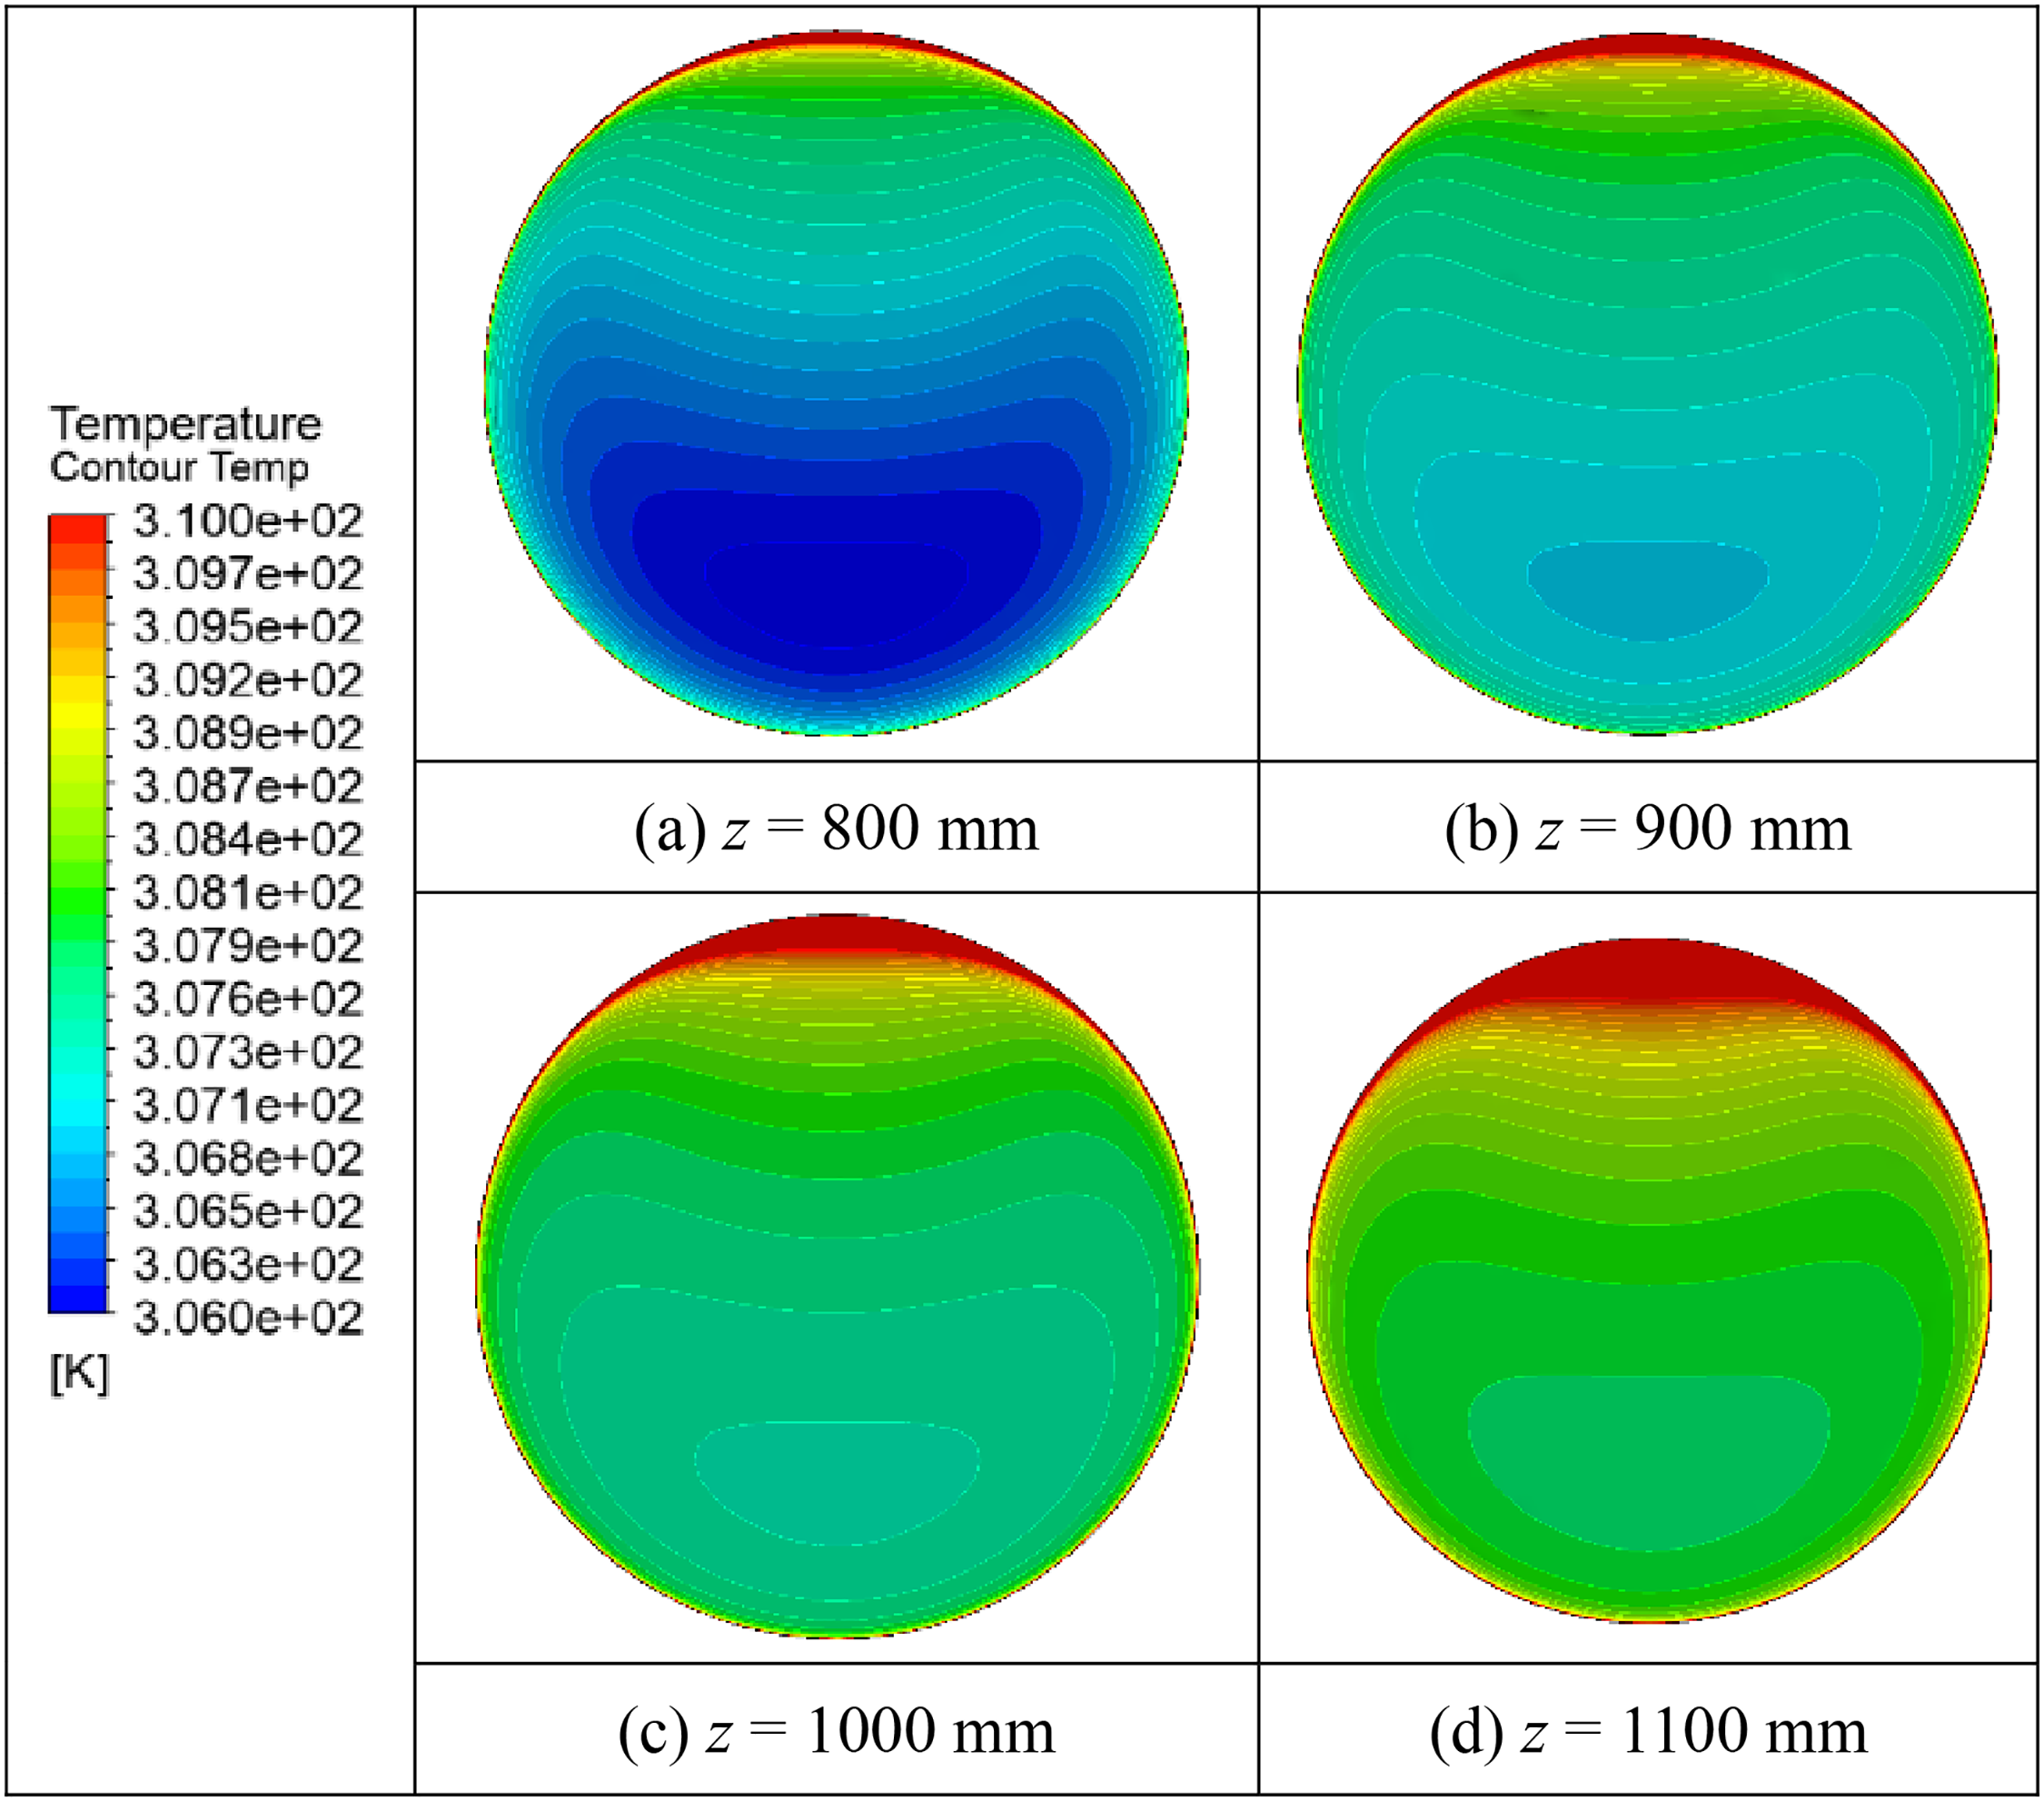
Figure 11: Temperature contours on four transverse sections whose z values are (a) 800 mm, (b) 900 mm, (c) 1000 mm, and (d) 1100 mm in the 4 mm pipe, at conditions of Tin = 288.15 K, G = 400 kg/(m2·s), q = 50 kW/m2, and Pin = 8.0 MPa
Fig. 12 shows the velocity vectors on the considered transverse sections, which indicate that secondary flows (represented by two vortexes) are formed due to the buoyancy effect. A little change of temperature would lead to a large variation of density on the cross-section due to the drastic variations of thermophysical properties of S-CO2, and the variable density on the cross-section leads to buoyancy effect under the influence of gravity. The secondary flow as well as the jet flow are formed in the process that the lighter fluid moves upwards and the heavier fluid moves downwards, which affects heat and flow characteristics greatly. The fluid flows away from the region near the top wall and moves towards the region near the bottom wall, generating a jet flow in the vicinity of the lower wall of pipe, and the velocity is higher at the bottom than that at the top. Moreover, the velocity increases (from 0.73 m/s at z = 800 mm to 0.99 m/s at z = 1100 mm) in the positive direction of z-axis due to the density decrease at heating conditions.
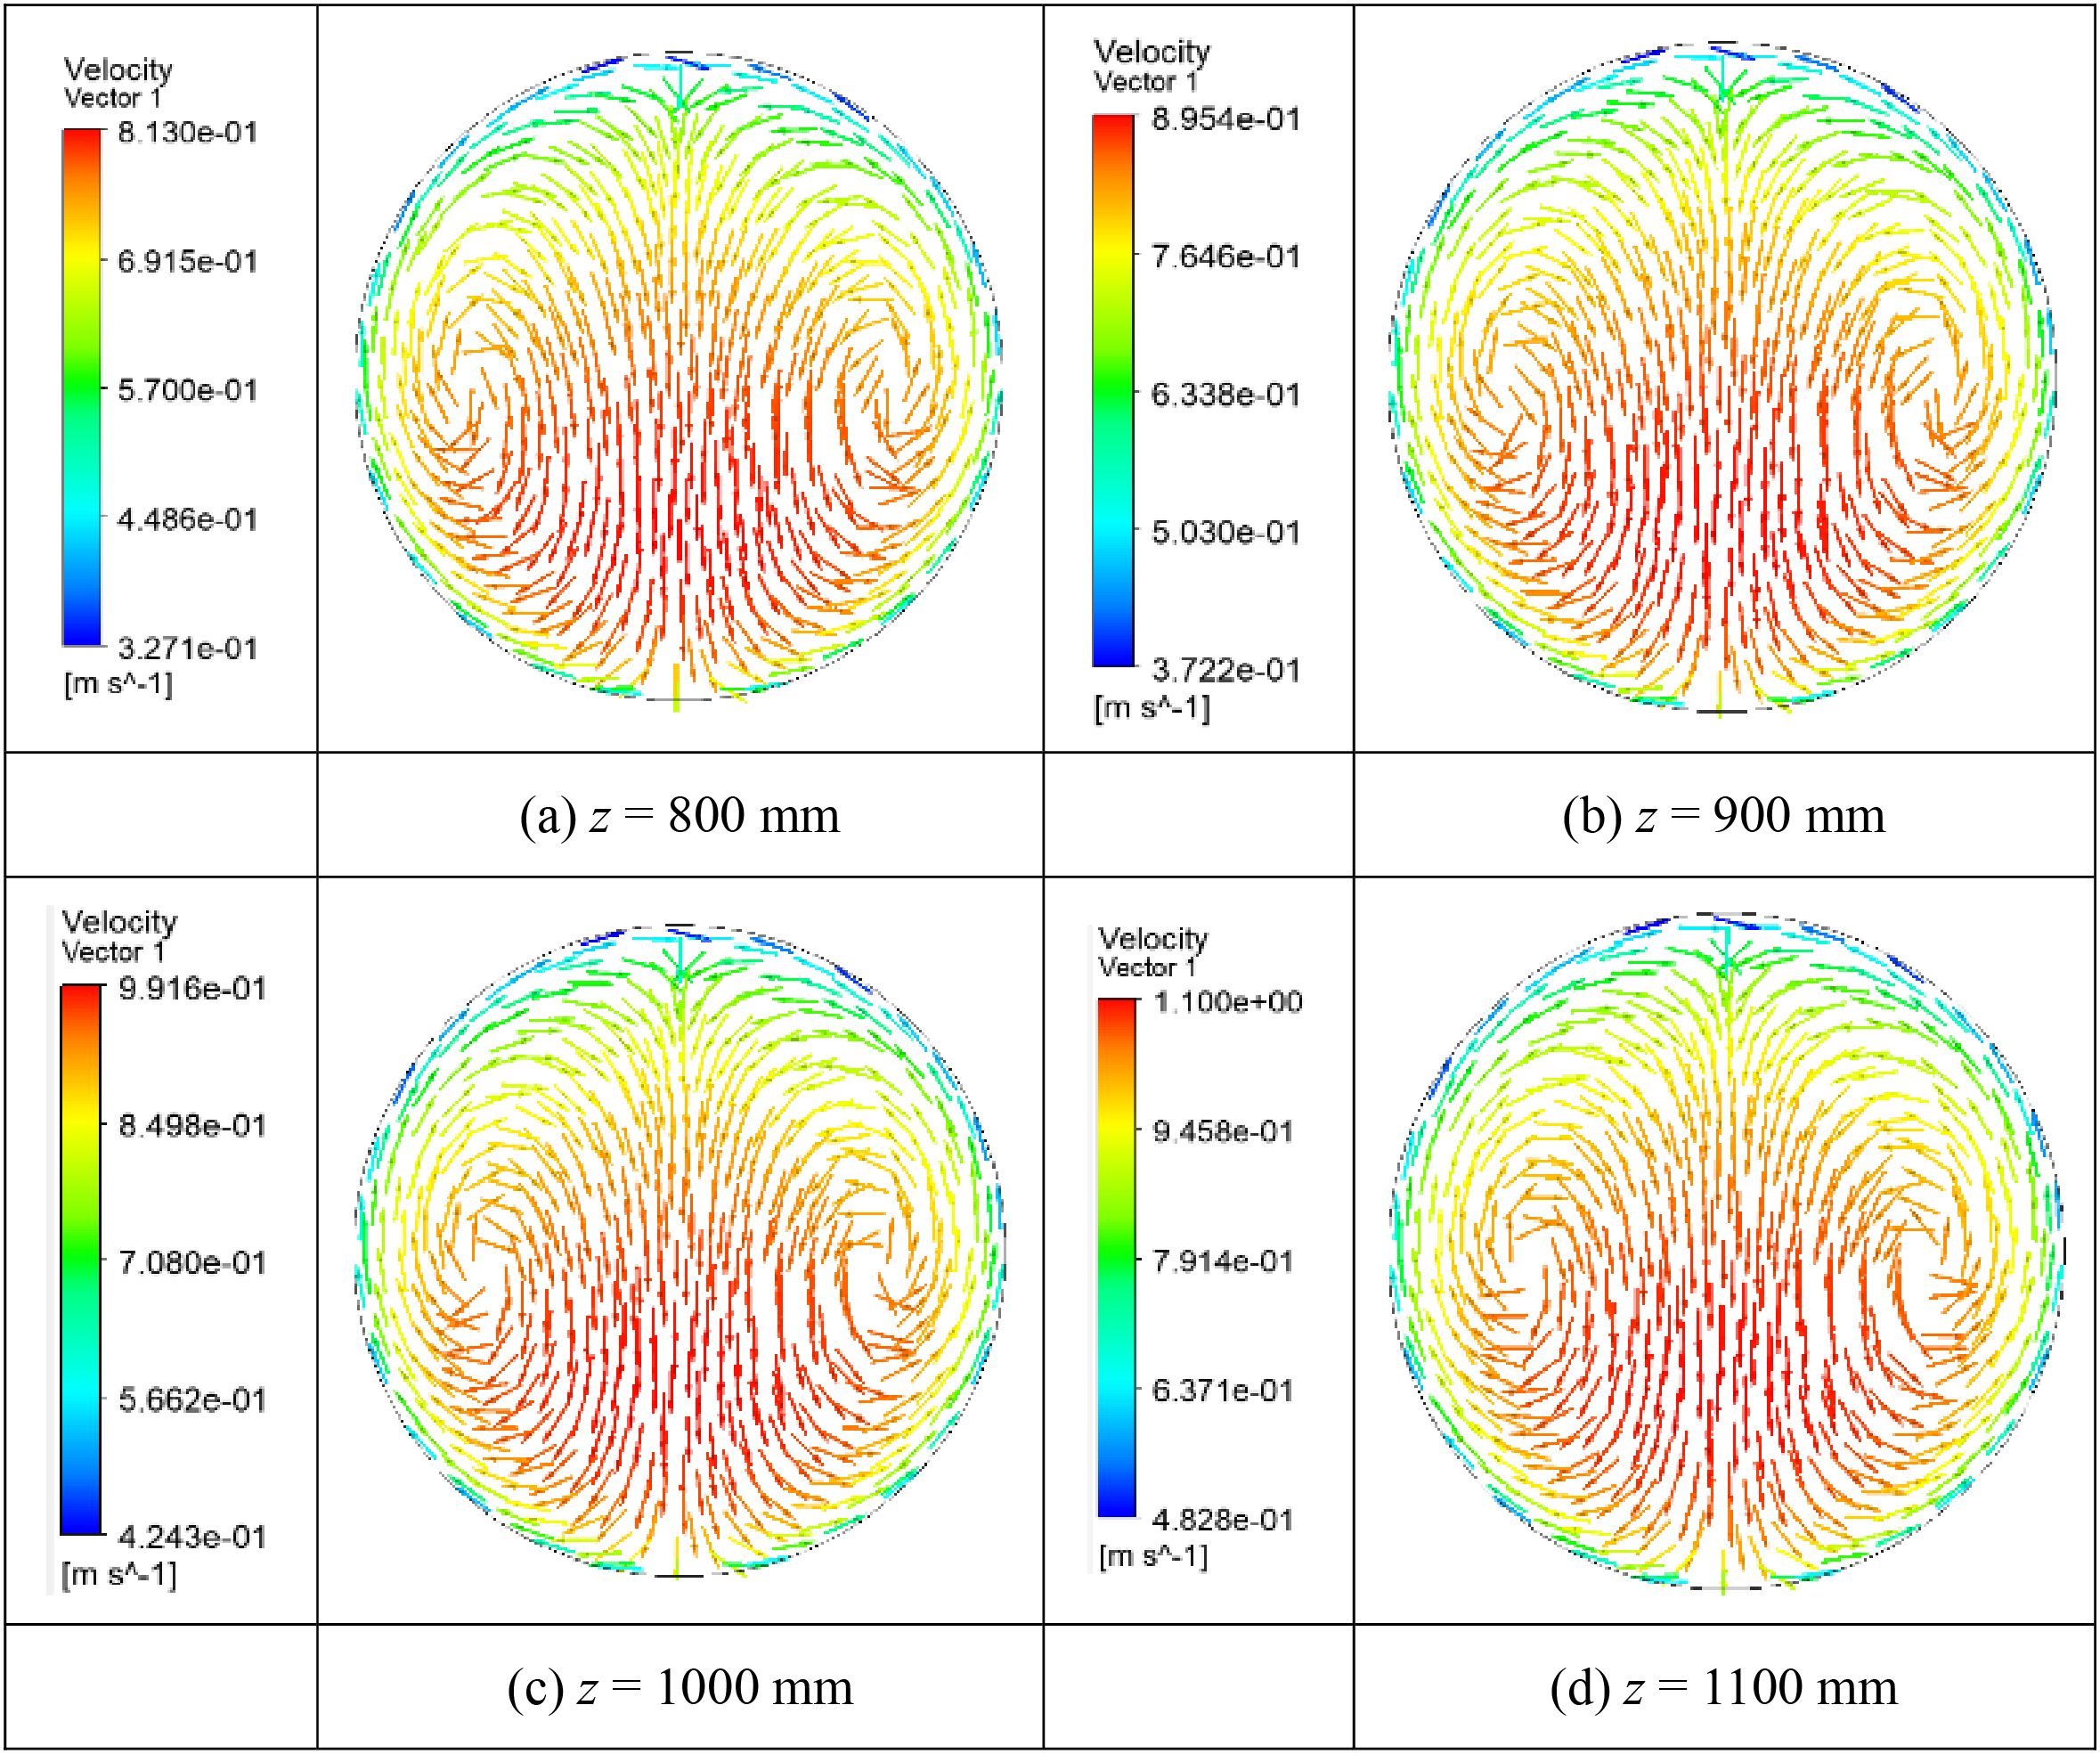
Figure 12: Velocity vectors on four transverse sections whose z values are (a) 800 mm, (b) 900 mm, (c) 1000 mm, and (d) 1100 mm in the 4 mm pipe, at conditions of Tin = 288.15 K, G = 400 kg/(m2·s), q = 50 kW/m2, and Pin = 8.0 MPa
To further explore the relationship between the two fields of velocity and temperature gradient, the field synergy principle that proposed by Guo et al. [39,40] is adopted, in this principle the dimensionless Nusselt number can be written as:
with:
where
The synergy angle contours on the four transverse sections whose z values are 800, 900, 1000 and 1100 mm are presented in Fig. 13. This indicates that β in the near-wall region at the bottom is smaller while is higher at the top. The fluid flow in the region below the two vortices is the most intense, forming a jet flow towards the bottom wall. Thus, the temperature gradient and velocity fields in this region are also the most synergetic, resulting in the smallest β. On the contrary, the near-wall region at the top is less affected by the vortices, as the two circulation flows collide, and the temperature gradient and velocity fields are the least synergetic, resulting in the largest β. Therefore, the heat transfer is significantly improved in the near-wall region at the bottom of the pipe.
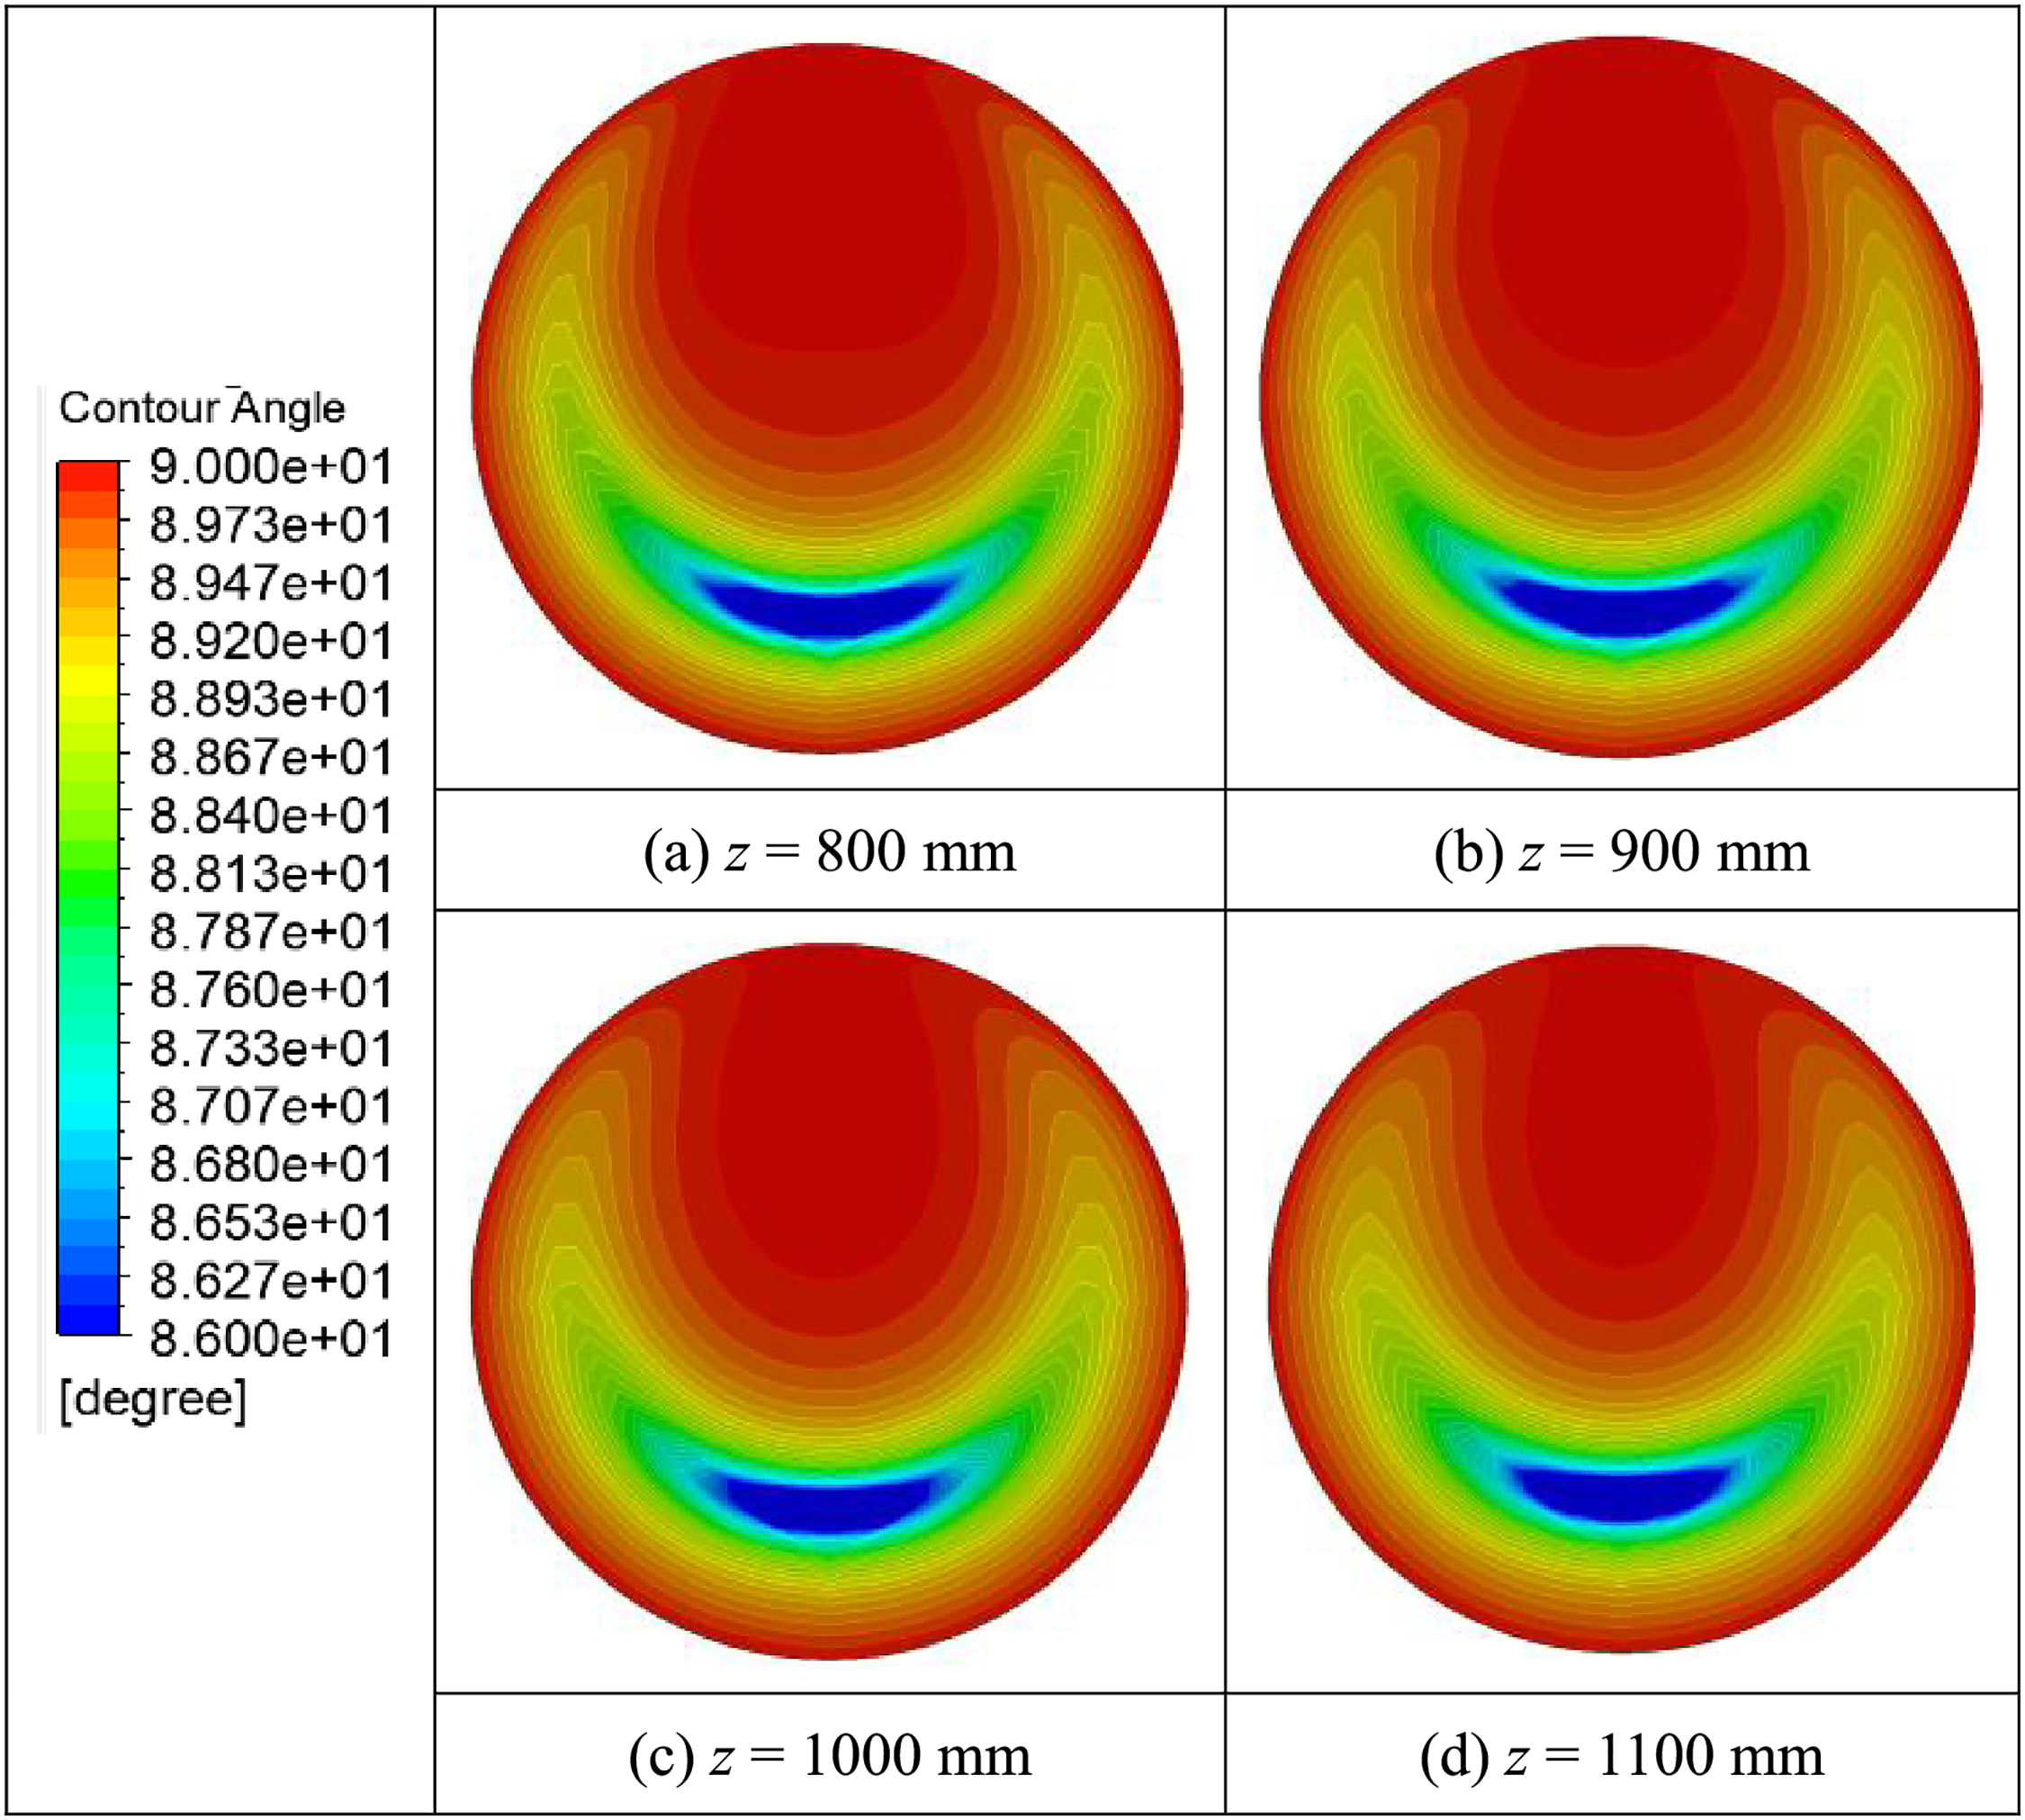
Figure 13: Synergy angle between fields of velocity and temperature gradient on four transverse sections whose z value is (a) 800 mm, (b) 900 mm, (c) 1000 mm, and (d) 1100 mm in the 4 mm pipe, at conditions of Tin = 288.15 K, G = 400 kg/(m2·s), q = 50 kW/m2, and Pin = 8.0 MPa
The contours of entropy generations caused by temperature difference and flow resistance at the cross-section of z = 1000 mm are demonstrated in Fig. 14, showing that large Sg,ΔT and Sg,ΔP are mainly identified in the near-wall region. It can be seen that Sg,ΔT is distributed nonuniformly, and large Sg,ΔT is mainly concentrated in the vicinity of the upper wall of pipe, while it is less distributed at the bottom. By comparing Figs. 10 and 14, it can be concluded that hb and Sg,ΔT have opposite distribution characteristics, namely, the region with higher hb yields less irreversible loss caused by heat transfer. It also can be seen that Sg,ΔP is evenly distributed in the near-wall region, indicating that it is less affected by the buoyancy effect. In addition, Fig. 14 demonstrates that the irreversible losses in the core region are much lower than that in the near-wall region.
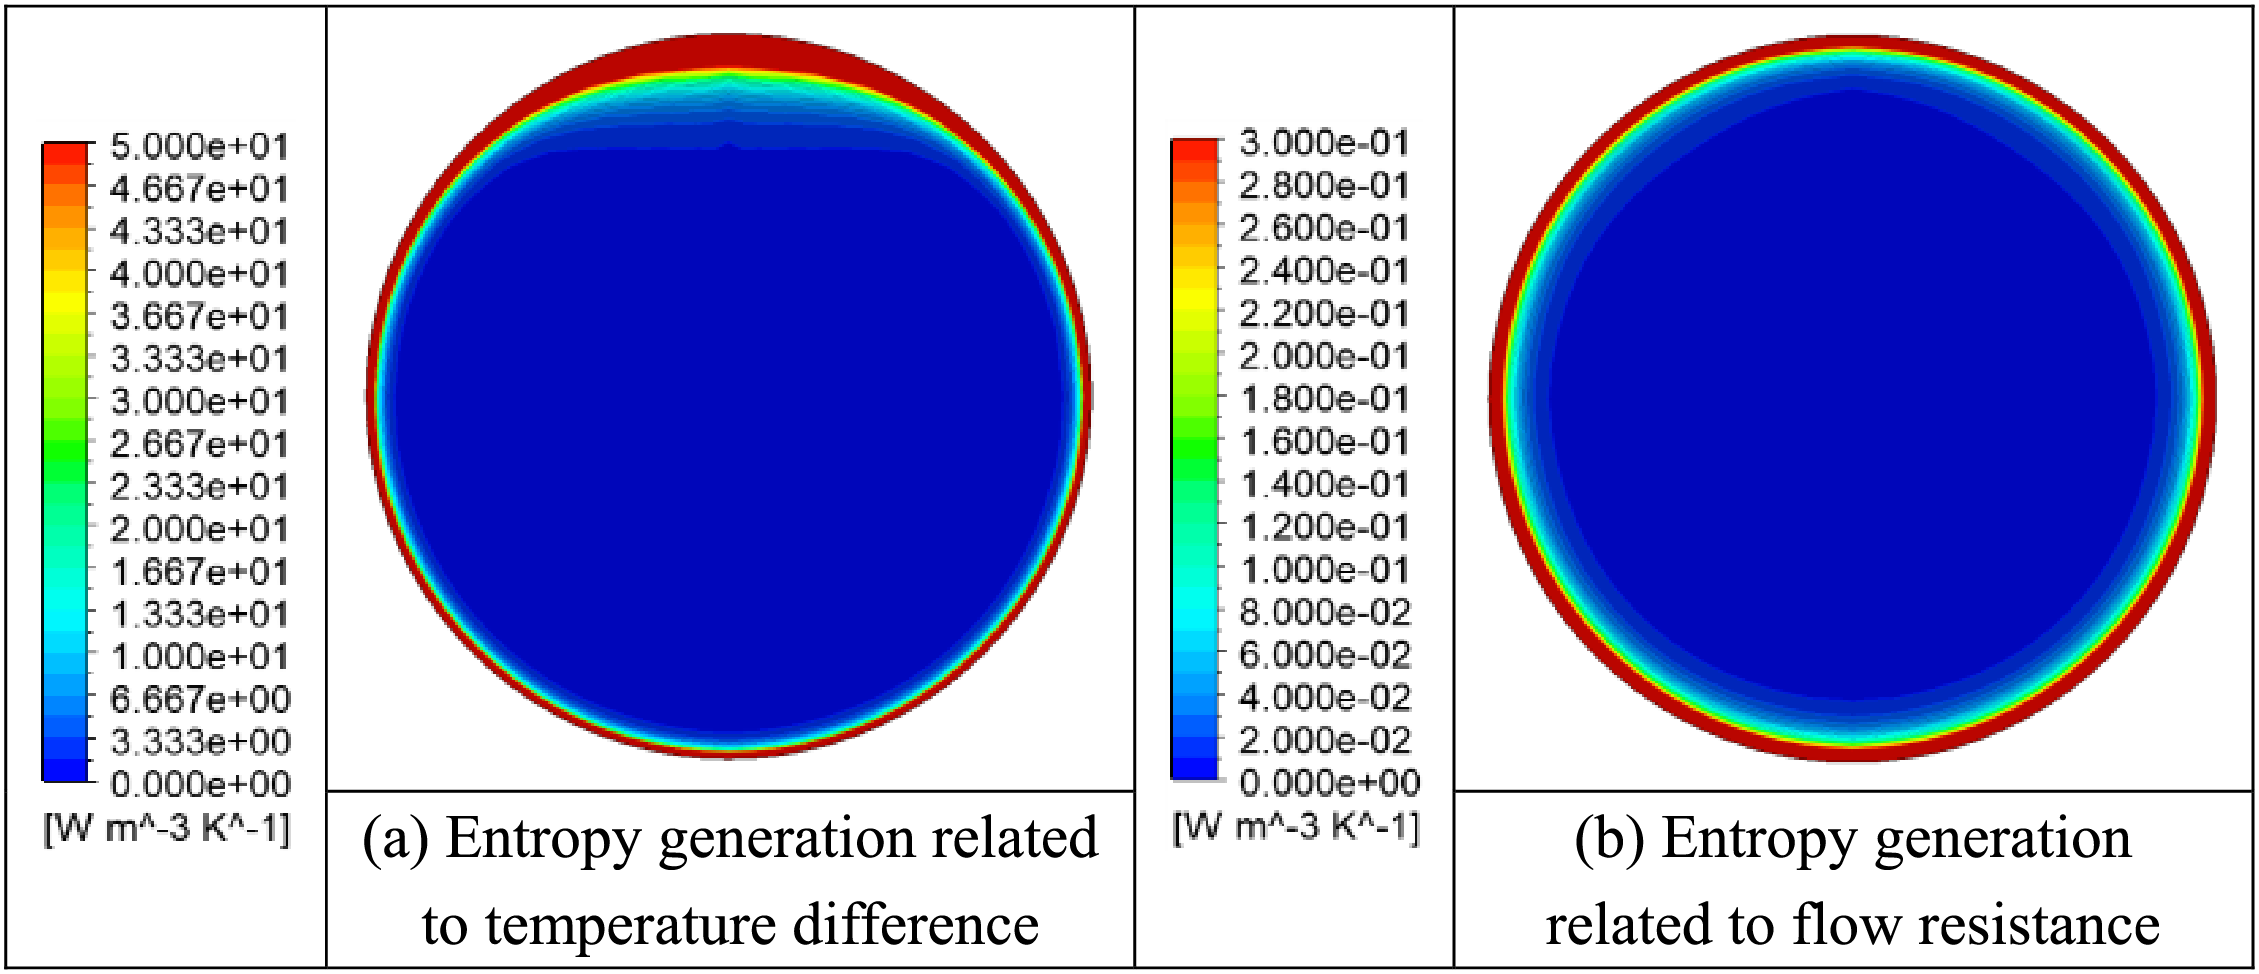
Figure 14: Entropy generations caused by (a) temperature difference, and (b) flow resistance at the cross-section at location of z = 1000 mm in the 4 mm pipe, at conditions of Tin = 288.15 K, G = 400 kg/(m2·s), q = 50 kW/m2, and Pin = 8.0 MPa
Fig. 15 shows the distribution of radial density, specific heat capacity, thermal conductivity, and turbulent kinetic energy on a cross-section of z = 1100 mm. Fig. 15a shows that the density generally decreases from the bottom of the pipe to the top due to the concentration of low-density fluid in the vicinity of the upper wall, while high-density fluid is concentrated in the vicinity of the lower wall due to the effect of buoyancy. The specific heat decreases and then rises from core to wall to peak, dropping substantially in the near-wall region along the θ = 0° direction and θ = 45° direction, as shown in Fig. 15b, while remaining almost constant in the region where is far away from the wall (i.e., the core region), dropping in the direction from fluid core to the wall the at θ = 90°, θ = 135°, as well as θ = 180°. In general, in the near-wall region, the specific heat capacity decreases from the bottom to the top, indicating that the fluid has an enhanced heat transfer capacity in the vicinity of the lower wall. Fig. 15c shows that thermal conductivity generally decays from bottom to top, with thermal conductivity from core to wall remaining almost constant at θ = 0°, θ = 45°, as well as θ = 90°, while thermal conductivity from core to wall gradually decreases at θ = 135° and θ = 180°. Fig. 15d shows that in the core of fluid, the turbulent energy generally decreases from top to bottom, while in the vicinity of wall, the turbulent energy decreases from bottom to top. It can be seen that the distribution of local parameters is seriously uneven, and the density, specific heat, thermal conductivity and turbulent kinetic energy in the vicinity of wall from the upper wall to the lower wall, indicating that the heat transfer in the vicinity of lower wall is enhanced, and the heat transfer in the vicinity of the upper wall deteriorates.
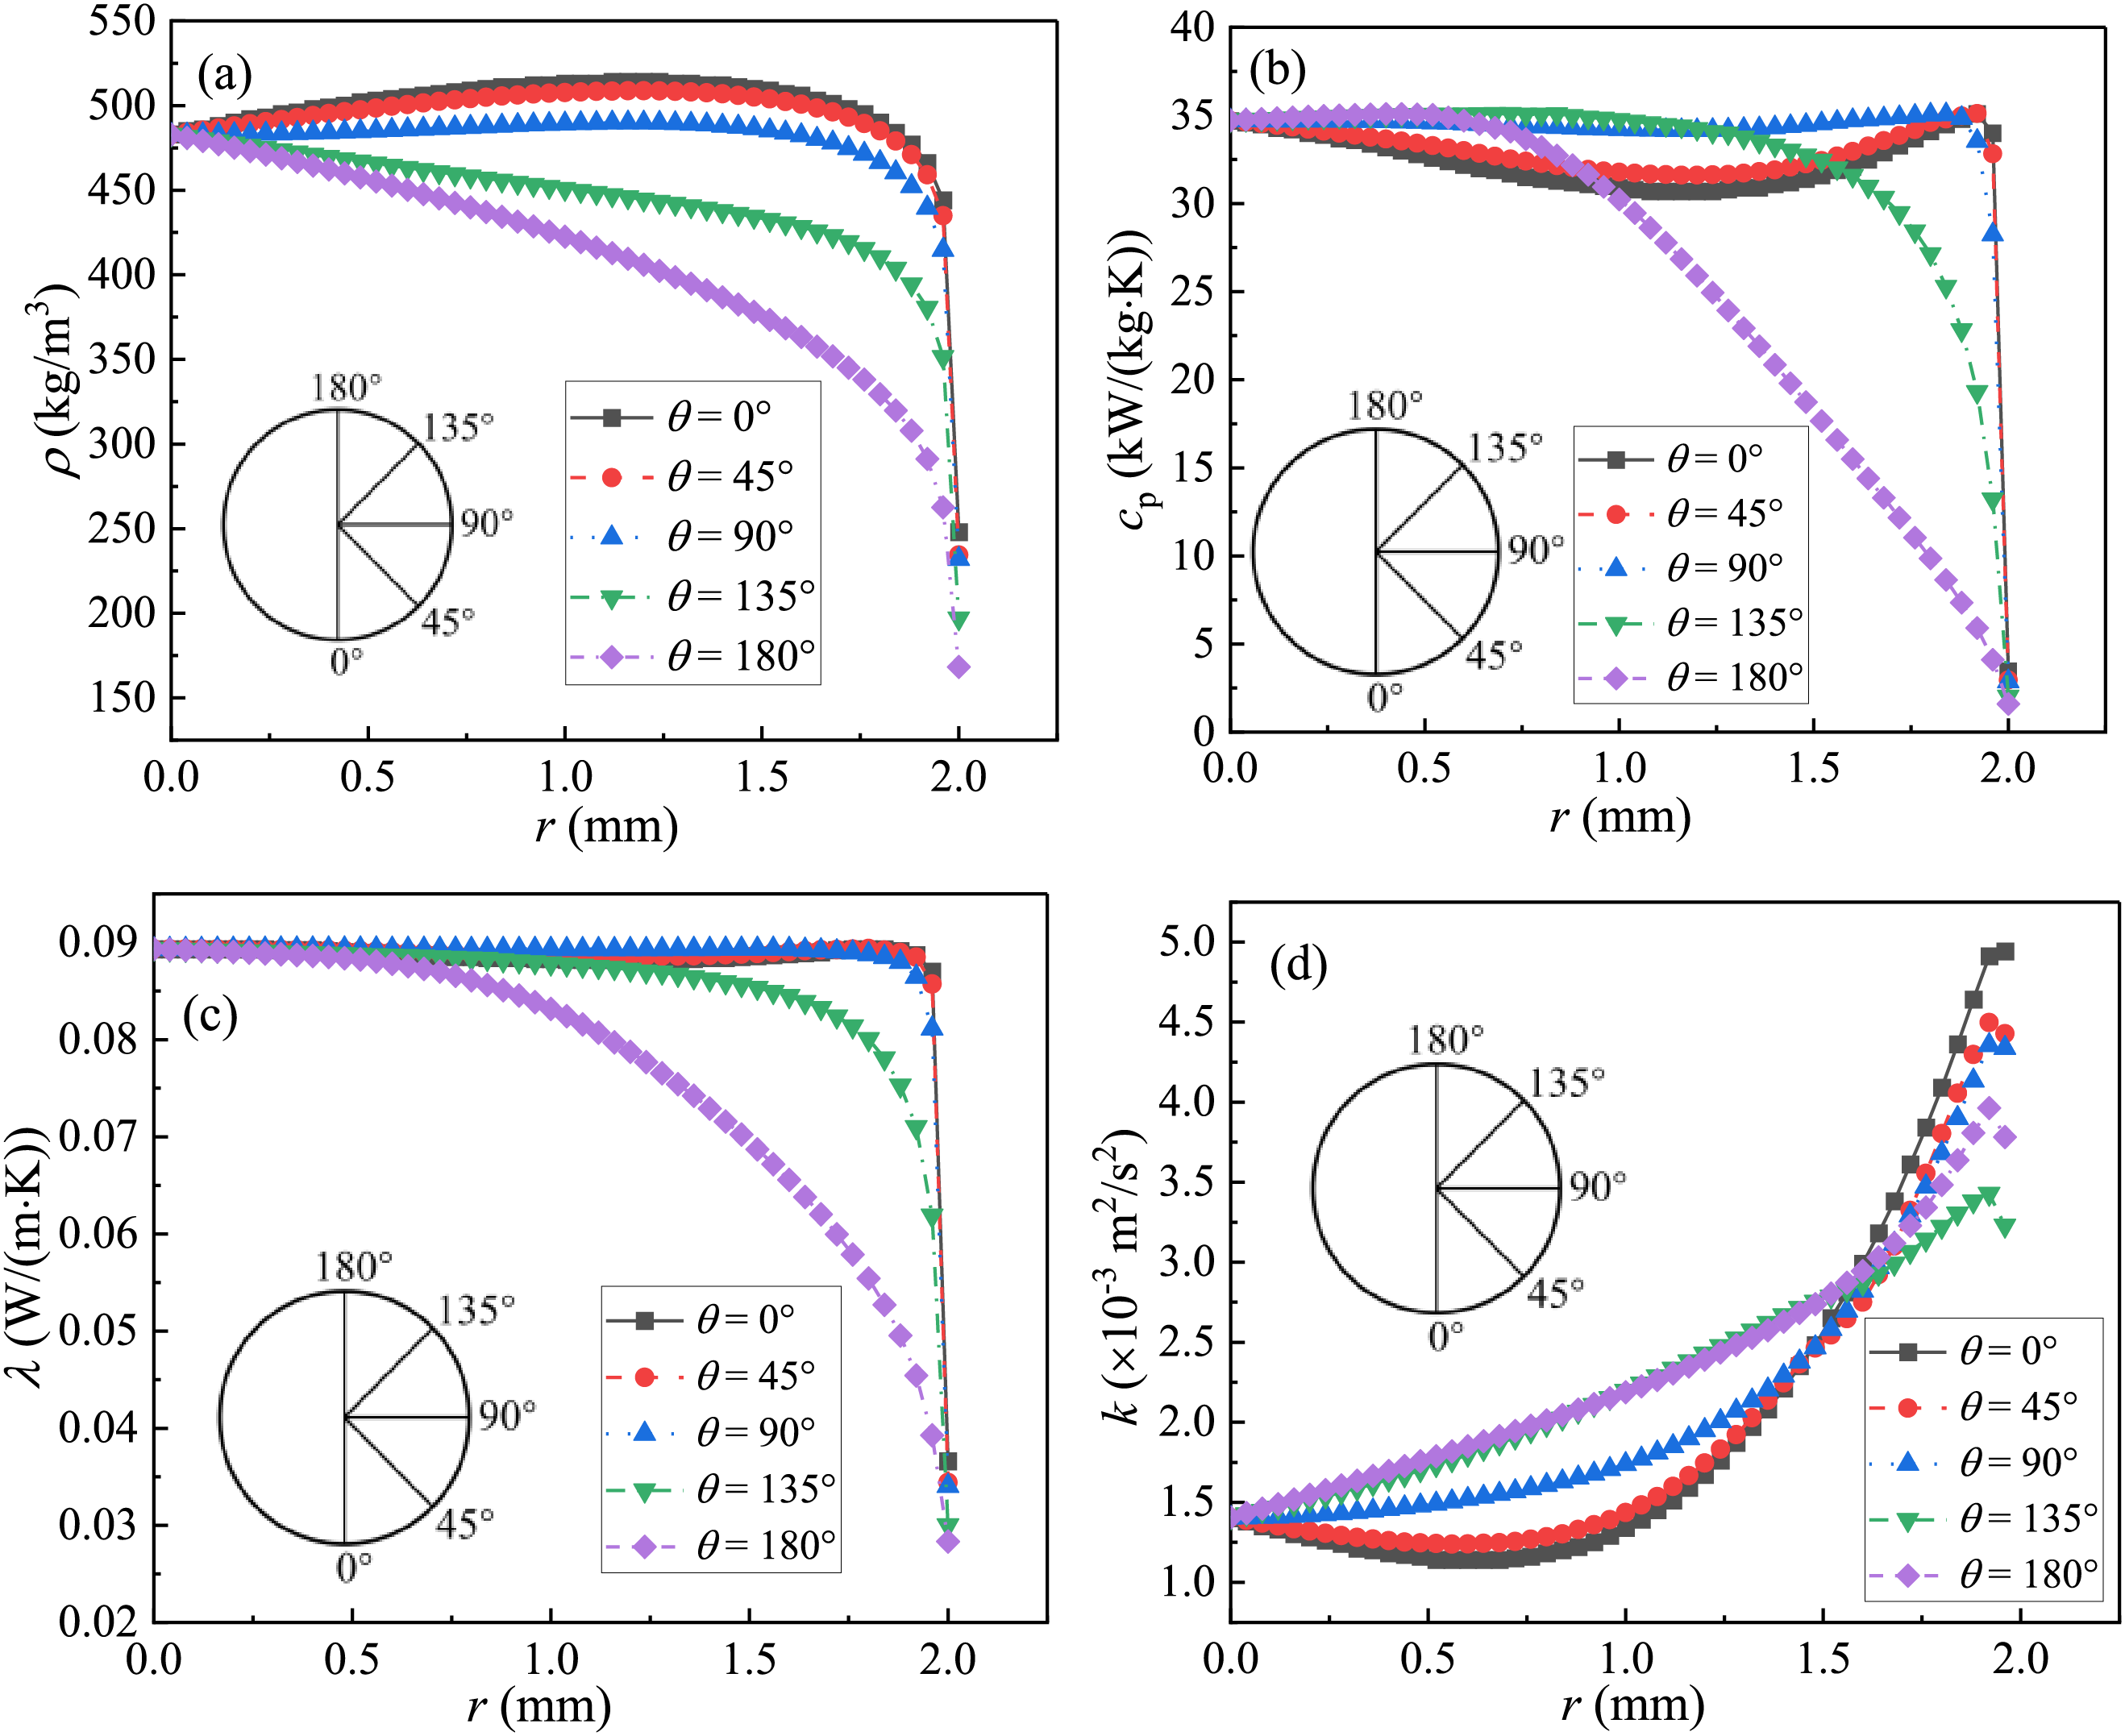
Figure 15: Radial distributions of: (a) density, (b) specific heat, (c) thermal conductivity, and (d) turbulent kinetic energy along directions of θ = 0°, θ = 45°, θ = 90°, θ = 135° and θ = 180° at the cross-section of z = 1100 in the 4 mm pipe, at G = 400 kg/(m2·s), Tin = 288.15 K, Pin = 8.0 MPa, and q = 50 kW/m2
The flow and heat transfer features of a heated horizontal S-CO2 flow are numerically investigated, taking into account the flow of a pressure of 8.0 MPa through two pipes of different diameters (4 and 6 mm), with two mass fluxes of 300 and 400 kg/(m2·s), and with three heat fluxes of 50, 75 and 100 kW/m2. The effects of pipe diameter and heat flux density on thermal-hydraulic performance and irreversible loss were investigated, and the underlying mechanism was analysed.
(1) The peak heat transfer coefficient of 4 mm pipeline is about 3 times higher than that of 6 mm pipeline, while the average irreversible heat transfer loss of 4 mm pipeline is about 67% lower, and the average irreversible loss of flow resistance is 1.1 times higher.
(2) As the heat flux decreases from 100 to 50 kW/m2, the peak heat transfer coefficient in the 4 mm pipe increases by a factor of 1.4, while the frictional irreversibility is almost unaffected. When the wall heat flux is 100 kW/m2, the irreversible loss due to heat transfer is more than four times higher than when the heat flux of 50 kW/m2 is adopted.
(3) In this study, the thermal acceleration effect is negligible, while the buoyancy effect is important because it creates a secondary flow that significantly affects the flow and heat transfer features in the pipe.
(4) The distribution of local parameters is seriously uneven, and the peak of heat transfer coefficient in the vicinity of the lower wall of pipeline is more than 2 times higher than that at the top. Two vortices on the cross-section (secondary flow) are formed under buoyancy, and the jet is observed in the vicinity of the lower wall, which improves the coordination degree between the two fields of velocity and temperature gradient in this region, thereby enhancing heat transfer.
(5) Two circulating flows collide in the vicinity of the upper wall, weakening the synergy of the two fields of the velocity and temperature gradient, leading to a deterioration of heat transfer in that region. The increase of heat transfer performance corresponds to the decrease of irreversible loss related to temperature difference, and the irreversible loss caused by flow resistance is less affected by buoyancy effect.
(6) The distribution of local parameters is also seriously uneven, from the bottom to the top of the pipe, the specific heat capacity, thermal conductivity and turbulent kinetic energy in the near-wall region are reduced, demonstrating that heat transfer is intensified in the vicinity of the lower wall.
(7) This study contributes to a better understanding of the heat transfer performance and flow characteristics of heating S-CO2 flow in horizontal pipelines, and further enriches and develops the heat transfer theory of supercritical fluids by describing singular heat transfer phenomena and revealing related mechanisms. This provides meaningful reference and theoretical guidelines for the design and optimization of heat exchange equipment and other related components using supercritical fluids as working fluids.
Acknowledgement: None.
Funding Statement: This study was supported by the European Union’s Horizon 2020 Research and Innovation Programme Project (No. 882628) (Guo, https://cinea.ec.europa.eu/programmes/horizon-europe_en) (acceseed on 08 October 2024), and the Fundamental Research Funds for the Central Universities (buctrc202406) (Guo, https://english.buct.edu.cn/) (accessed on 08 October 2024).
Author Contributions: Jiangfeng Guo: Conceptualization, Methodology, Software, Data curation, Formal Analysis, Investigation, Validation, Writing—Original Draft, Writing—Review & Editing. Hongjie Yu: Supervision, Writing—Review & Editing. All authors reviewed the results and approved the final version of the manuscript.
Availability of Data and Materials: Data available on request from the authors.
Ethics Approval: Not applicable.
Conflicts of Interest: The authors declare no conflicts of interest to report regarding the present study.
References
1. Pizzarelli M. The status of the research on the heat transfer deterioration in supercritical fluids: a review. Int Commun Heat Mass Transf. 2018;95:132–8. doi:10.1016/j.icheatmasstransfer.2018.04.006. [Google Scholar] [CrossRef]
2. White MT, Bianchi G, Chai L, Tassou SA, Sayma AI. Review of supercritical CO2 technologies and systems for power generation. Appl Therm Eng. 2021;185:116447. doi:10.1016/j.applthermaleng.2020.116447. [Google Scholar] [CrossRef]
3. Kwon JS, Son S, Heo JY, Lee JI. Compact heat exchangers for supercritical CO2 power cycle application. Energy Convers Manag. 2020;209:112666. doi:10.1016/j.enconman.2020.112666. [Google Scholar] [CrossRef]
4. Zhang H, Guo J, Cui X, Zhou J, Huai X, Zhang H, et al. Experimental and numerical investigations of thermal-hydraulic characteristics in a novel airfoil fin heat exchanger. Int J Heat Mass Transf. 2021;175:121333. doi:10.1016/j.ijheatmasstransfer.2021.121333. [Google Scholar] [CrossRef]
5. Zhu Q. Innovative power generation systems using supercritical CO2 cycles. Clean Energy. 2017;1:68–79. doi:10.1093/ce/zkx003. [Google Scholar] [CrossRef]
6. Maouris G, Sarabia Escriva EJ, Acha S, Shah N, Markides CN. CO2 refrigeration system heat recovery and thermal storage modelling for space heating provision in supermarkets: an integrated approach. Appl Energy. 2020;264:114722. doi:10.1016/j.apenergy.2020.114722. [Google Scholar] [CrossRef]
7. Guo J, Cui X, Huai X, Cheng K, Zhang H. The coordination distribution analysis on the series schemes of heat exchanger system. Int J Heat Mass Transf. 2019;129:37–46. doi:10.1016/j.ijheatmasstransfer.2018.09.068. [Google Scholar] [CrossRef]
8. Tamilarasan SK, Jose J, Boopalan V, Chen F, Arumugam SK, Ramachandran JC, et al. Recent Developments in supercritical CO2-based sustainable power generation technologies. Energies. 2024;17:4019. doi:10.3390/en17164019. [Google Scholar] [CrossRef]
9. Chen J, Chen L, Zang J, Huang Y. Design comparison for the supercritical CO2 brayton cycle with recompression and thermal regeneration: numerical results. In: Chen L, editor. Advances in clean energy systems and technologies. Cham, Switzerland: Springer; 2024. doi:10.1007/978-3-031-49787-2_29. [Google Scholar] [CrossRef]
10. Yan S, Zhao M, Zhang H, Zheng H, Deng F. Theoretical analysis on thermodynamic and economic performance improvement in a supercritical CO2 cycle by integrating with two novel double-effect absorption reheat power cycles. Int J Energy Res. 2024;2024:3745897. doi:10.1155/2024/3745897. [Google Scholar] [CrossRef]
11. Ehsan MM, Guan Z, Klimenko AY. A comprehensive review on heat transfer and pressure drop characteristics and correlations with supercritical CO2 under heating and cooling applications. Renew Sustain Energ Rev. 2018;92:658–75. doi:10.1016/j.rser.2018.04.106. [Google Scholar] [CrossRef]
12. Cabeza LF, de Gracia A, Fernández AI, Farid MM. Supercritical CO2 as heat transfer fluid: a review. Appl Therm Eng. 2017;125:799–810. doi:10.1016/j.applthermaleng.2017.07.049. [Google Scholar] [CrossRef]
13. Rao NT, Oumer AN, Jamaludin UK. State-of-the-art on flow and heat transfer characteristics of supercritical CO2 in various channels. J Supercrit Fluids. 2016;116:132–47. doi:10.1016/j.supflu.2016.05.028. [Google Scholar] [CrossRef]
14. Bruch A, Bontemps A, Colasson S. Experimental investigation of heat transfer of supercritical carbon dioxide flowing in a cooled vertical tube. Int J Heat Mass Transf. 2009;52:2589–98. doi:10.1016/j.ijheatmasstransfer.2008.12.021. [Google Scholar] [CrossRef]
15. Kim DE, Kim M-H. Experimental investigation of heat transfer in vertical upward and downward supercritical CO2 flow in a circular tube. Int J Heat Fluid Flow. 2011;32:176–91. doi:10.1016/j.ijheatfluidflow.2010.09.001. [Google Scholar] [CrossRef]
16. Kim DE, Kim MH. Experimental study of the effects of flow acceleration and buoyancy on heat transfer in a supercritical fluid flow in a circular tube. Nucl Eng Des. 2010;240:3336–49. doi:10.1016/j.nucengdes.2010.07.002. [Google Scholar] [CrossRef]
17. Lei X, Zhang J, Gou L, Zhang Q, Li H. Experimental study on convection heat transfer of supercritical CO2 in small upward channels. Energy. 2019;176:119–30. doi:10.1016/j.energy.2019.03.109. [Google Scholar] [CrossRef]
18. Guo J, Xiang M, Zhang H, Huai X, Cheng K, Cui X. Thermal-hydraulic characteristics of supercritical pressure CO2 in vertical tubes under cooling and heating conditions. Energy. 2019;170:1067–81. doi:10.1016/j.energy.2018.12.177. [Google Scholar] [CrossRef]
19. Wang X, Wang Y, Xiao X, Chen Z, Kang Y, Lei Y. Numerical study on heat transfer deterioration of supercritical CO2 in lattice structure array channel. Int J Heat Mass Transf. 2024;227:125600. doi:10.1016/j.ijheatmasstransfer.2024.125600. [Google Scholar] [CrossRef]
20. Lin W, Du Z, Gu A. Analysis on heat transfer correlations of supercritical CO2 cooled in horizontal circular tubes. Heat Mass Transf. 2012;48:705–11. doi:10.1007/s00231-011-0919-0. [Google Scholar] [CrossRef]
21. Oh HK, Son CH. New correlation to predict the heat transfer coefficient in-tube cooling of supercritical CO2 in horizontal macro-tubes. Exp Therm Fluid Sci. 2010;34:1230–41. doi:10.1016/S0140-7007(01)00098-6. [Google Scholar] [CrossRef]
22. Liu ZB, He YL, Yang YF, Fei JY. Experimental study on heat transfer and pressure drop of supercritical CO2 cooled in a large tube. Appl Therm Eng. 2014;70:307–15. doi:10.1016/j.applthermaleng.2014.05.024. [Google Scholar] [CrossRef]
23. Cheng L, Xu J. Experimental investigation of non-uniform heating effect on flow and heat transfer of supercritical carbon dioxide: an application to solar parabolic trough collector. Renew Energy. 2024;236:121373. doi:10.1016/j.renene.2024.121373. [Google Scholar] [CrossRef]
24. Cui X, Guo J, Huai X, Cheng K, Zhang H, Xiang M. Numerical study on novel airfoil fins for printed circuit heat exchanger using supercritical CO2. Int J Heat Mass Transf. 2018;121:354–66. doi:10.1016/j.ijheatmasstransfer.2018.01.015. [Google Scholar] [CrossRef]
25. Han Z, Guo J, Liao H, Zhang Z, Huai X. Numerical investigation on the thermal-hydraulic performance of supercritical CO2 in a modified airfoil fins heat exchanger. J Supercrit Fluids. 2022;187:105643. doi:10.1016/j.supflu.2022.105643. [Google Scholar] [CrossRef]
26. Ghodrati P, Khoshvaght-Aliabadi M. Supercritical CO2 flow and heat transfer through tapered horizontal mini-tubes: parametric analysis and optimization study. Appl Therm Eng. 2024;242:122512. doi:10.1016/j.applthermaleng.2024.122512. [Google Scholar] [CrossRef]
27. Khoshvaght-Aliabadi M, Ghodrati P, Khaligh SF, Kang YT. Improving supercritical CO2 cooling using conical tubes equipped with non-uniform twisted inserts. Int Commun Heat Mass Transf. 2024;150:107171. doi:10.1016/j.icheatmasstransfer.2023.107171. [Google Scholar] [CrossRef]
28. Bejan A. Entropy generation through heat and fluid flow. New York: Wiley; 1982. [Google Scholar]
29. Garg VK, Ameri AA. Two-equation turbulence models for prediction of heat transfer on a transonic turbine blade. Int J Heat Fluid Flow. 2001;22:593–602. doi:10.1016/S0142-727X(01)00128-X. [Google Scholar] [CrossRef]
30. Menter FR. Two-equation eddy-viscosity turbulence models for engineering applications. AIAA J. 1994;32:269–89. doi:10.2514/3.12149. [Google Scholar] [CrossRef]
31. Lemmon EW, Huber ML, McLinden MO. NIST standard reference database 23: reference fluid thermodynamic and transport properties-REFPROP, version 9.1. May 7, 2013. Accessed: Jun. 20, 2024. [Online]. Available: https://www.nist.gov/publications/nist-standard-reference-database-23-reference-fluid-thermodynamic-and-transport [Google Scholar]
32. Zhang S, Xu X, Liu C, Liu X, Dang C. Experimental investigation on the heat transfer characteristics of supercritical CO2 at various mass flow rates in heated vertical-flow tube. Appl Therm Eng. 2019;157:113687. doi:10.1016/j.applthermaleng.2019.04.097. [Google Scholar] [CrossRef]
33. Liu X, Guo J, Han Z, Cheng K, Huai X. Studies on thermal-hydraulic characteristics of supercritical CO2 flows with non-uniform heat flux in a tubular solar receiver. Renew Energy. 2022;201:291–304. doi:10.1016/j.renene.2022.10.112. [Google Scholar] [CrossRef]
34. Han Z, Guo J, Huai X. Theoretical analysis of a novel PCHE with enhanced rib structures for high-power supercritical CO2 Brayton cycle system based on solar energy. Energy. 2023;270:126928. doi:10.1016/j.energy.2023.126928. [Google Scholar] [CrossRef]
35. Zhang H, Guo J, Huai X, Cui X. Thermodynamic performance analysis of supercritical pressure CO2 in tubes. Int J Therm Sci. 2019;146:106102. doi:10.1016/j.ijthermalsci.2019.106102. [Google Scholar] [CrossRef]
36. Kakac S. The effect of temperature-dependent fluid properties on convective heat transfer. In: Al SKe, editor. Handbook of single-phase convective heat transfer. USA: John Wiley & Sons; 1987. [Google Scholar]
37. Liao SM, Zhao TS. An experimental investigation of convection heat transfer to supercritical carbon dioxide in miniature tubes. Int J Heat Mass Transf. 2002;45:5025–34. doi:10.1016/S0017-9310(02)00206-5. [Google Scholar] [CrossRef]
38. McEligot DM, Coon CW, Perkins HC. Relaminarization in tubes. Int J Heat Mass Transf. 1970;13:431–3. doi:10.1016/0017-9310(70)90118-3. [Google Scholar] [CrossRef]
39. Guo ZY, Tao WQ, Shah RK. The field synergy (coordination) principle and its applications in enhancing single phase convective heat transfer. Int J Heat Mass Transf. 2005;48:1797–807. doi:10.1016/j.ijheatmasstransfer.2004.11.007. [Google Scholar] [CrossRef]
40. Tao WQ, Guo ZY, Wang BX. Field synergy principle for enhancing convective heat transfer–its extension and numerical verifications. Int J Heat Mass Transf. 2002;45(18):3849–56. doi:10.1016/S0017-9310(02)00097-2. [Google Scholar] [CrossRef]
Cite This Article
 Copyright © 2024 The Author(s). Published by Tech Science Press.
This work is licensed under a Creative Commons Attribution 4.0 International License , which permits unrestricted use, distribution, and reproduction in any medium, provided the original work is properly cited.


 Submit a Paper
 Propose a Special lssue
 View Full Text
 Download PDF
 Downloads
 Citation Tools