 Open Access
ARTICLE
The Hydrodynamic Crisis of Nucleate Boiling in a Horizontal Thin Layer of Dielectric Liquid HFE-7100
1 Kutateladze Institute of Thermophysics, Siberian Branch, Russian Academy of Sciences, Novosibirsk, 630090, Russia
2 Department of Chemistry and Chemical Technology, Novosibirsk State Technical University, Novosibirsk, 630073, Russia
* Corresponding Author: V. I. Zhukov. Email:
(This article belongs to the Special Issue: Heat and Mass Transfer in Energy Equipment)
Frontiers in Heat and Mass Transfer 2024, 22(6), 1761-1775. https://doi.org/10.32604/fhmt.2024.056779
Received 30 July 2024; Accepted 16 October 2024; Issue published 19 December 2024
Abstract
The results of an experimental study on critical heat fluxes (CHF) during the nucleate boiling of the HFE-7100 dielectric liquid in horizontal layers of different heights at atmospheric pressure are presented. The existence of a critical layer height has been established. In layers above the critical layer height, a hydrodynamic boiling crisis occurs; in thinner layers, a surface drying crisis occurs. At a layer height equal to the critical value, a dry spot first appears, followed by transition boiling, which gradually spreads to the entire heating surface. In these experiments, the critical layer height was equal to 6 mm. In a layer of liquid with a critical layer height of 6 mm, a two-dimensional Taylor instability was observed in the transition boiling mode when the ratio of the diameter of the “vapor jets” to the distance between them, as well as the void fractions in the layer (~π/16), corresponded to the main provisions of the Zuber theory. The calculation of CHF using the relations of Zuber’s theory, when approaching the crisis from the transition boiling side and taking into account the real geometric dimensions, aligns well with the experimental results.Keywords
Nomenclature
| Symbols | |
| A | Area, m2 |
| d | Diameter, m |
| g | Acceleration of gravity, m/s2 |
| h | Initial layer height, m |
| hLG | Latent heat of vaporization, J/kg |
| k | Kutateladze constant |
| lv | Distance between the centers of “vapor jets”, mm |
| Laplace constant, m | |
| m | Wave number, m−1 |
| q | Heat flux, W/m2 |
| T | Temperature, °C, К |
| Greek Symbols | |
| Most dangerous wavelength of Taylor instability, m | |
| Critical wavelength of Taylor instability m | |
| ρ | Density, kg/m3 |
| σ | Surface tension, N/m |
| τ | Time, s |
| Subscripts and Superscripts | |
| cr | Critical |
| Calc | Calculation using parameters taken from experiment |
| H | Referred to Helmholtz instability |
| K | Referred to Kutateladze equation |
| l | Liquid |
| s | Parameter on saturation line |
| t | Theoretical values of parameters and calculations using them |
| v | Vapor |
| w | Referred to heated surface |
| Z | Refers to Zuber theory |
Dielectric liquids are used for immersion cooling of micro and power electronic elements [1,2]. The saturation temperature for these liquids at atmospheric pressure is approximately (30–65)°C, with a permissible device heating temperature of approximately 85°C. The critical heat flux (CHF) limits the maximum heat flux that can be removed from the surface of a device as it cools. In works [3–5], a study was carried out on CHF during the pool boiling of the dielectric liquid HFE-7100 on surfaces with different roughness at various pressures. An increase in the CHF with increasing pressure is noted. The results of visual observations of the processes are presented; however, the authors primarily limited themselves to a qualitative description of the observed vapor structures. In [4], a boiling crisis on a copper surface with a diameter of 40 mm was investigated. Photographs of vapor structures at the moment of crisis and during transition boiling are provided. The presence of vapor bubbles of various sizes, vapor columns and mushroom-shaped bubbles is noted. In [5], it is noted that the CHF decreases with decreasing pressure and then increases slightly, i.e., a weak dependence of the CHF on pressure is observed in this range. It is noted that the value of CHF can be affected by the height of the liquid layer. The results of systematic studies on the influence of liquid layer height and reduced pressure over a wide range of variations are presented in [6,7]. In [6], a decrease in the CHF with decreasing pressure was also observed, followed by an increase in the CHF in a thick layer of liquid, when the process patterns were practically no different from those of the pool boiling process. In [8], the influence of the smooth heater size on the value of the CHF and heat transfer coefficients during the pool boiling of FC-72 on eight smooth silicon chips of different sizes is studied. It was found that when the chip side size exceeds
Kutateladze in [13] obtained a relationship for calculating the CHF during nucleate boiling of a liquid on a very large horizontal plate with the heating surface facing upwards, using the method of dimensional analysis:
where Kutateladze recommended taking k = 0.16. Since this equation was derived from dimensional analysis, various theoretical models of CHF for pool boiling can be represented by Eq. (1), regardless of the proposed CHF mechanism.
Zuber in [14,15] obtained an equation for calculating the CHF on an infinite plane. To calculate the CHF, he recommended using k = 0.131 in (1). In Zuber’s analysis, the right-hand side of Eq. (1) was multiplied by the expression
Lienhard et al. [11,12] applied the Zuber model to calculate the CHF for pool boiling of liquid on geometric bodies of various shapes, such as spheres, cylinders, and vertical plates. They showed that if the size of the horizontal surface is greater than
Most experiments measuring CHF are performed under pool boiling conditions. More comprehensive requirements for conditions that satisfy the criteria of Zuber’s theory were formulated by Theofanus et al. [23,24]. Just as in the experiments [11,12], he says that the cross-section of the liquid volume in the horizontal plane must completely coincide with the cross-section of the heater. In experimental practice, this means that the heating surface must be limited by vertical walls. It is also necessary for the aspect ratio—the ratio of the thickness of the liquid layer to the smallest lateral dimension of the heating surface—to be small. However, specific recommendations regarding the height of the liquid layer and the ratio of the layer height to the dimensions of the plate are not provided in these works, making it necessary to conduct detailed experiments in this area.
In previous works by the authors of this article [25,26], the distribution of large bubbles in pre-crisis boiling regimes within a liquid layer on a horizontal surface with vertical walls was investigated. The two-dimensional instability of a boiling layer of liquid was experimentally discovered. It is shown in [26] that the distribution of “vapor jets” occurs in accordance with the conclusions of the two-dimensional Taylor instability [27]. The influence of the liquid layer thickness and void fraction in the layer on the mechanism of occurrence of the CHF and its magnitude was studied. The instability wavelength in a boiling liquid layer depends on the void fraction and is proportional to the wavelength of Taylor instability. Using the mathematical apparatus of Zuber’s theory, a hydromechanical model of the nucleate boiling crisis is proposed, both when approached from the developed nucleate boiling regime and in the case of a symmetric problem: the calculation of CHF when approached from the transition boiling side. The geometric characteristics of the vapor-liquid layer during transition boiling differ significantly from those proposed in Zuber’s theory [14,15]. The “vapor jets” had approximately the same diameter, equal to
In this paper, an experimental study of CHF in thin horizontal layers of the dielectric liquid HFE-7100 is performed, depending on changes in a wide range of layer heights at atmospheric pressure. The experimental results are compared with known calculated dependencies. The results of the statistical processing of visual observations and calculations of CHF are presented based on the measurements of the diameters of “vapor jets” and the wavelengths of two-dimensional Taylor instability observed in a layer with a critical height of hcr = 6 mm in the transition boiling mode. The calculation results are compared with the experimental results.
The experimental installation for studying the process of nucleate boiling of a dielectric liquid includes a operating chamber, a cooling system, a pressure and temperature measurement system, data collection and processing systems, a power control system and a electric heater power supply (see Fig. 1a). The operating chamber mounted on a frame. Copper-constantan thermocouples were used to measure temperature. The volumetric flow rate of water in the coolant coil of the operating chamber is measured by a rotameter and regulated by a valve. The temperature in the warming coil the operating chamber kept constant by means of a pumping thermostat. The pressure measured using an ASG Edwards diaphragm manometer with an error of 0.2% of the total scale. The signals from the pressure gauge and thermocouples were recorded using NI equipment and processed in LabVIEW. A more complete description of the installation can be found in [6,26].
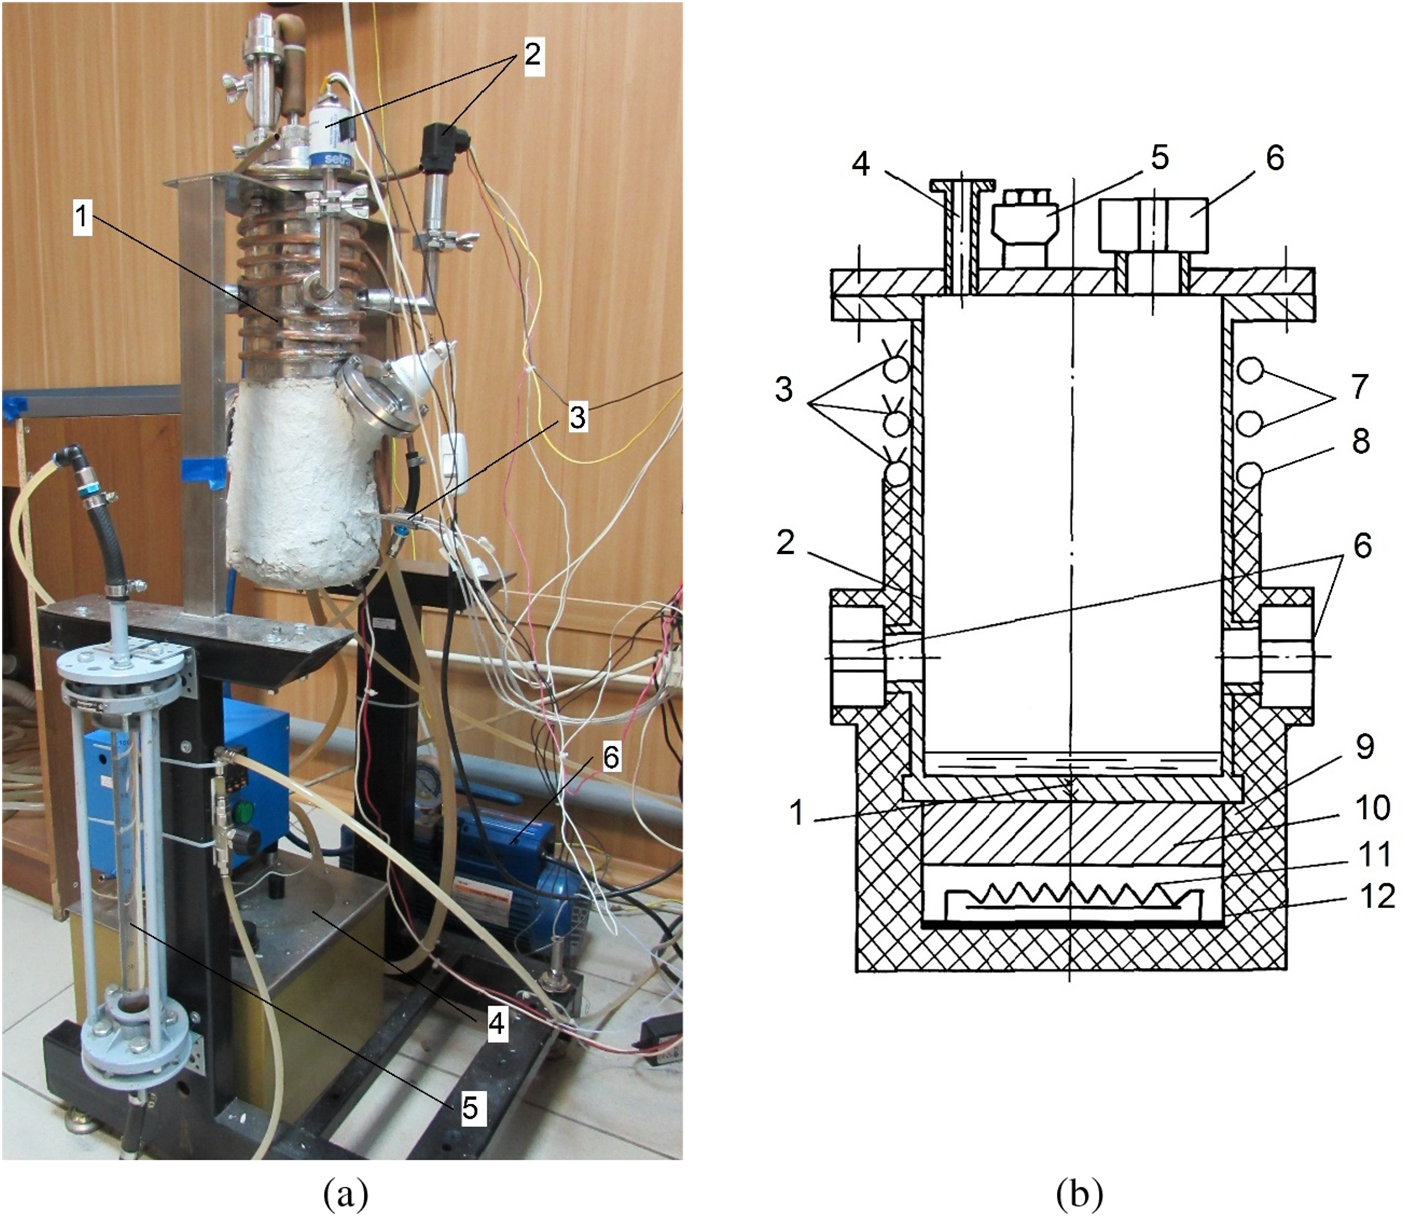
Figure 1: Experimental installation: (a)—shot of the experimental installation: 1—operating chamber of the experimental installation, 2—manometers, 3—thermocouples, 4—pumping thermostat, 5—rotameter, 6—vacuum pump; (b)—operating chamber of the experimental installation: 1—bottom, 2—casing, 3—thermocouples, 4—vacuum inlet conflate type, 5—vacuum input, 6—viewing windows, 7—coolant coil, 8—warming coil, 9—heat insulator, 10—copper plate, 11—electric resistance heater, 12—electric heater housing
The operating chamber is made of stainless steel and consists of a cylindrical casing with a wall thickness of 1 mm, a height of 300 mm and an inner diameter of d = 120 mm, a bottom, and a cover (Fig. 1b). An electric heater with a power of 3 kW was attached to the bottom of the chamber. A copper plate with a thickness of 30 mm is located between the heater and the bottom of the chamber. The gap between the bottom of the chamber and the copper plate is filled with a special paste with high thermal conductivity. The operant chamber was cooled by water flowing through a coolant coil on the outer surface of the upper portion of the chamber. The warming coil heated the operating chamber casing to the saturation temperature of the dielectric liquid. One window on the operating chamber casing was used for illumination. Visual observations were made through the window in the operating chamber cover and one window in the chamber casing. The results of visual observations were recorded using a video camera with a shooting frequency of 30 fps. The temperature gradient across the chamber bottom thickness was determined from readings of five copper-constantan thermocouples located at different heights in the bottom. The heat flux through the chamber bottom to the HFE-7100 dielectric fluid was determined from the temperature gradient according to the Fourier equation. The estimated uncertainty of the heat flux measurement was nearly ~16% for q = 103 W/m2, nearly ~10% for q = 104 W/m2, and nearly ~4% for q = 105 W/m2. The bottom surface temperature was determined by linear extrapolation of the measured temperature gradient. The uncertainty of bottom surface temperature measurement was no more than ~0.6°C at heat flux 105 W/m2. The pressure in the operating chamber was kept constant. The lower horizontal surface (bottom) of the 12 mm thick operating chamber—a horizontal smooth surface 120 mm in diameter with roughness Rz = 3.2 μm, bounded by the vertical walls of the chamber—was used as the heating surface.
In this study dielectric liquid HFE-7100 was used as a test liquid. The experiments were carried out at a saturation pressure of 100 kPa in the operating chamber. The saturation temperature at this pressure is 61°C. The properties of the liquid and gas phases were determined using data from [28,29]. The experiments were carried out on layers with a height of h = 1.5; 2.5; 6; 10; 16; 25; 35 mm. The Laplace constant of HFE-7100 under the experimental conditions is 0.85 mm. The condition d >> 3λd is satisfied, therefore, according to [11,12,23,24], the heating surface in these experiments can be considered as an infinite plane.
3.1 Results of CHF Measurements and Visual Observations
In all experiments, the
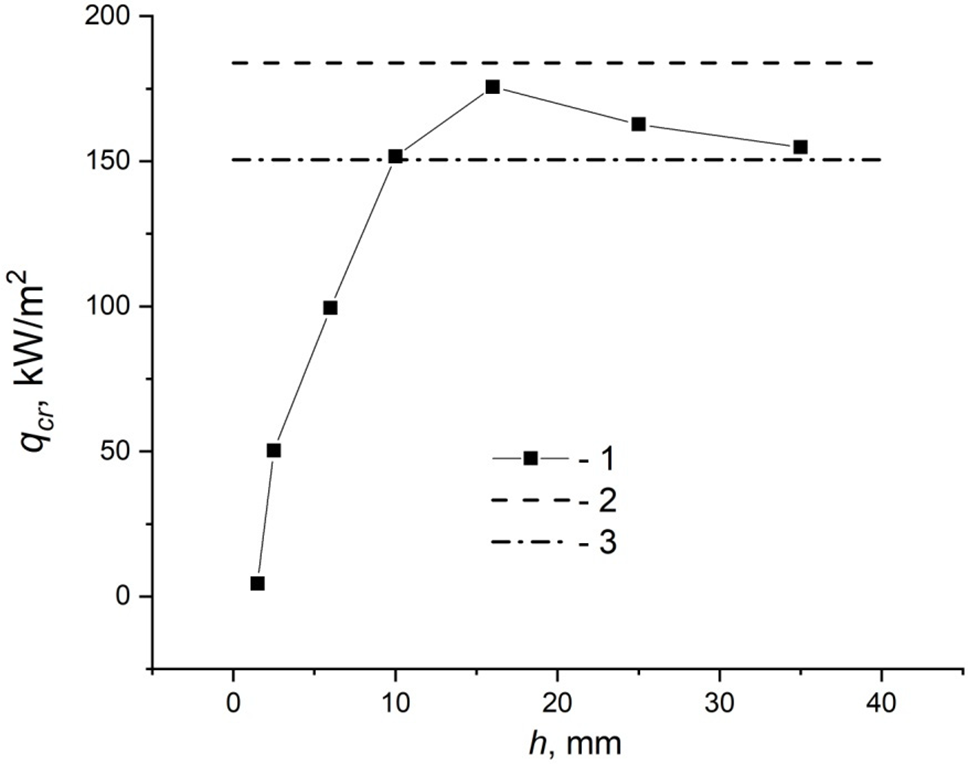
Figure 2: Dependence of CHF on the height of the liquid layer: 1—experimental data; calculated dependences: 2—[13], 3—[14,15]
This paper analyzes experimental data on the study of the hydrodynamic boiling crisis in a horizontal thin layer of dielectric liquid HFE-7100. Fig. 3 shows video footage of successive stages of the development of the crisis, indicating the moment in time from the beginning of the process when these video fragments were received. Before the crisis, the liquid layer is a fairly homogeneous bubble system (Fig. 3a). After reaching the CHF, a dry spot appeared on the heating surface. Then, near the center of the heating surface, next to the dry spot, a small region of transition boiling appeared, which is highlighted by an ellipse in Fig. 3b. Bubbles of approximately the same size are formed in the transition boiling region. Fig. 4 shows the boiling curve, and Fig. 5 shows the dependence of the change in the heating surface temperature on time. The arrows in Figs. 4 and 5 indicate the points at which the corresponding photographs shown in Fig. 3 were obtained. It is evident from Fig. 4 that the states shown in Fig. 3c,d correspond to transition boiling. The crisis develops according to a complex scenario. Upon reaching the CHF, the temperature increased with the formation of a dry spot in the center of the surface, and then, over a fairly long period of time, the structure of the layer changes, the area in it on which transition boiling exists increases, while the temperature of the heating surface remains practically constant for a sufficiently long period of time (Fig. 5).
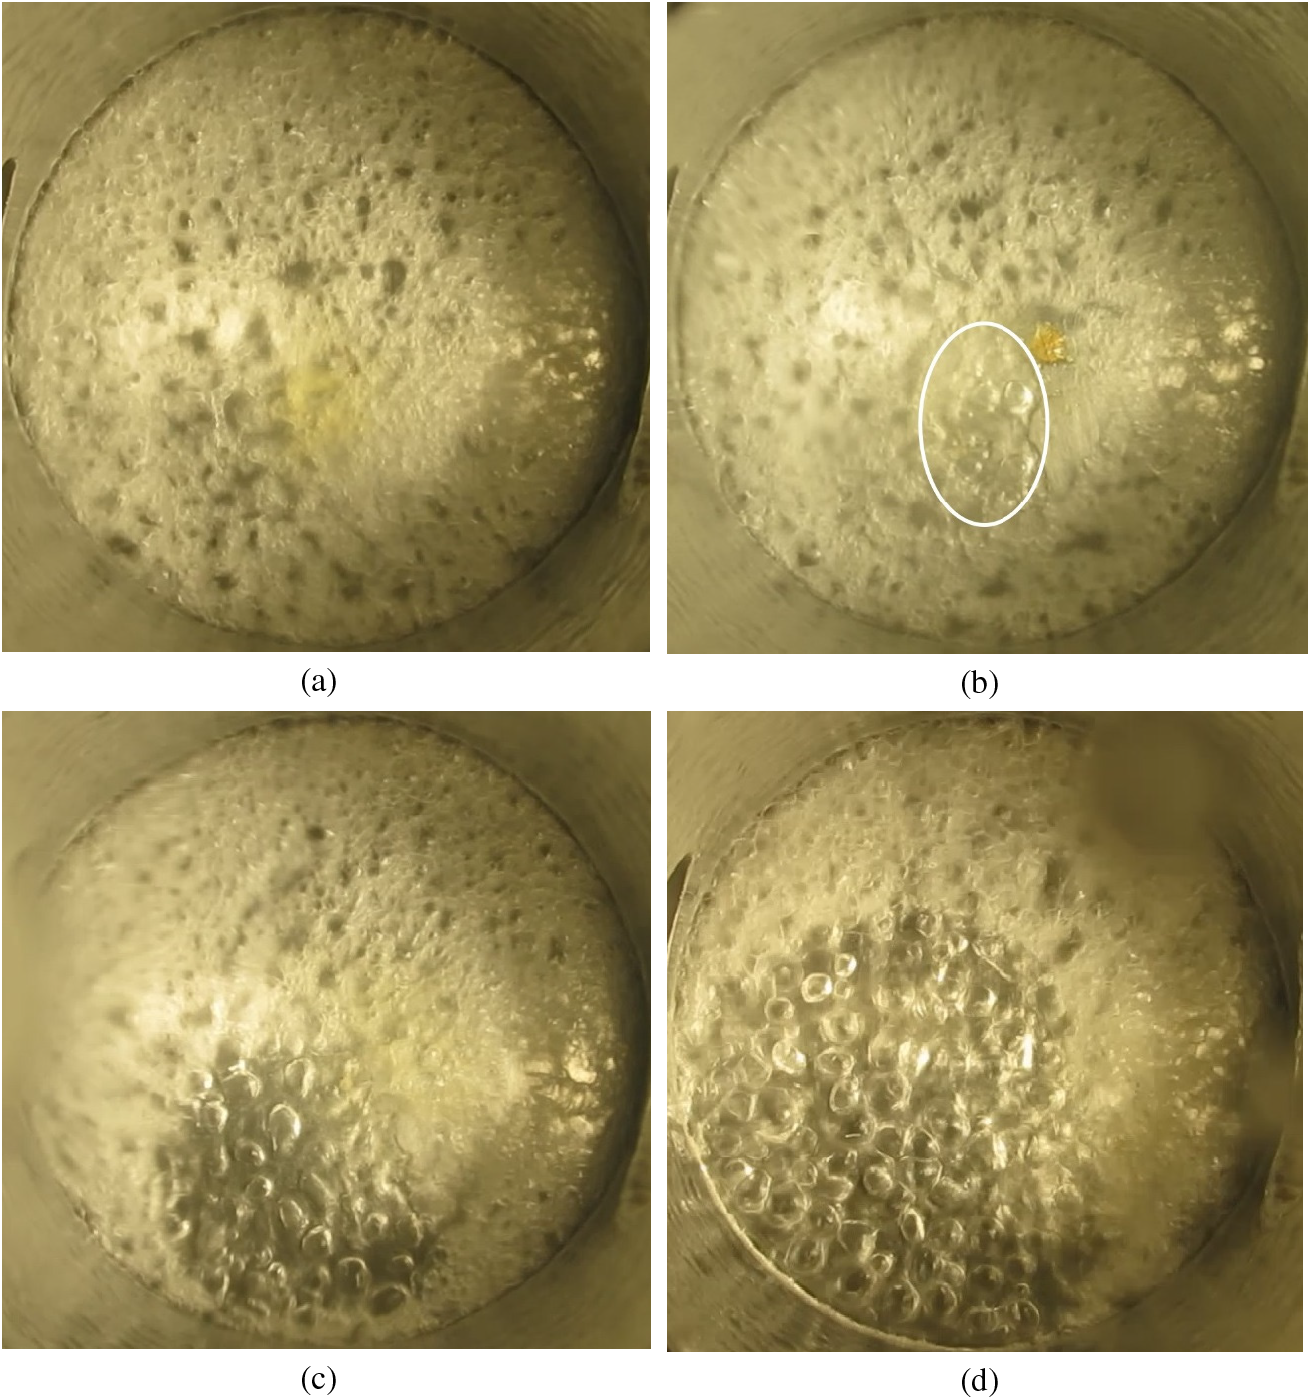
Figure 3: Development of a nucleate boiling crisis in a layer of dielectric liquid HFE-7100 at a pressure of 100 kPa. (a) pre-crisis state; (b) crisis τ = 0 s; (c) transition boiling area approximately 15%, τ = 55 s; (d) transition boiling over an area of approximately 50% before the start of a sharp increase in the heating surface temperature τ = 1 min 34 s
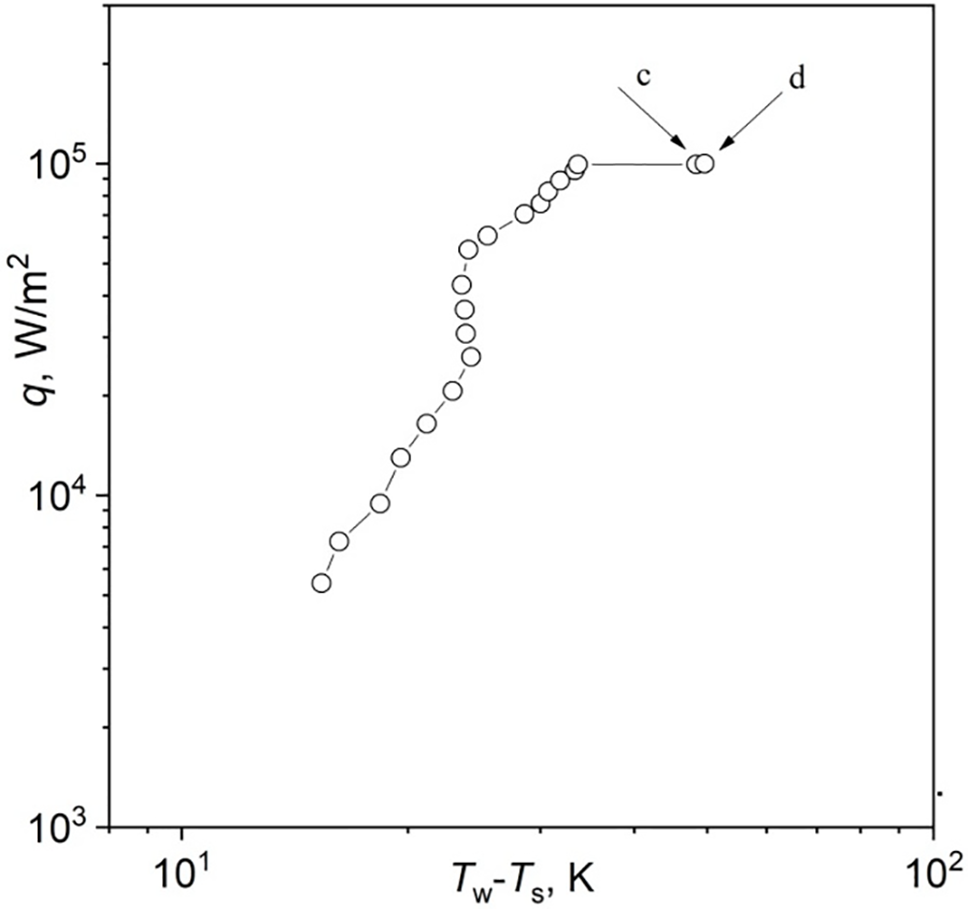
Figure 4: Boiling curve of a liquid layer with h = 6 mm. Lettering correspond to boiling regimes presented in Fig. 3
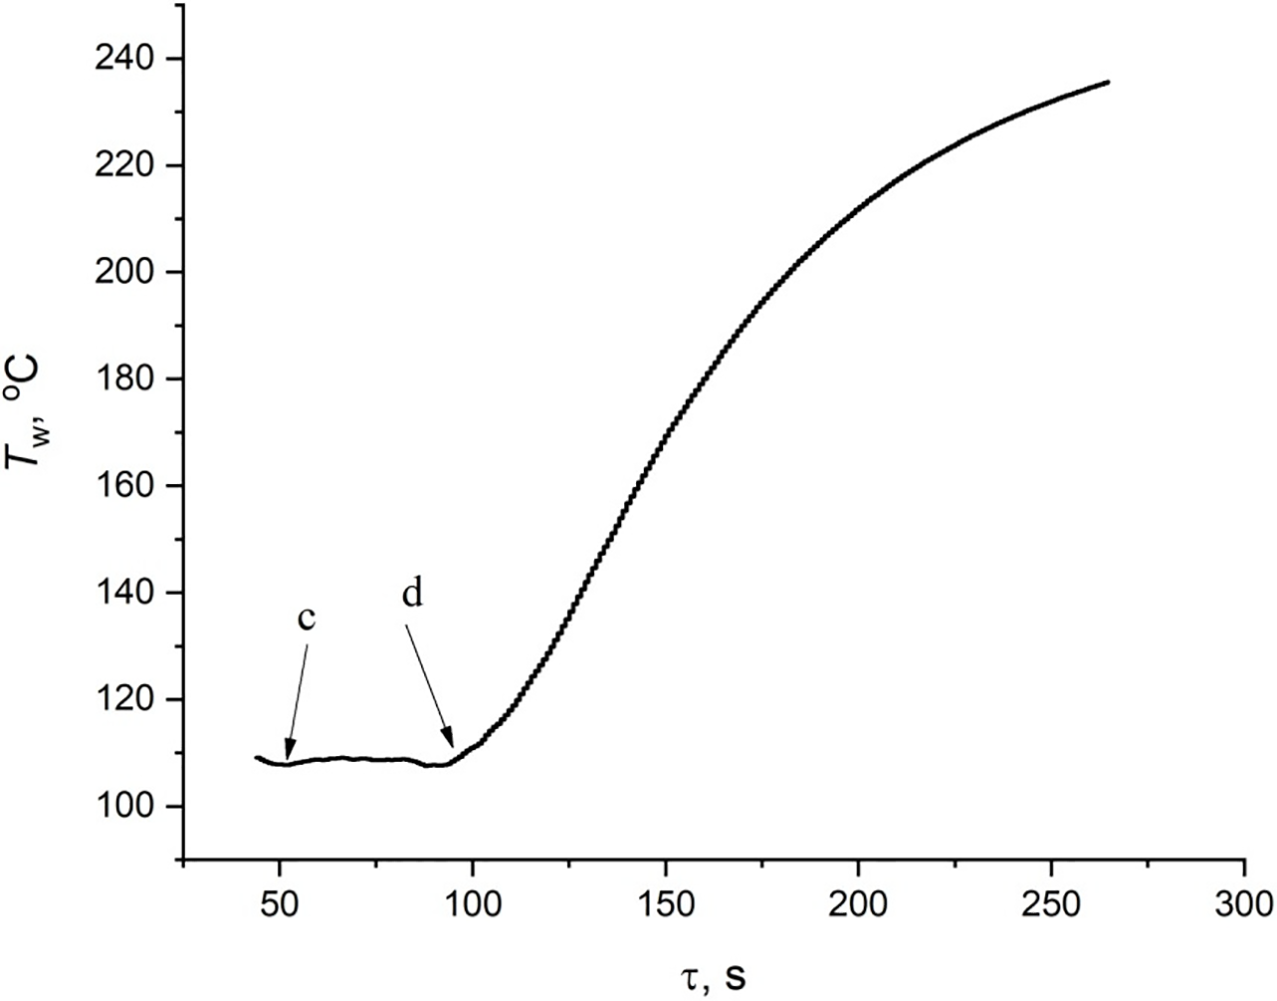
Figure 5: Change in the heating surface temperature depending on time during the development of a crisis in a layer of HFE-7100 liquid with h = 6 mm. Lettering correspond to boiling regimes presented in Fig. 3
After the area of transition boiling occupies approximately half of the heating surface (Fig. 3d), a sharp increase in temperature began (see Fig. 5). At the moment the sharp increase in temperature began, the heater was switched off.
The surface drying crisis, when a dry spot is formed on the heating surface, is typical of thin liquid layers. As follows from Fig. 2, the layer with h = 6 mm is in the region where the transition from boiling in thin films to pool boiling occurs. The layer with h = 6 mm is at the lower boundary of the transition range from CHF in thin films to CHF in a pool boiling. Judging by the observed change in the boiling crisis mechanism (Fig. 3), this is the critical height of the liquid layer
Analysis of the sequence of video frames at the initial moments of time, namely in the time interval τ ≈ 45–55 s, that vapor bubbles form on the sides of an almost square; in Fig. 6a, they are shown as circles. Also in Fig. 6a, the arrows indicate burst bubbles, these are vapor jets. The process is almost cyclical, first bubbles form, then bursting, turning into vapor jets, and between them, in place of the burst bubbles in the previous cycle, vapor bubbles form again. The formation of bubbles and vapor jets in this regime is controlled by two-dimensional Taylor instability. This process is shown in a diagram borrowed from [27] (Fig. 6b).
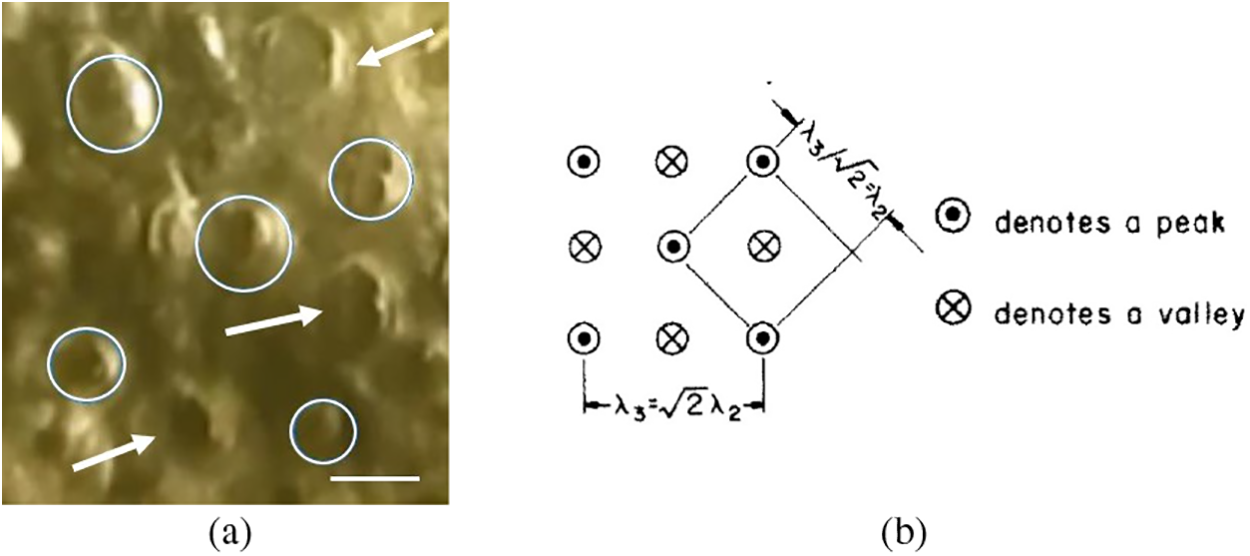
Figure 6: Two-dimensional Taylor instability in a layer of liquid at the initial moment of crisis development: (a)—photograph of “vapor jets” in a thin HFE-7100 layer at nucleate boiling crisis: layer height h = 6 mm, volume pressure 100 kPa, q = 96.9 kW/m2, temperature difference (Tw − Ts) = 48.3 K, scale 1 cm; (b)—top view of the liquid–vapor interface with two-dimensional Taylor instability [Adapted from “Sernas V, Lienhard JH, Dhir VK. The Taylor wave configuration during boiling from a flat plate”. Int J Heat Mass Transfer. 1973;16:1820–21. Copyright 1973 Elsevier] [27]
The obtained experimental data for the transition boiling mode at times τ ≈ 45–55 s were processed. The results are shown in Fig. 7. During this time interval, the heat flux had already reached its critical value (Fig. 4), but the heating surface temperature remained practically constant (Fig. 5). In the process of processing the results, the diameters of the bubbles
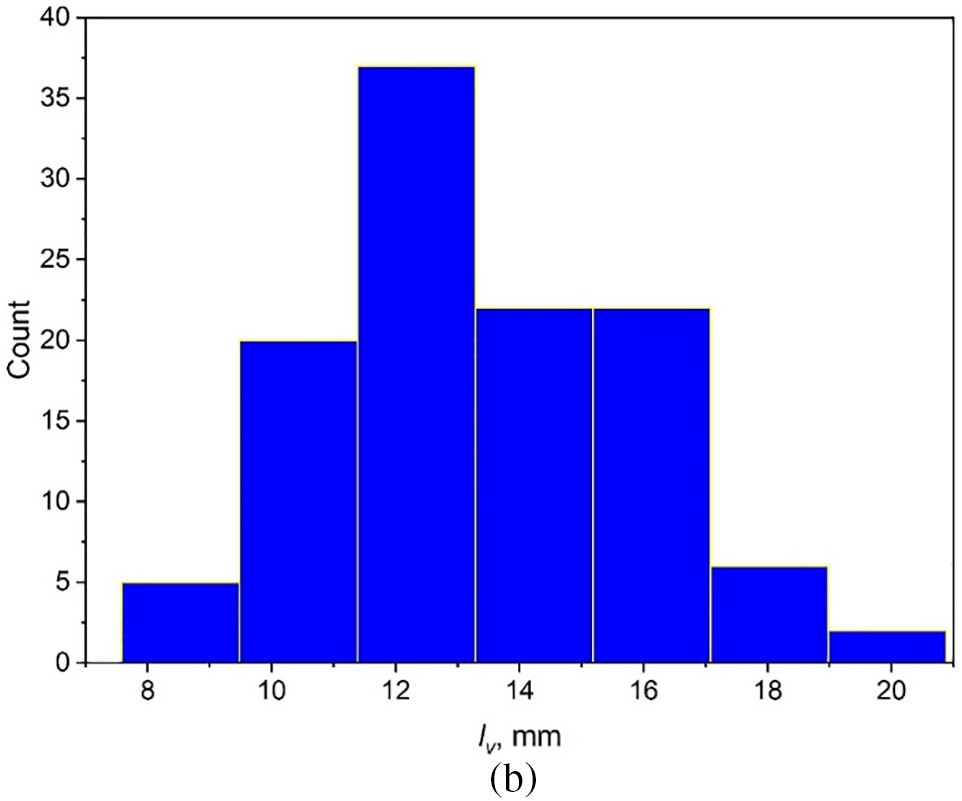
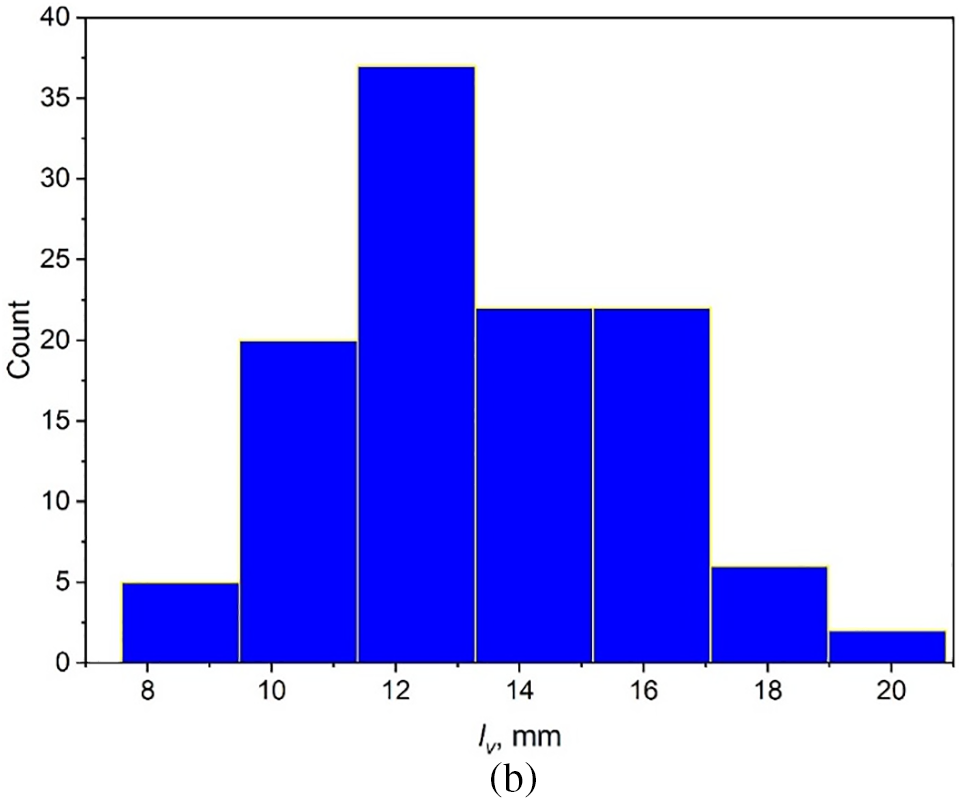
Figure 7: Histograms of the distribution of characteristic sizes during a crisis in a layer of dielectric liquid HFE-7100 with a height of h = 6 mm, pressure 100 kPa, qcr = 96.9 kW/m2, Tw – Ts = 48.3°C: (a) diameters of vapor bubbles, mm; (b) distance between centers of vapor bubbles, mm
When statistically processing the experimental results, size distribution histograms were constructed for each parameter, and the sample mean and standard deviation were found. Fig. 7 shows the histograms. Measured diameters of bubble
The data obtained as a result of statistical processing on the sizes of bubbles and measuring the distances between them, as well as the results of measuring the CHF, are given in Table 1.

At the onset of the crisis at a pressure of 100 kPa, the ratio (dv/lv) is close to that postulated by Zuber. In Fig. 6b, two instability wavelengths are highlighted, these are the one-dimensional instability wavelength
3.2 Comparison of CHF Calculations with Experimental Values
The obtained CHF measurement results were compared with calculations using the equation obtained as a result of the application of the mathematical apparatus developed by Zuber:
When calculating CHF using the measured parameters
The value of the void fractions in Zuber’s theory, as noted above, is equal to π/16 = 0.196. In this case, after substituting all the values, we obtain the void fraction of
As noted above, in the process of measuring the distance between bubbles, the length of the two-dimensional Taylor instability wave λ3 was apparently measured most often (Fig. 6b). Theoretical instability wavelength equal to the distance between the centers of the vapor bubbles
As can be seen, this equation reduces to an equation in the form of the Kutateladze Eq. (1) with a constant k = 0.1. A comparison of experiments with calculations is given in Table 2. The deviation from the experiment of the calculated value of the CHF was determined by the dependence:

The deviation from the experiment of the remaining parameters indicated in Table 2 was calculated similarly, as the ratio of the modulus of the difference between the theoretical and experimental values to the experimental value.
From Table 2, it is clear that the calculated value of CHF differs from the experimentally obtained value by 2.3% if the calculation Formula (3) is used, into which the experimentally obtained values of linear dimensions
Experimental data illustrating the effect of layer height on the CHF value during the nucleate boiling of the HFE-7100 dielectric liquid at atmospheric pressure were obtained. The CHF increased with increasing layer height up to 16 mm, and then decreased to values corresponding to the CHF during pool boiling.
The layer height influences the observed type of boiling crisis. There is a critical layer height of
Based on the results of measuring the distances between bubbles and their diameters in the transition boiling mode within a
Acknowledgement: None.
Funding Statement: This research was funded by the Russian Science Foundation, Grant No. 23-19-00245.
Author Contributions: Conceptualization, A. N. Pavlenko; validation, V. I. Zhukov; formal analysis, A. N. Pavlenko, V. I. Zhukov; investigation, V. I. Zhukov; resources, A. N. Pavlenko; writing—original draft preparation, V. I. Zhukov; writing—review and editing, A. N. Pavlenko; visualization, V. I. Zhukov; project administration, A. N. Pavlenko; funding acquisition, A. N. Pavlenko. All authors reviewed the results and approved the final version of the manuscript.
Availability of Data and Materials: Data are contained within the article.
Ethics Approval: Not applicable.
Conflicts of Interest: The authors declare no conflicts of interest to report regarding the present study.
References
1. Zhang Y, Zhao Y, Dai S, Nie B, Ma H, Li J, et al. Cooling technologies for data centres and telecommunication base stations—A comprehensive review. J Clean Prod. 2022;334:130280. doi:10.1016/j.jclepro.2021.130280. [Google Scholar] [CrossRef]
2. Sajjad U, Sadeghianjahromi A, Ali HM, Wang C-C. Enhanced pool boiling of dielectric and highly wetting liquids-a review on enhancement mechanisms. Int Commun Heat Mass Transfer. 2020;119:104950. doi:10.1016/j.icheatmasstransfer.2020.104950. [Google Scholar] [CrossRef]
3. Alvariño PF, Simón MLS, Guzella MS, Paz JMA, Jabardo JMS, Gómez LC. Experimental investigation of the CHF of HFE-7100 under pool boiling conditions on differently roughened surfaces. Int J Heat Mass Transfer. 2019;139(2):269–79. doi:10.1016/j.ijheatmasstransfer.2019.04.142. [Google Scholar] [CrossRef]
4. Fan X, Gu S, Lei J, Luo G, Meng F, Wu L, et al. Experimental and analytical study on the influence of saturation pressure and surface roughness on pool boiling CHF of HFE-7100. Int J Chem Eng. 2022;2022(1):1–18. doi:10.1155/2022/4875208. [Google Scholar] [CrossRef]
5. Yu J, Chen Z, Utaka Y. Critical heat flux characteristics in pool boiling at low pressure for dielectric fluid Novec 7100. Int J Heat Mass Transfer. 2024;232(11):125959. doi:10.1016/j.ijheatmasstransfer.2024.125959. [Google Scholar] [CrossRef]
6. Zhukov VI, Pavlenko AN. Heat transfer and critical phenomena during evaporation and boiling in a thin horizontal liquid layer at low pressures. Int J Heat Mass Transfer. 2018;117(11):978–90. doi:10.1016/j.ijheatmasstransfer.2017.10.060. [Google Scholar] [CrossRef]
7. Pavlenko AN, Zhukov VI, Shvetsov DA. Crisis phenomena and heat-transfer enhancement during boiling and evaporation in horizontal liquid films (Review). Therm Eng. 2022;69(11):886–901. doi:10.1134/S0040601522110076. [Google Scholar] [CrossRef]
8. Wang X, Tang Y, Liu L, Zhang P, Zhang Y, Zhao J, et al. Influence of smooth heater size on critical heat flux and heat transfer coefficient of saturated pool boiling heat transfer. Exp Therm Fluid Sci. 2024;151(8):111068. doi:10.1016/j.expthermflusci.2023.111068. [Google Scholar] [CrossRef]
9. Taylor GI. The instability of liquid surfaces when accelerated in a direction perpendicular to their plane. Proc Roy Soc London Series A. 1950;201(1065):192–96. doi:10.1098/rspa.1950.0052. [Google Scholar] [CrossRef]
10. Bellman R, Pennington RH. Effects of surface tension and viscosity on Taylor instability. Quart Appl Math. 1954;12(2):151–62. doi:10.1090/qam/63198. [Google Scholar] [CrossRef]
11. Lienhard JH, Dhir VK. Hydrodynamic prediction of peak pool-boiling heat fluxes from finite bodies. Trans ASME J Heat Transfer. 1973;95:152–58. [Google Scholar]
12. Lienhard JH, Dhir VK. Extended hydrodynamic theory of the peak and minimum pool boiling heat fluxes. Lexington: University of Kentucky; 1973. NASA CR-2270. [Google Scholar]
13. Kutateladze SS. Hydrodynamic model of heat transfer crisis in free-convection boiling. J Tech Phys. 1950;20(11):1389–92. [Google Scholar]
14. Zuber N. On the stability of boiling heat transfer. ASME J Heat Transfer. 1958;80(2):711–20. [Google Scholar]
15. Zuber N. Hydrodynamic aspects of boiling heat transfer (Ph.D. Thesis). Ramo-Wooldridge Corp.; Univ. of California, Los Angeles, CA, USA; 1959. [Google Scholar]
16. Liang G, Mudawar I. Pool boiling critical heat flux (CHF)—Part 1: review of mechanisms, models, and correlations. Int J Heat Mass Transfer. 2018;117:1352–67. [Google Scholar]
17. Liang G, Mudawar I. Pool boiling critical heat flux (CHF)—Part 2: assessment of models and correlations. Int J Heat Mass Transfer. 2018;117:1368–83. [Google Scholar]
18. Patel R, Meyer M, Hartwig J, Mudawar I. Review of cryogenic pool boiling critical heat flux databases, assessment of models and correlations, and development of new universal correlations. Int J Heat Mass Transfer. 2022;190:122579. [Google Scholar]
19. Xiang L, Song Y, Yang D, Zhang Z, Yao S, Vafai K. Boiling mechanism of biphilic surfaces based on Helmholtz instability and Taylor instability. Int J Multiphase Flow. 2024;173:104735. [Google Scholar]
20. Lienhard JH. Snares of pool boiling research: putting our history to use. In: Proceedings of the 10th International Heat Transfer Conference, 1994; Brighton, UK; p. 333–48. [Google Scholar]
21. Yagov VV. Is a crisis in pool boiling actually a hydrodynamic phenomenon? Int J Heat Mass Transfer. 2014;73:265–73. [Google Scholar]
22. Bergles AE. What is a real mechanism of CHF in pool boiling? In: Dhir VK, Bergles AE, editors. Pool and external flow boiling. New York: ASME; 1992. p. 165–70. [Google Scholar]
23. Theofanous TG, Tu JP, Dinh AT, Dinh TN. The boiling crisis phenomenon: part I: nucleation and nucleate boiling heat transfer. Exp Therm Fluid Sci. 2002;26:775–92. [Google Scholar]
24. Theofanous TG, Tu JP, Dinh AT, Dinh TN. The boiling crisis phenomenon: part II: dryout dynamics and burnout. Exp Therm Fluid Sci. 2002;26:793–810. [Google Scholar]
25. Zhukov VI, Pavlenko AN. Crisis of nucleate boiling in a finite-height horizontal layer of liquid. J Engin Thermophys. 2020;29(1):1–13. doi:10.1134/S1810232820010014. [Google Scholar] [CrossRef]
26. Zhukov VI, Pavlenko AN. Symmetry of structures under two-dimensional instability in a finite-height horizontal layer of boiling liquid. Symmetry. 2023;15(9):1792. doi:10.3390/sym15091792. [Google Scholar] [CrossRef]
27. Sernas V, Lienhard JH, Dhir VK. The Taylor wave configuration during boiling from a flat plate. Int J Heat Mass Transfer. 1973;16(9):1820–21. doi:10.1016/0017-9310(73)90175-0. [Google Scholar] [CrossRef]
28. 3MTM NovecTM Engineered Fluid HFE-7100 Datasheet. Available from: https://www.sil7mid.com/getattachment/706d712f-db18-4563-bcd6-ab78cba39349/3M-Novec-HFE-7100-TDS.aspx. [Accessed 2018]. [Google Scholar]
29. Rausch MH, Kretschmer L, Will S, Leipertz A, Fröba AP. Density, surface tension, and kinematic viscosity of hydrofluoroethers HFE-7000, HFE-7100, HFE-7200, HFE-7300, and HFE-7500. J Chem Eng Data. 2015;60:3759–65. [Google Scholar]
30. Shvetsov DA, Pavlenko AN, Zhukov VI. Heat transfer during boiling in horizontal layers of HFE-7100 on smooth and modified surfaces. J Eng Thermophys. 2024;33(2):250–68. doi:10.1134/S1810232824020024. [Google Scholar] [CrossRef]
31. Shukla MY, Kandlikar SG. Influence of liquid height on bubble coalescence, vapor venting, liquid return, and heat transfer in pool boiling. Int J Heat Mass Transf. 2021;173(12):121261. doi:10.1016/j.ijheatmasstransfer.2021.121261. [Google Scholar] [CrossRef]
Cite This Article
 Copyright © 2024 The Author(s). Published by Tech Science Press.
This work is licensed under a Creative Commons Attribution 4.0 International License , which permits unrestricted use, distribution, and reproduction in any medium, provided the original work is properly cited.


 Submit a Paper
 Propose a Special lssue
 View Full Text
 Download PDF
 Downloads
 Citation Tools