
 Submit a Paper
 Propose a Special lssue
 Open Access
ARTICLE

Assessment of Low Global Warming Potential Refrigerants for Waste Heat Recovery in Data Center with On-Chip Two-Phase Cooling Loop
1 Shenzhen Power Supply Bureau Co., Ltd., Shenzhen, 518020, China
2 Guangzhou Institute of Energy Conversion, Chinese Academy of Sciences, Guangzhou, 510640, China
* Corresponding Author: Jiongcong Chen. Email:
(This article belongs to the Special Issue: Innovative Heat Transfer Fluids for Enhanced Energy Sustainability in Thermal Systems)
Frontiers in Heat and Mass Transfer 2024, 22(4), 1171-1188. https://doi.org/10.32604/fhmt.2024.054594
Received 02 June 2024; Accepted 18 July 2024; Issue published 30 August 2024
 View Full Text
 Download PDF
Abstract
Data centers (DCs) are highly energy-intensive facilities, where about 30%–50% of the power consumed is attributable to the cooling of information technology equipment. This makes liquid cooling, especially in two-phase mode, as an alternative to air cooling for the microprocessors in servers of interest. The need to meet the increased power density of server racks in high-performance DCs, along with the push towards lower global warming potential (GWP) refrigerants due to environmental concerns, has motivated research on the selection of two-phase heat transfer fluids for cooling servers while simultaneously recovering waste heat. With this regard, a heat pump-assisted absorption chiller (HPAAC) system for recovering waste heat in DCs with an on-chip two-phase cooling loop driven by the compressor is proposed in the present paper and the low GWP hydrofluoroolefin refrigerants, including R1224yd(Z), R1233zd(E), R1234yf, R1234ze(E), R1234ze(Z), R1243zf and R1336mzz(Z), are evaluated and compared against R245fa as server coolant. For the HPAAC system, beginning with the development of energy and economic models, the performance is analyzed through both a parametric study and optimization using the coefficient of performance (COP), energy saving ratio (ESR), payback period (PBP) and net present value (NPV) as thermo-economic indicators. Using a standard vapor compression cooling system as a benchmark, the results indicate that with the evaporation temperature between 50°C and 70°C and the subcooling degree ranging from 5°C to 15°C, R1233zd(E) with moderate compressor suction pressure and pressure ratio is the best refrigerant for the HPAAC system while R1234yf performs the worst. More importantly, R1233zd(E) is also superior to R245fa based on thermo-economic performance, especially under work conditions with relatively lower evaporation temperature as well as subcooling degree. Under the given working conditions, the overall COP, ESR, NPV, and PBP of R1233zd(E) HPAAC with optimum subcooling degree range from 4.99 to 11.27, 25.53 to 64.59, 1.13 to 4.10 × 10⁷ CNY and 5.77 to 2.22 years, respectively. Besides, the thermo-economic performance of R1233zd(E) HPAAC under optimum working conditions in terms of subcooling degree varying with the evaporation temperature is also investigated.Keywords
With the increased demand for information technology (IT) facilities, the energy efficiency in data centers (DCs) has become an emerging issue recently. Globally, the electricity consumed by DCs has increased by 56% from 2005 to 2010 and made up about 1% of the global electricity consumption in 2020 [1]. Besides, it is estimated to account for 13% of the energy consumed in the world by 2030 [2], leading to high-level energy consumption and carbon emissions. Therefore, the development of energy-saving and green DCs is a common problem worldwide with respect to the global energy shortage as well as environmental concerns.
In fact, all the electrical power input to the IT equipment in DCs is ultimately converted into low-grade waste heat [3]. So, cooling systems are needed to maintain the room temperature and ensure the IT equipment contained within is free of performance degradation and irreversible damage caused by high temperatures. Traditionally, vapor compression refrigeration systems are used to cool DCs, which employ air as heat transfer fluid to remove heat, although widely used, are low in efficiency and thus lead to a tremendous increase in power consumption. The cooling system accounts for roughly 30%–50% of the total energy consumption [4]. In this context, several advanced cooling technologies have been developed for DCs to deal with the problem. Among them, liquid cooling systems have become more and more popular owing to their ability to remove higher heat flux compared to air-cooled ones [5]. More importantly, in comparison with the air-cooled cases, the liquid cooling of DCs can produce higher temperature waste heat resources, thereby allowing larger recovery potential, especially for DCs with the two-phase cooling loop, which received a favor recently owing to its high compactness, high efficiency, and excellent temperature uniformity [6].
A number of measures have been proposed for recovering the waste heat in DCs, including for heating purposes such as domestic hot water and space heating [7,8], providing a heat source for thermal power cycles [9–11], thermally-driven chillers [12–14] and so on [15]. Among all these measures, the utilization of an absorption chiller (AC) for cooling purposes stands out with the advantages of direct reduction of DC load, location independent, and easily scalable in capacity. Nowadays, the most widely used refrigerant and absorbent pairs in AC systems are NH3/H2O and H2O/LiBr solution [16]. For the cases related to DCs, H2O/LiBr solution is the preferred one due to its lower driven temperature and higher coefficient of performance (COP) compared to that of NH3/H2O system [17]. As for the scenario of AC driven by the waste heat from DCs, the two-phase cooling loop driven by a vapor compressor is of great interest, where the compressor is used to boost the refrigerant vapor out of servers before entering the generator of AC in place of the condenser on-chip cooling circuit. This configuration is similar to that of the utilization of organic Rankine cycle for DC waste heat recovery [9–11], in which the chip cooling loop can be considered as a vapor compression heat pump (HP) cycle and thus can be called HP assisted AC (HPAAC) system. However, to date, although the studies relevant to assessing the performance of HPAAC for waste heat recovery in DCs are very scarce, the prospect of HPAAC has been already proven.
For example, Ebrahimi et al. [18] investigated the thermo-economic potential of HPAAC in DC and showed that by utilizing the waste heat dissipated from 3 to 5 racks, the system can provide sufficient chilled water to cool an additional rack of the same type. Furthermore, the system payback period can be as short as 4–5 months. Khalid et al. [19] compared the HPAAC with the water-based corresponding system on the waste heat recovery of a 1.0 MW DC and indicated that the HPAAC has a lower cost and higher thermodynamic efficiency than that of the water-based one and thus the use of HPAAC is viable in areas with high electricity cost. It is well known that with specified AC, the performance of HPAAC is highly dependent on the refrigerant of HPs [19]. Considering the environmental concerns at present, except for high thermodynamic performance, the refrigerant for HPs should have low global warming potential (GWP) and zero or near-zero ozone depletion potential as well. However, previous works related to HPAAC have paid little attention to refrigerant selection. Therefore, the selection of hydrofluoroolefin (HFO) refrigerants, as the fourth generation refrigerants owing to low GWP [20] considered to be the most suitable alternatives to chlorofluorocarbons, hydrochlorofluorocarbons as well as hydrofluorocarbons for the HPAAC system shows novelty.
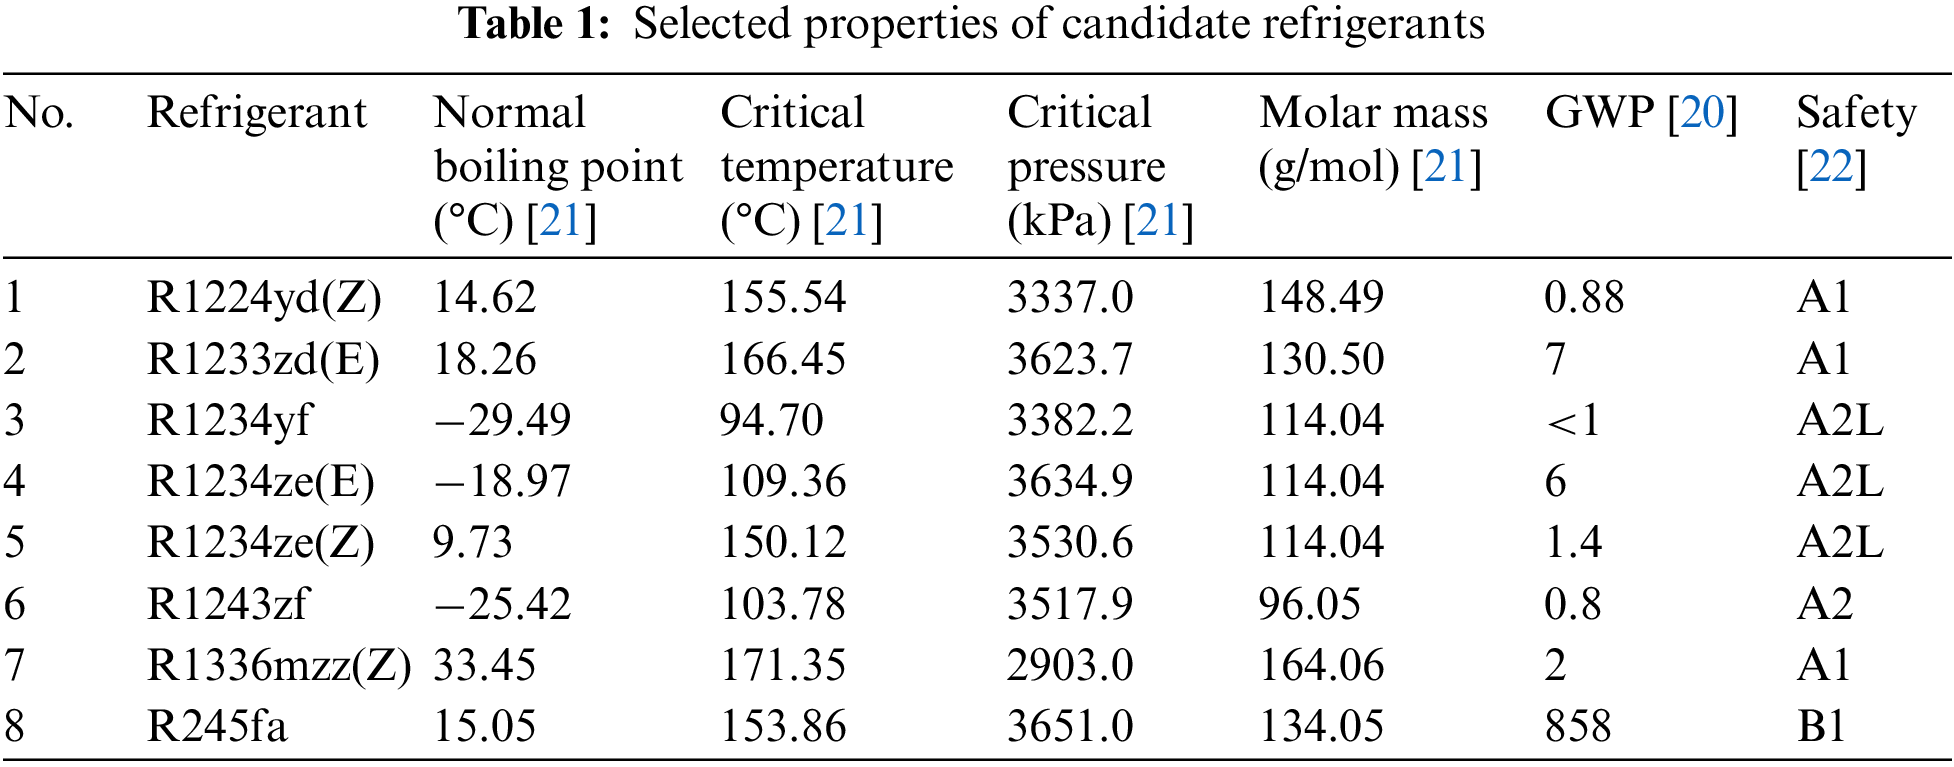
Followingly, the potentials of seven HFOs, including R1224yd(Z), R1233zd(E), R1234yf, R1234ze(E), R1234ze(Z), R1243zf and R1336mzz(Z), used as server coolant are evaluated and compared against R245fa in this paper, and the most promising candidate is recommended. Some fundamental properties of these refrigerants are given in Table 1. The effects of operating parameters, such as the evaporation temperature and subcooling degree at the condenser outlet of HP on the thermo-economic performance of the HPAAC system are also analyzed and discussed. Moreover, this study differs from the previous works due to the selection of low GWP fluids based on multi-criteria indicators, including energy and economic performance, for the HPAAC system driven by waste heat recovery in DCs with a two-phase cooling loop.
2 Description of Waste Heat Recovery System
The system layout of HPAAC is shown in Fig. 1. Here, the H2O/LiBr AC is integrated into DCs and driven by the heat dissipated by a number of server racks, which operates with a two-phase cooling loop system where the refrigerant vapor is boosted by a compressor before entering AC. The system features two closed loops, HP and AC loops, coupled by an intermediate heat exchanger, i.e., the generator in the AC, which also functions as the condenser of HP. Meanwhile, the HP loop that can be considered as a server cooling loop is characterized by micro-evaporators at each chip, and the details about micro-evaporators are outside the scope of this work but can be found in [23]. The chilled water produced by the AC can then be used to remove heat from additional micro-processors or to cool the buildings. Thus, the cooling load of the existing vapor compression cooling system used in DCs can be partially or fully eliminated, which offers significant energy savings.
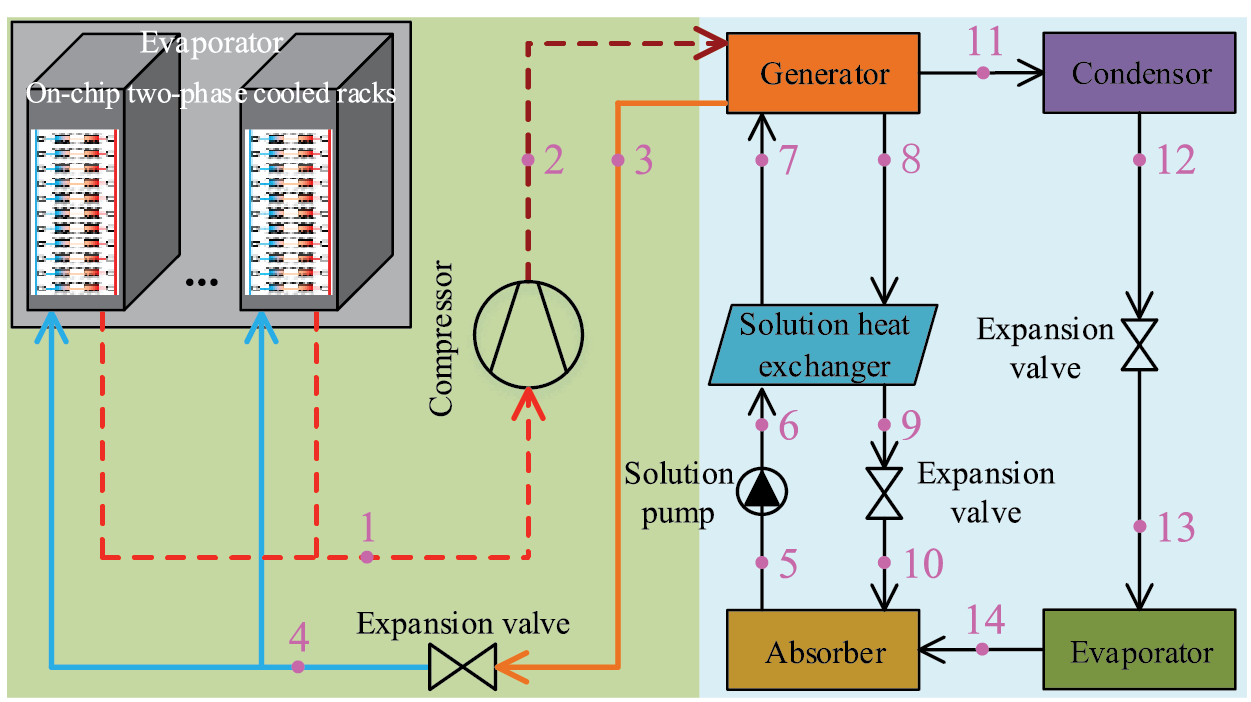
Figure 1: Layout of HPAAC system for waste heat recovery in DCs with two-phase cooling loop
Here the assessment of HFOs in the HPAAC system is performed based on thermo-economic performance. For simplicity, some assumptions are given as follows:
(1) The system works under steady-state conditions.
(2) The heat losses and pressure drops involved are neglected.
(3) The throttling process of refrigerant and solution is isenthalpic.
(4) The refrigerant vapor at the HP evaporator outlet is saturated.
(5) The condensation temperature is assumed to be 90°C for the HP cycle [9].
(6) The solution leaving the generator and absorber of AC is in saturated mixtures.
(7) The power consumed by AC solution pump is neglected [24].
(8) The refrigerant water at AC condenser and evaporator outlets is saturated in liquid and vapor, respectively [25].
(9) The generation temperature of AC is set to be 5°C lower than the refrigerant temperature out of the HP condenser, i.e., AC generator.
(10) The absorber and condenser of AC are cooled with water in parallel and the absorption and condensation temperature are set to be 3°C higher than the cooling water outlettemperature [26].
(11) The evaporation temperature of AC is set to be 2°C lower than the chilled water outlet temperature [26].
(12) A specific effectiveness of 80% is assumed for the solution heat exchanger of AC [27].
With the above-mentioned assumptions and referring to the HPAAC system presented in Fig. 1, the energy balance equations for the condenser and evaporator of HP are given as follows [28]:
where QHP,con and QHP,evp are the heat transfer rate of the condenser and evaporator in HP, respectively; Qdiss is the heat dissipation of racks; mwf is the refrigerant mass flow rate in HP; h is specific enthalpy.
The power input to the compressor is calculated by
where WHP,com is the electricity power consumed by the compressor in HP; ηis is the compressor isentropic efficiency, which is calculated as [29]
where pHP,con and pHP,evp are the condensation and evaporation pressure in HP, respectively.
Accordingly, the COP of HP (COPHP) is defined as the ratio of condenser heat transfer rate to compressor work
Considering mass and energy balances in main components including the generator, absorber, condenser, evaporator, and solution heat exchanger, AC can be modeled as follows [30]:
where QAC,gen, QAC,abs, QAC,con, QAC,eva and QAC,she are the heat transfer rate of the generator, absorber, condenser, evaporator and solution heat exchanger in AC, respectively; mH2O is mass flow rate of refrigerant in AC; f is the circulation ratio, which can be determined by
where xs and xw are the mass fraction of LiBr in strong and weak H2O/LiBr solutions, respectively.
With a specific effectiveness (ηAC,she), the state parameters related to solution heat exchanger can be expressed as
Based on the assumptions given, the values of specific enthalpy at the outlet of the solution pump and expansion valves of AC can be defined as
The COP of AC (COPAC) is defined as the ratio of the cooling capacity produced in the evaporator to the energy consumption by the generator
Thus, the system overall COP (COPHPAAC) as the key thermodynamic performance indicator of the HPAAC system can be calculated as the ratio of cooling capacity provided to the total powerinput [31].
Besides, the energy saving ratio (ESR) is also adopted to evaluate the energy saving effect of the HPAAC system [32], which is defined as the ratio between electricity consumption saving resulting from the HPAAC system and that of the reference vapor compression cooling (VCC) system.
It is noteworthy that in numerical simulation, the thermophysical properties of HFO refrigerants and H2O/LiBr solution are calculated using REFPROP 10.0 [21] and Patek et al. [33], respectively. The validation of HP and AC models can be found in authors’ previous works [28,30].
For the economic assessment of the HPAAC system, net present value (NPV) and payback period (PBP) are used as performance indicators [34]. In detail, NPV denotes the accumulated net revenue of the system through the whole life time and the investment is accepted with an NPV value larger than zero (where larger values are better); PBP is the time needed to recover the initial investment cost, with shorter periods being more favorable. NPV and PBP can be calculated by Eqs. (17) and (18), respectively [28,35].
where TCIHPAAC is the total capital investment of the HPAAC system; AS is annual saving; n is lifetime; i is the interest rate. TCI and AS can be simplified and determined as follows:
where βTCI is the fixed multiple factor related to installation cost including auxiliary equipment, pipes and etc; cHP, cAC, cCT and cele are the unit price of HP, AC, cooling tower, and electricity, respectively; τ is annual operation hours; φ is maintenance cost factor.
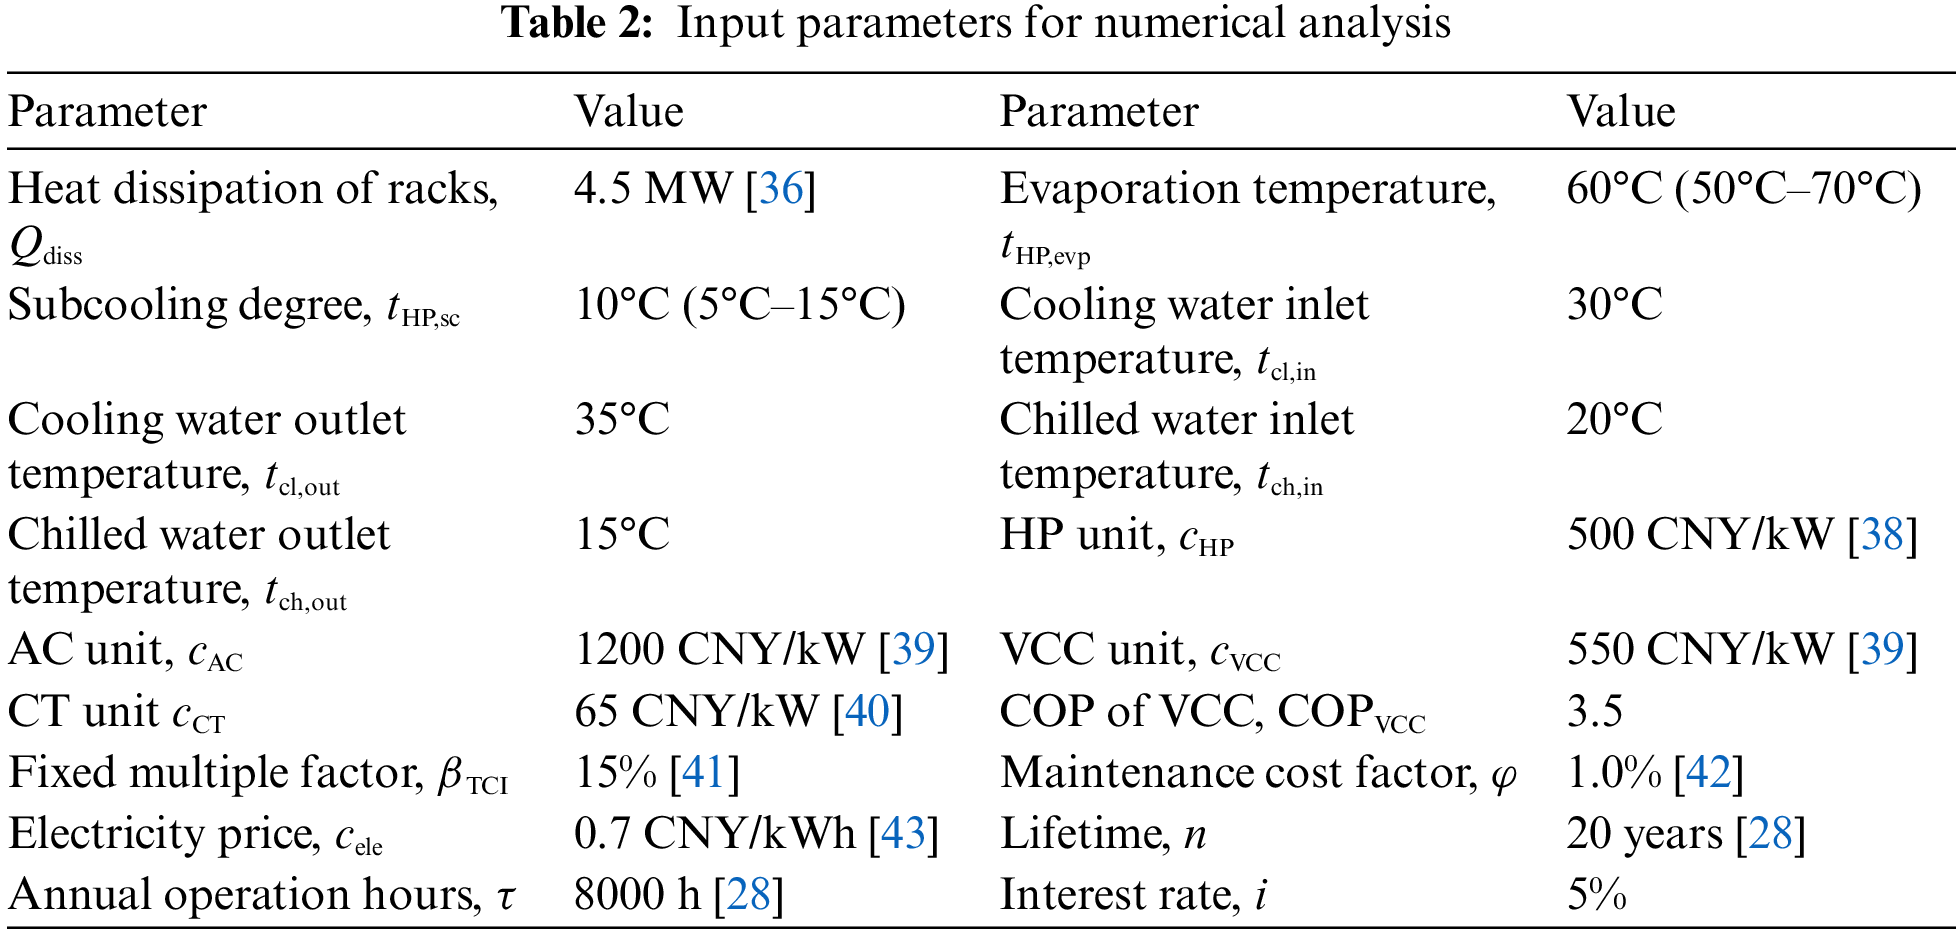
Based on the model developed above, the potential of HFOs, including R1224yd(Z), R1233zd(E), R1234yf, R1234ze(E), R1234ze(Z), R1243zf and R1336mzz(Z), in the HPAAC is investigated against R245fa as server coolant under various evaporation temperature and subcooling degree at the condenser outlet of HP. The DC comprising 300 server racks is considered with 15 kW of waste heat dissipated by each server rack [36]. That is to say, the total heat dissipation of server racks reaches4.5 MW. The evaporation temperature ranges from 50°C to 70°C with a typical value of 60°C, which can assure safe operation with a temperature below the maximum allowable temperature of 85°C for computing chips [32]. The subcooling degree ranges from 5°C to 15°C with a typical value of 10°C. Regarding AC, it is well known that the higher the evaporation temperature, the better AC performance, and therefore the elevated-temperature chilled water is used with the inlet/outlet fixed at 20/15°C, which can meet DC cooling requirements [37]. The detailed input parameters for numerical analysis are presented in Table 2. It should be noted that in the analysis the input data are kept consistent with the typical values given in Table 2, except for the parameter whose effect is discussed varies.
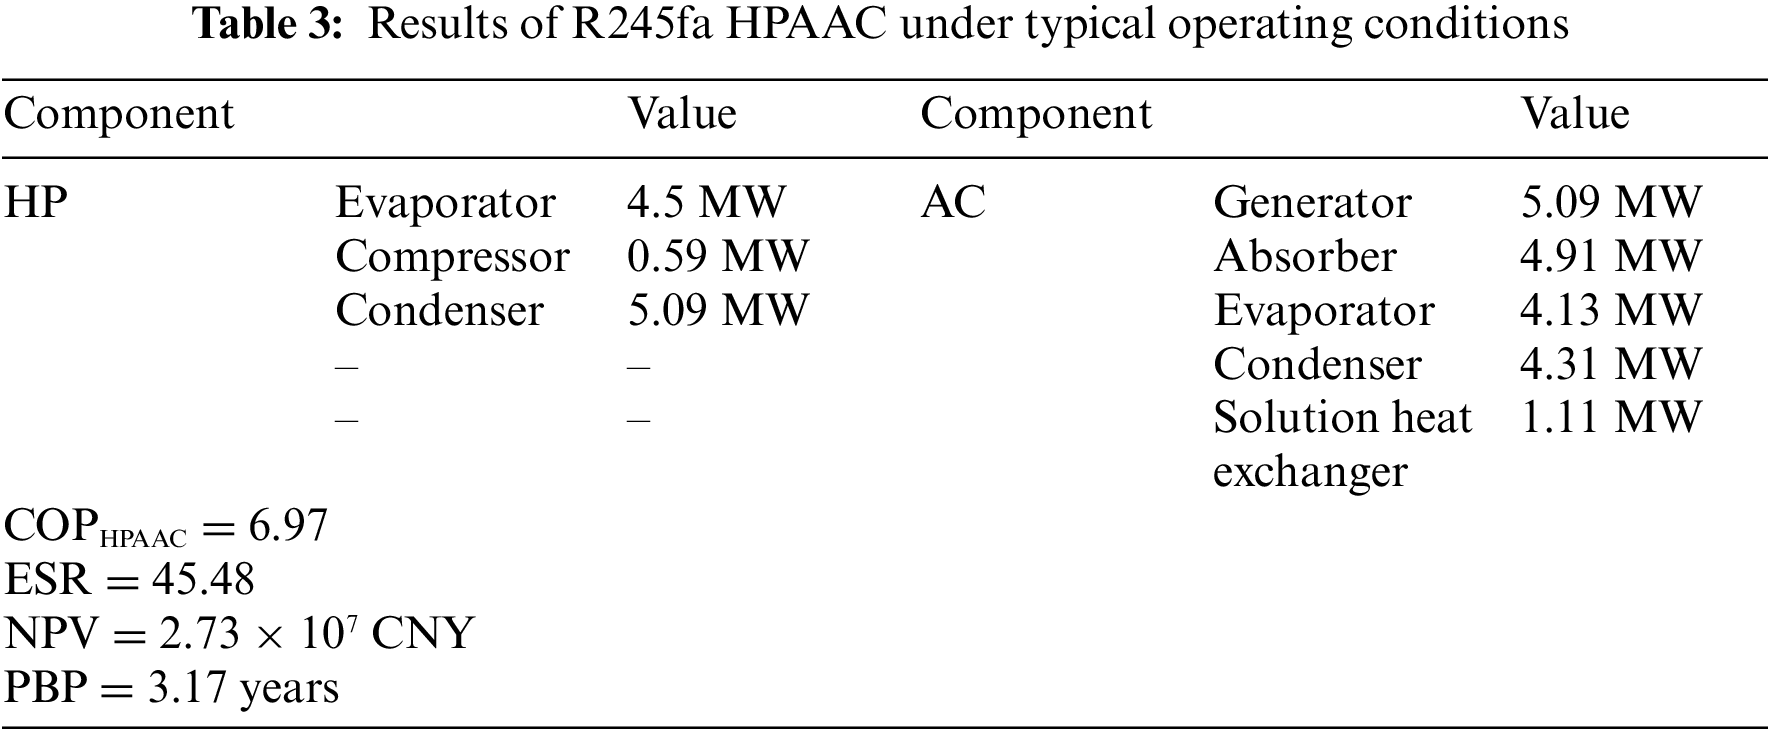
The analysis starts with the HPAAC system using R245fa as a reference refrigerant under typical operating conditions, and the results including the component capacities and thermo-economic performance indicators are shown in Table 3. It can be found from the table that under the typical operating conditions, the overall COP, energy saving ratio, net present value and payback period of the R245fa HPAAC system are about 6.97, 45.48, 2.73 × 10⁷ CNY, and 3.17 years, respectively.
Considering the given working conditions, the technical features of using the HFOs in HPAAC system is reasonably focused on the suction pressure and pressure ratio of compressor in HP included [44]. As shown in Figs. 2 and 3, the same trends of compressor suction pressure viz. evaporation pressure and pressure ratio vs. evaporation temperature for all HFOs can be observed. As expected, with the increased evaporation temperature, the suction pressure increases, and the pressure ratio decreases when the condensation temperature is constant. Taking 1 MPa as a reference point, the HFOs can be categorized into two groups: the low suction pressure group, including R1336mzz(Z), R1233zd(E), R1224yd(Z) and R1234ze(Z), which are comparable to R245fa, and the high suction pressure group, including R1234ze(E), R1243zf and R1234yf. Comparably, the suction pressure of the HFOs in the high suction pressure group increased rapidly with the evaporation temperature increasing. The lowest and highest suction pressure is observed in the cases of R1336mzz(Z) and R1234yf, respectively. Additionally, it is noteworthy that under the given working conditions, the suction pressure of all HFOs is above atmospheric pressure (0.1 MPa), which could avoid a safety concern related to air infiltration [45].
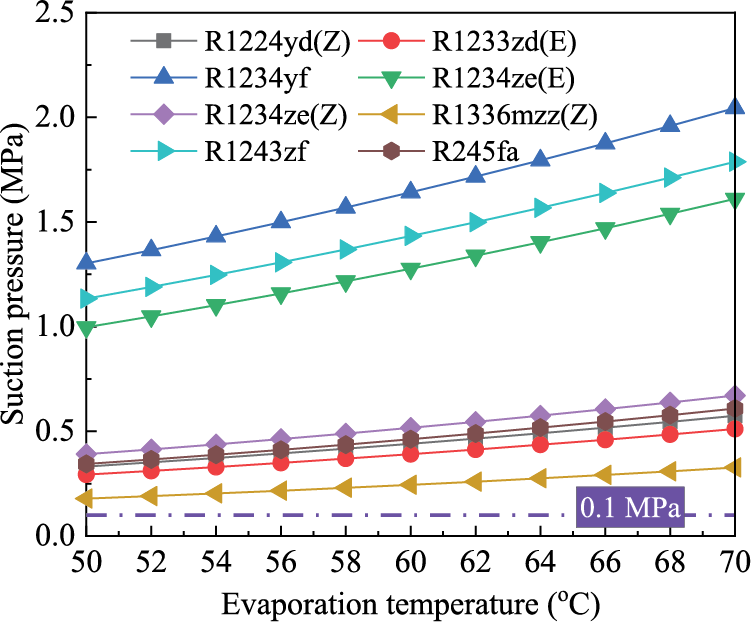
Figure 2: Compressor suction pressure vs. evaporation temperature
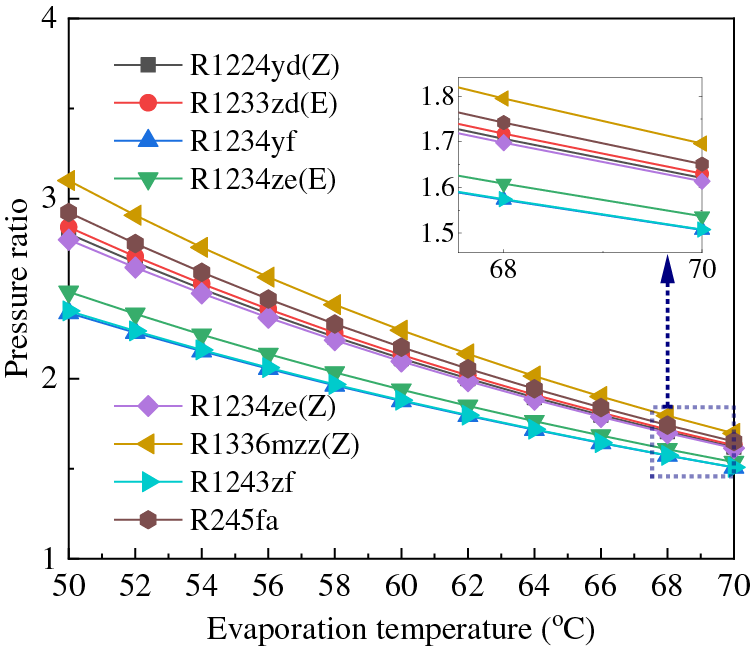
Figure 3: Compressor pressure ratio vs. evaporation temperature
Correspondingly, the HFOs belonging to the low suction pressure group usually have a higher pressure ratio compared to those in the high suction pressure group, especially under the low evaporation temperature conditions. For example, with the refrigerant evaporation temperature at 50°C, the lowest pressure ratio is observed in R1234yf about 2.37 and the highest pressure ratio is related to R1336mzz(Z) about 3.10. The difference between the lowest and highest pressure ratio diminishes with the increased evaporation temperature. It is noteworthy that, all the HFOs have a pressure ratio far below 10 across all working conditions, indicating that one-stage solution is sufficient [46]. In a word, among all the candidates, R1233zd(E) and R1234ze(Z) are comparable with that of R245fa having moderate compressor suction pressure and pressure ratio.
Figs. 4–7 show the effects of the evaporation temperature on the overall COP, energy saving ratio, net present value and payback period of HPAAC system, respectively. It can be observed that for different refrigerants, with the evaporation temperature increasing from 50°C to 70°C, the overall COP, energy saving ratio, net present value and payback period present the same variation tendency. In detail, the overall COP, energy saving ratio and net present value increase while the payback period drops with the evaporation temperature increasing. Thus, it can be concluded that under the given working conditions, an increase in the evaporation temperature is beneficial to the thermo-economic performance of HPAAC system. This is due to the fact that, when the evaporation temperature increases, the compressor pressure ratio decreases with constant condensing temperature, which leads to a decline in the electricity power consumption of the compressor, and therefore the thermo-economic performance of HPAAC system is enhanced [46].
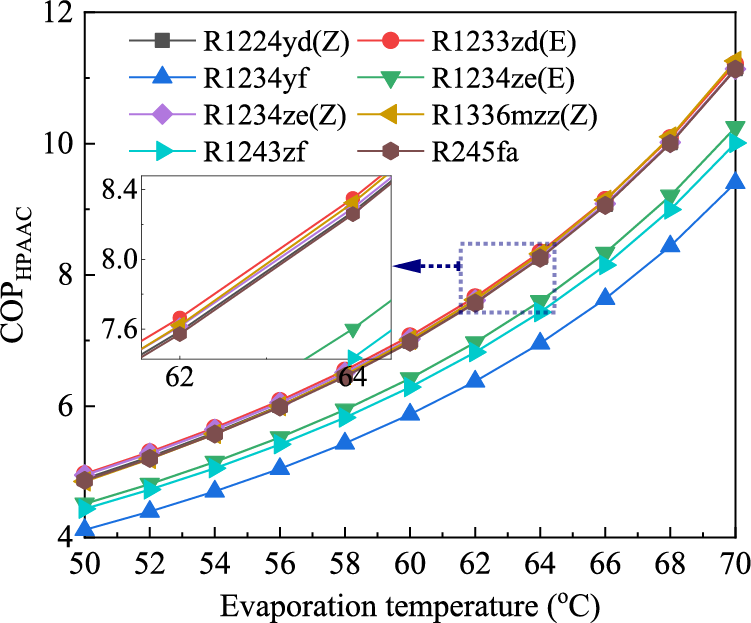
Figure 4: Overall COP vs. evaporation temperature
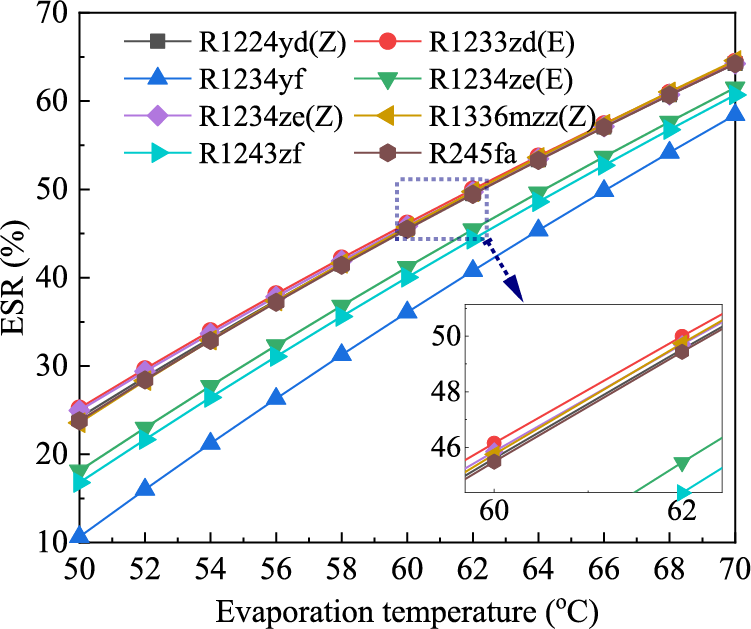
Figure 5: Energy saving ratio vs. evaporation temperature
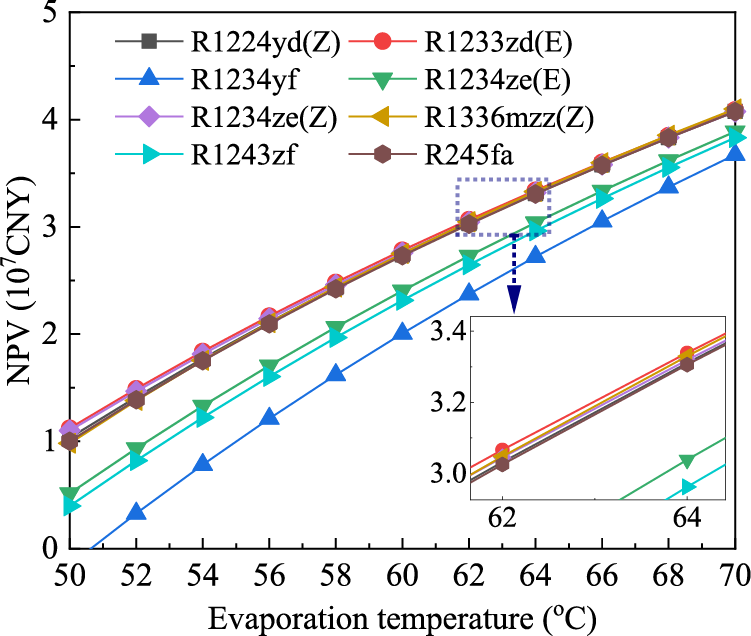
Figure 6: Net present value vs. evaporation temperature
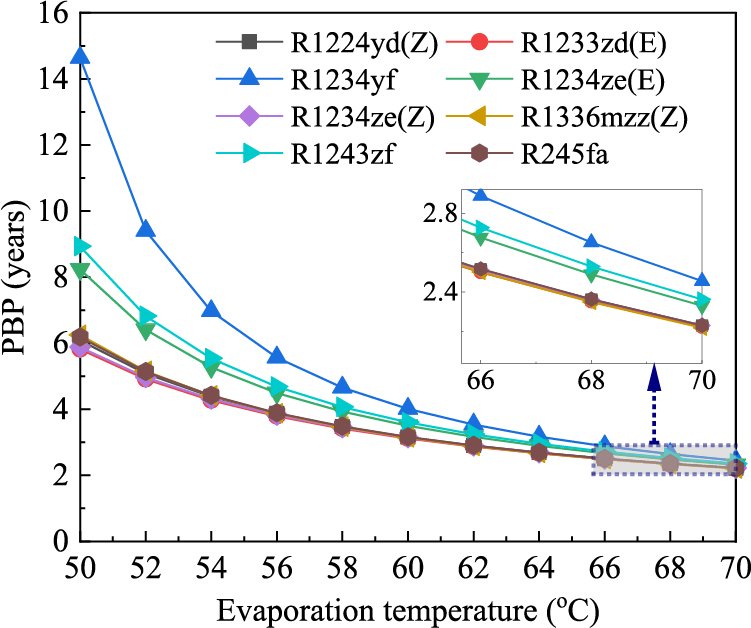
Figure 7: Payback period vs. evaporation temperature
It can be observed that, although the performance of the HPAAC system using R1224yd(Z), R1233zd(E), R1234ze(Z), and R1336mzz(Z) as server coolant is comparable with that of R245fa with higher evaporation temperature, with magnifying glass, R1233zd(E) generally outperforms R245fa under lower evaporation temperature. For example, with the evaporation temperature at 50°C, the overall COP, energy saving ratio, net present value, and payback period of R1233zd(E) is better than that of R245fa by approximately 2.03%, 6.00%, 12.01%, and 5.90%, respectively. Besides, the cases of R1234yf, R1234ze(E) and R1243zf HPAAC systems obviously present poorer performance compared to the others. More importantly, except for the index of overall COP, the difference among the other performance indicators of the candidates examined becomes small with the increased evaporation temperature, especially in terms of PBP. In a word, R1233zd(E) is the best refrigerant for the HPAAC system in general, followed by R1234ze(Z), R1336mzz(Z), R1224yd(Z), R1234ze(E) and R1243zf in sequence, and R1234yf is the worst candidate within the evaporation temperature range considered. Accordingly, it can be derived that the thermo-economic performance of the HPAAC system has a strong connection with the refrigerant critical temperature, which is similar to the findings reported by Bamigbetan et al. [47]. In general, the HFO with a high critical temperature usually has better thermo-economic performance.
Figs. 8–11 show the effects of the subcooling degree on the overall COP, energy saving ratio, net present value, and payback period of the HPAAC system, respectively. It can be found that the subcooling degree has similar effects on the performance of the HPAAC system using different HFOs with a subcooling degree between 5°C and 15°C. In other words, the overall COP, energy saving ratio, and net present value initially increase and then decrease, while the payback period exhibits the opposite trend, with the increased subcooling degree. This phenomenon approves that there exists an optimum subcooling degree that maximizes thermo-economic performance under the given working conditions. It is mainly owing to the fact that the increase in subcooling degree within certain ranges enhances the COP of HP, as observed by Redón et al. [48]. However, this also results in a decrease in the generation temperature of AC, which leads to a decline in AC efficiency [18]. Thus, the interaction between the improvement in HP performance and the deterioration of AC efficiency determines the existence of an optimal subcooling degree, which maximizes the thermo-economic performance of the HPAAC system.
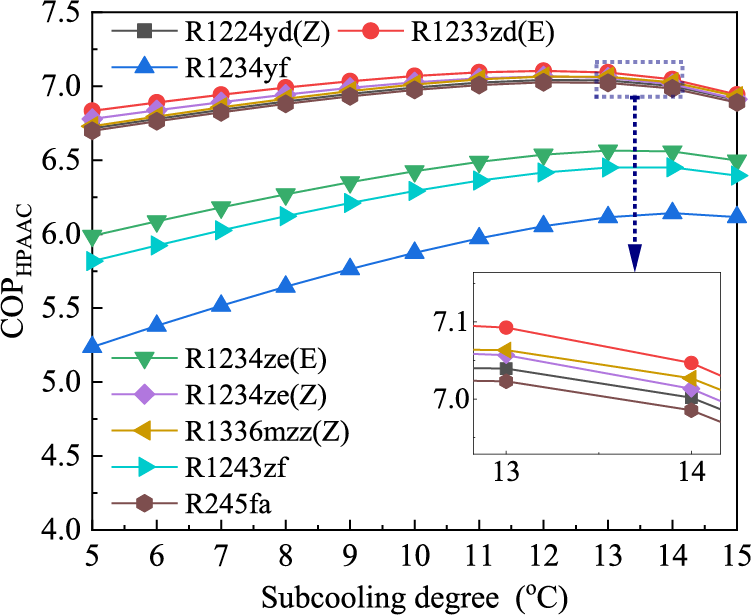
Figure 8: Overall COP vs. subcooling degree
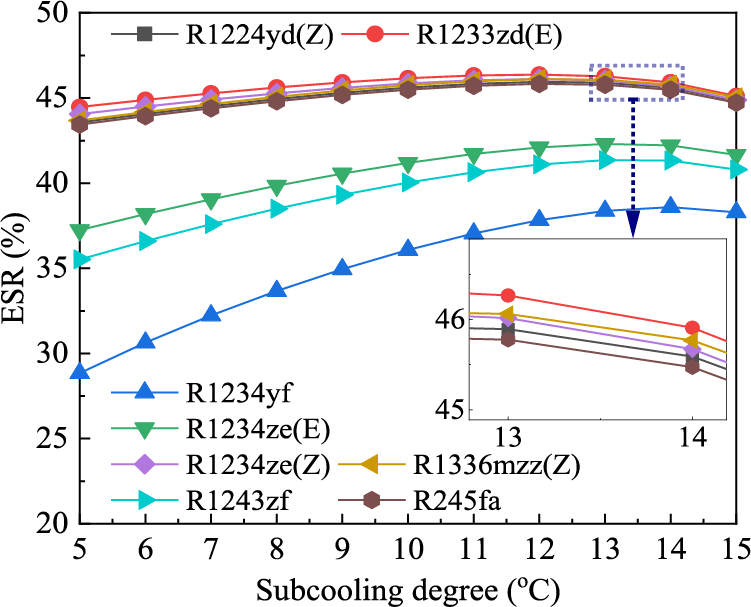
Figure 9: Energy saving ratio vs. subcooling degree
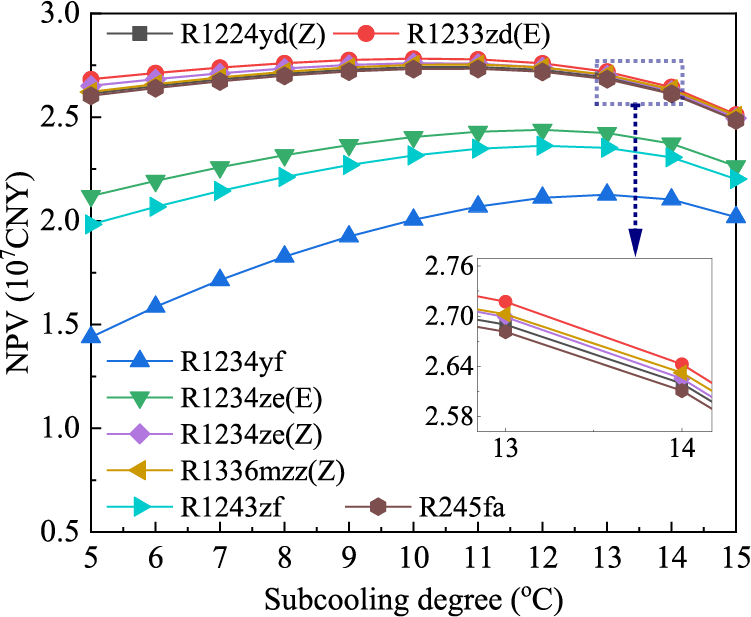
Figure 10: Net present value vs. subcooling degree
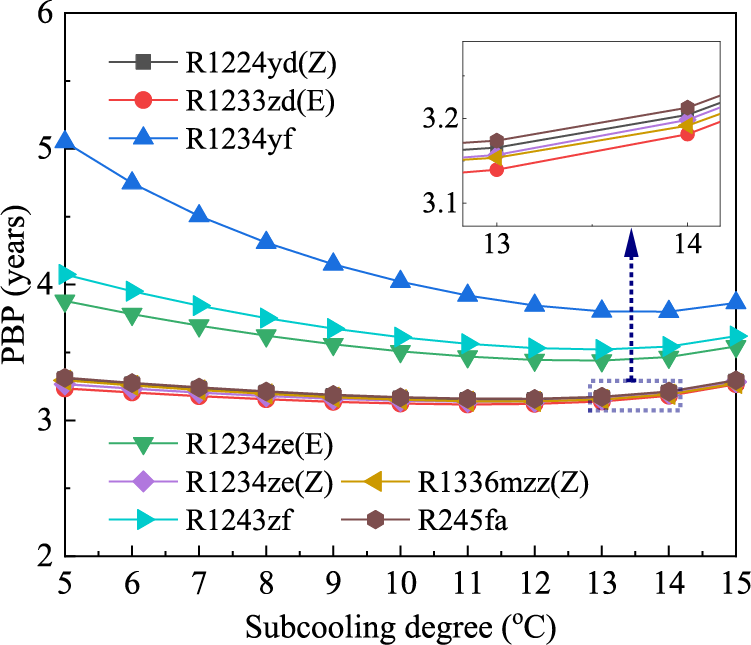
Figure 11: Payback period vs. subcooling degree
Additionally, as shown in these figures, with the subcooling degree increasing from 5°C to 15°C, the thermo-economic performance ranking of candidate HFOs in the HPAAC system is similar to the findings yielded from that of vs. the evaporation temperature. This means that under the given conditions, R1233zd(E) is the best refrigerant for the HPAAC system, followed by R1234ze(Z), R1336mzz(Z), R1224yd(Z), R1234ze(E) and R1243zf, and R1234yf is the worst refrigerant. Moreover, the difference among all the performance indicators of the candidate HFOs becomes small and the superiority of R1233zd(E) and R1234ze(Z) over R245fa gets weakened with the increased subcooling degree. It is interesting to find that comparatively, the HFOs in HPAAC systems with higher thermo-economic performance generally present lower optimum subcooling degrees. For example, with the payback period as a performance indicator, the optimum subcooling degree of the R1233zd(E) HPAAC system is about 11°C and the corresponding payback period is about 3.12 years. In contrast, for R1234yf, the optimum subcooling degree and corresponding payback period are 14°C and 3.80 years, respectively.
The multi-start global optimization method [49] is adopted to find the maximum overall COP, energy saving ratio, net present value, and minimum payback period of R1233zd(E) HPAAC system under optimum working conditions in terms of subcooling degree, which reduces the risk of converging to local optima and ensures efficient calculation [50]. In the optimization process, the problem is solved 1000 times with random initial points, and the lowest value among the 1000 solutions is selected as the best solution. The mathematical expression of the objective functions can be described as
where G(x) represents 1.0/COP, 1.0/ESR, 1.0/NPV, or PBP; x is the subcooling degree at the condenser outlet of HP.
The maximum overall COP, energy saving ratio, net present value, and minimum payback period of R1233zd(E) HPAAC system under optimum working conditions in terms of subcooling degree vs. the evaporation temperature are shown in Figs. 12 and 13. These figures show that, with the increased evaporation temperature, for the case of R1233zd(E) HPAAC system, all the maximum overall COP, energy saving ratio, and net present value increases and the minimum payback period drops as expected under the optimum working conditions. Within the evaporation temperature scope considered, the maximum overall COP, energy saving ratio, and net present value range from 4.99 to 11.27, 25.53 to 64.59, and 1.13 to 4.10 × 10⁷ CNY, respectively, and correspondingly the minimum payback period varies between 5.77 and 2.22 years. These findings also validate the positive effects of evaporation temperature on the performance of the HPAAC system, which is in according with Ebrahimi et al. [18]. In detail, as the evaporation temperature increases from 50°C to 70°C, the improvement of maximum overall COP, energy saving ratio, net present value and minimum payback period is up to about 125.84%, 153.00%, 261.37%, and 61.50%, respectively.
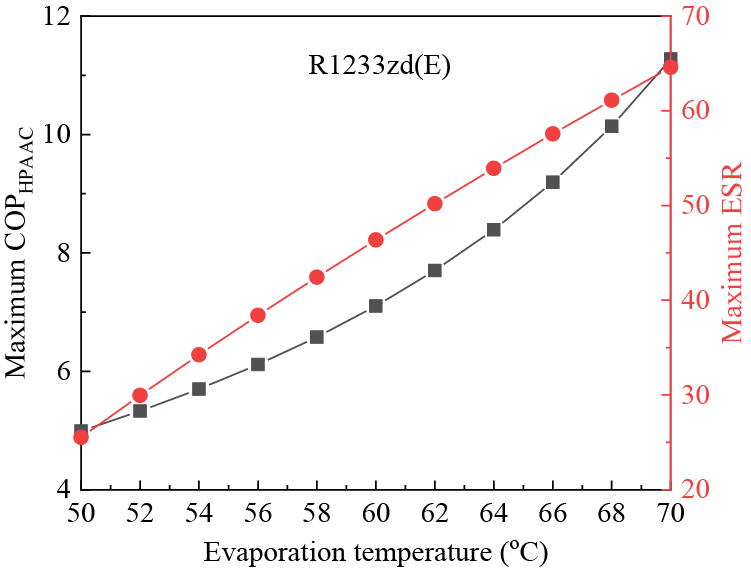
Figure 12: Maximum overall COP and energy saving ratio vs. evaporation temperature
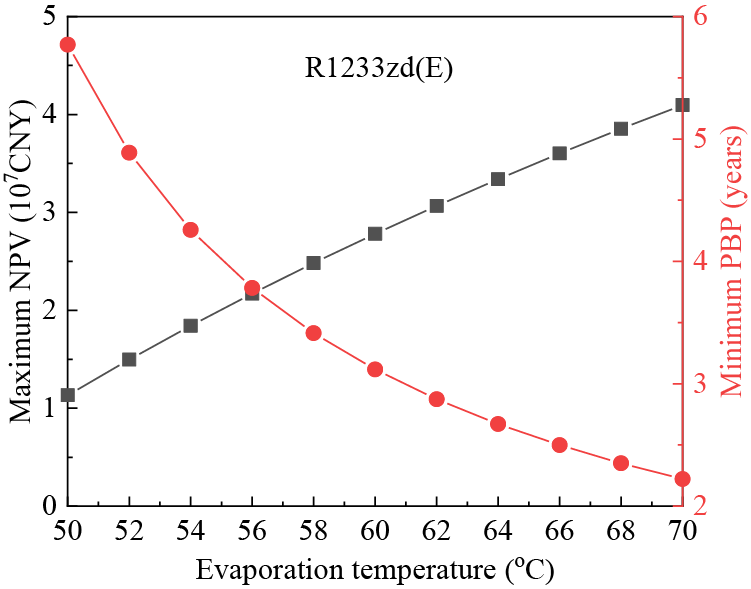
Figure 13: Maximum net present value and minimum payback period vs. evaporation temperature
In this study, the HPAAC system for recovering waste heat in DCs with on-chip two-phase cooling loop driven by compressor is investigated. The potential of HFOs such as R1224yd(Z), R1233zd(E), R1234yf, R1234ze(E), R1234ze(Z), R1243zf and R1336mzz(Z) as server coolant in the HPAAC system is evaluated against R245fa. Additionally, the impacts of various evaporation temperatures and subcooling degrees on the performance of the HPAAC system are also analyzed.
The results show that while an increase in evaporation temperature is beneficial to the thermo-economic performance of the HPAAC system, there is an optimum subcooling degree for the HPAAC system under specific conditions. Generally, under the given working conditions, R1233zd(E) with moderate compressor suction pressure and pressure ratio has the best thermo-economic performance in the HPAAC system, followed by R1234ze(Z), R1336mzz(Z), R1224yd(Z), R1234ze(E) and R1243zf in sequence, and R1234yf performs the worst. Therefore, among the HFOs examined, R1233zd(E) should be recommended as server coolant for the HPAAC system, which is superior to R245fa, particularly under work conditions with relatively lower evaporation temperature as well as subcooling degree. With the optimum subcooling degree, as the evaporation temperature between 50°C and 70°C, the overall COP, energy saving ratio, net present value, and payback period of R1233zd(E) HPAAC system range from 4.99 to 11.27, 25.53 to 64.59, 1.13 to 4.10 × 10⁷ CNY and 5.77 to 2.22 years, respectively.
Furthermore, it is noteworthy that this study primarily focuses on assessing the performance of several HFOs in the HPAAC system, thus the system being analyzed is relatively simple. It is believed that with the addition of an economizer and the reduction of throttling loss, the performance of the HPAAC system will be enhanced. A limitation of this study is that the numerical model used for the HPAAC system has not been validated against experimental data. Thus, some future works should be devoted to conducting experimental studies on the HPAAC system for recovering waste heat in DCs with an on-chip two-phase cooling loop driven by a compressor and refining the numerical model accordingly.
Acknowledgement: Not applicable.
Funding Statement: This work was supported by the Key Science and Technology Project of China Southern Grid Co., Ltd. (No. 090000KK52220020).
Author Contributions: The authors confirm their contribution to the paper as follows: study conception and design: Yuming Zhao, Huashan Li, Jiongcong Chen; data collection: Jing Wang, Bin Sun, Zhenshang Wang; analysis and interpretation of results: Yuming Zhao, Jing Wang, Huashan Li, Jiongcong Chen; draft manuscript preparation: Yuming Zhao, Jing Wang, Bin Sun, Zhenshang Wang, Jiongcong Chen. All authors reviewed the results and approved the final version of the manuscript.
Availability of Data and Materials: The data are available from the corresponding author upon request.
Ethics Approval: Not applicable.
Conflicts of Interest: The authors declare that they have no conflicts of interest to report regarding the present study.
References
1. Güğül GN, Gökçül F, Eicker U. Sustainability analysis of zero energy consumption data centers with free cooling, waste heat reuse and renewable energy systems: a feasibility study. Energy. 2023;262:125495. doi:10.1016/j.energy.2022.125495. [Google Scholar] [CrossRef]
2. Andrae AS, Edler T. On global electricity usage of communication technology: trends to 2030. Challenges. 2015;6(1):117–57. doi:10.3390/challe6010117. [Google Scholar] [CrossRef]
3. Luo Y, Andresen J, Clarke H, Rajendra M, Maroto-Valer M. A decision support system for waste heat recovery and energy efficiency improvement in data centres. Appl Energ. 2019;250:1217–24. doi:10.1016/j.apenergy.2019.05.029. [Google Scholar] [CrossRef]
4. Zhang H, Shao S, Xu H, Zou H, Tian C. Free cooling of data centers: a review. Renew Sust Energy Rev. 2014;35:171–82. doi:10.1016/j.rser.2014.04.017. [Google Scholar] [CrossRef]
5. Ljungdahl V, Jradi M, Veje C. A decision support model for waste heat recovery systems design in data center and high-performance computing clusters utilizing liquid cooling and phase change materials. Appl Therm Eng. 2022;201:117671. doi:10.1016/j.applthermaleng.2021.117671. [Google Scholar] [CrossRef]
6. Yang HZ, Wang ZH, Li MX, Ren FS, Feng Y. A manifold channel liquid cooling system with low-cost and high temperature uniformity for lithium-ion battery pack thermal management. Therm Sci Eng Prog. 2023;41:101857. doi:10.1016/j.tsep.2023.101857. [Google Scholar] [CrossRef]
7. He Z, Ding T, Liu Y, Li Z. Analysis of a district heating system using waste heat in a distributed cooling data center. Appl Therm Eng. 2018;141(10):1131–40. doi:10.1016/j.applthermaleng.2018.06.036. [Google Scholar] [CrossRef]
8. Wahlroos M, Pärssinen M, Manner J, Syri S. Utilizing data center waste heat in district heating–impacts on energy efficiency and prospects for low-temperature district heating networks. Energy. 2017;140(5):1228–38. doi:10.1016/j.energy.2017.08.078. [Google Scholar] [CrossRef]
9. Marshall ZM, Duquette J. A techno-economic evaluation of low global warming potential heat pump assisted organic Rankine cycle systems for data center waste heat recovery. Energy. 2022;242(1):122528. doi:10.1016/j.energy.2021.122528. [Google Scholar] [CrossRef]
10. Araya S, Wemhoff AP, Jones GF, Fleischer AS. Study of a lab-scale organic rankine cycle for the ultra-low-temperature waste heat recovery associated with data centers. J Electron Packaging. 2021;143(2):021001. doi:10.1115/1.4047843. [Google Scholar] [CrossRef]
11. Ebrahimi K, Jones GF, Fleischer AS. The viability of ultra low temperature waste heat recovery using organic Rankine cycle in dual loop data center applications. Appl Therm Eng. 2017;126(1):393–406. doi:10.1016/j.applthermaleng.2017.07.001. [Google Scholar] [CrossRef]
12. Haywood A, Sherbeck J, Phelan P, Varsamopoulos G, Gupta SK. Thermodynamic feasibility of harvesting data center waste heat to drive an absorption chiller. Energ Convers Manage. 2012;58:26–34. doi:10.1016/j.enconman.2011.12.017. [Google Scholar] [CrossRef]
13. Lin X, Zuo L, Yin L, Su W, Ou S. An idea to efficiently recover the waste heat of Data Centers by constructing an integrated system with carbon dioxide heat pump, mechanical subcooling cycle and lithium bromide-water absorption refrigeration cycle. Energ Convers Manage. 2022;256(3):115398. doi:10.1016/j.enconman.2022.115398. [Google Scholar] [CrossRef]
14. Chen X, Pan M, Li X, Zhang K. Multi-mode operation and thermo-economic analyses of combined cooling and power systems for recovering waste heat from data centers. Energ Convers Manage. 2022;266(1):115820. doi:10.1016/j.enconman.2022.115820. [Google Scholar] [CrossRef]
15. Ebrahimi K, Jones GF, Fleischer AS. A review of data center cooling technology, operating conditions and the corresponding low-grade waste heat recovery opportunities. Renew Sust Energy Rev. 2014;31(3):622–38. doi:10.1016/j.rser.2013.12.007. [Google Scholar] [CrossRef]
16. Xu M, Li S, Jin Z, Jiang W, Du K. The influence of NH3-H2O-LiBr ternary working fluid on the performance and solution circulation in ammonia absorption refrigeration system. Appl Therm Eng. 2023;234:121297. doi:10.1016/j.applthermaleng.2023.121297. [Google Scholar] [CrossRef]
17. Jain V, Singhal A, Sachdeva G, Kachhwaha SS. Advanced exergy analysis and risk estimation of novel NH3-H2O and H2O-LiBr integrated vapor absorption refrigeration system. Energ Convers Manage. 2020;224:113348. doi:10.1016/j.enconman.2020.113348. [Google Scholar] [CrossRef]
18. Ebrahimi K, Jones GF, Fleischer AS. Thermo-economic analysis of steady state waste heat recovery in data centers using absorption refrigeration. Appl Energ. 2015;139:384–97. doi:10.1016/j.apenergy.2014.10.067. [Google Scholar] [CrossRef]
19. Khalid R, Schon SG, Ortega A, Wemhoff AP. Waste heat recovery using coupled 2-phase cooling & heat-pump driven absorption refrigeration. In: 2019 18th IEEE Intersociety Conference on Thermal and Thermomechanical Phenomena in Electronic Systems (ITherm), 2019; Las Vegas, NV, USA; pp. 684–92. doi:10.1109/ITHERM.2019.8757465. [Google Scholar] [CrossRef]
20. Nair V. HFO refrigerants: a review of present status and future prospects. Int J Refrig. 2021;122:156–70. doi:10.1016/j.ijrefrig.2020.10.039. [Google Scholar] [CrossRef]
21. Lemmon EW, Bell IH, Huber ML. NIST standard reference database 23: reference fluid thermodynamic and transport properties REFPROP, version 10.0, National Institute of Standards and Technology. 2018. doi:10.18434/T4/1502528. [Google Scholar] [CrossRef]
22. Zhang X, Li Y. Recommended operating conditions and performance evaluation of commonly used hydrofluoroolefin (HFO) and hydrochlorofluoroolefin (HCFO) refrigerants in organic Rankine cycle. Energy. 2024;299:131488. doi:10.1016/j.energy.2024.131488. [Google Scholar] [CrossRef]
23. Marcinichen JB, Olivier JA, de Oliveira V, Thome JR. A review of on-chip micro-evaporation: experimental evaluation of liquid pumping and vapor compression driven cooling systems and control. Appl Energ. 2012;92:147–61. doi:10.1016/j.apenergy.2011.10.030. [Google Scholar] [CrossRef]
24. Bellos E, Tzivanidis C, Antonopoulos KA. Exergetic, energetic and financial evaluation of a solar driven absorption cooling system with various collector types. Appl Therm Eng. 2016;102:749–59. doi:10.1016/j.applthermaleng.2016.04.032. [Google Scholar] [CrossRef]
25. Wu W, Zhang H, You T, Li X. Thermodynamic investigation and comparison of absorption cycles using hydrofluoroolefins and ionic liquid. Ind Eng Chem Res. 2017;56(35):9906–16. doi:10.1021/acs.iecr.7b02343. [Google Scholar] [CrossRef]
26. Ren J, Qian Z, Yao Z, Gan N, Zhang Y. Thermodynamic evaluation of LiCl-H2O and LiBr-H2O absorption refrigeration systems based on a novel model and algorithm. Energies. 2019;12(15):3037. doi:10.3390/en12153037. [Google Scholar] [CrossRef]
27. Wu W, You T, Zhang H, Li X. Comparisons of different ionic liquids combined with trans-1,3,3,3-tetrafluoropropene (R1234ze(E)) as absorption working fluids. Int J Refrig. 2018;88:45–57. doi:10.1016/j.ijrefrig.2017.12.011. [Google Scholar] [CrossRef]
28. Zhao XS, Huang SH, Xie N, Wang LB, Li HS. Simultaneous optimization of working fluid and temperature matching for heat pump assisted geothermal cascade heating system. Case Stud Therm Eng. 2023;41:102685. doi:10.1016/j.csite.2022.102685. [Google Scholar] [CrossRef]
29. Kavian S, Aghanajafi C, Mosleh HJ, Nazari A, Nazari A. Exergy, economic and environmental evaluation of an optimized hybrid photovoltaic-geothermal heat pump system. Appl Energ. 2020;276:115469. doi:10.1016/j.apenergy.2020.115469. [Google Scholar] [CrossRef]
30. Li HS, Huang SH, Wang XL, Zhao Y, Bu XB, Wang LB. Analysis of H2O/EMISE absorption chiller driven by stationary solar collectors in hot-humid climate. Therm Sci Eng Prog. 2022;27:101155. doi:10.1016/j.tsep.2021.101155. [Google Scholar] [CrossRef]
31. Zhou J, Kanbur BB, Van Le D, Tan R, Duan F. Multi-criteria assessments of increasing supply air temperature in tropical data center. Energy. 2023;271:127043. doi:10.1016/j.energy.2023.127043. [Google Scholar] [CrossRef]
32. Gupta R, Puri IK. Waste heat recovery in a data center with an adsorption chiller: technical and economic analysis. Energ Convers Manage. 2021;245:114576. doi:10.1016/j.enconman.2021.114576. [Google Scholar] [CrossRef]
33. Patek J, Klomfar J. A computationally effective formulation of the thermodynamic properties of LiBr-H2O from 273 to 500 K over full composition range. Int J Refrig. 2006;29:566–78. doi:10.1016/j.ijrefrig.2005.10.007. [Google Scholar] [CrossRef]
34. Cai HT, Ye ZH, Liu GK, Romagnoli A, Ji DX. Sizing optimization of thermoelectric generator for low-grade thermal energy utilization: module level and system level. Appl Therm Eng. 2023;221:119823. doi:10.1016/j.applthermaleng.2022.119823. [Google Scholar] [CrossRef]
35. Patel B, Desai NB, Kachhwaha SS. Optimization of waste heat based organic Rankine cycle powered cascaded vapor compression-absorption refrigeration system. Energ Convers Manage. 2017;154:576–90. doi:10.1016/j.enconman.2017.11.045. [Google Scholar] [CrossRef]
36. Amiri L, Madadian E, Bahrani N, Ghoreishi-Madiseh SA. Techno-economic analysis of waste heat utilization in data centers: application of absorption chiller systems. Energies. 2021;14(9):2433. doi:10.3390/en14092433. [Google Scholar] [CrossRef]
37. Pan QW, Peng JJ, Wang RZ. Experimental study of an adsorption chiller for extra low temperature waste heat utilization. Appl Therm Eng. 2019;163:114341. doi:10.1016/j.applthermaleng.2019.114341. [Google Scholar] [CrossRef]
38. Huang SH, Zhao XS, Wang LB, Bu XB, Li HS. Low-cost optimization of geothermal heating system with thermal energy storage for an office building. Therm Sci Eng Prog. 2023;42(1):101918. doi:10.1016/j.tsep.2023.101918. [Google Scholar] [CrossRef]
39. Liu H, Xiang C, Ge S, Zhang P, Zheng N, Li J. Synergy planning for integrated energy stations and pipe networks based on station network interactions. Int J Ele Pow Energ Syst. 2021;125(6):106523. doi:10.1016/j.ijepes.2020.106523. [Google Scholar] [CrossRef]
40. Yuan J, Cui C, Xiao Z, Zhang C, Gang W. Performance analysis of thermal energy storage in distributed energy system under different load profiles. Energ Convers Manage. 2020;208(7):112596. doi:10.1016/j.enconman.2020.112596. [Google Scholar] [CrossRef]
41. Dai B, Qi H, Liu S, Zhong Z, Li H, Song M, et al. Environmental and economical analyses of transcritical CO2 heat pump combined with direct dedicated mechanical subcooling (DMS) for space heating in China. Energ Convers Manage. 2019;198(3):111317. doi:10.1016/j.enconman.2019.01.119. [Google Scholar] [CrossRef]
42. Yue H, Xu Z, Chu S, Cheng C, Zhang H, Chen H, et al. Study on the performance of photovoltaic/thermal collector-heat pump-absorption chiller tri-generation supply system. Energies. 2023;16(7):3034. doi:10.3390/en16073034. [Google Scholar] [CrossRef]
43. Lyu W, Wang Z, Li X, Xin X, Chen S, Yang Y, et al. Energy efficiency and economic analysis of utilizing magnetic bearing chillers for the cooling of data centers. J Build Eng. 2022;48:103920. doi:10.1016/j.jobe.2021.103920. [Google Scholar] [CrossRef]
44. Frate GF, Ferrari L, Desideri U. Analysis of suitability ranges of high temperature heat pump working fluids. Appl Therm Eng. 2019;150:628–40. doi:10.1016/j.applthermaleng.2019.01.034. [Google Scholar] [CrossRef]
45. Quoilin S, Van Den Broek M, Declaye S, Dewallef P, Lemort V. Techno-economic survey of Organic Rankine Cycle (ORC) systems. Renew Sust Energy Rev. 2013;22:168–86. doi:10.1016/j.rser.2013.01.028. [Google Scholar] [CrossRef]
46. Bamigbetan O, Eikevik TM, Nekså P, Bantle M, Schlemminger C. Theoretical analysis of suitable fluids for high temperature heat pumps up to 125°C heat delivery. Int J Refrig. 2018;92:185–95. doi:10.1016/j.ijrefrig.2018.05.017. [Google Scholar] [CrossRef]
47. Bamigbetan O, Eikevik TM, Nekså P, Bantle M. Review of vapour compression heat pumps for high temperature heating using natural working fluids. Int J Refrig. 2017;80:197–211. doi:10.1016/j.ijrefrig.2017.04.021. [Google Scholar] [CrossRef]
48. Redón A, Navarro-Peris E, Pitarch M, Gonzálvez-Macia J, Corberán JM. Analysis and optimization of subcritical two-stage vapor injection heat pump systems. Appl Energ. 2014;124(8):231–40.doi:10.1016/j.apenergy.2014.02.066. [Google Scholar] [CrossRef]
49. Walden JV, Bähr M, Glade A, Gollasch J, Tran AP, Lorenz T. Nonlinear operational optimization of an industrial power-to-heat system with a high temperature heat pump, a thermal energy storage and wind energy. Appl Energ. 2023;344(5):121247. doi:10.1016/j.apenergy.2023.121247. [Google Scholar] [CrossRef]
50. Yang S, Gao HO, You F. Integrated optimization in operations control and systems design for carbon emission reduction in building electrification with distributed energy resources. Adv Appl Energ. 2023;12(1):100144. doi:10.1016/j.adapen.2023.100144. [Google Scholar] [CrossRef]
Cite This Article
 Copyright © 2024 The Author(s). Published by Tech Science Press.
This work is licensed under a Creative Commons Attribution 4.0 International License , which permits unrestricted use, distribution, and reproduction in any medium, provided the original work is properly cited.
 Downloads
 Citation Tools