
 Submit a Paper
 Propose a Special lssue
 Open Access
ARTICLE

Investigating Transport Properties of Environmentally Friendly Azeotropic Binary Blends Based on Evaporation in Auto-Cascade Refrigeration
Institute of Refrigeration and Cryogenics Engineering, School of Energy and Power Engineering, University of Shanghai for Science and Technology, Shanghai, 200093, China
* Corresponding Author: Hua Zhang. Email:
(This article belongs to the Special Issue: Innovative Heat Transfer Fluids for Enhanced Energy Sustainability in Thermal Systems)
Frontiers in Heat and Mass Transfer 2024, 22(4), 1087-1105. https://doi.org/10.32604/fhmt.2024.053851
Received 11 May 2024; Accepted 09 July 2024; Issue published 30 August 2024
 View Full Text
 Download PDF
Abstract
The exploration of performance and prediction of environmentally friendly refrigerant physical properties represents a critical endeavor. Equilibrium molecular dynamics simulations were employed to investigate the density and transport properties of propane and ethane at ultra-low temperatures under evaporative pressure conditions. The results of the density simulation of the evaporation conditions of the blends proved the validity of the simulation method. Under identical temperature and pressure conditions, increasing the proportion of R170 in the refrigerant blends leads to a density decrease while the temperature range in which the gas-liquid phase transition occurs is lower. The analysis of simulated results pertaining to viscosity, thermal conductivity, and self-diffusion coefficient reveals heightened deviation levels within the phase transition temperature zone. This increase in deviation attributed to intensified molecular activity. In terms of uncovering the physical mechanism of gas-liquid phase transition, the work illustrates the macroscopic phenomenon of the intensified existing disorder during phase transitions at the molecular level. Molecular dynamics simulations analyzing the thermophysical properties of refrigerant blends from a microscopic point of view can deepen the comprehension of the thermal optimization of refrigeration processes.Keywords
Nomenclature
| AiNIST | NIST data values |
| Aisim | MD simulated values |
| D | Self-diffusion coefficient (m2/s) |
| E | Potential energy function (J) |
| e | Energy (J) |
| f | Interatomic forces (J) |
| J | Heat flow (W) |
| kB | Boltzmann constant (1.38e−23 J/K) |
| l | Bond distance (Å) |
| M | Molar mass (kg/mol) |
| m | Mass (kg) |
| N | Atomic number |
| NA | Avogadro constant (6.022e23 mol–1) |
| n | Periodicity |
| Pαβ | Non-diagonal component of the pressure tensor (bar) |
| q | Electric charge (C) |
| r | Interatomic spacing (Å) |
| T | Absolute temperature (K) |
| V | Volume (Å3) |
| Greek Letters | |
| θ | Bond angle (rad) |
| ω | Dihedral angle (rad) |
| ε | Potential energy well depth (J) |
| ε0 | Permittivity of free space (C2/(N·m2)) |
| υ | Velocity (m/s) |
| ϕ | Interatomic potential energy |
| ρ | Density (g/m3) |
| σ | Interatomic separation at the LJ potential minimum (Å) |
| Subscripts | |
| i,j | Position of the corresponding atom (Å) |
| 0 | State of equilibrium |
| α,β | Component along |
As commonly recognised, thorough investigation into the thermophysical properties of refrigerants is essential within the realms heating, air conditioning and refrigeration [1]. Diverging from the conventional focus on the equilibrium state, a growing body of researchers is now directing attention towards the transport properties of refrigerants in non-equilibrium states [2]. High-precision transport property data offer vast potential applications, ranging from accurately determining fundamental physical constants or quantities to developing comprehensive viscosity data systems and establishing new criteria for pressure and temperature. In the realm of refrigeration systems design, the transport properties of refrigerants are pivotal parameters for analyzing flow and heat transfer characteristics. However, despite their significance, traditional experiments are hindered by constraints in temperature and pressure ranges, testing durations, and the number of samples. Consequently, there exists a relative scarcity of thermophysical experimental data, leading to a reliance on empirical correlations for parameterizing theoretical models, thereby limiting their applicability. Further thorough investigation for precise calculation remains desirable. In recent years, alongside experimental studies and theoretical derivations, the development of computer technology has facilitated the emergence of molecular dynamics (MD) simulation as an increasingly effective method for exploring the thermophysical properties of fluids [3].
Researchers in the field have employed MD theory to investigate the equilibrium and transport properties of pure refrigerants from a microscopic point of view. Fouad et al. [4] have simulated the densities, viscosities, and self-diffusion coefficients of hydrofluorocarbon (HFC), hydrofluoroolefin (HFO), and Hydrochlorofluoroolefin (HCFO) refrigerants at 203~403 K with MD methods. Findings showed that all the refrigerants adhered to the Stokes-Einstein behavior and that the transport properties are very much related to the size of the refrigerants and the intermolecular interactions. Khan et al. [5] investigated the homogeneous condensation and thermophysical properties of R450A, R513A and R515A, and analyzed the condensation phenomena and diffusive motions at variable temperatures under high-pressure condensation conditions. The results showed favourable condensation rates and thermophysical properties for these new azeotropic and near azeotropic refrigerants, with the MD and REFPROP data in general agreement. Subsequent research included MD simulations of the thermophysical properties of the refrigerant R1336mzz(Z) as a replacement for R245fa. These researches showed that those two refrigerants have almost the same density and isobaric heat capacity values, which demonstrated an improvement in the heat transfer rate of the third-generation refrigerant during the phase change process [6]. Liu et al. [7] investigated the evaporation and condensation processes of three HFO refrigerants at eight temperature states using MD simulation. The obtained densities and isobaric heat capacities were compared with the experimental data to validate the reliability of the simulation method. Researchers are focusing on blended refrigerants with adjustable physical properties, combining the advantages of a sole refrigerant with other substances. The purpose of refrigerant mixing is to substantially improve the performance in the vapor evaporation cycle and meet diverse requirements for replacing traditional refrigerants [8–10]. Cai et al. [11] investigated the heat transfer and mass transfer properties of R1234ze(E)/R32 at the gas-liquid interface and discussed the surface tension as well as condensation coefficients for molar fractions of different components. The effect of temperature change on the thickness of the interface during condensation was analyzed in terms of the role of intermolecular forces. Deng et al. [12] calculated the thermophysical properties of the zeotropic refrigerant R32/R1234ze(E) for evaporation conditions by using MD simulations, which can be helpful in understanding the evaporative heat transfer performance at variable proportions of the experimental case through the explanation of intermolecular forces. Related researchers have studied the thermophysical properties of refrigerants at the microscopic level and demonstrated the feasibility of using computer simulation methods to explore the foundational physical properties [13–15]. However, although HFCs are widely used as refrigerants in refrigerators and air conditioners and do not damage the ozone layer, they are called ‘super greenhouse gases’. Promoting the development of low-GWP refrigerants and their iteration of conventional refrigerants will have a significant impact on the achievement of the dual-carbon target [16,17]. Moreover, HFOs are expensive to produce and some HFO molecules may decompose at high temperatures, which may affect the safety and reliability of refrigeration systems due to their poor stability [18].
Hydrocarbon (HC) refrigerants are natural substances with very low Ozone Depletion Potential (ODP) and Global Warming Potential (GWP) and have excellent circulation and thermodynamic properties. Practitioners in the field of refrigeration have started to investigate the possibility of HC refrigerants and their blends as alternative refrigerants [19–22]. The hydrocarbon R290 offers the advantages of cost-effectiveness, widespread availability, and compatibility with commonly used lubricants [23]. Padalkar et al. [24] investigated the charge amount of R290 used in split air conditioner refrigeration systems. Compared to the HCFC-R22, the R290 system demonstrated improved cooling capacity and energy efficiency ratio (EER). Mastrullo et al. [25] investigated the parametric study on the replacement of R404a with R290 in light commercial refrigeration equipment. The results showed that, when the charge remained within the allowable range of current standards, this hydrocarbon refrigerant reduced energy consumption by 34%. Ozsipahi et al. [26] explored the effect of refrigerant blends R290/R600a on the performance of small domestic variable speed hermetic compressors with the mass fraction of R290 varied between in the range of 40% and 70%. The results show that increasing the R290 content increases the refrigerant mass flow rate and coefficient of performance (COP), and the refrigerant blends can increase the COP by 10%~20% relative to the baseline R600a under specific conditions. Liu et al. [27] designed a −80°C cascade refrigeration freezer using the R290/R170 for COVID-19 vaccine storage, and experimentally evaluated the rate of drop up and temperature fluctuations, while the operating power consumption of the system was analyzed. The research illustrates the trend of developing the application of R290/R170 in small-scale low-temperature systems. Extensive macro-thermodynamic studies have already been conducted to facilitate their implementation.
As highlighted earlier, R290 and its blends have emerged as excellent choices for small-scale commercial refrigeration, meeting the environmental requirements set forth by the Kigali Amendment while delivering optimal performance. Specifically, for small cryogenic refrigeration systems employing cascade and auto-cascade cycles, R290/R170 exhibits a broad spectrum of applications [27–29]. Therefore, this study employs molecular dynamics (MD) simulations to delve into the transport properties of R290/R170 under evaporative conditions relevant to cryogenics systems. The reliability of the established model was verified by comparing it against the NIST database. The study scrutinizes the variations in variation patterns of self-diffusion coefficient, viscosity and thermal conductivity of R290/R170 concerning temperature and pressure under evaporative conditions with varying mixing ratios. The research lays a sturdy groundwork for exploring the transport properties of HCs and their blends using a comparable force field model.
For refrigeration systems, the potential energy function mainly consists of the intramolecular interaction potential and the intermolecular interaction potential. The intramolecular interaction potentials include bond, angular energy and dihedral angle energies, etc. The intermolecular interaction potentials include van der Waals’ and Coulomb’s forces, etc. The functional form of the potential energy used in this study is shown in Eq. (1).
The first three of these are intramolecular interaction potentials, encompassing the stretching bond potential, the bond angle bending potential and the dihedral angle torsion potential. The last two are intermolecular interaction potentials, which are van der Waals potential and electrostatic interaction potential, respectively.
Molecular models for R290 and R170 were constructed using the modelling module of Materials Studio, with their molecular structures depicted in Fig. 1a for C3H8 and Fig. 1b for C2H6. Given our primary emphasis on macroscopic thermodynamic properties, simulations were conducted under periodic boundary conditions, and for the first time, simulation boxes that meet the requirements were established. The R290/R170 mixing ratio, defined as ‘MR’, for many mass fractions were in consideration. The range of working conditions is in the temperature range of 200 K to 240 K and under the pressure of 1.5 bar. It corresponds to the low-pressure working conditions in the evaporator.
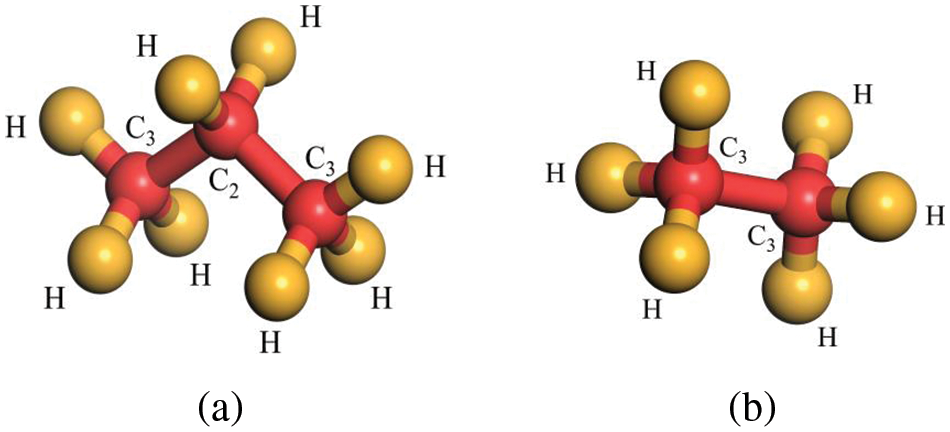
Figure 1: Schematic diagram of R290/R170 molecular model. (a) C3H8, (b) C2H6
The cubic simulation box corresponding to the different conditions was constructed using the Amorphous Cell in the Materials Studio. The initial density of the simulation box was set to 0.6 g/cm3 for high-density conditions (>0.3 g/cm3) and 0.06 g/cm3 for low-density conditions (<0.1 g/cm3), which correspond to states of liquids and gases to save relaxation time and avoid reporting errors. In each simulation box, there were a total of 1000 molecules. Specifically, there were 728 molecules of R290 and 272 molecules of R170 at a mixing ratio of 8:2, which simulation box is set to 48.1 Å × 48.1 Å × 48.1 Å and 103.7 Å × 103.7 Å × 103.7 Å for high and low-density conditions separately. There were 503 R290 molecules and 497 R170 molecules at a ratio of 6:4, which box is set to 47.4 Å × 47.4 Å × 47.4 Å and 102.2 Å × 102.2 Å × 102.2 Å for high and low-density conditions separately. There were 313 R290 molecules and 687 R170 molecules ratio of 4:6, which box is set to 45.7 Å × 45.7 Å × 45.7 Å and 98.4 Å × 98.4 Å × 98.4 Å for high and low-density conditions separately. The x, y and z directions of the simulation box are set as periodic boundary conditions during the relaxation process.
The Newton’s equations during the simulation were calculated using the velocity-verlet algorithm [2]. The cut-off distance of the LJ potential to 15 Å to balance efficiency and accuracy, ensuring it satisfies conditions greater than 3.5 σ, along with the nearest image method. The cut-off distance of the long-range electrostatic interaction potential is set to 15 Å. The molecular dynamics simulation software used was the Large-scale Atomic/Molecular Massively Parallel Simulator (LAMMPS). Initially, energy minimization for each simulated system is performed using the conjugate gradient method. After the energy minimization process was completed, the simulation continued with the subsequent relaxation and output phases. After the corresponding simulation systems have reached a local minimum in energy, relaxation of the simulation systems is carried out. Achieving equilibrium under constant temperature and pressure conditions is essential, as it facilitates subsequent simulations during the production phase. To attain equilibrium for the R290/R170 simulation system under constant temperature and pressure conditions, the isothermal-isobaric (NPT) ensemble is applied. Temperature and pressure control are achieved by utilizing the Nose-Hoover extended equations.
In this section, the simulation results of the thermophysical properties of the mixture are discussed and analyzed. Density serves as a preliminary validation of the model and the reasonableness of the force field was evaluated under diverse conditions. The transport coefficients, including the viscosity, thermal conductivity, and self-diffusion coefficient, were investigated through molecular dynamics simulation. The process diagram of simulation and analysis is illustrated in Fig. 2, as depicted above.
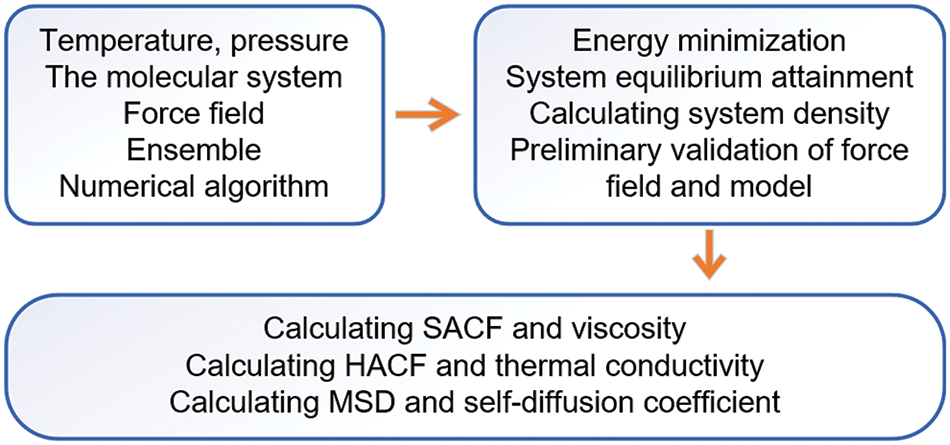
Figure 2: Simulation and analysis workflow diagram
As the measurement of the compactness of the stacking of substances, the density in molecular dynamics simulation reflects the sparseness of the molecular distribution in the system under the corresponding working conditions. Due to its close correlation with intermolecular forces, the accuracy of simulated density values also reflects the rationality of the selected force field and model. During the relaxation process, the density of the system is calculated using Eq. (2) as a criterion to assess the attainment of an equilibrium state for binary mixtures. This step also functions as an initial verification of the model construction and the selected potential functions.
Fig. 3 illustrates the density-relaxation time variation for R290/R170 blends under evaporation pressure conditions. In each relaxation process, the segment of the curve stabilizing with a running density exceeding 0.5 g/cm3 represents the R290/R170 blends under high-density liquid conditions with an equilibrium duration of approximately 100 to 150 ps. Conversely, the segment stabilizing with an average density below 0.05 g/cm3 depicts these mixtures under low-density gas condi-tions, with an equilibrium duration of around 200 to 300 ps. Furthermore, Fig. 3e indicates significant fluctuation in running density for this condition, reaching a relatively stable state at about 500 ps. This fluctuation arises primarily due to the coexistence of gas and liquid phases in the mixture, with the phase transition process inducing substantial periodic fluctuations, thereby causing pronounced density variations.
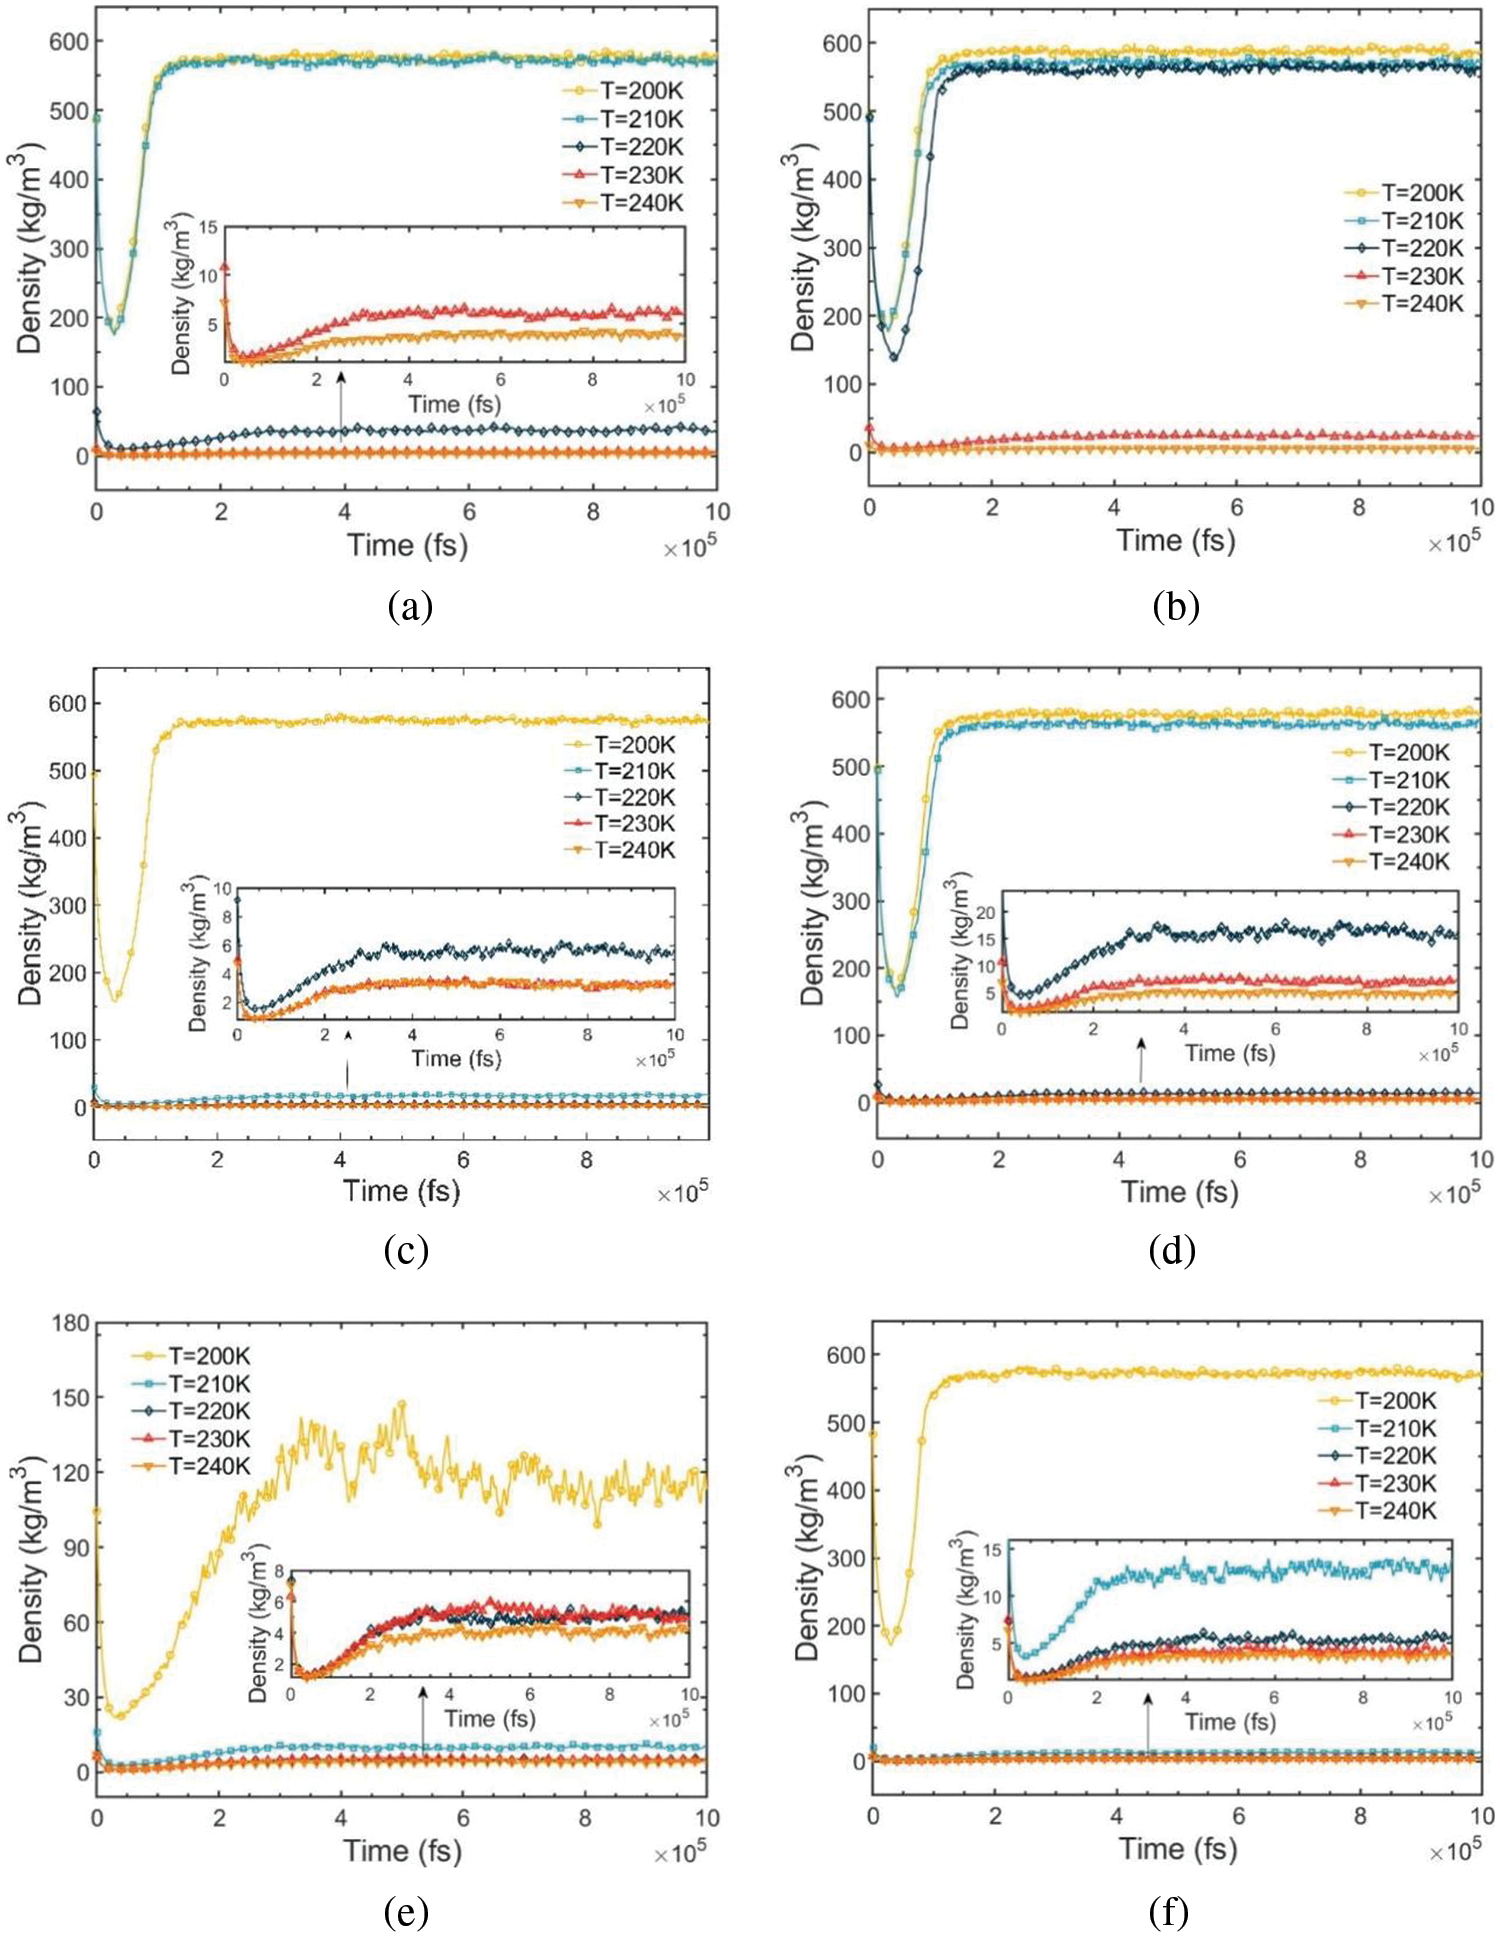
Figure 3: Density-relaxation time variations of R290/R170 blends with different ratios. (a) MR = 8:2, P = 1.5 bar. (b) MR = 8:2, P = 2.0 bar. (c) MR = 6:4, P = 1.5 bar. (d) MR = 6:4, P = 2.0 bar. (e) MR = 4:6, P = 1.5 bar. (f) MR = 4:6, P = 2.0 bar
During the relaxation process, equilibrium is reached for all R290/R170 blends after approximately 500 ps. The stable section of the relaxation process provides the adopted values for the running density. Fig. 4 illustrates the density variation of the R290/R170 blends under low-pressure conditions. Under the same pressure conditions, the density values of R290/R170 blends with different mass ratios decrease as the temperature rises in the same phase, aligning with the expected trend based on factual behavior. For instance, under the pressure of 1.5 bar, the R290/R170 blends with a mass ratio of 8:2 exhibit a significantly high density below 210 K, indicating a liquid phase. Under the identical temperature condition, the vaporisation temperature of the same ratio of mixed working mass is lower under 1.5 bar, which means that the evaporation temperature is lower. Under this pressure, as the temperature surpasses 220 K, the density is in the order of magnitude of units when expressed in units of kg/m3. Throughout this range, the blend is in the gaseous phase. Along with the temperature rises, the blend undergoes a phase transition zone at this pressure. Under the same conditions, as the ratio of R170 increases, the density of the mixed refrigerant decreases, and the temperature at which the gas-liquid phase transition occurs is lowered. Increasing the ratio of low-boiling-point refrigerants appropriately can reduce the evaporation temperature of the refrigeration cycle. Compared to the mentioned mass ratio of refrigerant, increasing the proportion of R170 in the refrigerant blend leads to a decrease in vaporization temperature. Essentially, a higher proportion of low boiling temperature components enhances the likelihood of vaporization for the mixture. Under the pressure of 2.0 bar, the saturation temperature increases correspondingly due to the higher pressure. Fig. 4b demonstrates that the temperature for the phase transition region of the blend shifts towards higher temperatures. As observed in Fig. 3, the density values of the R290/R170 blends for each mass ratio in the same phase state decrease with increasing temperature under identical pressure conditions, aligning with the factual situation.
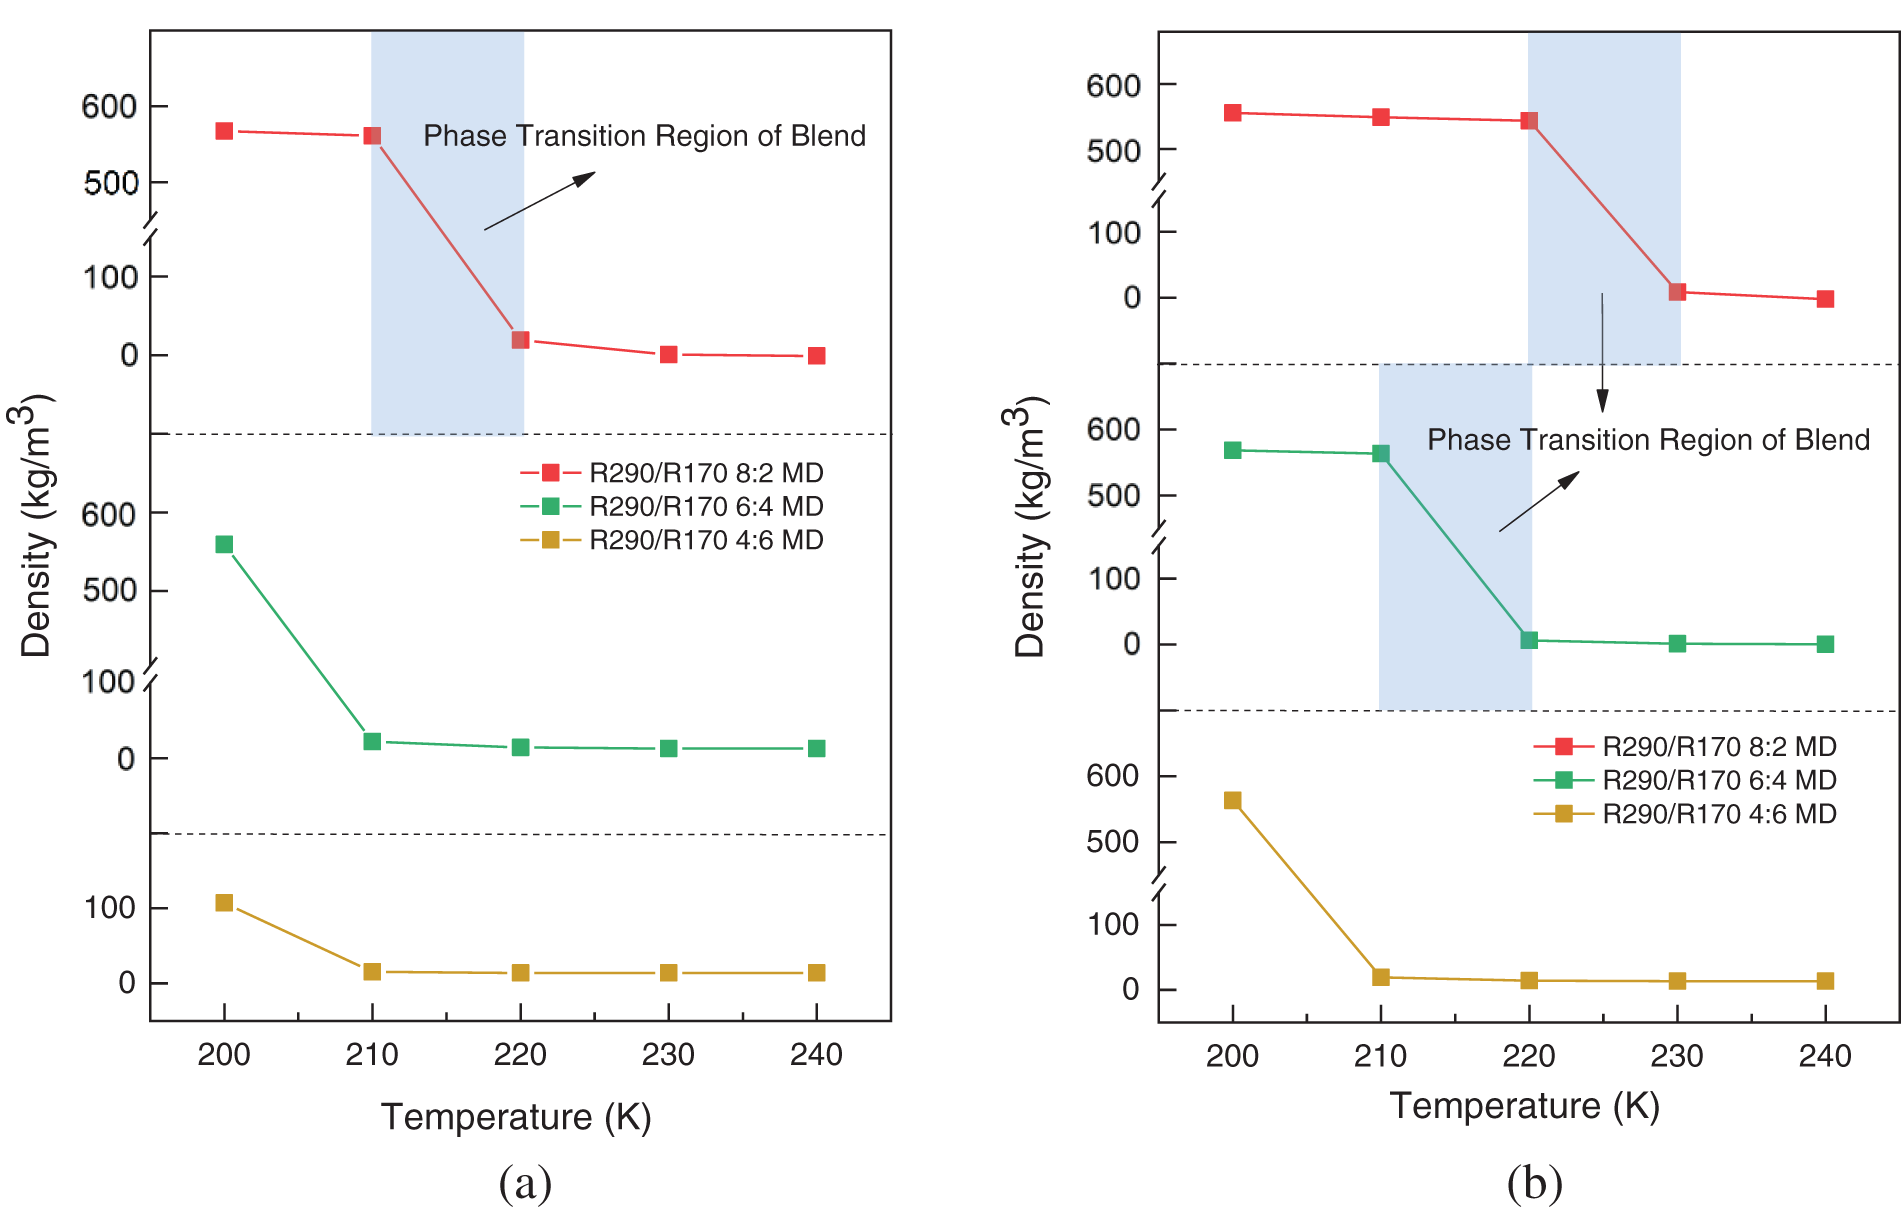
Figure 4: Simulated density variations of R290/R170 blends with different ratios. (a) P = 1.5 bar. (b) P = 2.0 bar
The National Institute of Standards and Technology (NIST) provides a selection of high-quality databases, all of which are based on reasonable scientific judgments [30]. The simulation results were compared with the data values from NIST and an error analysis was conducted using Eqs. (3) and (4). To compare the MD simulation results with the NIST data values more intuitively, the absolute relative deviation (ARD) as well as the average absolute relative deviation (AARD) were calculated:
where,
The results of this analysis are summarized in Table 1. Under the pressure of 1.5 bar, the mass ratio of 6:4 achieves the minimum ARD at 200 K, with a value of 0.78%. The ARD reaches its maximum at 240 K, standing at 6.75%. Correspondingly, the AARD for mass ratios of 8:2, 6:4, and 4:6 are 4.06%, 4.75%, and 5.54%, respectively. Under the pressure of 2.0 bar, the mass ratio of 6:4 attains the minimum ARD at 210 K, with a value of 0.29%. However, the ARD reaches its maximum at 240 K, with 6.75%. Generally, the mass ratio of 6:4 typically exhibits lower ARD in lower temperature ranges, indicating closer simulation results to actual values. Similarly, under the pressure of 2.0 bar, the density errors remain small, suggesting a reduced likelihood of evaporation conditions. The density errors from the simulation exhibit a general increase with rising temperature. Particularly noteworthy is the trend observed in Fig. 4a, where at equivalent temperature conditions, density simulation errors tend to have smaller magnitudes under the pressure of 1.5 bar. A mass ratio of 8:2 typically yields lower AARD values, indicating relatively stable simulation results. Moreover, as a mass fraction of R290 increases within the blends, the simulation errors gradually decrease.

The microcanonical ensemble (NVE) was set for viscosity simulation. The Green-Kubo method is used to calculate the viscosity of the system [31], based on the fluctuation-dissipation theorem and linear response theory, and its functional form is as follows:
where,
For each working condition, we configured the sample interval to 10 fs and the correlation length to 1000 fs. The dump interval was set to 100,000 time steps, measured in ‘fs’, and the output time is 1 ns for running independently 10 times. Subsequently, the SACF and viscosity values are summarized and averaged for each run to derive the viscosity values. Furthermore, both the pressure autocorrelation function and the running viscosity were normalized. The viscosity values for the R290/R170 blends under different conditions were calculated and summarized. These values were then compared and analyzed alongside NIST data, as illustrated in Fig. 5. At the temperature of 200 K, the viscosity value is notably high, particularly with a higher mass fraction of R290. For instance, at this temperature, the viscosity is approximately 200 μPa·s when the mass ratio of R290/R170 is 4:6 under evaporative pressure. As the data depicted in the figure, viscosity change diminishes with increasing temperature. This trend aligns with the behavior observed in the database values. When the liquid is vaporised into gas, the molecules are completely split and free to move, and the viscosity is significantly reduced. As the temperature rises to 240 K, the value of viscosity decreases by a magnitude compared to the value at 200 K. At the same ratio, the viscosity of blends at 2.0 bar decreases more slowly with increasing temperature compared to blends at 1.5 bar. The slower decrease in viscosity at higher pressure suggests that molecular clusters are more compact and intermolecular interaction forces are stronger, resulting in higher viscosity values. Under high-pressure conditions, molecular spacing decreases and the frequency of intermolecular collisions increases, leading to increased viscosity. Additional energy is required to facilitate molecular movement.
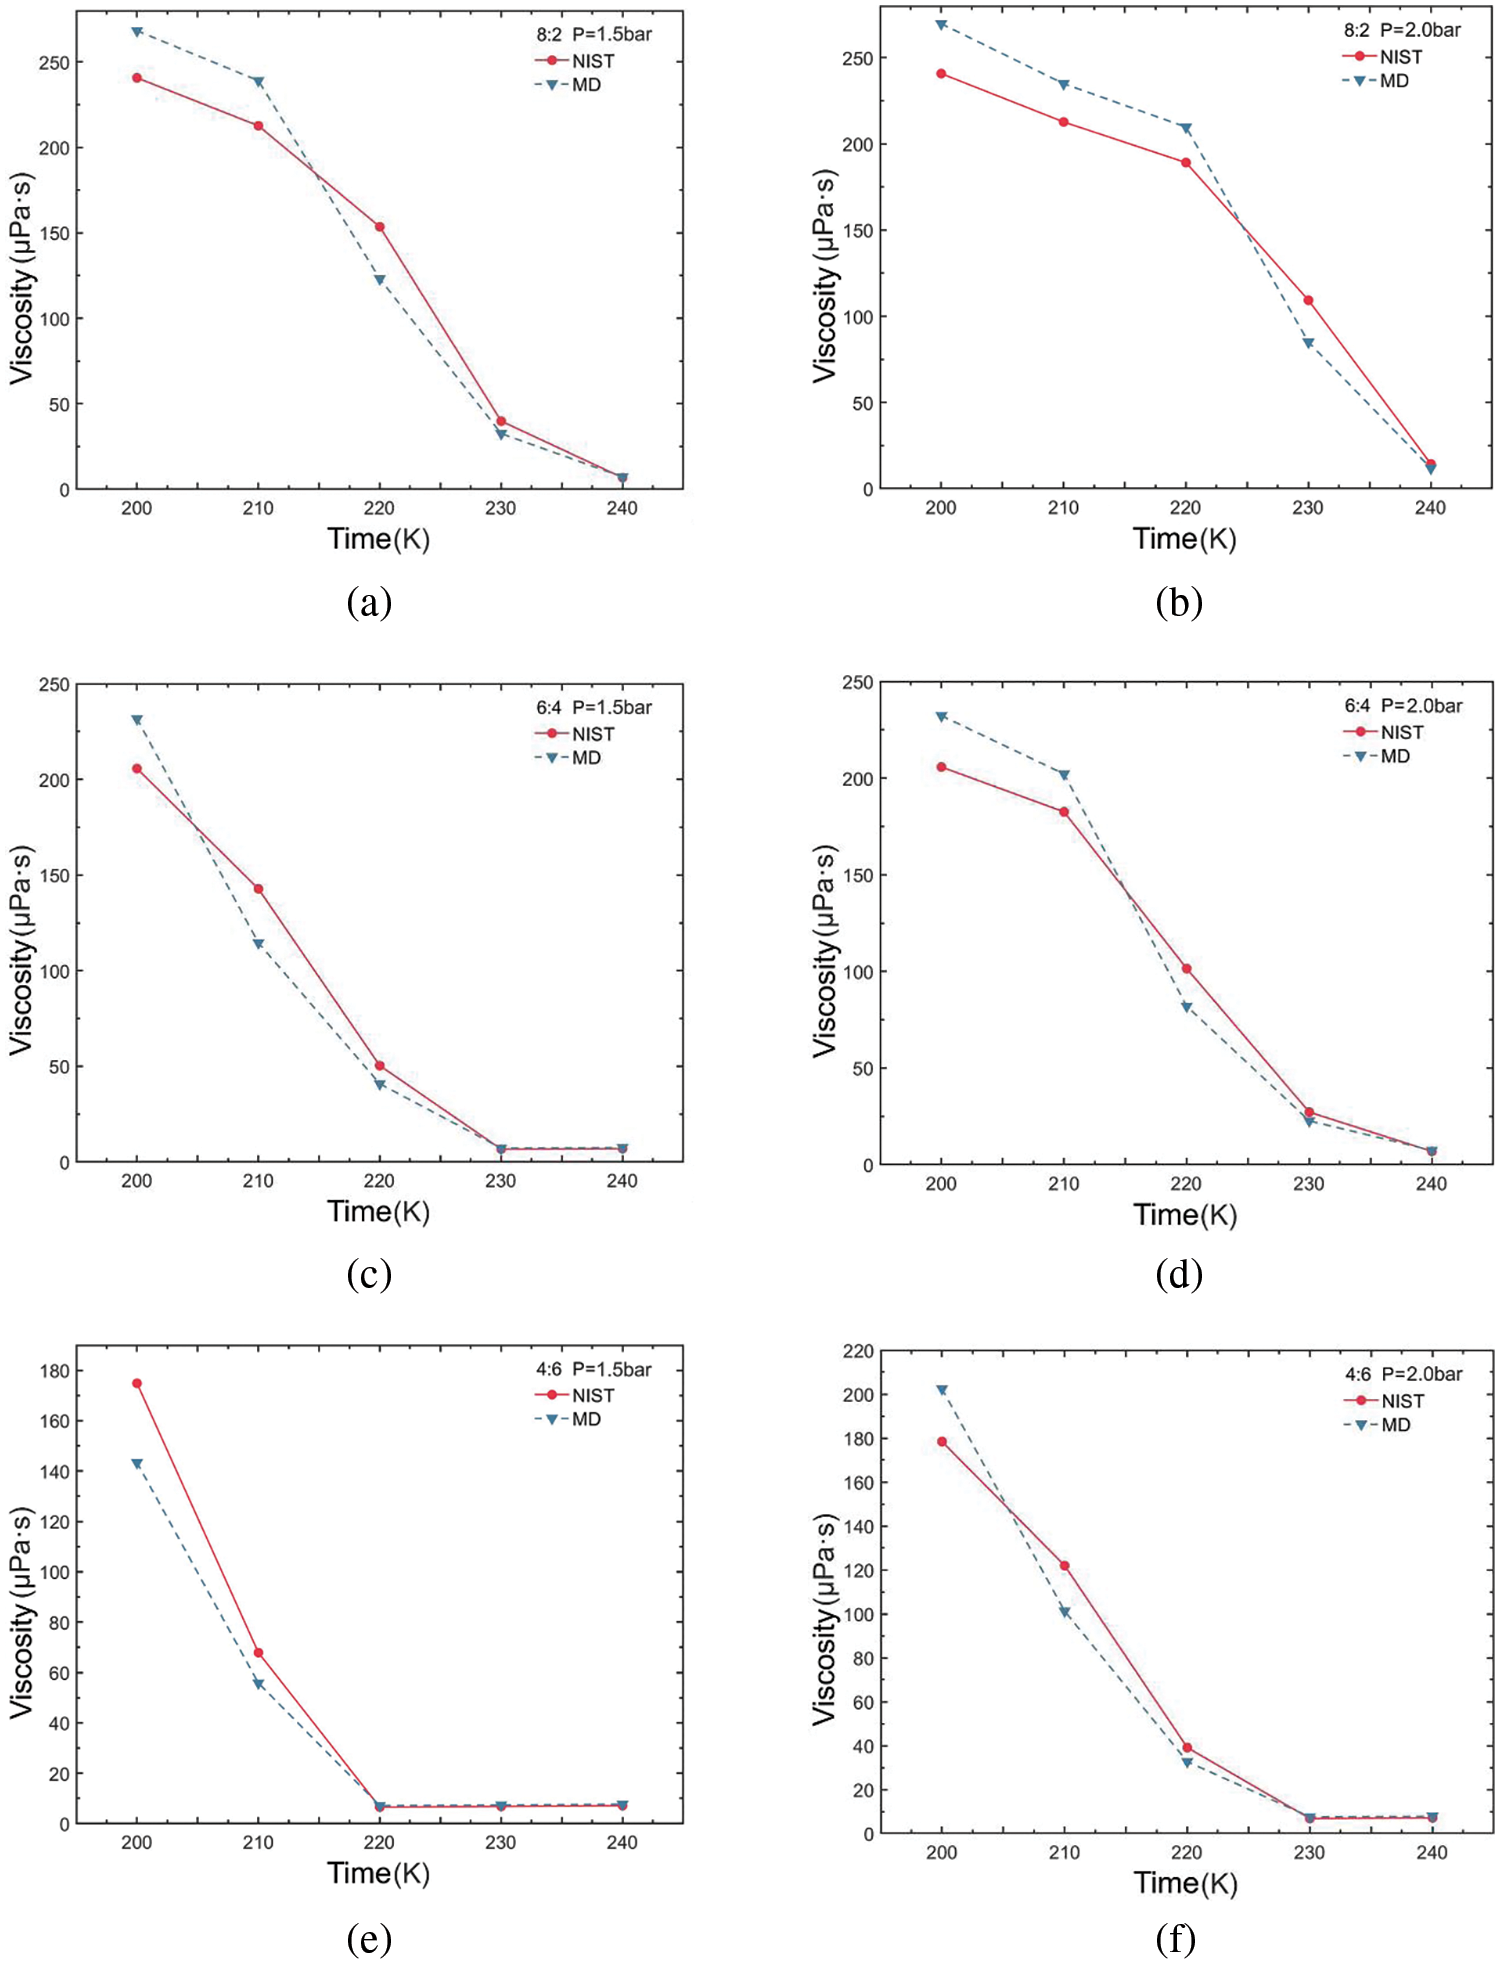
Figure 5: Viscosity variations of R290/R170 blends with different ratios. (a) MR = 8:2, P = 1.5 bar. (b) MR = 8:2, P = 2.0 bar. (c) MR = 6:4, P = 1.5 bar. (d) MR = 6:4, P = 2.0 bar. (e) MR = 4:6, P = 1.5 bar. (f) MR = 4:6, P = 2.0 bar
The viscosity errors for the R290/R170 blends are presented in Table 2. Under the pressure of 1.5 bar and a mass ratio of 8:2, the simulation yields a minimum ARD value of 6.36% at 240 K. Under identical pressure conditions, the maximum ARD is attained at 220 K, reaching 19.82%. Under the pressure of 2.0 bar and a mass ratio of 6:4, the simulation yields a minimum ARD value of 7.43% at 240 K. For the mass ratio of 8:2, the maximum ARD value is 22.24% at 230 K. Generally, under evaporative pressure conditions, the ARD tends to increase with rising temperature, implying that at higher temperatures result in larger deviations between simulated and actual values. Variations in mass ratios of R290/R170 influence viscosity errors, with the 8:2 ratio typically resulting in higher AARD values. Notably, there are instances where the viscosity simulation values for specific working conditions exhibit errors ranging from approximately 15% to 25%. The occurrence is primarily attributed to the R290/R170 blends existing in a two-phase region under these conditions. Moreover, under two pressure conditions, an increasing proportion of R290 in the blends was accompanied by a gradual increase in simulation errors.

In this study, the Green-Kubo method was employed to directly compute the equilibrium thermal conductivity of R290/R170 blends. The expression for computing the thermal conductivity NPT using the Green-Kubo method is as follows:
where,
where, ei represents the total energy of an atom, which comprises both the kinetic energy and the potential energy components:
The variation in thermal conductivity of the R290/R170 blends under evaporative pressure conditions is illustrated in Fig. 6. Examination of the simulated thermal conductivity values for these blends reveals a consistent trend with the NIST data values across various ratios and conditions, with only minor fluctuations observed. These trends align closely with those of the thermal conductivity values in the database, regardless of which pressure conditions. Notably, the observed thermal conductivity decreases in Fig. 6a,b,d as temperature increases, a phenomenon attributed to the phase change process occurring in blends during this temperature variation. During the evaporation process from liquid to gas, the decrease in thermal conductivity occurs because the phase change necessitates the absorption of additional latent heat, thereby reducing the intermolecular energy transfer. However, in Fig. 6c,e,f, it is notable that in the latter part of the curve, the thermal conductivity values of the refrigerants generally exhibit an increasing trend with rising temperature. In this case, the molecules in a single-phase refrigerant experience a greater average rate of thermal motion as temperature rises. This increased thermal motion results in more rapid energy transfer between molecules. The higher the ratio of propane in the blend, the greater the thermal conductivity for phases with dryness greater than 0 under the same pressure and temperature conditions.
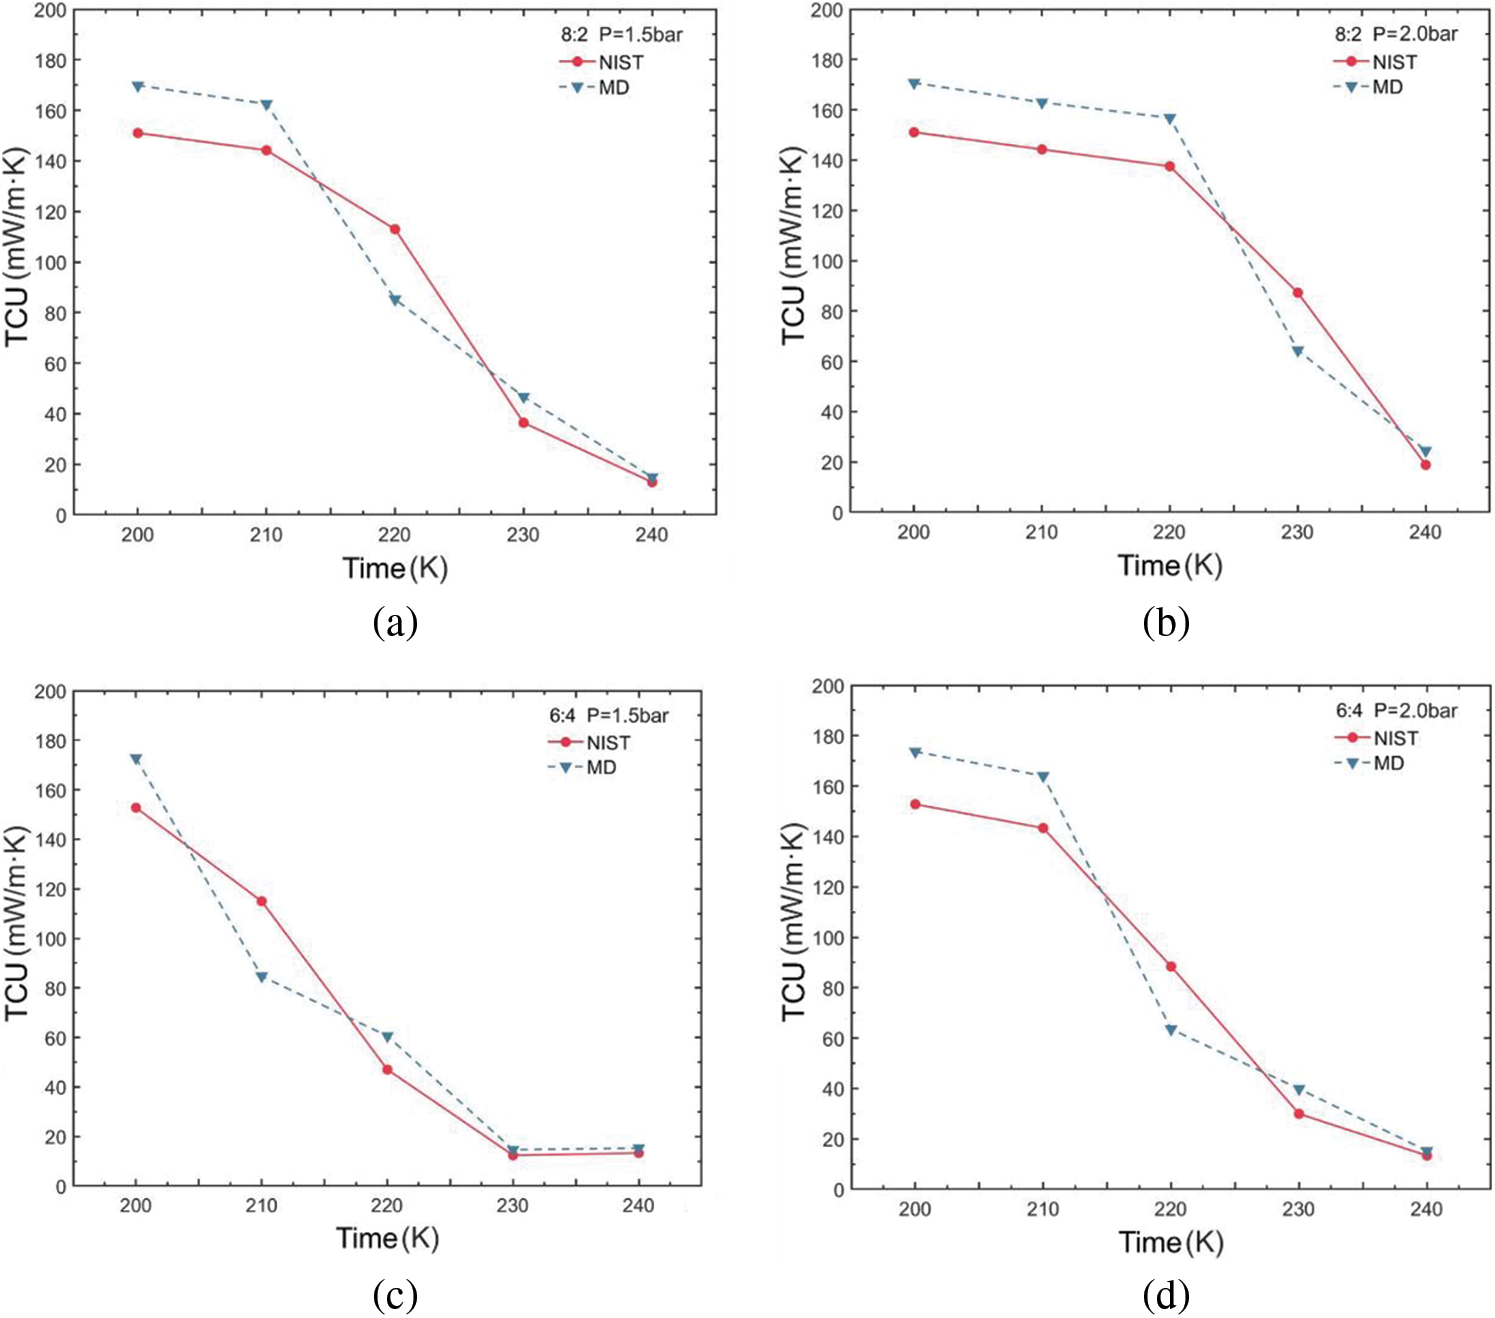
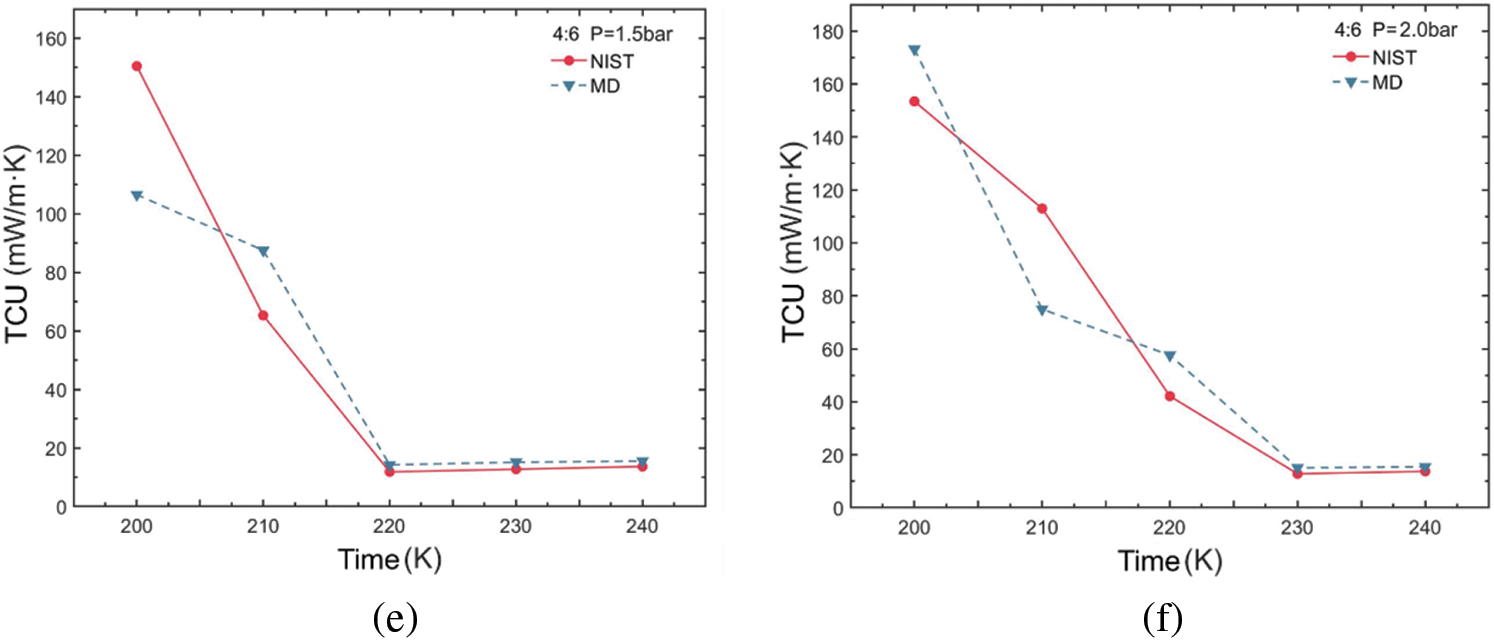
Figure 6: Thermal conductivity variations of R290/R170 blends with different ratios. (a) MR = 8:2, P = 1.5 bar. (b) MR = 8:2, P = 2.0 bar. (c) MR = 6:4, P = 1.5 bar. (d) MR = 6:4, P = 2.0 bar. (e) MR = 4:6, P = 1.5 bar. (f) MR = 4:6, P = 2.0 bar
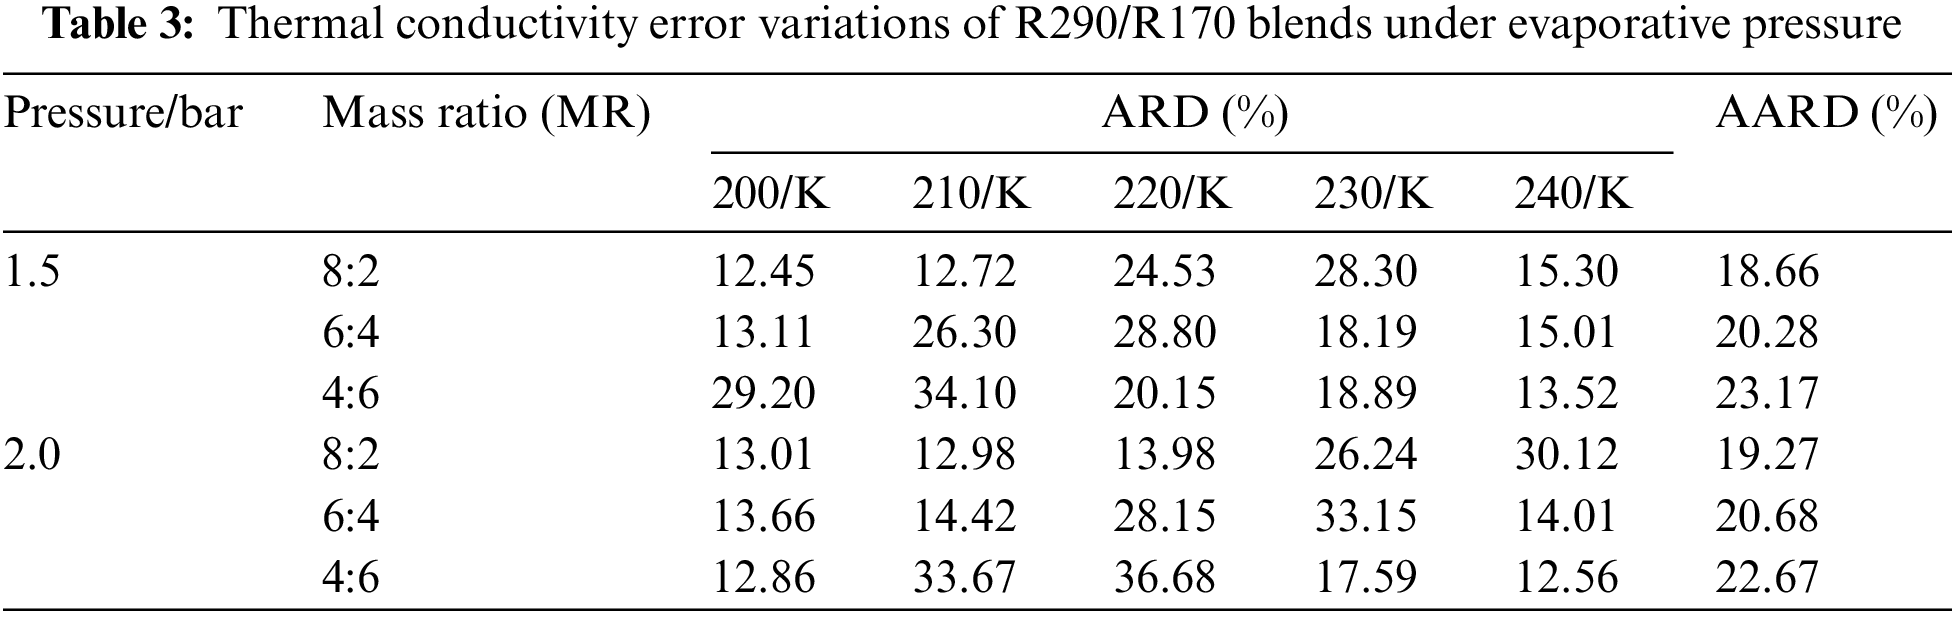
Table 3 illustrates the thermal conductivity errors for the R290/R170 blends under evaporative pressure conditions. As the proportion of R290 in the blends increases under the pressure of 1.5 bar. The lowest ARD value, at 12.45%, was obtained for the R290/R170 mass ratio of 8:2 at the temperature of 200 K. Similarly, under the pressure of 2.0 bar and at the temperature of 200 K, the R290/R170 mass ratio of 4:6 attained the lowest ARD value at 12.86%. The thermal conductivity simulation errors for the R290/R170 blends are relatively larger compared to the errors in viscosity. In addition, significant differences in ARD values exist for different ratios and temperatures. This discrepancy arises because the heat conduction process typically occurs over a relatively long time scale. The mismatch in time scales could lead to errors in thermal conductivity simulations.
3.4 Self-Diffusion Coefficient
The self-diffusion coefficient is a measure of the distance that molecules of a substance have diffused per unit time. The parameter serves as a crucial physical quantity, indicating the diffusion ability of a substance in a medium, which holds particular significance in understanding the transport properties of refrigerants. In this study, the method of calculating the self-diffusion coefficient is based on Einstein’s relation, and the self-diffusion coefficient is obtained by simulating the slope of the mean square displacement (MSD) vs. the time graph of particles in the system. In which ri denotes the position at which atom i is located.
For the simulated systems under high-density liquid conditions, the ensemble is set to the canonical ensemble (NVT), with the temperature coupling time constant set to 100 time-increments. Conversely, for systems under low-density conditions, the ensemble is set to NPT. Throughout the simulations, the MSD for each condition is calculated and output using Eq. (11), as depicted in Fig. 7. The changes in mean square displacement exhibit a linear correlation with time data for each condition. A linear regression fit is applied to each curve, and the slope of the fitted line is subsequently calculated. Subsequently, self-diffusion coefficients for the R290/R170 simulation system under various operating conditions are then calculated based on Eq. (10). It’s evident from Fig. 7b that the mean square displacement is notably smaller within the group when the mass ratio of R290/R170 is 8:2 under the pressure of 2.0 bar. Comparison and analysis of the six sets of results reveal that as the composition of the high-boiling hydrocarbon mass increases, the value of the MSD decreases, corresponding to a decrease in the slope per unit of time. Even more, at lower temperatures, the data line tends to be horizontal. One reason for this phenomenon is the decrease in the average kinetic energy of the molecules, resulting in a reduction in their thermal motion speed. Since diffusion is driven by the thermal motion of the molecules, it will be slowed down at lower temperatures.
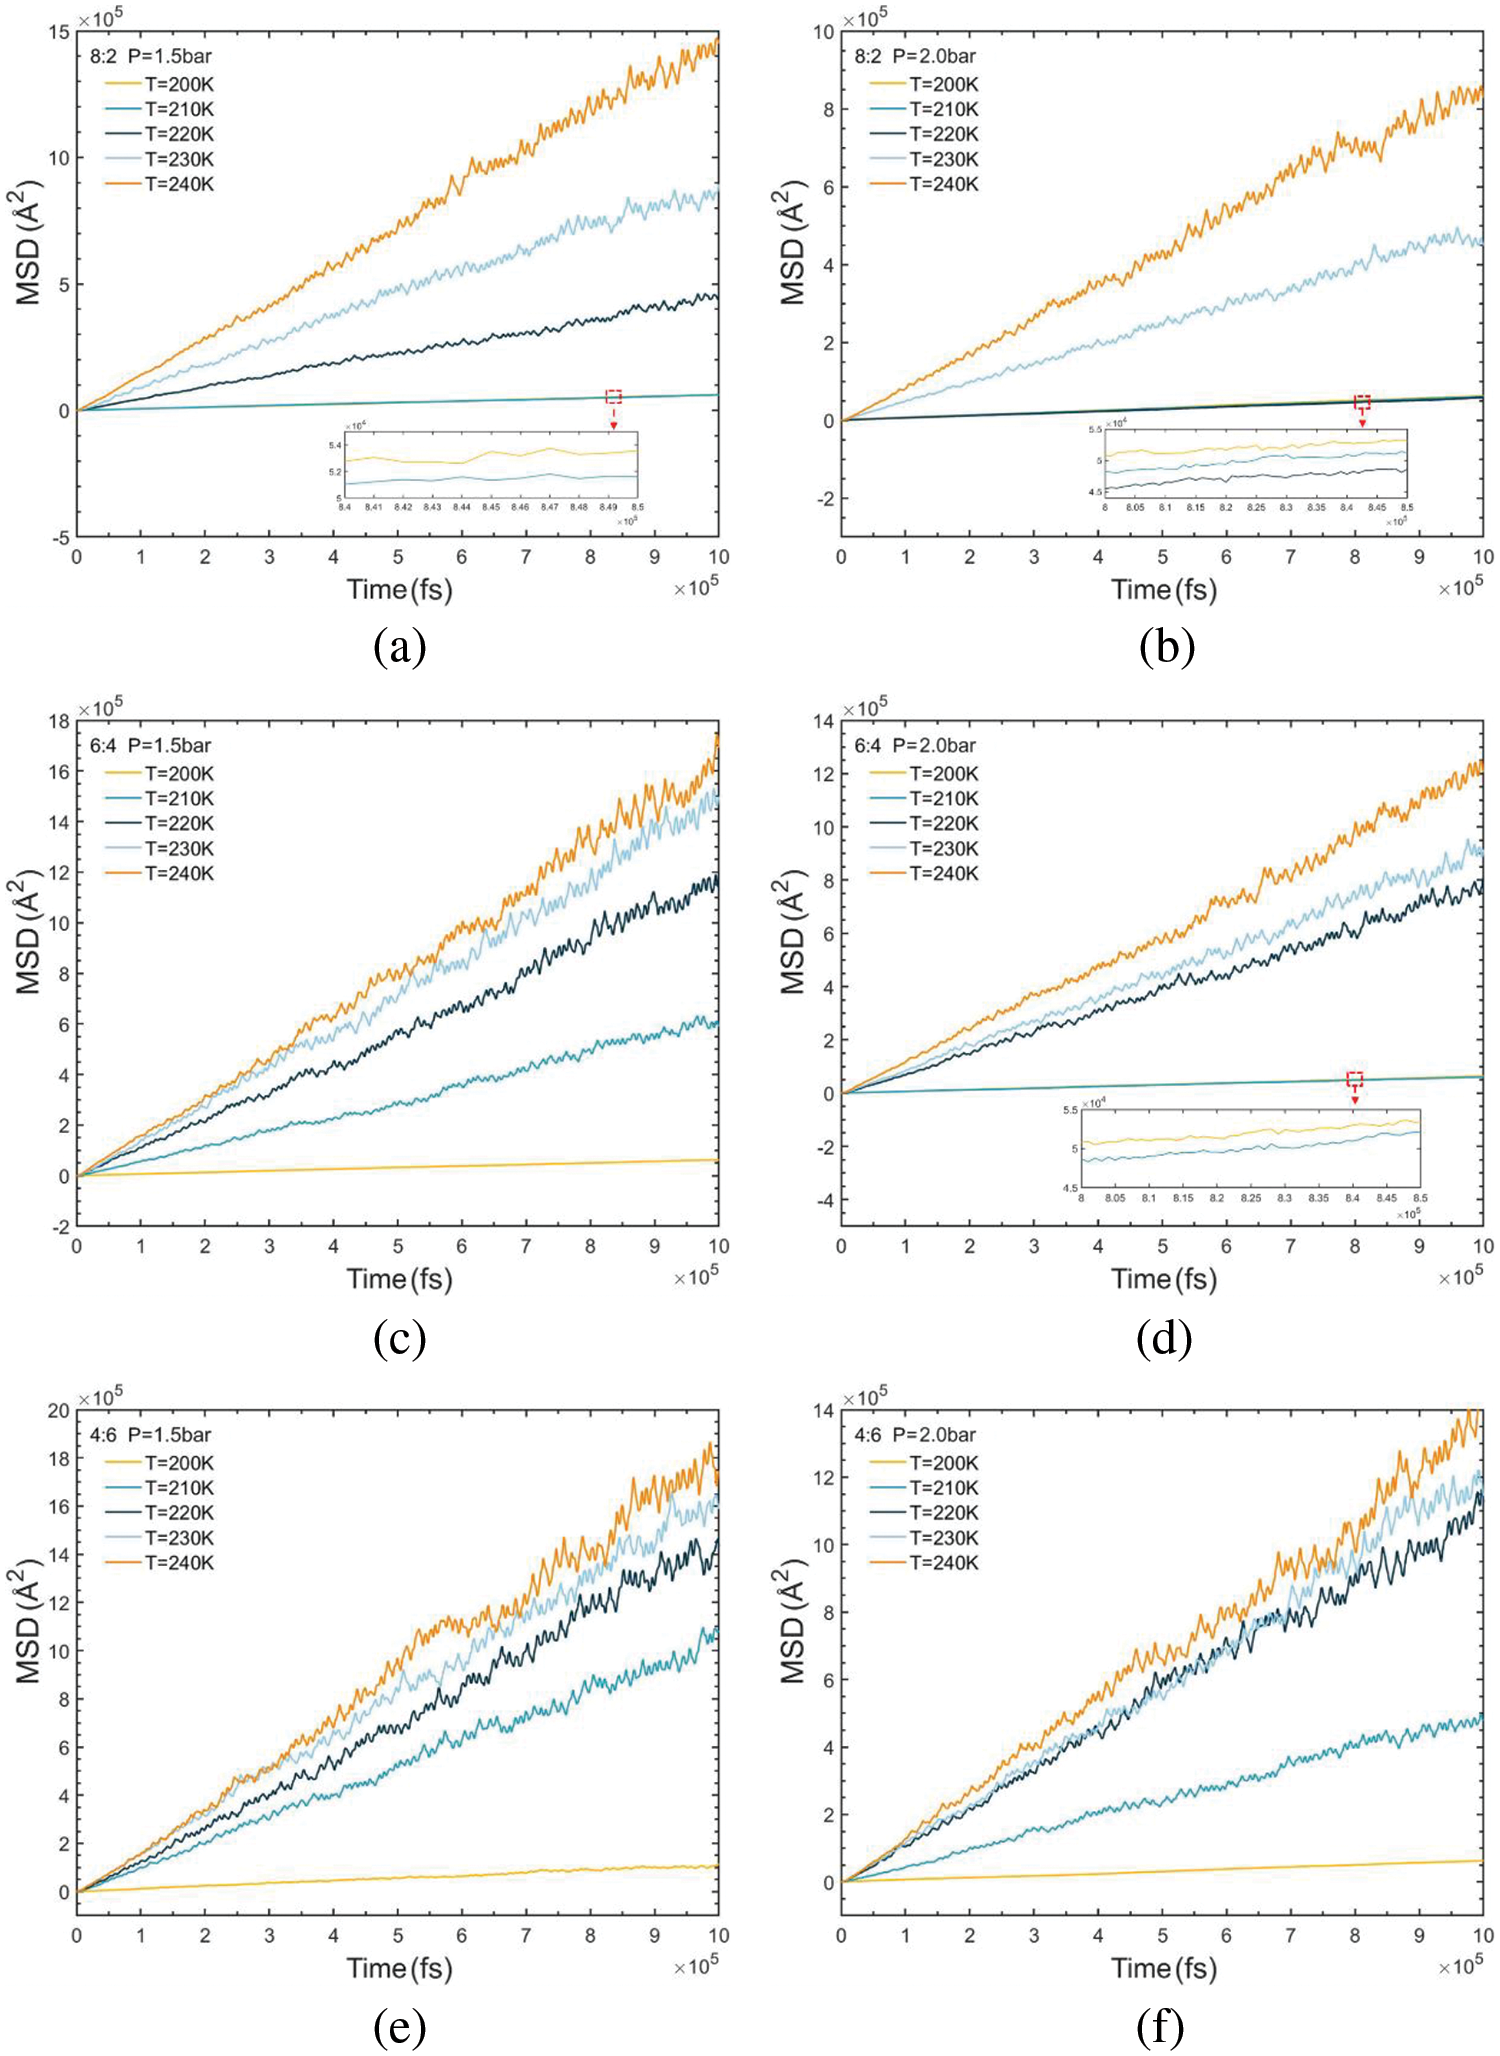
Figure 7: MSD variations of R290/R170 blends with different ratios. (a) MR = 8:2, P = 1.5 bar. (b) MR = 8:2, P = 2.0 bar. (c) MR = 6:4, P = 1.5 bar. (d) MR = 6:4, P = 2.0 bar. (e) MR = 4:6, P = 1.5 bar. (f) MR = 4:6, P = 2.0 bar
The obtained self-diffusion coefficient values for various conditions were compared and analyzed against NIST data values, as illustrated in Fig. 8. The results reveal a trend wherein simulated self-diffusion coefficients exhibit a trend of increasing values with rising temperature, mirroring the pattern observed in NIST data. As temperature increases, the average kinetic energy of molecules also increases, leading to higher molecular velocities. Consequently, in the process of diffusion, molecules must overcome intermolecular attractions. With higher speeds, molecules can more easily escape from their initial positions, thereby enhancing the diffusion rate. In conjunction with density analysis, the gas-liquid phase change increases the extent of molecular thermal movement when the blend within the two-phase region thereby affecting simulation stability. Molecules in the pure liquid phase can provide a more stable heat transfer capability. Therefore, a pure liquid phase system can provide a relatively constant heat and mass transfer characteristic. The heat transfer of refrigerants can be maintained by adjusting the mixing ratio in refrigeration design, giving a basis for thermal optimal analysis from the perspective of transport properties. The values of diffusion efficiency were all greater than 0.005 cm2/s when gas was present. Moreover, increasing the temperature elevates disorder within the system, augmenting molecular randomness. This heightened disorder increases the probability of molecules spreading throughout, consequently promoting the diffusion process. The diffusion coefficient of the R290/R170 ratio of 4:6 is higher than that of the other two ratio groups under all pressure conditions. The more active nature of the ethane molecules increases the diffusion coefficient of the blend. The diffusion property is an important transport property that affects the conduction and convection characteristics of refrigerants in the heat transfer process. Properly adjusting the molecular dynamics of refrigerants in the two-phase region, allowing higher latent heat of evaporation by design, can enable an increase in the cooling capacity of the system.
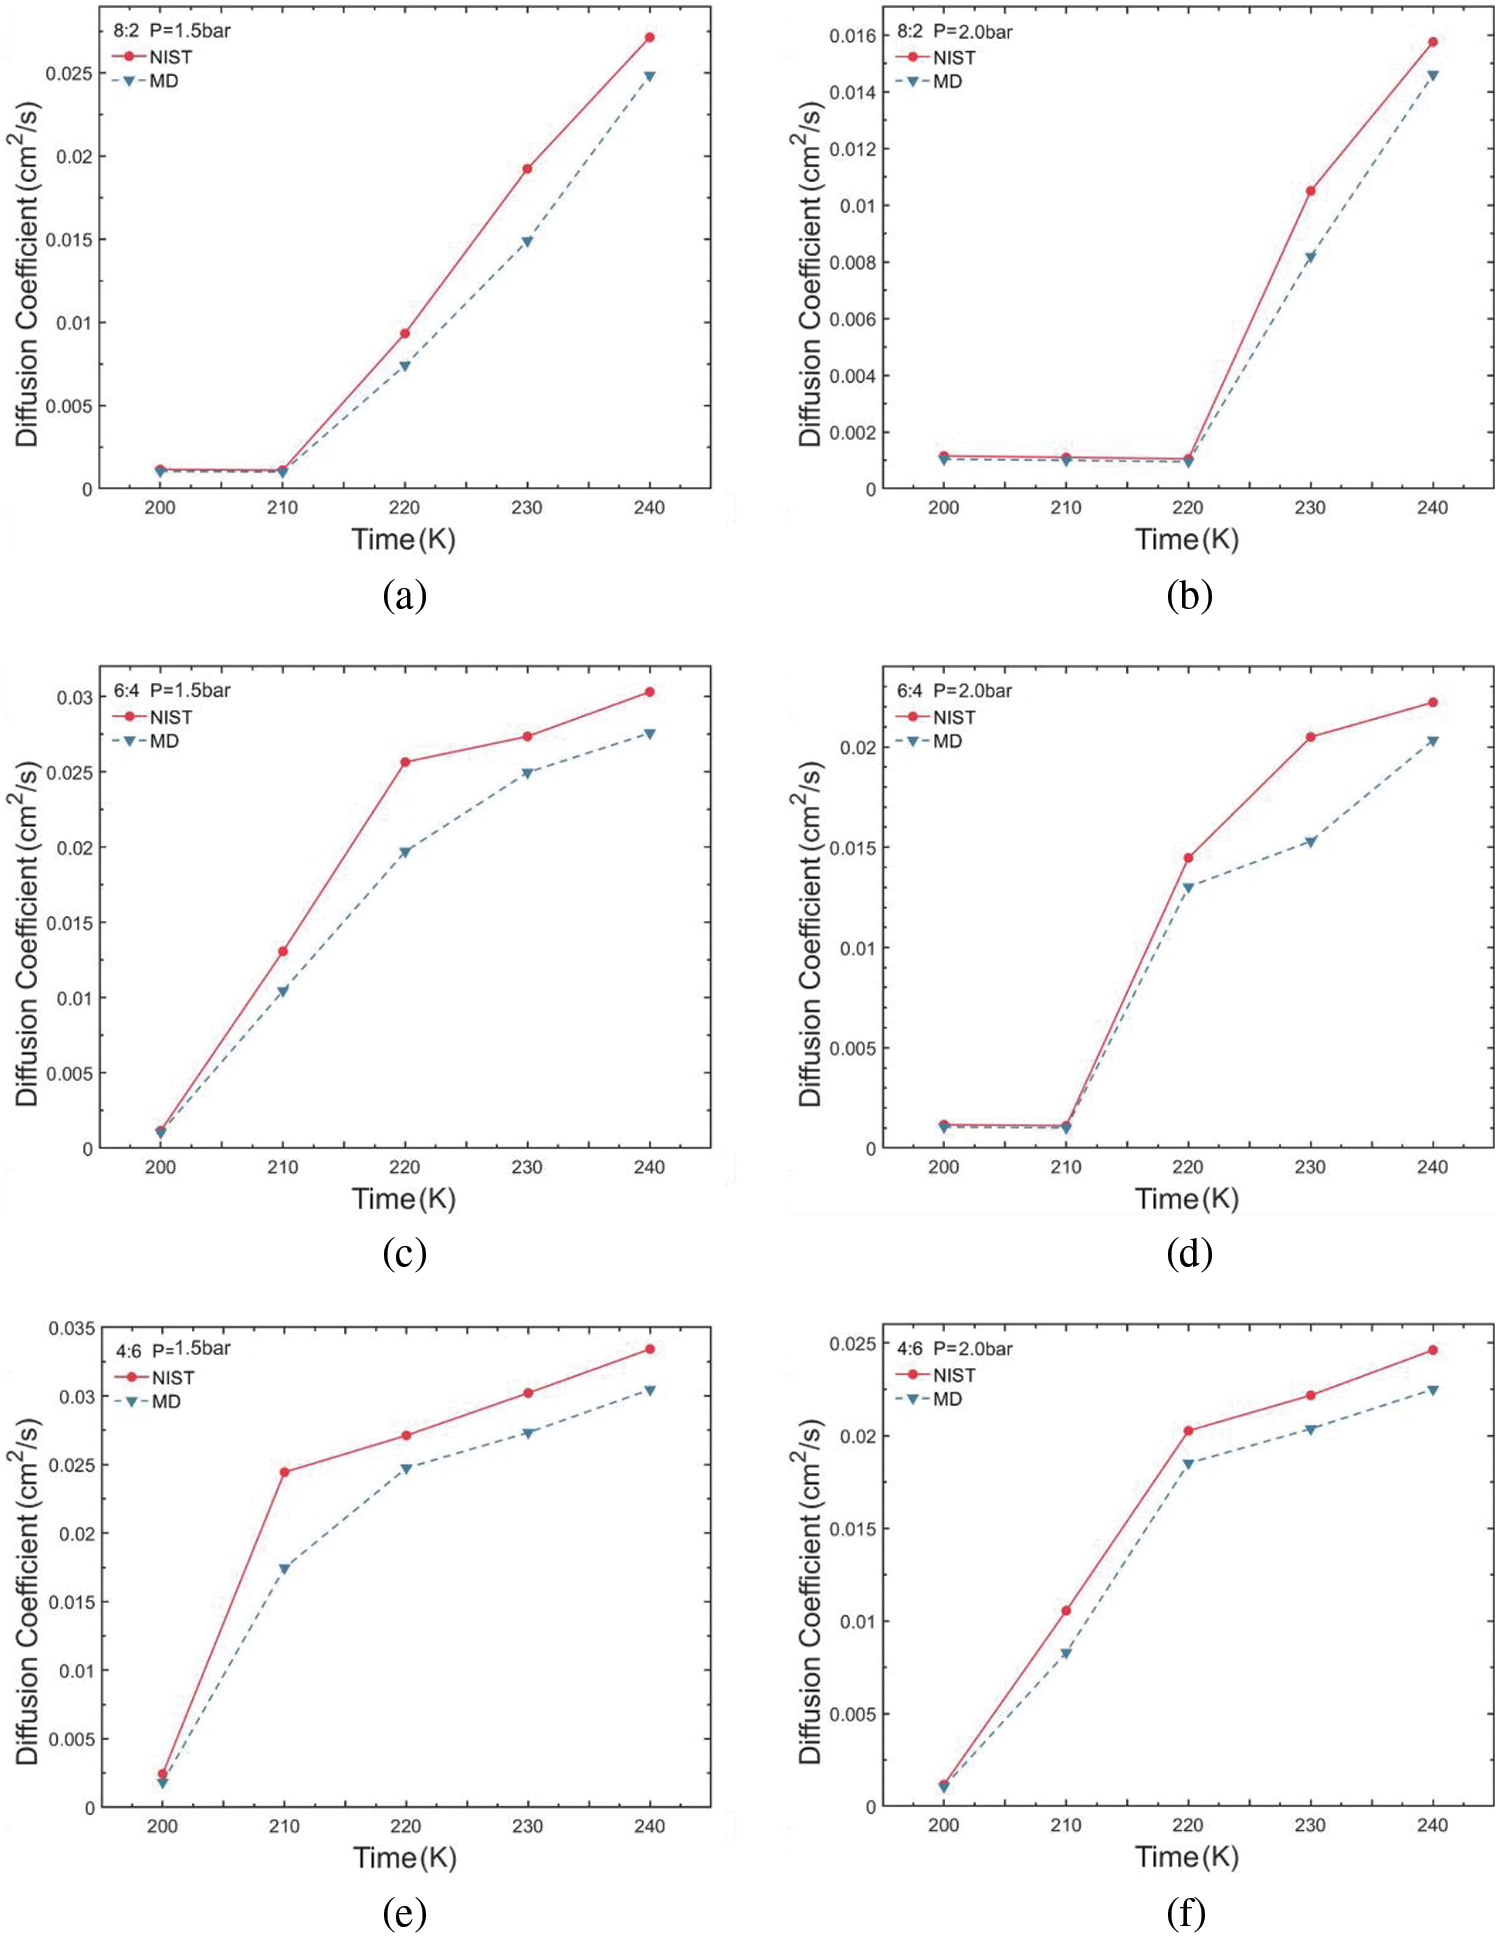
Figure 8: Self-diffusion coefficient variations of R290/R170 blends with different ratios. (a) MR = 8:2, P = 1.5 bar. (b) MR = 8:2, P = 2.0 bar. (c) MR = 6:4, P = 1.5 bar. (d) MR = 6:4, P = 2.0 bar. (e) MR = 4:6, P = 1.5 bar. (f) MR = 4:6, P = 2.0 bar
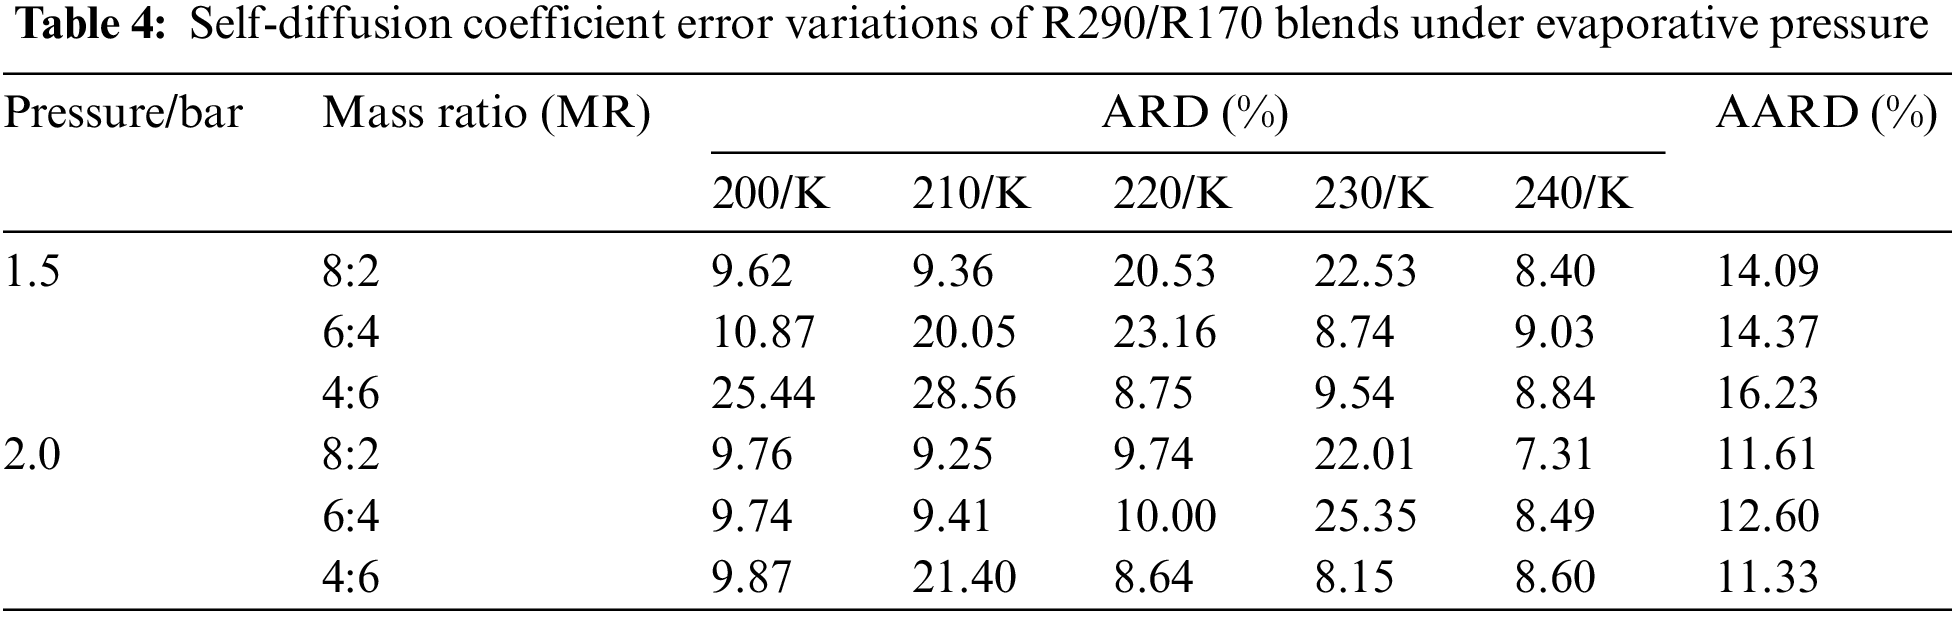
Table 4 illustrates the self-diffusion coefficient error for R290/R170 blends under evaporative pressure conditions. Under the pressure of 1.5 bar, there is a gradual reduction in simulation error as the proportion of R290 in the blend increases. However, certain points under the pressure exhibit relatively large errors in the self-diffusion coefficient simulation. For instance, at the temperature of 210 K and the pressure of 1.5 bar, the self-diffusion coefficient error is 28.56% with a R290/R170 mass ratio of 4:6. The phenomenon primarily stems from the fact that the R290/R170 blend undergoes a phase transition region between the liquid and gas phases. In the gas phase, molecules move freely at higher speeds, while in the liquid phase, there are more intermolecular interactions and resistance. Such phase transition leads to unstable fluctuations in the self-diffusion coefficient within the two-phase region, thereby amplifying the associated error. Excluding these inaccurate data points, the simulation error in the self-diffusion coefficient exhibits a slight decrease with increasing temperature. Additionally, the simulated diffusion coefficient for the same temperature and pressure of 2.0 bar was closer to the NIST data.
The thermophysical properties of R290/R170 blend at various mixing ratios and low-pressure operating conditions were examined through molecular dynamics simulations. The specific findings are outlined below:
• The simulation results revealed that the density error in the relaxation phase remained below 6.75%, with average errors of 3.71%, 4.42% and 4.33% for mixing ratios of 8:2, 6:4 and 4:6, respectively. These findings collectively validate the feasibility of utilizing molecular dynamics simulations for analyzing the transport properties of refrigerants and mixtures.
• The interrelation of transport properties: viscosity, thermal conductivity, and self-diffusion coefficient encompasses various factors at the molecular dynamics scale. In the liquid phase, the mixtures typically exhibit higher viscosity and thermal conductivity, alongside lower self-diffusion coefficients. Conversely, in the gas phase, the behavior of these transport properties is reversed.
• As the intermediate passes through the two-phase region of the liquid-gas transition, the interactions between the molecules intensify with rising temperature, leading to increased disorder. Consequently, the behavior of the simulation results becomes more inaccurate.
The latent heat of phase change within the refrigerant’s two-phase region can be leveraged to enhance the cooling capacity of the system by adjusting the blends. Future studies should focus on employing longer simulation times and refining force field parameters to minimize deviations.
Acknowledgement: Not applicable.
Funding Statement: This work was supported by the Open Project of the Shanghai Key Laboratory of Multiphase Flow and Heat Transfer in Power Engineering and the Central Guidance on Local Science and Technology Development Fund of Shanghai City (No. YDZX20213100003002), and the Special Project of Independent Innovation of Qingdao City (21-1-2-6-NSH).
Author Contributions: The authors confirm contribution to the paper as follows: study conception and design: Zhenzhen Liu, Hua Zhang; data collection: Zhenzhen Liu; analysis and interpretation of results: Zhenzhen Liu, Zilong Wang; draft manuscript preparation: Zhenzhen Liu. All authors reviewed the results and approved the final version of the manuscript.
Availability of Data and Materials: Data will be made available on request.
Conflicts of Interest: The authors declare that they have no conflicts of interest to report regarding the present study.
References
1. Souayeh B, Bhattacharyya S, Hdhiri N, Alam M. Selection of best suitable eco-friendly refrigerants for HVAC sector and renewable energy devices. Sustainability. 2022;14(18):11663. doi:10.3390/su141811663. [Google Scholar] [CrossRef]
2. Yang X, Liu Q, Zhang X, Ji C, Cao B. A molecular dynamics simulation study of the densities and viscosities of 1,2,4-trimethylbenzene and its binary mixture with n-decane. Fluid Phase Equilib. 2022;562(545):113566. doi:10.1016/j.fluid.2022.113566. [Google Scholar] [CrossRef]
3. Qiu L, Al-Nussairi A, Abed A, Hasan Y, Mashhadani Z, Zabibah R, et al. Molecular dynamics study of oil type and volume ratio of nanoparticles on the thermal behavior of nanorefrigerants. Case Studies Therm Eng. 2022;37(2):102255. doi:10.1016/j.csite.2022.102255. [Google Scholar] [CrossRef]
4. Fouad W, Alasiri H. Molecular dynamic simulation and SAFT modeling of the viscosity and self-diffusion coefficient of low global warming potential refrigerants. J Mol Liq. 2020;317:113998. doi:10.1016/j.molliq.2020.113998. [Google Scholar] [CrossRef]
5. Khan M, Wen J, Shakoori M, Tao W. Homogeneous condensation and thermophysical properties of R450A, R513A and R515A using molecular dynamics simulations. J Mol Liq. 2022;353(7):118795. doi:10.1016/j.molliq.2022.118795. [Google Scholar] [CrossRef]
6. Khan M, Wen J, Shakoori M, Liu Y. Condensation and thermophysical properties of R1336mzz(Z) through molecular dynamics simulations. Int J Refrig. 2023;146:290–9. doi:10.1016/j.ijrefrig.2022.11.008. [Google Scholar] [CrossRef]
7. Liu X, Wang T, He M. Investigation on the condensation process of HFO refrigerants by molecular dynamics simulation. J Mol Liq. 2019;288:111034. doi:10.1016/j.molliq.2019.111034. [Google Scholar] [CrossRef]
8. Liu Y, Zhao X, Lv S, He H. Isobaric heat capacity measurements for R1234yf from 303 to 373 K and pressures up to 12 MPa. J Chem Eng Data. 2017;62(3):1119–24. doi:10.1021/acs.jced.6b00959. [Google Scholar] [CrossRef]
9. Liu Q, Shen A, Duan Y. Parametric optimization and performance analyses of geothermal organic Rankine cycles using R600a/R601a mixtures as working fluids. Appl Energy. 2015;148(1):410–20. doi:10.1016/j.apenergy.2015.03.093. [Google Scholar] [CrossRef]
10. Loya A, Stair J, Jafri A, Yang K, Ren G. A molecular dynamic investigation of viscosity and diffusion coefficient of nanoclusters in hydrocarbon fluids. Comput Mater Sci. 2015;99(1):242–6. doi:10.1016/j.commatsci.2014.11.051. [Google Scholar] [CrossRef]
11. Cai S, Li X, Yu L, Zhang L, Huo E. Thermodynamic and mass transport properties of R1234ze(E) and R32 mixtures at the liquid-vapor interface: a molecular dynamics study. J Mol Liq. 2022;365:120112. [Google Scholar]
12. Deng X, Liu Y, Liu C. Evaporation behaviors of R32/R1234ze(E) mixtures on a copper surface using molecular dynamics simulations. Int Commun Heat Mass Transf. 2022;138:106400. [Google Scholar]
13. Alam M, Jeong J. Calculation of the thermodynamic properties of R448A and R449A in a saturation temperature range of 233.15 K to 343.15 K using molecular dynamics simulations. Int Commun Heat Mass Transf. 2020;116:104717. [Google Scholar]
14. Khan M, Wen J, Shakoori M. Molecular dynamics evaluations of homogeneous condensation and thermophysical properties of (R-1234ze(E)+R-134a) binary blends. Int J Refrig. 2023;154:324–34. [Google Scholar]
15. Li Y, Fouad W, Vega L. Interfacial anomaly in low global warming potential refrigerant blends as predicted by molecular dynamics simulations. Phys Chem Chem Phys. 2019;21(39):22092–102. [Google Scholar] [PubMed]
16. Longo G, Mancin S, Righetti G, Zilio C. Boiling of the new low-GWP refrigerants R1234ze(Z) and R1233zd(E) inside a small commercial brazed plate heat exchanger. Int J Refrig. 2019;104:376–85. doi:10.1016/j.ijrefrig.2019.05.034. [Google Scholar] [CrossRef]
17. Salhi K, Korichi M, Ramadan K. Thermodynamic and thermo-economic analysis of compression-absorption cascade refrigeration system using low-GWP HFO refrigerant powered by geothermal energy. Int J Refrig. 2018;94:214–29. doi:10.1016/j.ijrefrig.2018.03.017. [Google Scholar] [CrossRef]
18. Huo E, Liu C, Xu X, Li Q, Dang C. A ReaxFF-based molecular dynamics study of the oxidation decomposition mechanism of HFO-1336mzz(Z). Int J Refrig. 2018;93:249–58. doi:10.1016/j.ijrefrig.2018.06.019. [Google Scholar] [CrossRef]
19. Liu Z, Jiang J, Wang Z, Zhang H. Thermodynamic analysis of an innovative cold energy storage system for auto-cascade refrigeration applications. Energies. 2023;16(5):2282. doi:10.3390/en16052282. [Google Scholar] [CrossRef]
20. Rodríguez-Jara E, Sánchez-de-la-Flor F, Expósito-Carrillo J, Salmerón-Lissén JM. Thermodynamic analysis of auto-cascade refrigeration cycles, with and without ejector, for ultra low temperature freezing using a mixture of refrigerants R600a and R1150. Appl Therm Eng. 2022;200:117598. [Google Scholar]
21. Liu J, Lin Z. Thermodynamic analysis of a novel dual-temperature air-source heat pump combined ejector with zeotropic mixture R1270/R600a. Energy Convers Manag. 2020;220:113078. [Google Scholar]
22. Yu M, Yu J. Thermodynamic analyses of a flash separation ejector refrigeration cycle with zeotropic mixture for cooling applications. Energy Convers Manag. 2021;229:113755. [Google Scholar]
23. Zhou W, Gan Z. A potential approach for reducing the R290 charge in air conditioners and heat pumps. Int J Refrig. 2019;101:47–55. [Google Scholar]
24. Padalkar A, Mali K, Devotta S. Simulated and experimental performance of split packaged air conditioner using refrigerant HC-290 as a substitute for HCFC-22. Appl Therm Eng. 2014;62(1):277–84. [Google Scholar]
25. Mastrullo R, Mauro A, Menna L, Vanoli G. Replacement of R404A with propane in a light commercial vertical freezer: a parametric study of performances for different system architectures. Energy Convers Manage. 2014;82:54–60. [Google Scholar]
26. Ozsipahi M, Kose H, Kerpicci H, Gunes H. Experimental study of R290/R600a mixtures in vapor compression refrigeration system. Int J Refrig. 2022;133(1–2):247–58. doi:10.1016/j.ijrefrig.2021.10.004. [Google Scholar] [CrossRef]
27. Liu Z, Bai M, Tan H, Ling Y, Cao Z. Experimental test on the performance of a −80 °C cascade refrigeration unit using refrigerants R290-R170 for COVID-19 vaccines storage. J Build Eng. 2023;63(1):105537. doi:10.1016/j.jobe.2022.105537. [Google Scholar] [CrossRef]
28. Chen Q, Zhou L, Yan G, Yu J. Theoretical investigation on the performance of a modified refrigeration cycle with R170/R290 for freezers application. Int J Refrig. 2019;104(17–18):282–90. doi:10.1016/j.ijrefrig.2019.05.037. [Google Scholar] [CrossRef]
29. Liu J, Liu Y, Yan G, Yu J. Theoretical study on a modified single-stage autocascade refrigeration cycle with auxiliary phase separator. Int J Refrig. 2021;122(2):181–91. doi:10.1016/j.ijrefrig.2020.11.009. [Google Scholar] [CrossRef]
30. Huber ML. NIST Thermophysical properties of hydrocarbon mixtures database (SUPERTRAPPversion 3.2; 2007. https://www.researchgate.net/publication/237625399_NIST_Thermophysical_Properties_of_Hydrocarbon_Mixtures_Database. [Accessed 2024]. [Google Scholar]
31. Michael DJT, Allen P. Computer simulation of liquids. 2nd Ed. Great Clarendon Strret, Oxford, OX2 6DP, UK: Oxford University Press; 2017. p. 626. [Google Scholar]
Cite This Article
 Copyright © 2024 The Author(s). Published by Tech Science Press.
This work is licensed under a Creative Commons Attribution 4.0 International License , which permits unrestricted use, distribution, and reproduction in any medium, provided the original work is properly cited.
 Downloads
 Citation Tools