
 Submit a Paper
 Propose a Special lssue
 Open Access
ARTICLE

Study on Temperature Distribution and Smoke Spreading Behavior of Different Fire Source Locations in the Underwater W-Shaped Island-Crossing Tunnel
1 School of Civil Engineering, Central South University, Changsha, 410075, China
2 CABR Fire Safety Science & Technology Co., Ltd., Beijing, 100013, China
* Corresponding Author: Jiaming Zhao. Email:
Frontiers in Heat and Mass Transfer 2024, 22(4), 1129-1151. https://doi.org/10.32604/fhmt.2024.053695
Received 08 May 2024; Accepted 08 July 2024; Issue published 30 August 2024
 View Full Text
 Download PDF
Abstract
Called island-crossing tunnels, some specific underwater tunneling projects face constraints imposed by geological and water conditions, necessitating their passage through artificial or natural islands. The longitudinal of the tunnel follows a W-shaped distribution. The congestion situation does not allow for immediate longitudinal smoke exhaust at the early stage of the fire, and the natural spread of smoke is complicated. An exhaustive investigation was carried out to analyze the smoke behaviors during a fire incident, employing the fire dynamics software FDS, considering five slopes and four fire locations. The simulation results reveal that the layer of high-temperature smoke becomes thicker as one gets closer to the fire source. The thermal pressure difference significantly impacts the temperature distribution within the tunnel and the distance of smoke spread. The value of the thermal pressure difference is significantly affected by changes in slope. It reaches a maximum of 157 Pa at a 5% slope, while it is only 41 Pa at a 1% slope when the fire occurs at the V-point. Fire hazards vary across locations within the W-shaped tunnel, necessitating separate consideration of the V-point and inverted V-point fire characteristics. The mass flow rate in small and large slope tunnels shows different decay rates due to variations in the main forces acting on the movement. Hence, two equations have been developed to predict the smoke mass flow rate, indicating a nonlinear relationship with the tunnel slope and the distance from the fire source. The tunnel slope inversely affects the smoke mass flow rate at the same location. The results can be utilized as a reference for conducting evacuation operations and aiding rescues during a W-shaped tunnel fire.Keywords
Nomenclature
| Specific heat capacity of air, kJ/(kg·K) | |
| Characteristic length, m | |
| External force, m/s2 | |
| Gravitational acceleration, m/s2 | |
| Distance in z-direction at x from the source of the fire, m | |
| Heat transfer coefficient of concrete, kW/m2 | |
| Component enthalpy, J/kg | |
| Tunnel height, m | |
| The heat of combustion of propane, kJ/kg | |
| Tunnel slope, % | |
| Length of model, m | |
| Length of full-scale, m | |
| Distance from every two grade-change points in the horizontal direction, m | |
| The mass flow rate of the fuel, kg/s | |
| The mass flow rate, kg/s | |
| Dimensionless mass flow rate | |
| Environment pressure, Pa | |
| The thermal pressure difference, Pa | |
| Heat release rate per unit volume, kW/m3 | |
| Heat release rate, kW | |
| Dimensionless heat release rate | |
| Dimensionless heat release rate of the model | |
| Dimensionless heat release rate of full-scale | |
| Simulation time, s | |
| Ambient temperature, K | |
| The average gas temperature at the fire site, K | |
| Smoke average temperature, K | |
| Gas velocity vector, m/s | |
| The perimeter of the tunnel cross-section, m | |
| Distance from the fire source, m | |
| Greek Symbols | |
| Gas density, kg/m3 | |
| Air density, kg/m3 | |
| Viscous vector, N | |
| Combustion efficiency | |
To address the rising traffic volume resulting from increased socialization, the number and complexity of tunnels have witnessed a notable increase compared to previous counterparts. Fire is a significant hazard in tunnels due to its confined structure, which facilitates the rapid spread of toxic and harmful substances in the smoke, making it a leading cause of casualties [1–4]. Consequently, critical velocity [5,6], back-layering length [7,8], top temperature distribution [9–11], and other related factors have been extensively studied by scholars worldwide. Various parameters, including temperature distribution of the ceiling, smoke spread distance, and smoke plume front spread time for a specific temperature, could be used to describe the spread of smoke. Compared to straight tunnels, sloped tunnels introduce additional complexity, as their presence of a slope creates stack effect that resembles longitudinal ventilation [12], affecting the smoke movement within the tunnel. Furthermore, variable fire locations in tunnels [13,14] affect the temperature distribution upstream and downstream and the distance of smoke spread. Studying the W-shaped island-crossing tunnel’s temperature field and the behavior of smoke spreading under different fire source locations is essential.
In recent years, the spread of inclined tunnel fire smoke has been the subject of research by numerous scholars. By using numerical simulations, Kong et al. [15] analyzed the length over which smoke back-layering occurred for three longitudinal distances of fire locations in single-slope tunnels. A dimensionless smoke back-layering length prediction equation concerning tunnel slope was derived. A study was conducted by Ji et al. [16] using the large eddy simulation software FDS to examine the impact of ambient pressure, ranging from 50 to100 kPa, and slope, which includes 5%, 7%, 10%, 12%, and 15% on the pattern of smoke and temperature distribution in an inclined tunnel. As the ambient pressure decreases, the results showed a decrease in the smoke mass flow rate and an increase in temperature. Shafee et al. [17] studied inclined tunnel fires at three vehicle blockage rates. The results revealed that in the blocked case, the tunnel ceiling temperature increased by up to 300% compared to the unblocked case.
Zhang et al. [18] focused on CO concentration and smoke spread under a single sloped tunnel from five aspects. The study concluded a negative correlation between the CO concentration and the inclination angle. In contrast, a positive correlation is observed between the inclination angle, the smoke layer’s thickness, and the smoke emission rate. However, a limitation of the study is that the experiment involved a limited selection of slope angles. A prediction formula for back-layering distance under natural ventilation conditions, suitable for slopes up to 8%, was proposed by Zhang et al. [19] based on the results of dimensionless analysis and data simulation. This was achieved by establishing a numerical model covering slopes ranging from 0% to 8%. Li et al. [20] conducted a set of small-scale simulations and experimental models, altering the longitudinal ventilation velocity and the slope. The results showed an increase in the critical velocity as the slope increased. Moreover, the critical air velocity was minimally influenced by the fire power and ventilation velocity.
The previous studies discussed in the background primarily focused on single-slope tunnels. However, other studies have investigated tunnel fires involving more complex slope configurations under compound slopes.
Jiang et al. [21] investigated the competition effect of V-slope through numerical simulation and theoretical analysis. The equation of the mass flow rate with slope and heat release rate was derived after analyzing smoke movement, temperature, and mass flow rate of the tunnel entrance. The effect of the stack effect on smoke movement within small cross-section mine tunnels was studied by Fan et al. [22]. The results indicated that the diffusion of smoke was accelerated by the stack effect, leading to reduced downstream pressure. Additionally, augmenting the separation between the fire source and the inclined point, along with increasing the magnitude of the downstream slope, could decrease the smoke back-layering length.
Previous research had predominantly concentrated on a singular slope or V-shaped composite slopes tunnel, neglecting an in-depth analysis of smoke behaviors in underwater W-shaped island-crossing tunnels. Therefore, there is an immediate need for dedicated investigations in this area. This research aims to examine the distribution pattern of temperature within the tunnel ceiling and smoke spreading behavior of four typical fire source locations under the change of tunnel slopes by full-scale numerical simulations. A quantitative analysis correlating the tunnel slope, the distance from the fire source, and the mass flow rate is then carried out.
Numerical simulations of fire-induced environments have extensively utilized the fire dynamics software FDS, which has been repeatedly validated for its effectiveness through numerous studies [23–25]. FDS describes the turbulent movement by using the large eddy simulation (LES), and the controlling equations are the mass conservation equation, momentum conservation equation, and energy conservation equation [26], which are as follows:
Mass conservation equation
Momentum conservation equation
Energy conservation equation
where
This paper is based on an underwater tunnel located in Guangzhou, China, and Fig. 1 shows its longitudinal profile. The tunnel dimensions are 2000 m in length, 13.9 m in width, and 6.5 m in height, with the central longitudinal design following a W-shaped distribution, as depicted in Fig. 2. As depicted in Fig. 3, the fire source is positioned at the longitudinal center axis, with the downstream of the fire source aligned with driving direction.
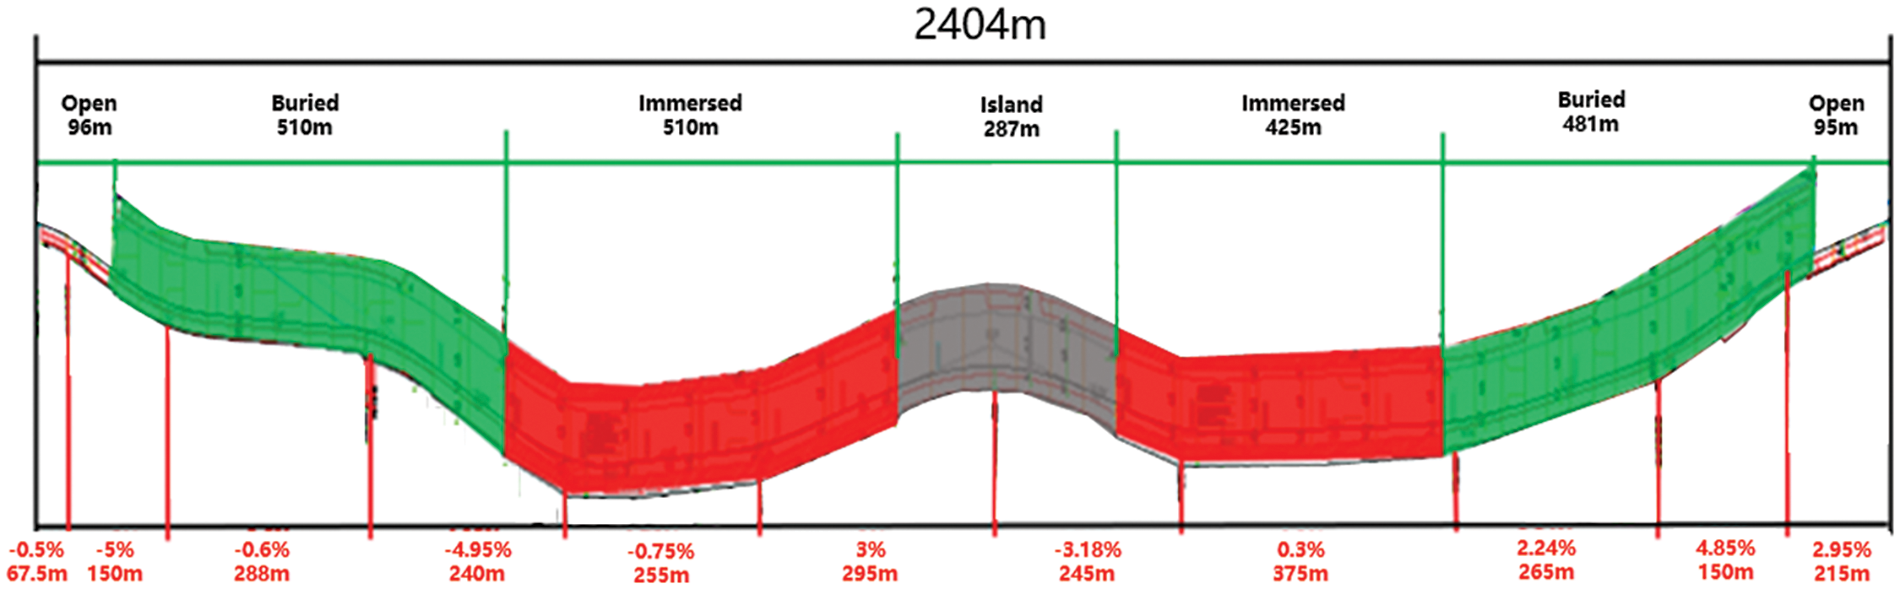
Figure 1: Actual tunnel longitudinal profile
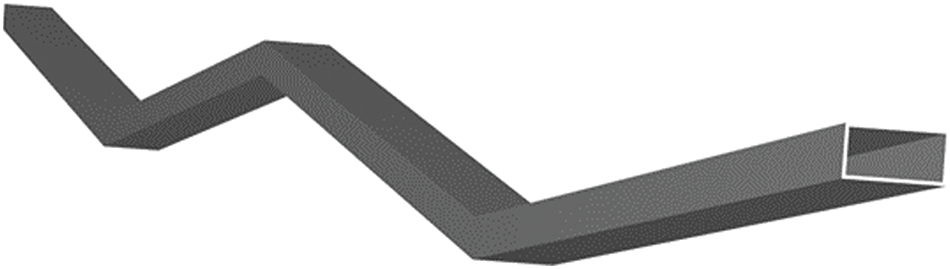
Figure 2: Schematic of W-shaped tunnel simulation model
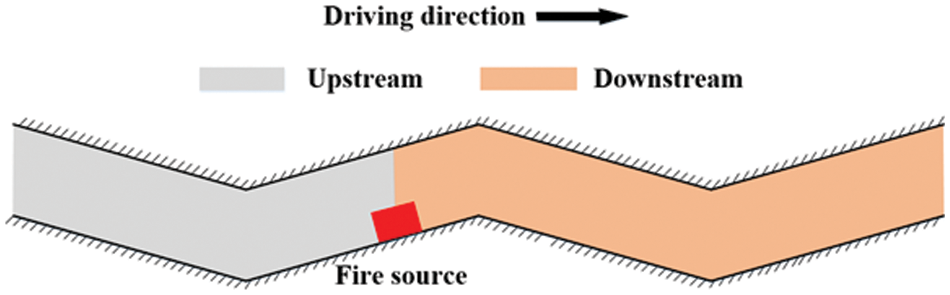
Figure 3: Upstream and downstream diagrams of fire sources
According to previous studies [27–29], the highest temperature in a tunnel is not directly below the tunnel ceiling; instead, there is a certain distance between the highest temperature and the tunnel ceiling. Fig. 4 shows the vertical temperature distribution 20 m downstream. It can be observed that, across three different slopes, the temperature reaches its maximum at 0.5 m below the tunnel ceiling. Therefore, in this study, the thermocouple for the ceiling temperature is placed at a height of 6 m, as depicted in Fig. 5.
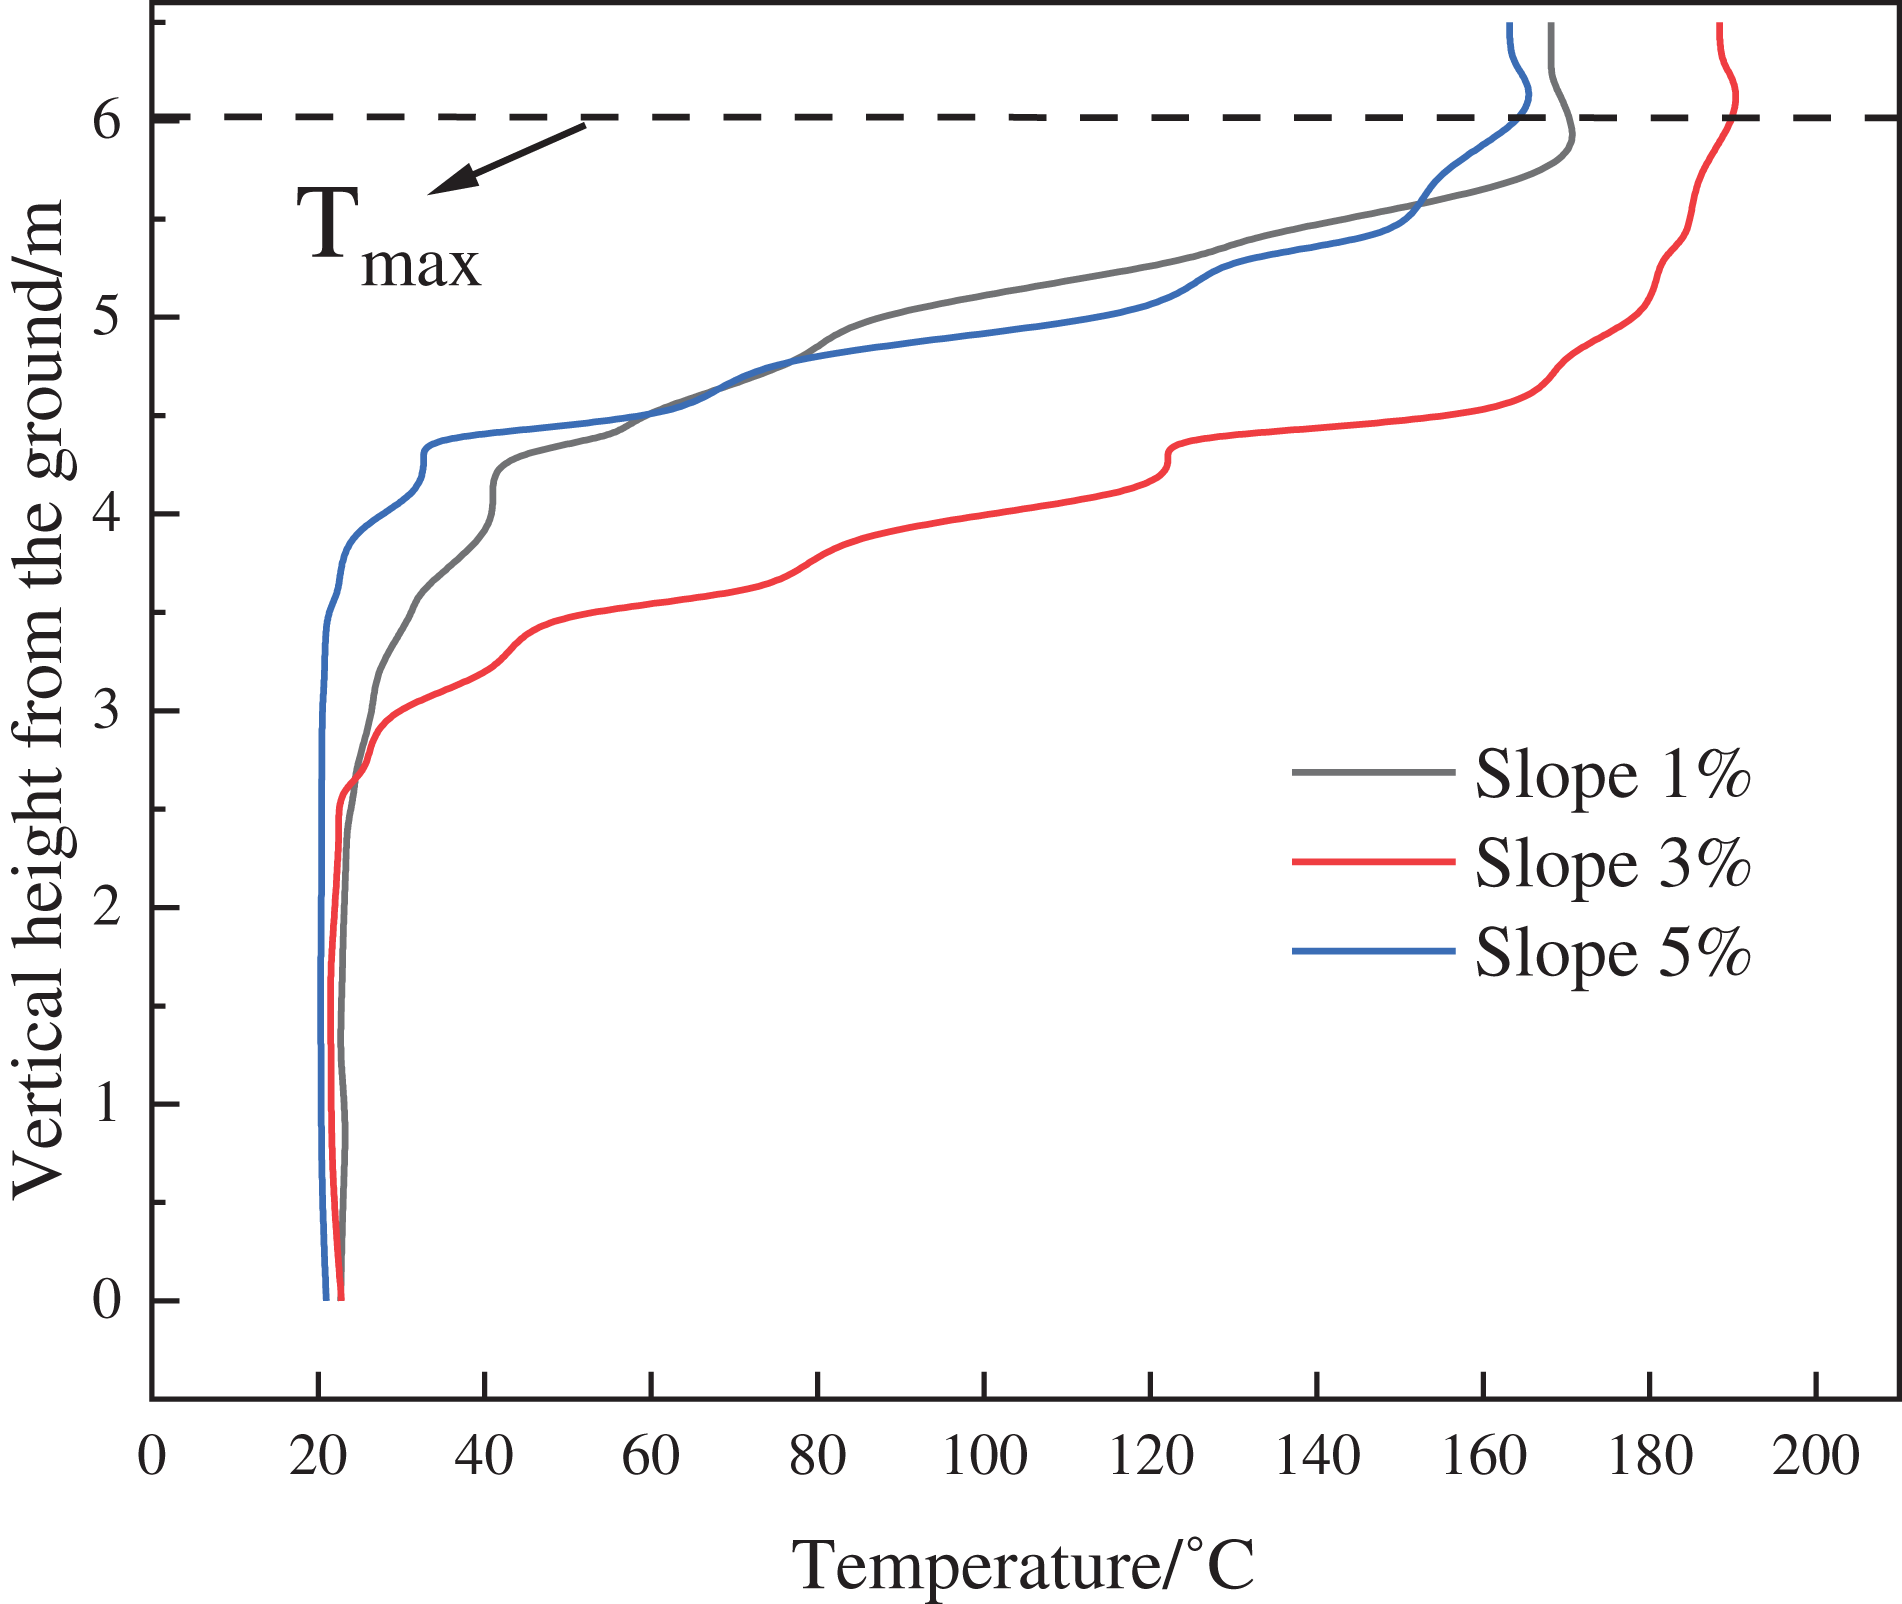
Figure 4: Vertical temperature distribution
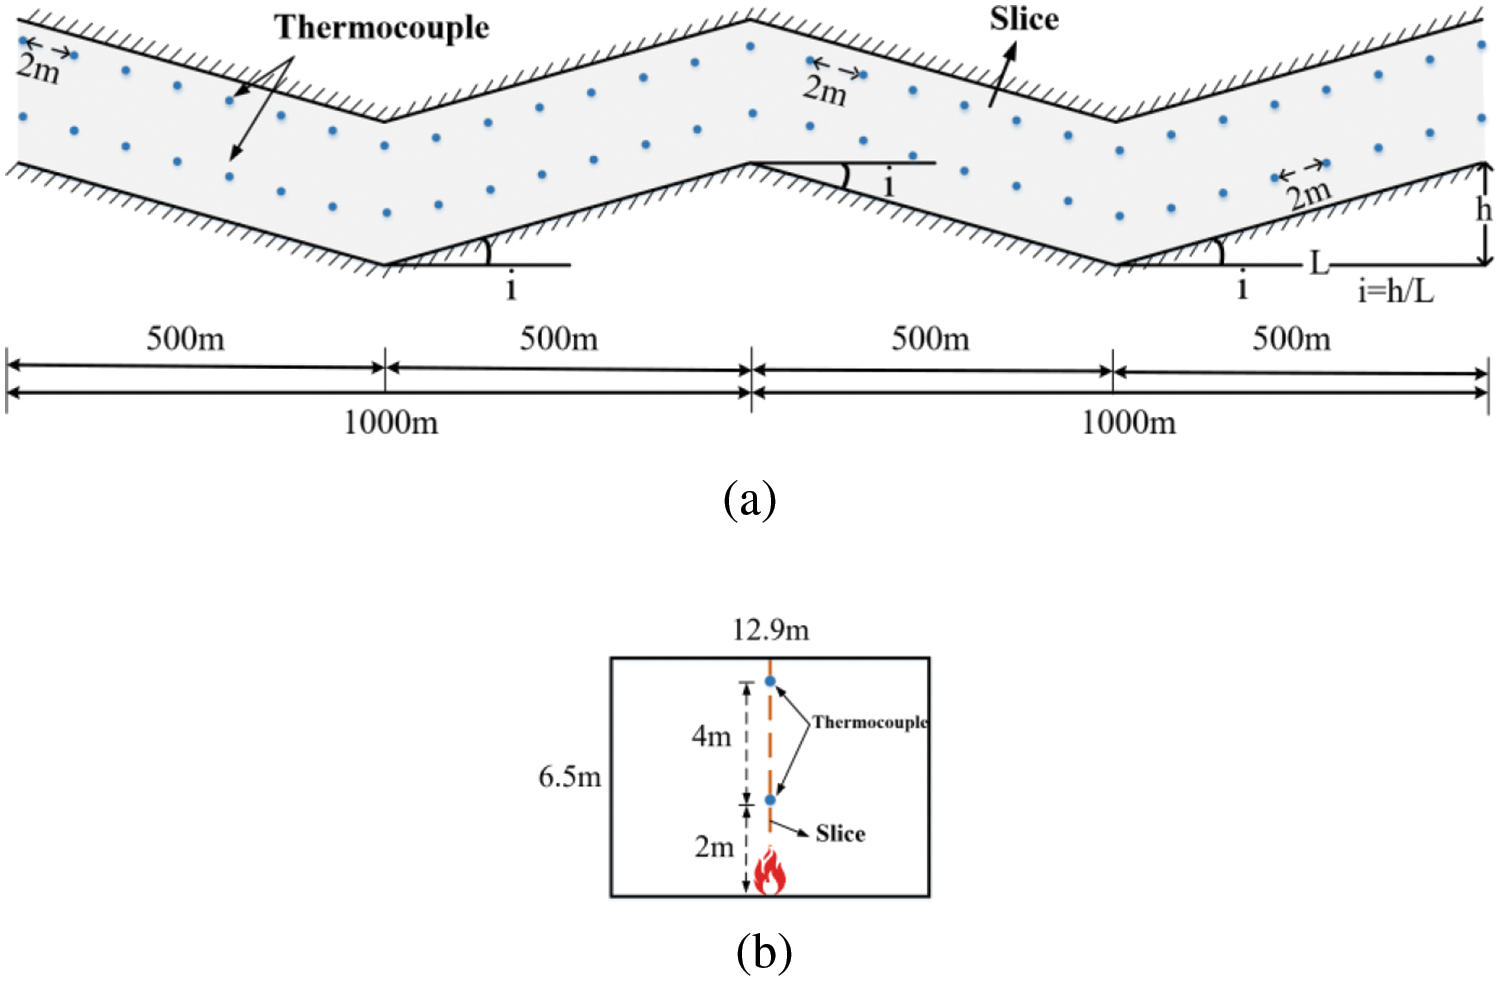
Figure 5: Schematic layout of W-tunnel measurement points: (a) longitudinal section; (b) cross-section
As shown in Fig. 5, to obtain the time taken for the smoke to settle to a height of 2 m, temperature measurement points are arranged at 2 m intervals at a height of 2 m from the ground. Slices are established longitudinally from the origin of the coordinates to capture the temperature distribution cloud map of the tunnel’s longitudinal section.
Following a fire incident in the tunnel, traffic flow may become congested, impeding downstream personnel from promptly driving away from the scene. In such scenarios, the activation of the longitudinal smoke exhaust fan might disturb smoke stratification, potentially endangering the safety of individuals and vehicles evacuating downstream of the fire. Hence, the smoke exhaust fan is not activated immediately at the onset of the fire. Instead, the smoke is allowed to disperse naturally, allowing personnel evacuation to proceed before initiating longitudinal fan. Consequently, this study focuses on studying the natural spread of smoke. Both entrances of the tunnel are naturally open, designated as the “open” sides, while the ambient temperature is kept at 20°C. The tunnel lacks longitudinal ventilation and operates with natural makeup air. The tunnel walls and floor are constructed with concrete, which exhibits the following properties: an electrical conductivity of 1.8 W/(m·K), a density of 2280 kg/m³, and a specific heat capacity of 1.04 KJ/(kg·K).
According to the Code for Design of Urban Road Engineering [30], the maximum allowable longitudinal slope for highway tunnels should not surpass 3%. However, this limit can be slightly adjusted, provided it does not exceed 5%. Therefore, a total of five groups of slopes are set in the simulation, which are 1%, 2%, 3%, 4%, and 5%, and the absolute value of the slope is the same for the whole tunnel. L is the distance between adjacent variable slope points of the tunnel, and the tunnel maintains a symmetrical structure by taking L1 = L2 = L3 = L4 = 500 m. The location of the specific fire source is illustrated in Fig. 6, respectively:
1. midpoint of L1–referred to as the Downhill;
2. junction L1 and L2–referred to as V-point;
3. midpoint of L3–referred to as the Uphill;
4. junction of L3 and L4–referred to as Inverted V-point.
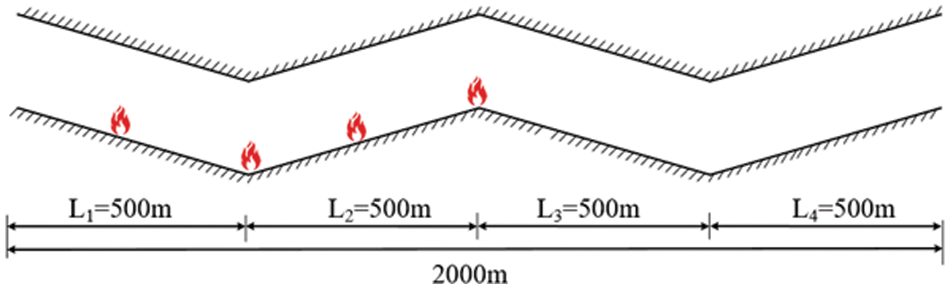
Figure 6: Schematic diagram of fire source location
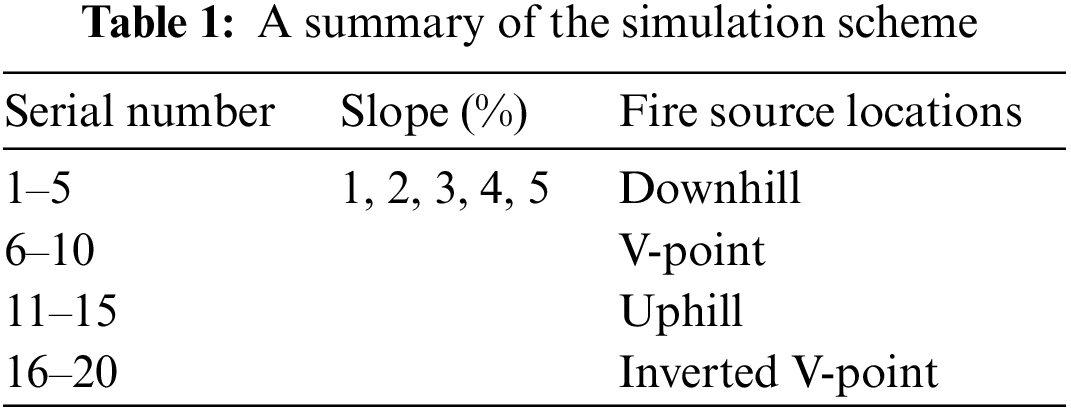
Table 1 presents the simulation working conditions, comprising 20 groups. The primary variables considered are the tunnel slope and the fire source location, which adopts the t2 growth model, and the heat release rate is set as 20 MW. The fire source dimensions are 6 m × 2 m × 1 m in length × width × height. The model accommodates a maximum of 3.4 million meshes for a tunnel slope of 5%. The fuel utilized is propane, with a combustion calorific value of 1.31 × 10⁴ kJ/kg and a smoke production rate of 0.01. The total simulation duration is 1200 s (20 min). At 800 s into the combustion, the data results indicate that the temperature and other parameters within the tunnel have stabilized. The average value between 800 and 1200 s is selected for the study, representing the average value during a quasi-steady state.
2.3 Sensitivity Study on the Grid System
As per the FDS calculation guidelines, the grid size directly impacts the accuracy and reliability of the simulation results.
Based on the examination of prior simulation outcomes, it has been noted that when the grid size is set within the range of D*/16 to D*/4 (where D* represents the characteristic diameter of the fire source), the simulation results exhibit a favorable agreement with the experimental data [26]. The value of D* could be determined by using Eq. (4), which is expressed as follows:
where Q is the heat release rate (kW),
As per Eq. (4), the effective interval of the grid size could be calculated as 0.8 to 3.2 m. After careful consideration, the grid sizes selected for the grid independence analysis ranged from 0.35 to 0.5 m at 0.05 m intervals, in addition to 0.6 and 0.75 m. Fig. 7 is the vertical temperature distribution at 30 m downstream from the fire source for various grid sizes. As observed in Fig. 7, the temperature profiles exhibit a gradual convergence as the grid size is decreased. Notably, the temperature profiles at a grid size of 0.45 m closely resemble those at 0.4 and 0.35 m, indicating a significant overlap. Taking into consideration that smaller grid sizes result in a higher overall number of grids, which in turn increases the time and resources required for computation, a grid size of 0.45 m × 0.45 m × 0.45 m has been selected. This decision was made to strike a balance between obtaining detailed results and saving computational time.
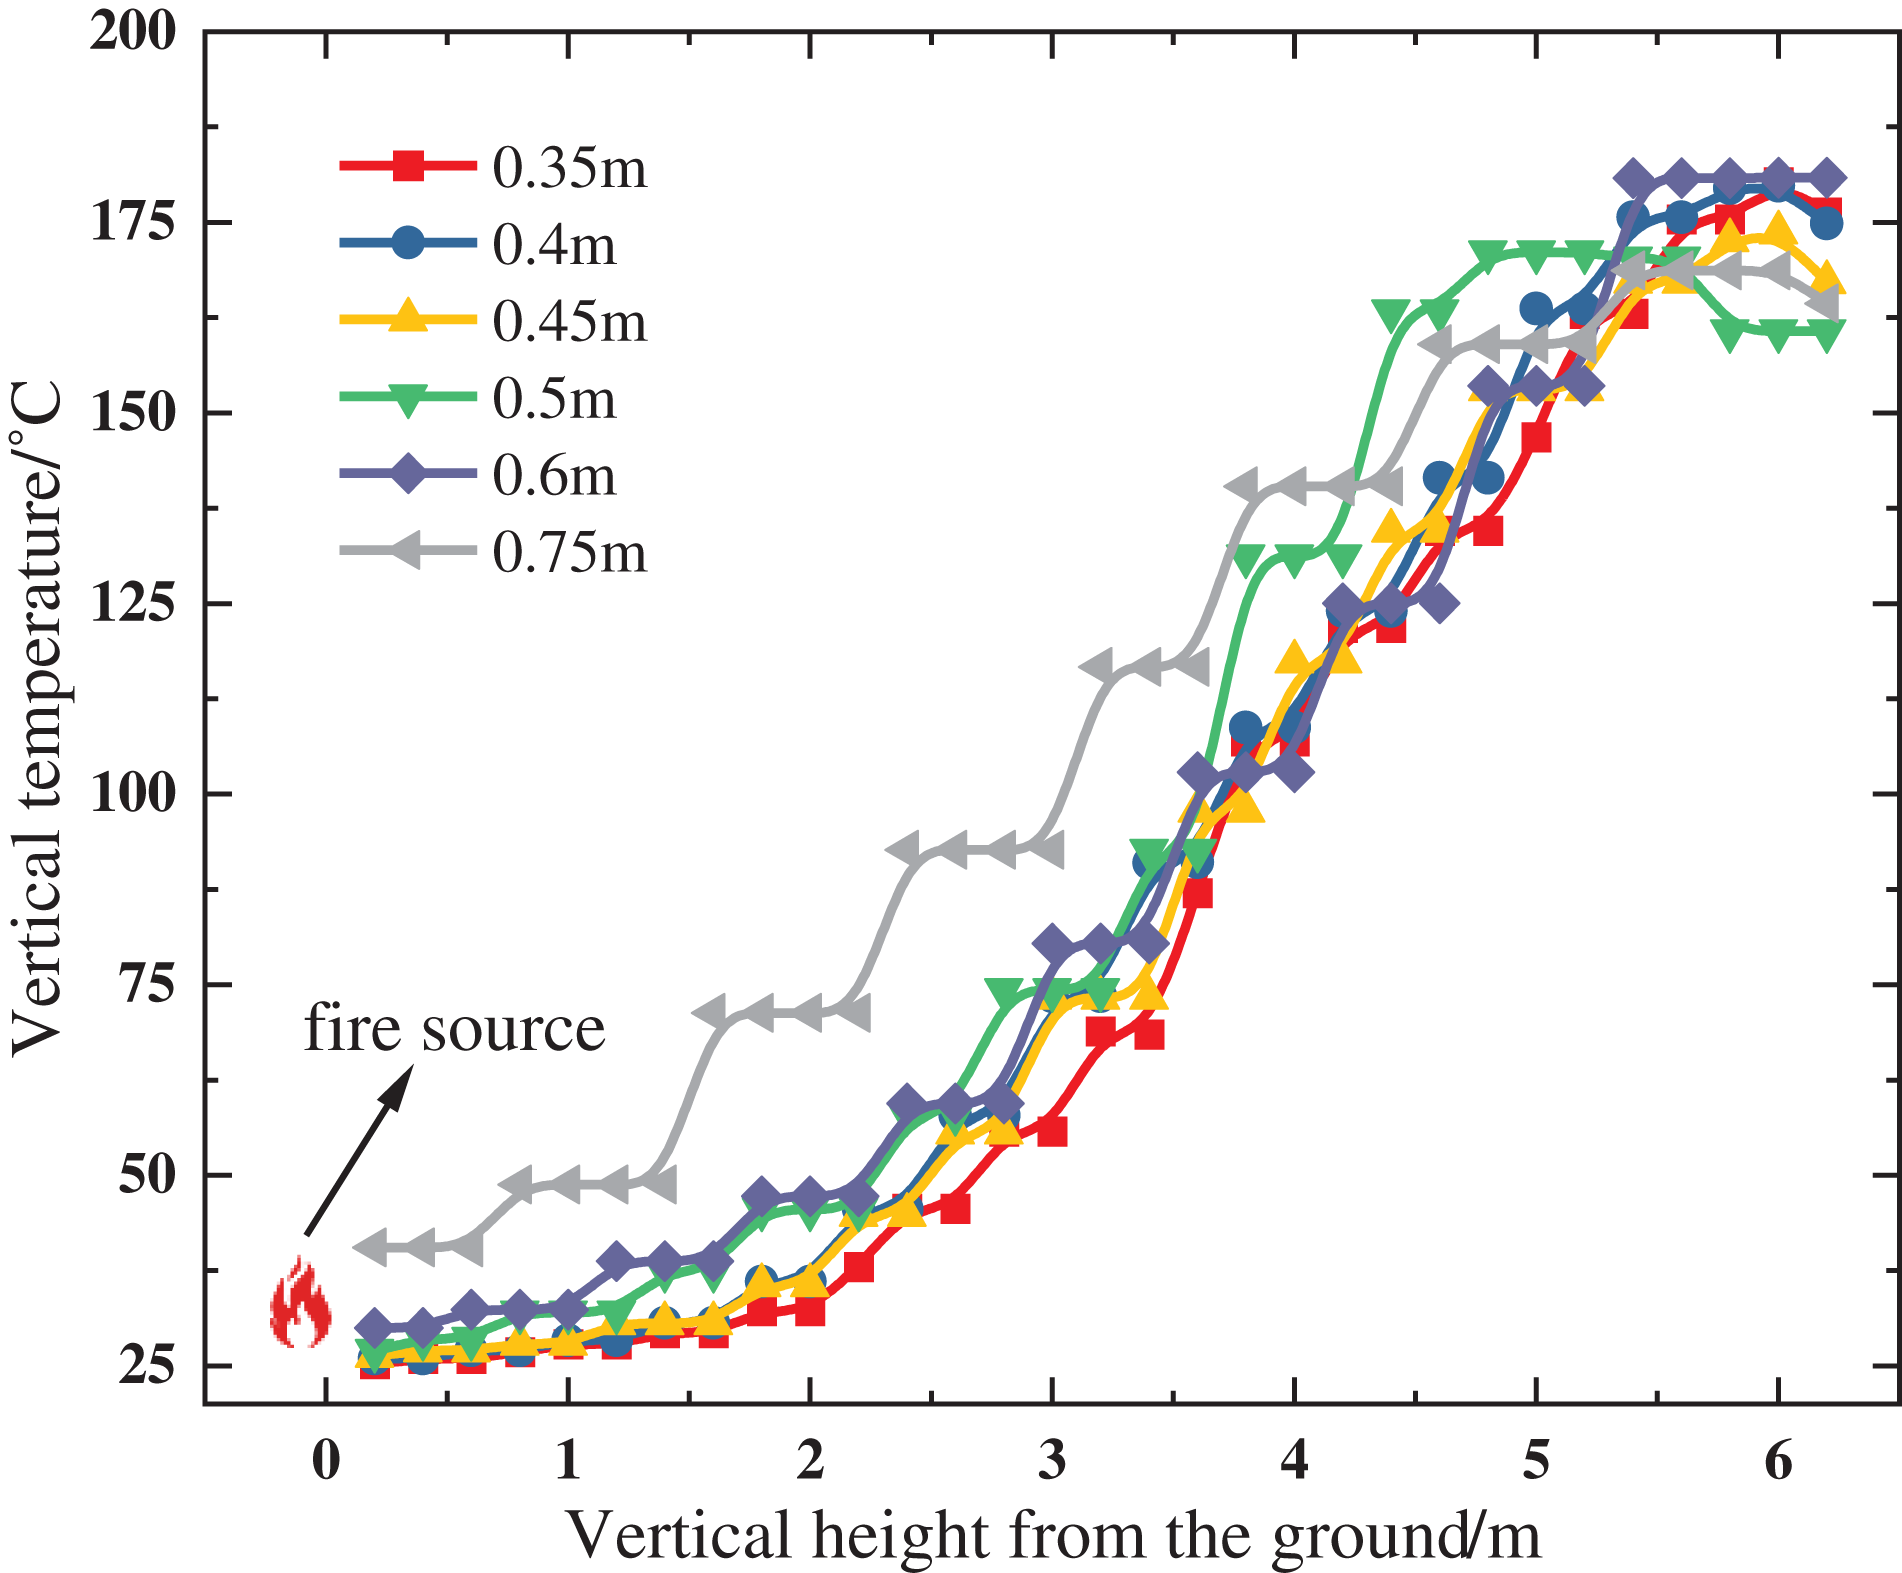
Figure 7: Vertical temperature distribution at 30 m from the fire source with different grid sizes
To validate the numerical simulation’s accuracy, a small-scale physical model with a scale of 1:30 was established based on the Froude scaling law. The specific device is depicted in Fig. 8. The total length of the model is 10.83 m, with a cross-section size of 0.64 m by 0.21 m. The fire source was positioned at the center of the tunnel. Propane was used as the fuel, and the power of the fire source was controlled by a gas mass flow controller. According to Froude similarity theory [31], the relationship between heat release rate of fire and scale (
where m stands for model and p stands for full-scale. For the validation experiment, full-scale fire source powers of 10 and 20 MW were selected. The corresponding model fire source powers of 1.01 and 4.06 kW were determined through calculations based on Eq. (5).
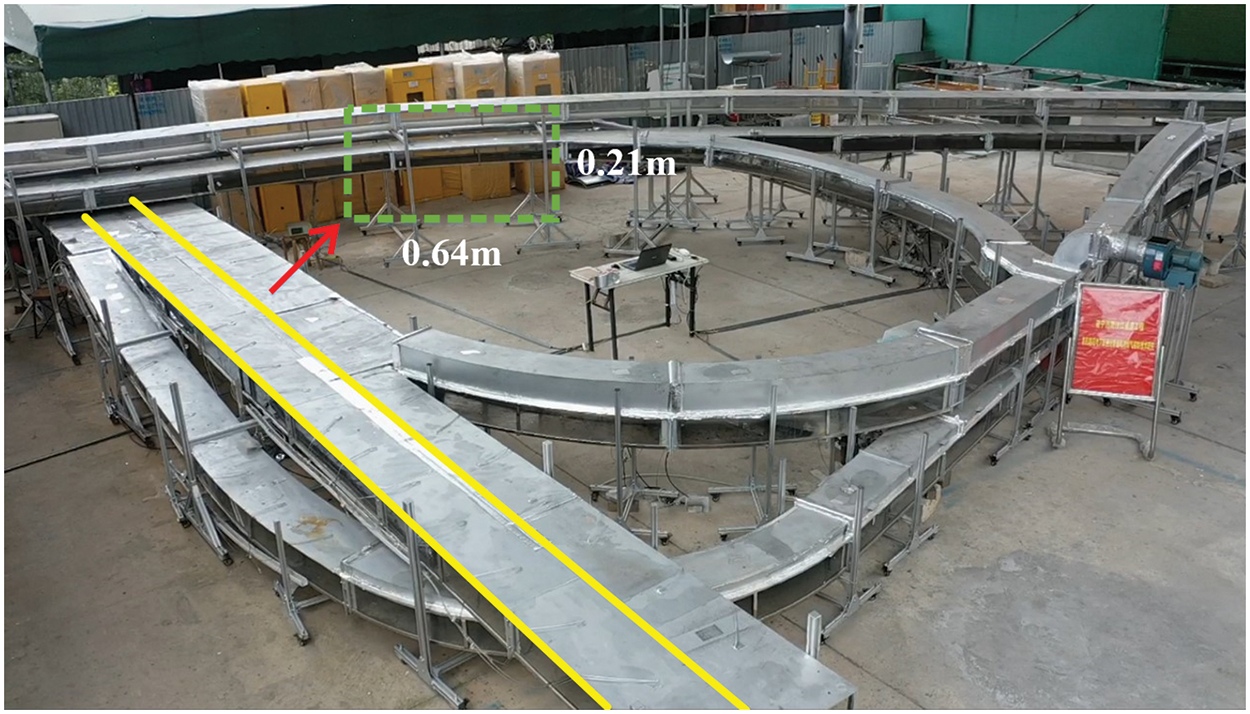
Figure 8: Small-scale tunnel apparatus
The heat release rate of the fire source, which is the product of the combustion efficiency, the heat of combustion of the fuel, and the mass flow rate of the combustion, can be calculated using Eq. (6) [32].
where
The boundary conditions in the numerical simulation are maintained identical to those of the test, and a mesh size of 0.45 m × 0.45 m × 0.45 m is employed consistently in the simulation. In Fig. 9, the comparison of the ceiling temperature between the test and the numerical simulation is presented. It can be observed that the trend of the test and simulation data is consistent, and the error falls within an acceptable range. The findings depicted in Fig. 9 affirm the reliability of the numerical simulation. The lower temperature observed in the test compared to the simulation may be attributed to the influence of ambient wind.
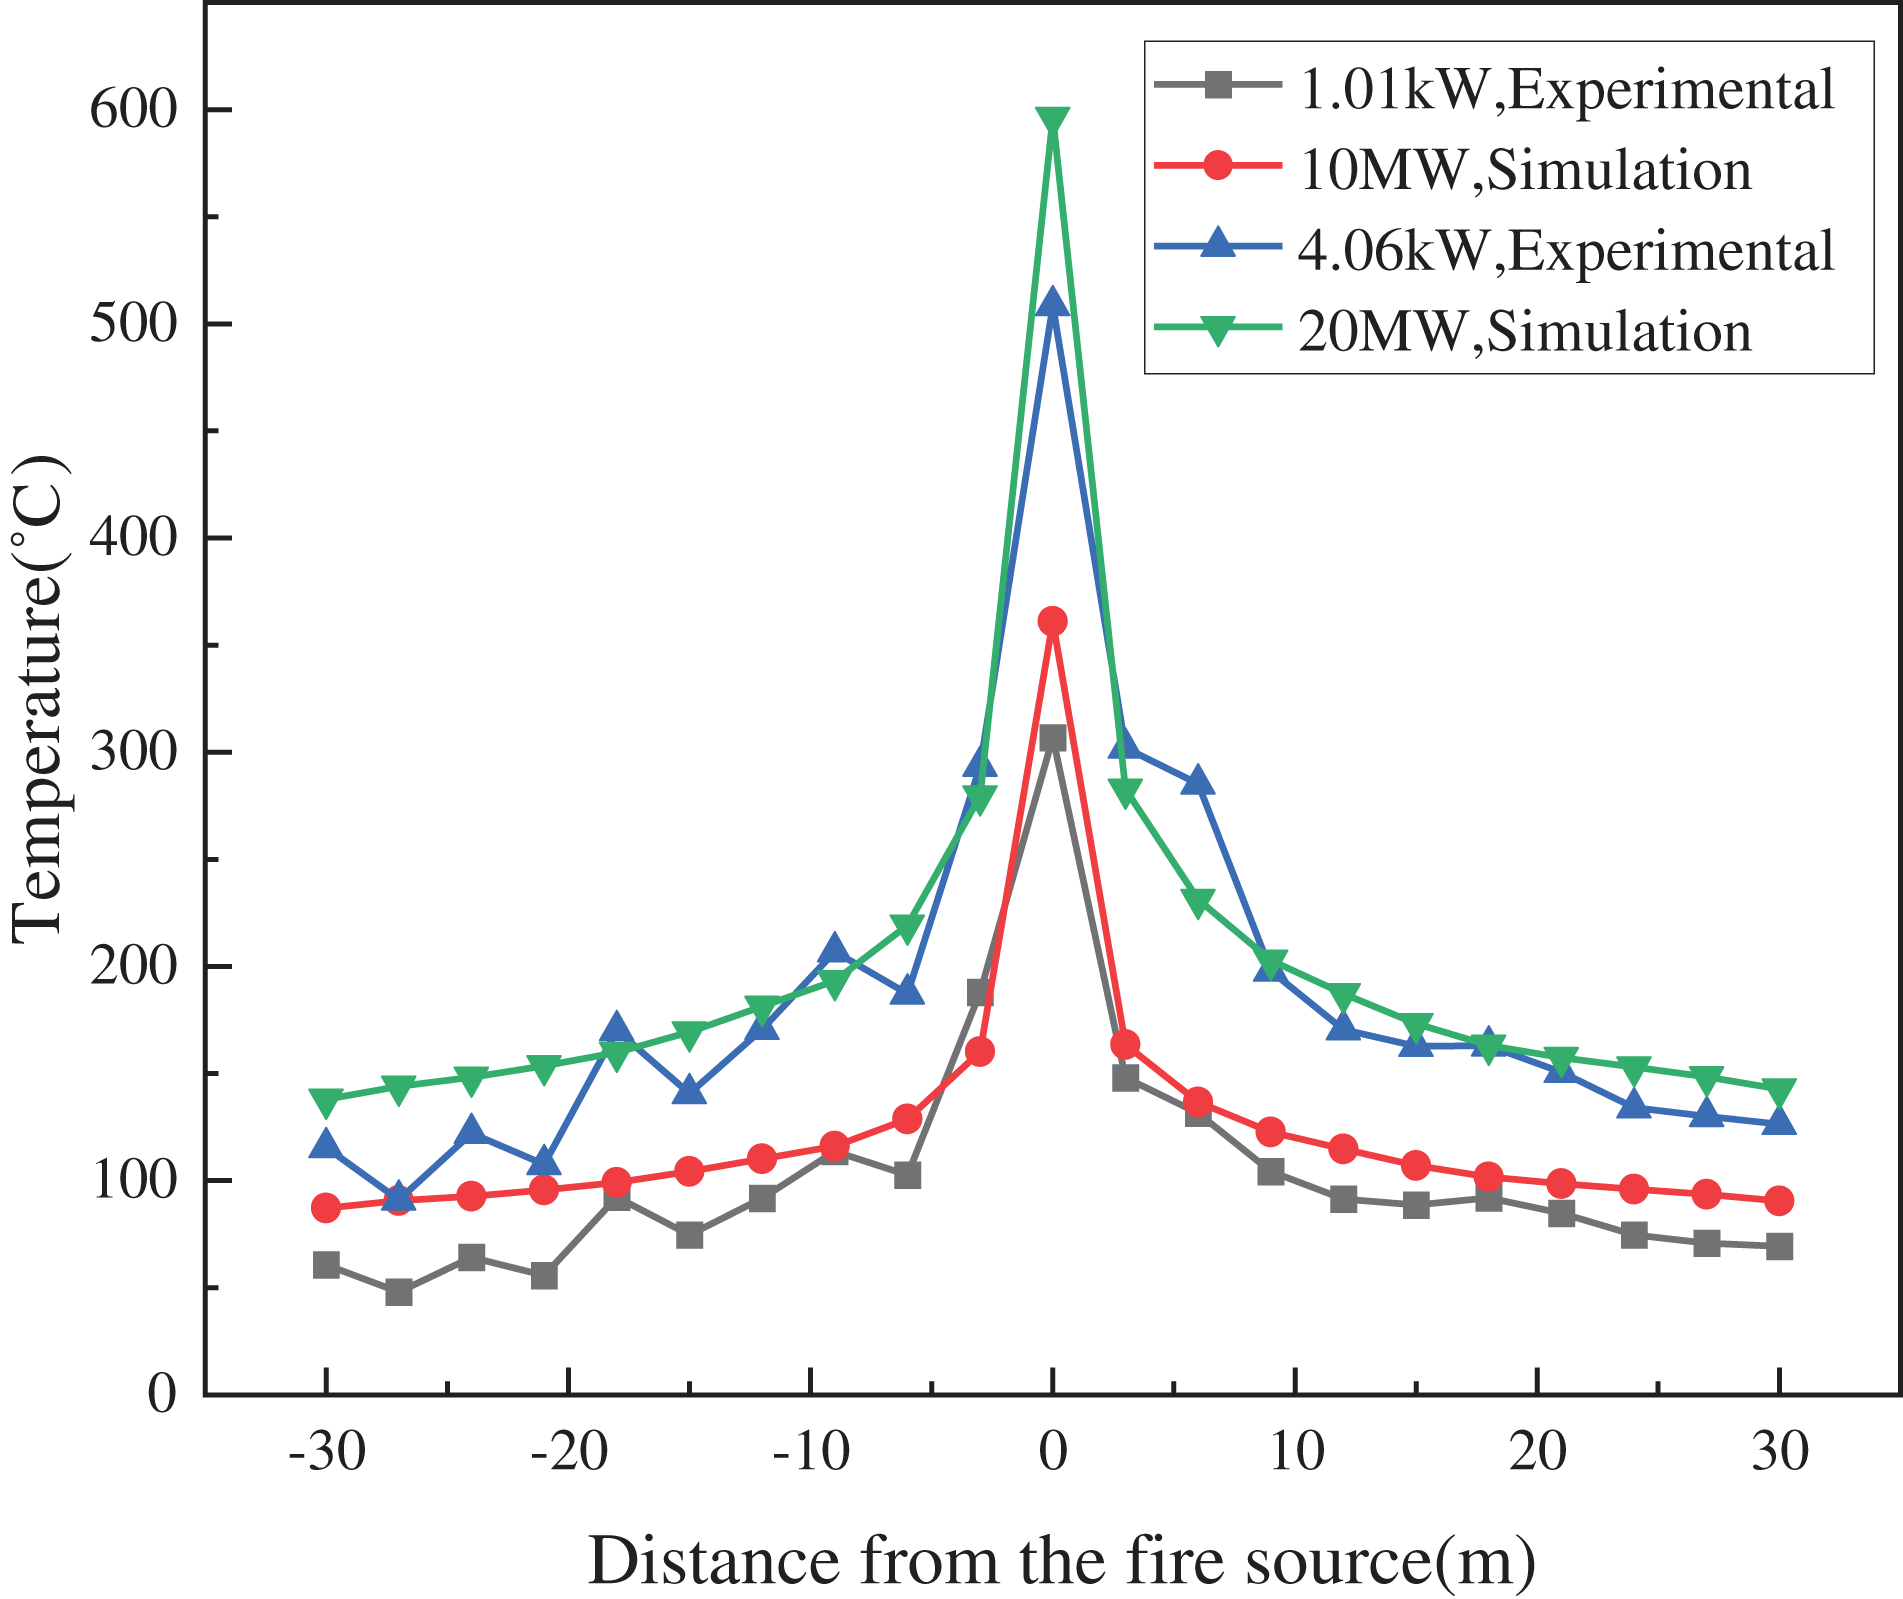
Figure 9: Comparison of small-scale experiment and simulation
3.1 Distribution Characteristics of Temperature Field of Ceiling
Fig. 10 displays the longitudinal temperature distribution at 40 m on each side of the fire source in the tunnel. The temperature pattern during the fire is summarized as follows: the hot area in the upstream direction exhibits an almost parallel alignment with the top structure of the tunnel. Conversely, the hot area in the downstream direction demonstrates a parallel orientation to the horizontal plane.
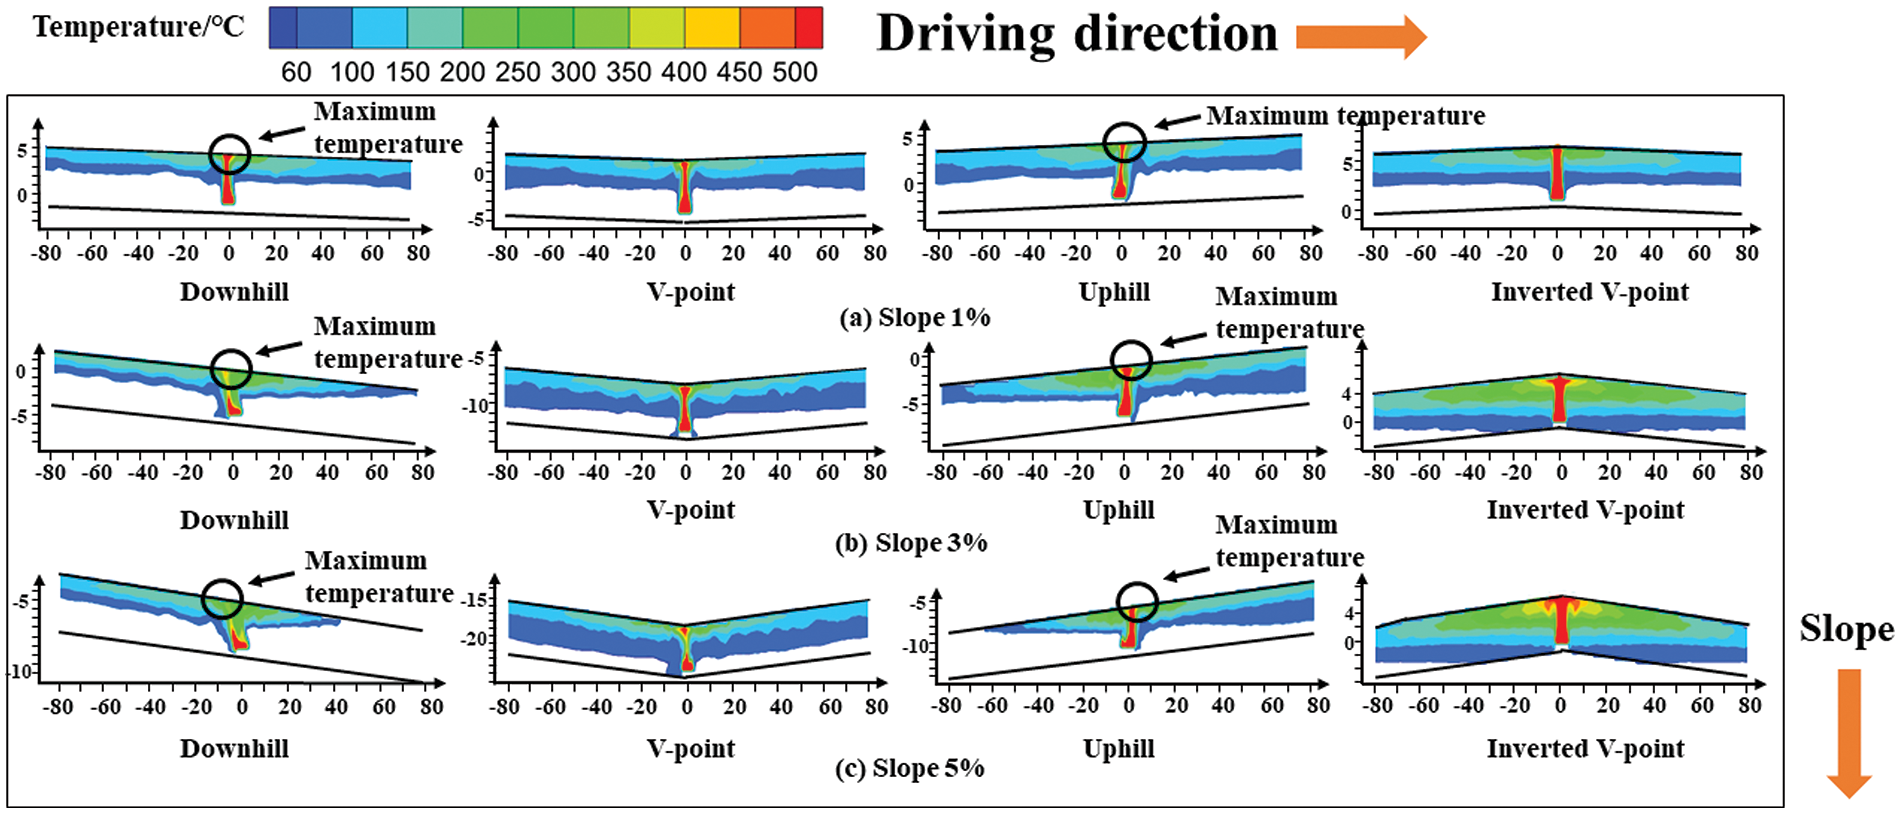
Figure 10: Temperature distribution in the longitudinal plane of the tunnel under steady state
The observed phenomena could be primarily attributed to the influence of two forces, the horizontal inertia force and the buoyancy force, which act on the less dense smoke during the spread process. As shown in Fig. 10c at the V-point, when the smoke moves toward the upstream direction, it becomes evident that the buoyancy force plays a dominant role compared to the horizontal inertia force. Thus, driven by buoyancy, the hot area is almost parallel to the tunnel ceiling. During the spread in the downstream direction, the smoke layer encounters hindrance from various factors, including the horizontal momentum, buoyant force, and tunnel ceiling. Consequently, over time, the smoke layer gradually accumulates and thickens. Furthermore, due to the influence of the airflow generated by the stack effect in the upstream direction, the hot area eventually becomes parallel to the horizontal plane. The closer to the fire source, the thicker the layer of hot smoke.
With the increase in slope, the distribution of high-temperature areas undergoes a gradual transition from symmetrical to asymmetrical when the fire occurs Downhill or Uphill. However, the high-temperature areas at locations V-point and Inverted V-point maintain a relatively symmetric distribution. In the event of a fire outbreak at the Downhill, the thickness of the smoke layer along the downstream direction gradually decreases with an increase in slope, ranging from 1% to 5%. As the tunnel inclines, the flame pattern also inclines relative to the tunnel. This, coupled with the intensified chimney effect due to the heightened slope, leads to the upward shift of the highest temperature location towards the tunnel entrance. Similarly, the ceiling maximum temperature was shifted toward the downstream (uphill direction) direction of the fire of Uphill. In contrast, the hot area temperature was essentially unshifted when the fire was in the V-point and Inverted V-point.
The ceiling temperature distribution at different slopes for four typical fire source locations is shown in Fig. 11. From the figure, it is clear that the difference in temperature distribution under various locations is particularly small when the slope is 1%. Moreover, as the slope increases, the augmentation of the chimney effect exerts a more substantial influence on the temperature distribution. If a fire breaks out in the Downhill and Uphill, temperature distribution along the uphill direction and the downhill direction is basically consistent and symmetrical. In the case of the V-point, where flames are positioned at the grade-change point, the length and degree of inclination of both sides of the tunnel slope are identical, albeit in opposite directions. Consequently, the temperatures upstream and downstream of the flame exhibit a symmetrical pattern. Similarly, in the Inverted V-point, symmetry is also maintained for the same reasons.
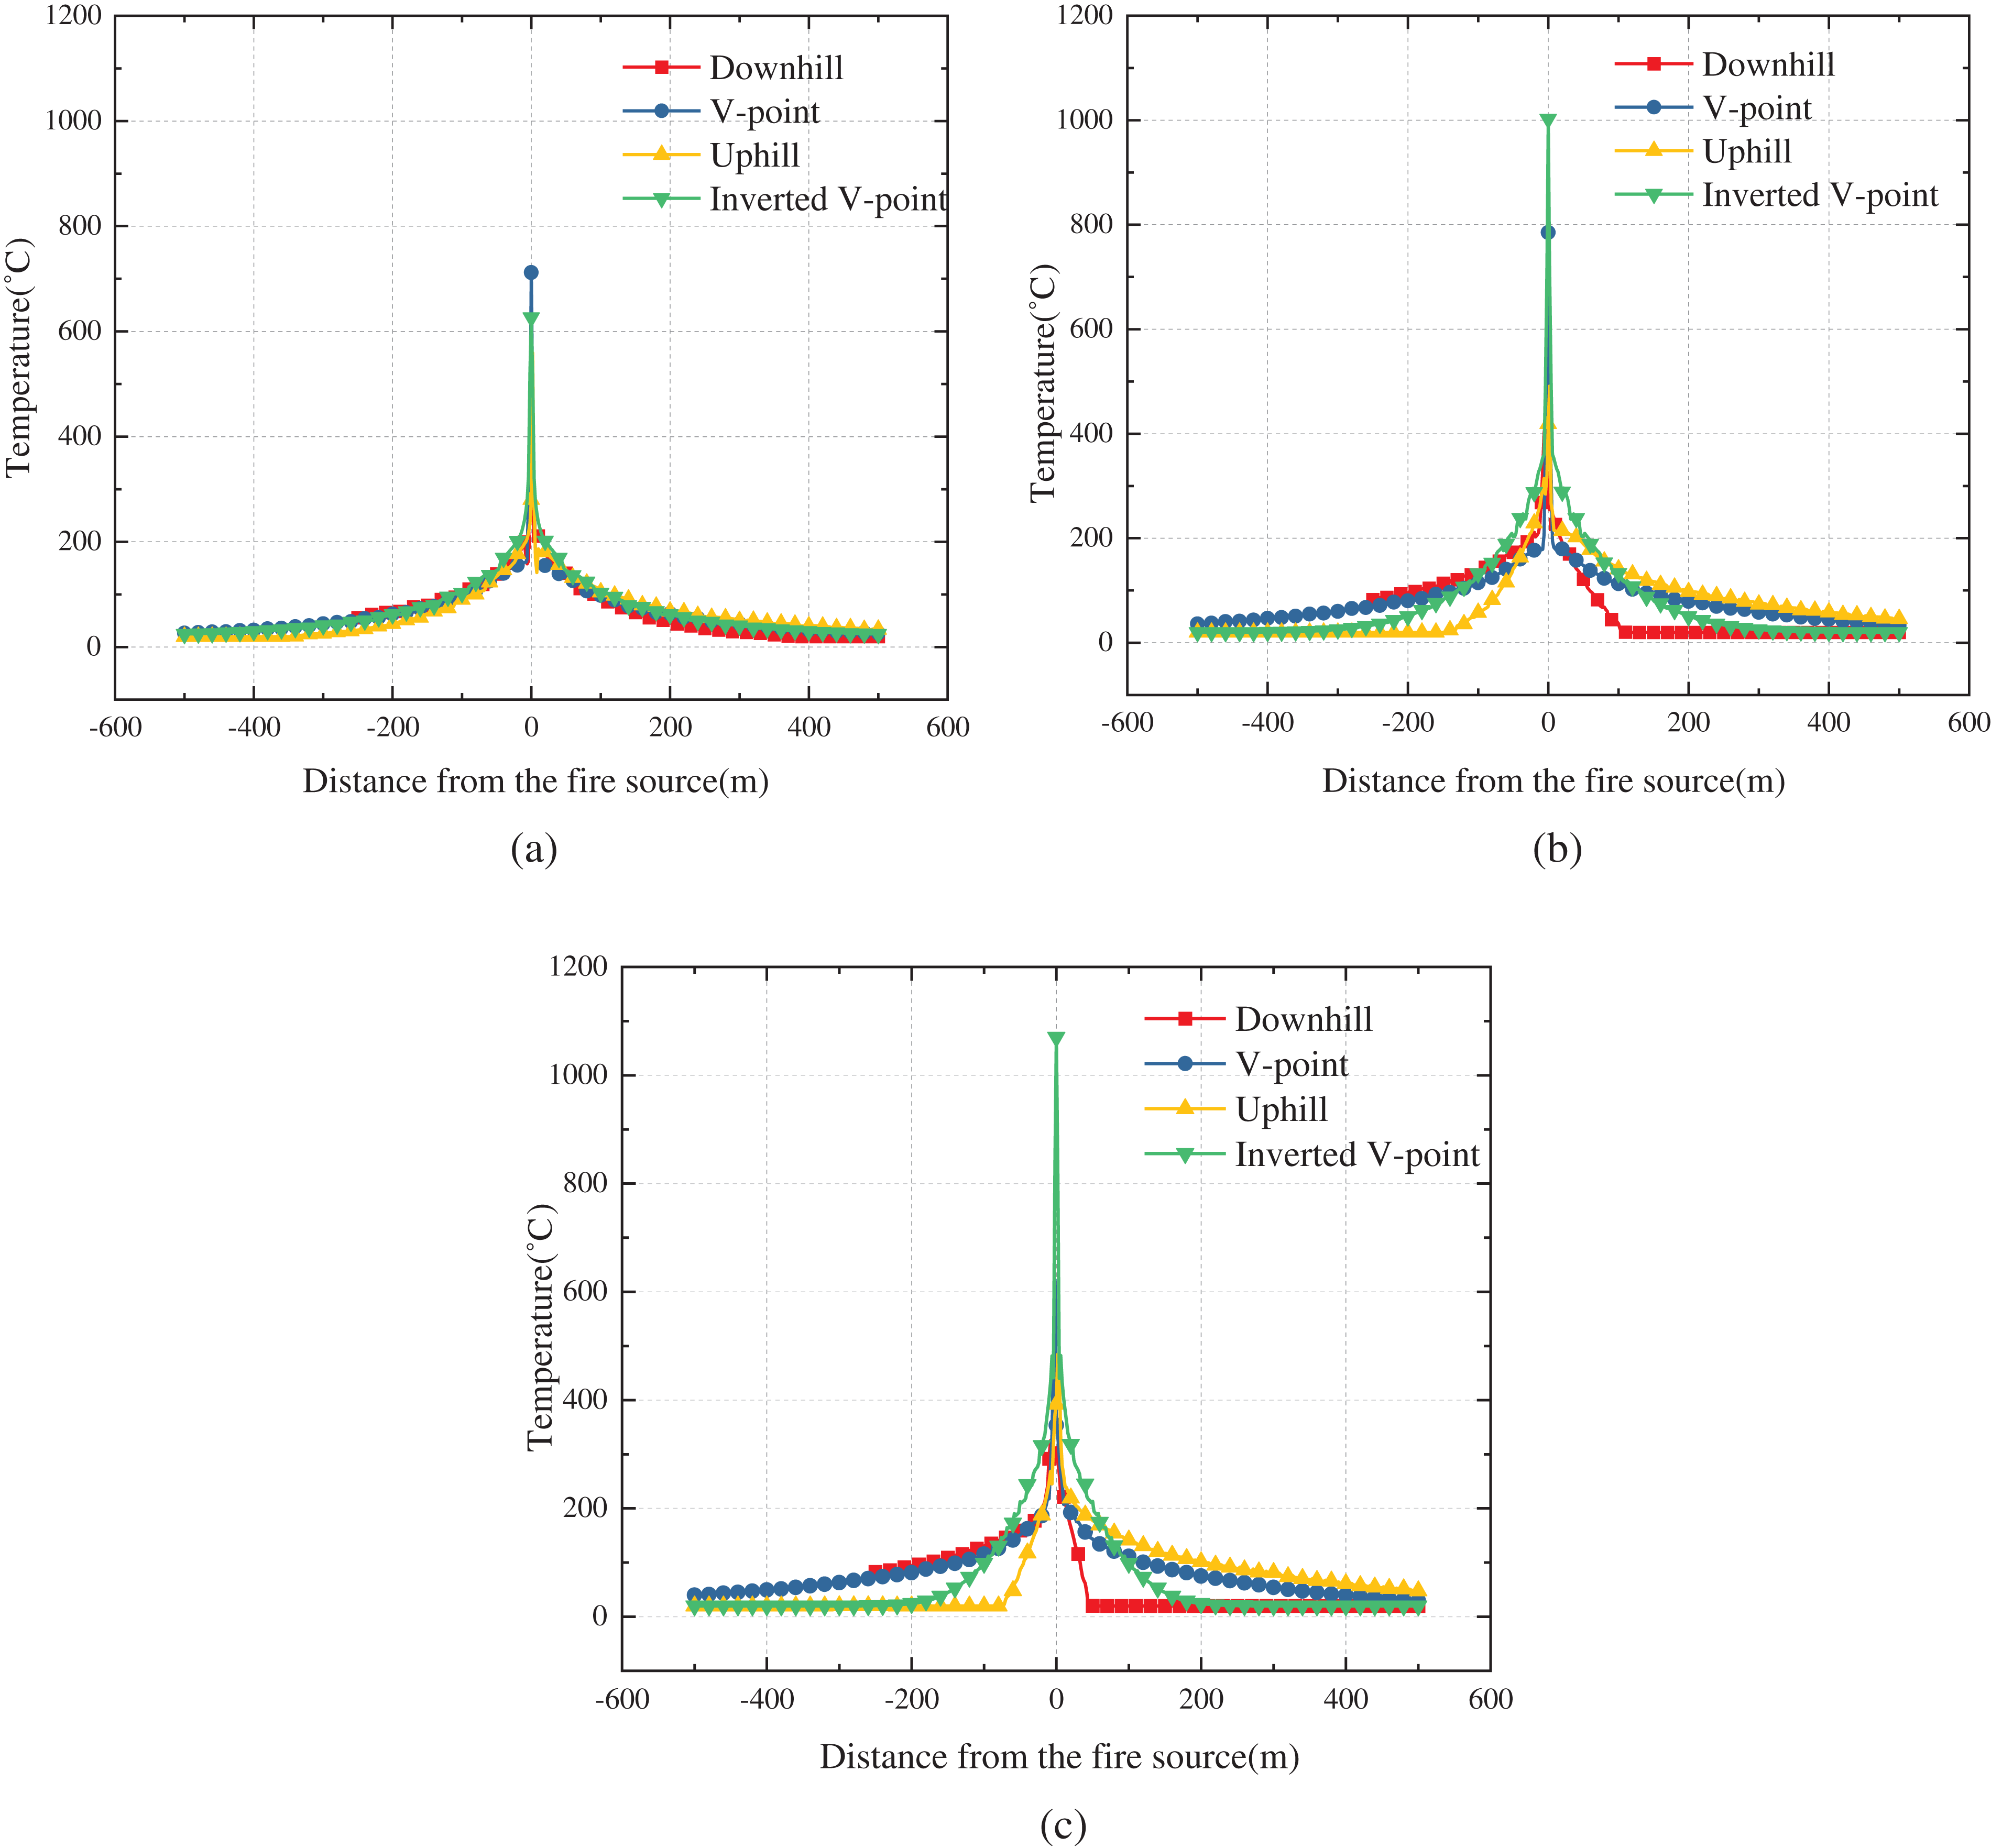
Figure 11: Temperature distribution of the ceiling at four typical fire locations: (a) slope 1%; (b) slope 3%; (c) slope 5%
It can also be noticed that the temperature decay gradient is more gradual at the V-point compared to the Inverted V-point, as shown in Fig. 11b, c. In the scenario of a fire starting at the V-point, smoke moves in the uphill direction on both sides. The chimney effect acts as a driving force, leading to the parallel spread of high-temperature smoke along the tunnel ceiling, resulting in a relatively wide distribution range. At the Inverted V-point, smoke flows downhill on both sides. However, the chimney effect acts as resistance in this scenario. Consequently, the smoke layer tends to align parallel to the horizontal ground, concentrating around the source of the fire.
From the analysis above, it can be observed that the chimney effect exerts a significant impact on the temperature field. The chimney effect refers to the influence of the difference in the density of the gas inside and outside the building; the smoke rises along the space with a slope upward, which is also known as the heat-pressure effect. The essence of the chimney effect is the heat-pressure difference. Ingason et al. [33] suggested employing the tunnel average temperature method to calculate the thermal pressure difference. The formula is shown below:
where L is distance from every two grade-change points in the horizontal direction (m), i is tunnel slope (%), g is gravitational acceleration (m/s2), Tm is smoke average temperature (K), and T is ambient temperature (K).
where
Fig. 12 illustrates the variation of thermal pressure difference downstream of the flame at various slopes when the V-point occurs in a fire. During this scenario, the downstream smoke moves in the uphill direction, so the thermal pressure difference is powered, which is shown as a positive value. From the figure, it can be obtained that the magnitude of the thermal pressure difference is directly proportional to the slope, which is consistent with the previous analysis. At a slope of 5%, the thermal pressure difference peaks at 157 Pa, whereas it registers only 41 Pa at a slope of 1%.
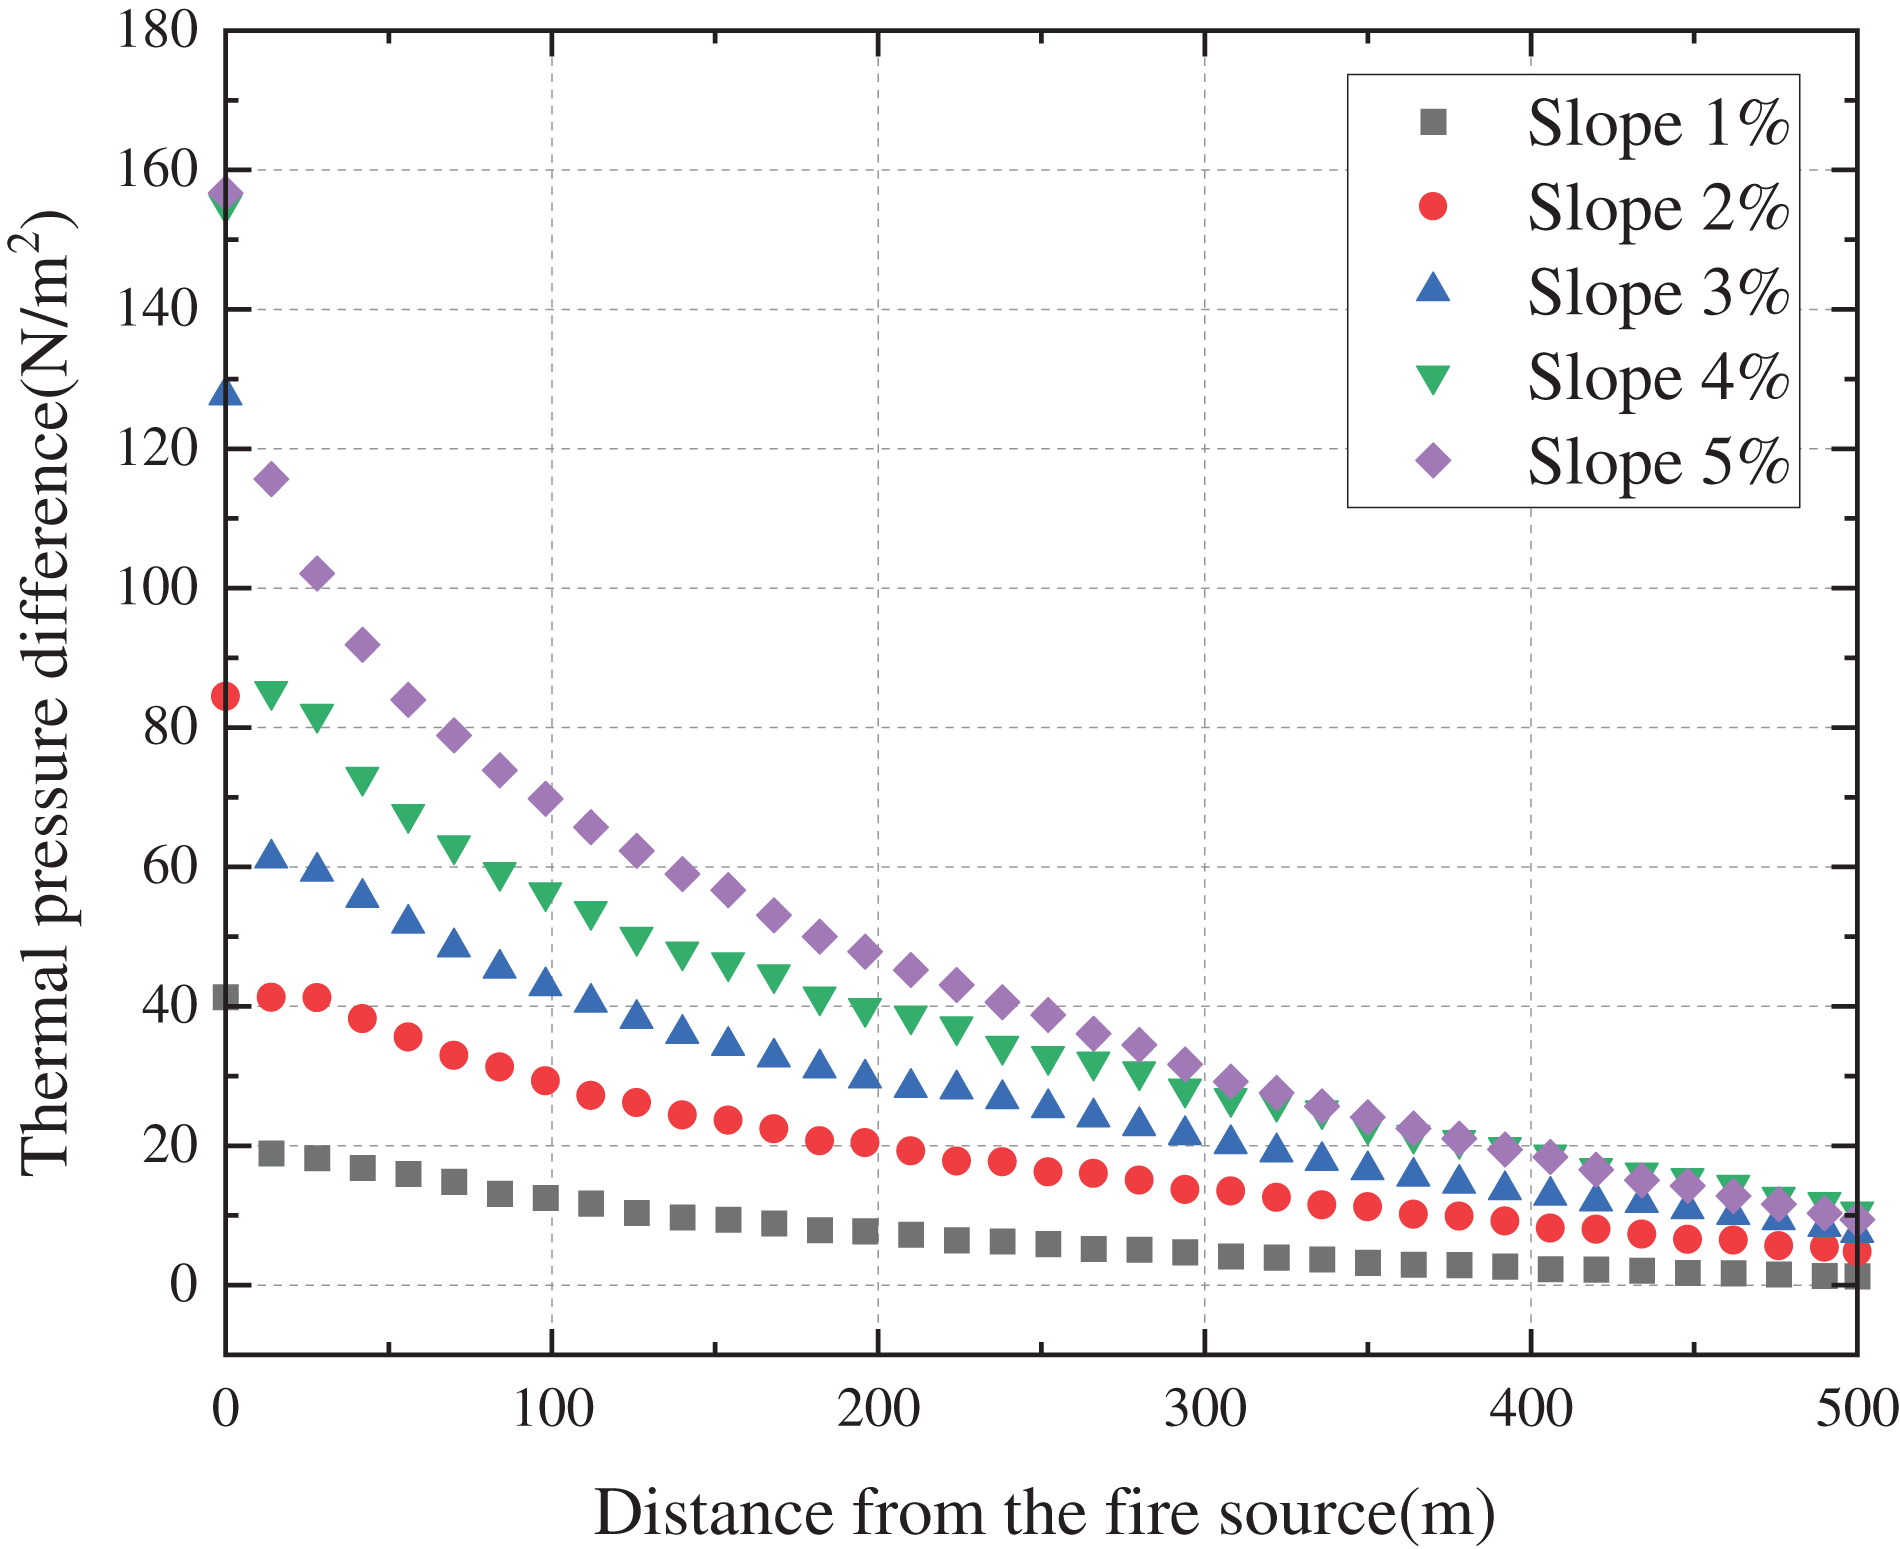
Figure 12: Variation of thermal pressure difference downstream of the fire source at different slopes
Fig. 13 shows the time required for smoke to propagate 250 m downstream of the flame at various fire source locations with a tunnel slope of 1%. Observations indicate as the fire source progressively shifts from the left tunnel entrance, the time required for spreading initially decreases and then increases. This trend suggests that the movement speed of smoke in the longitudinal direction first increases and then decreases. This phenomenon occurs because when the fire occurs Downhill, the downstream smoke is obstructed, slowing its spreading speed. Conversely, in case of a fire occurring at the V-point, the downstream smoke is propelled upward along the tunnel by thermal buoyancy. In this scenario, the thermal pressure difference serves as the driving force, resulting in faster spread compared to the location Downhill. It is also worth noting that VUphill > VV-point, possibly because when the fire occurs at Uphill, the downstream ceiling temperature at the same distance is higher, intensifying the positive effect caused by the thermal pressure difference. Consequently, less time is required for spread.
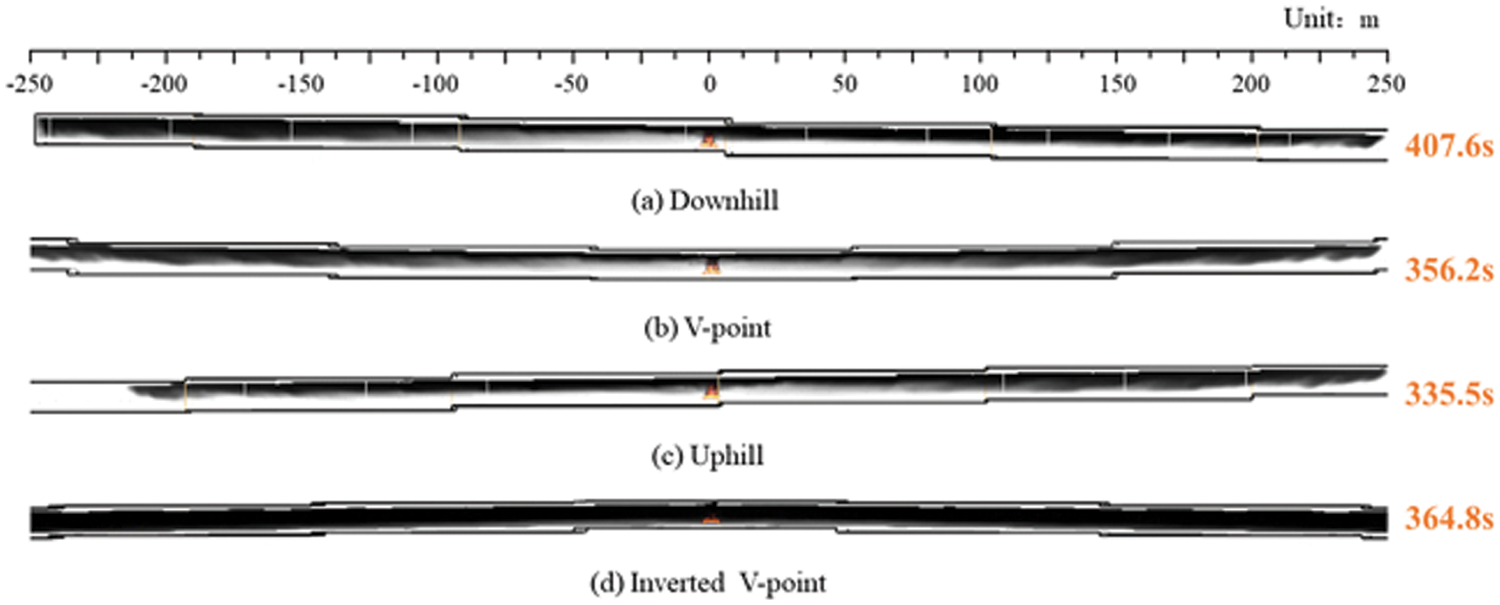
Figure 13: Time taken for smoke to spread to 250 m downstream from different fire locations at 1% slope
In addition to the spreading rate of smoke, the mass flow rate has also received attention from scholars. Previous researcher [21] have investigated the mass flow rate in a V-slope tunnel, concluding that when the grade-change point has a fire, the relationship between the mass flow rate at the upstream exit and the slope and the power of the fire source is
where
W-shaped tunnels are multi-slope composite tunnels with inverted V-point in addition to the V-point. As shown in Fig. 14, the smoke mass flow rate and slope are negatively correlated when located in inverted V-point; specifically, the greater the slope, the smaller the smoke mass flow rate at the same distance from the fire source. This is because the greater the slope, the greater the thermal pressure difference. At the upstream of the fire source at the inverted V-point, the slope is negative, making the thermal pressure difference act as resistance, thus reducing the mass flow rate at the same location. Fig. 15 demonstrates a negative correlation between the smoke mass flow rate and the distance from the fire source. As the smoke spreads, its temperature gradually decreases, and the smoke settles while moving, resulting in a reduced mass flow rate at greater distances from the fire source.
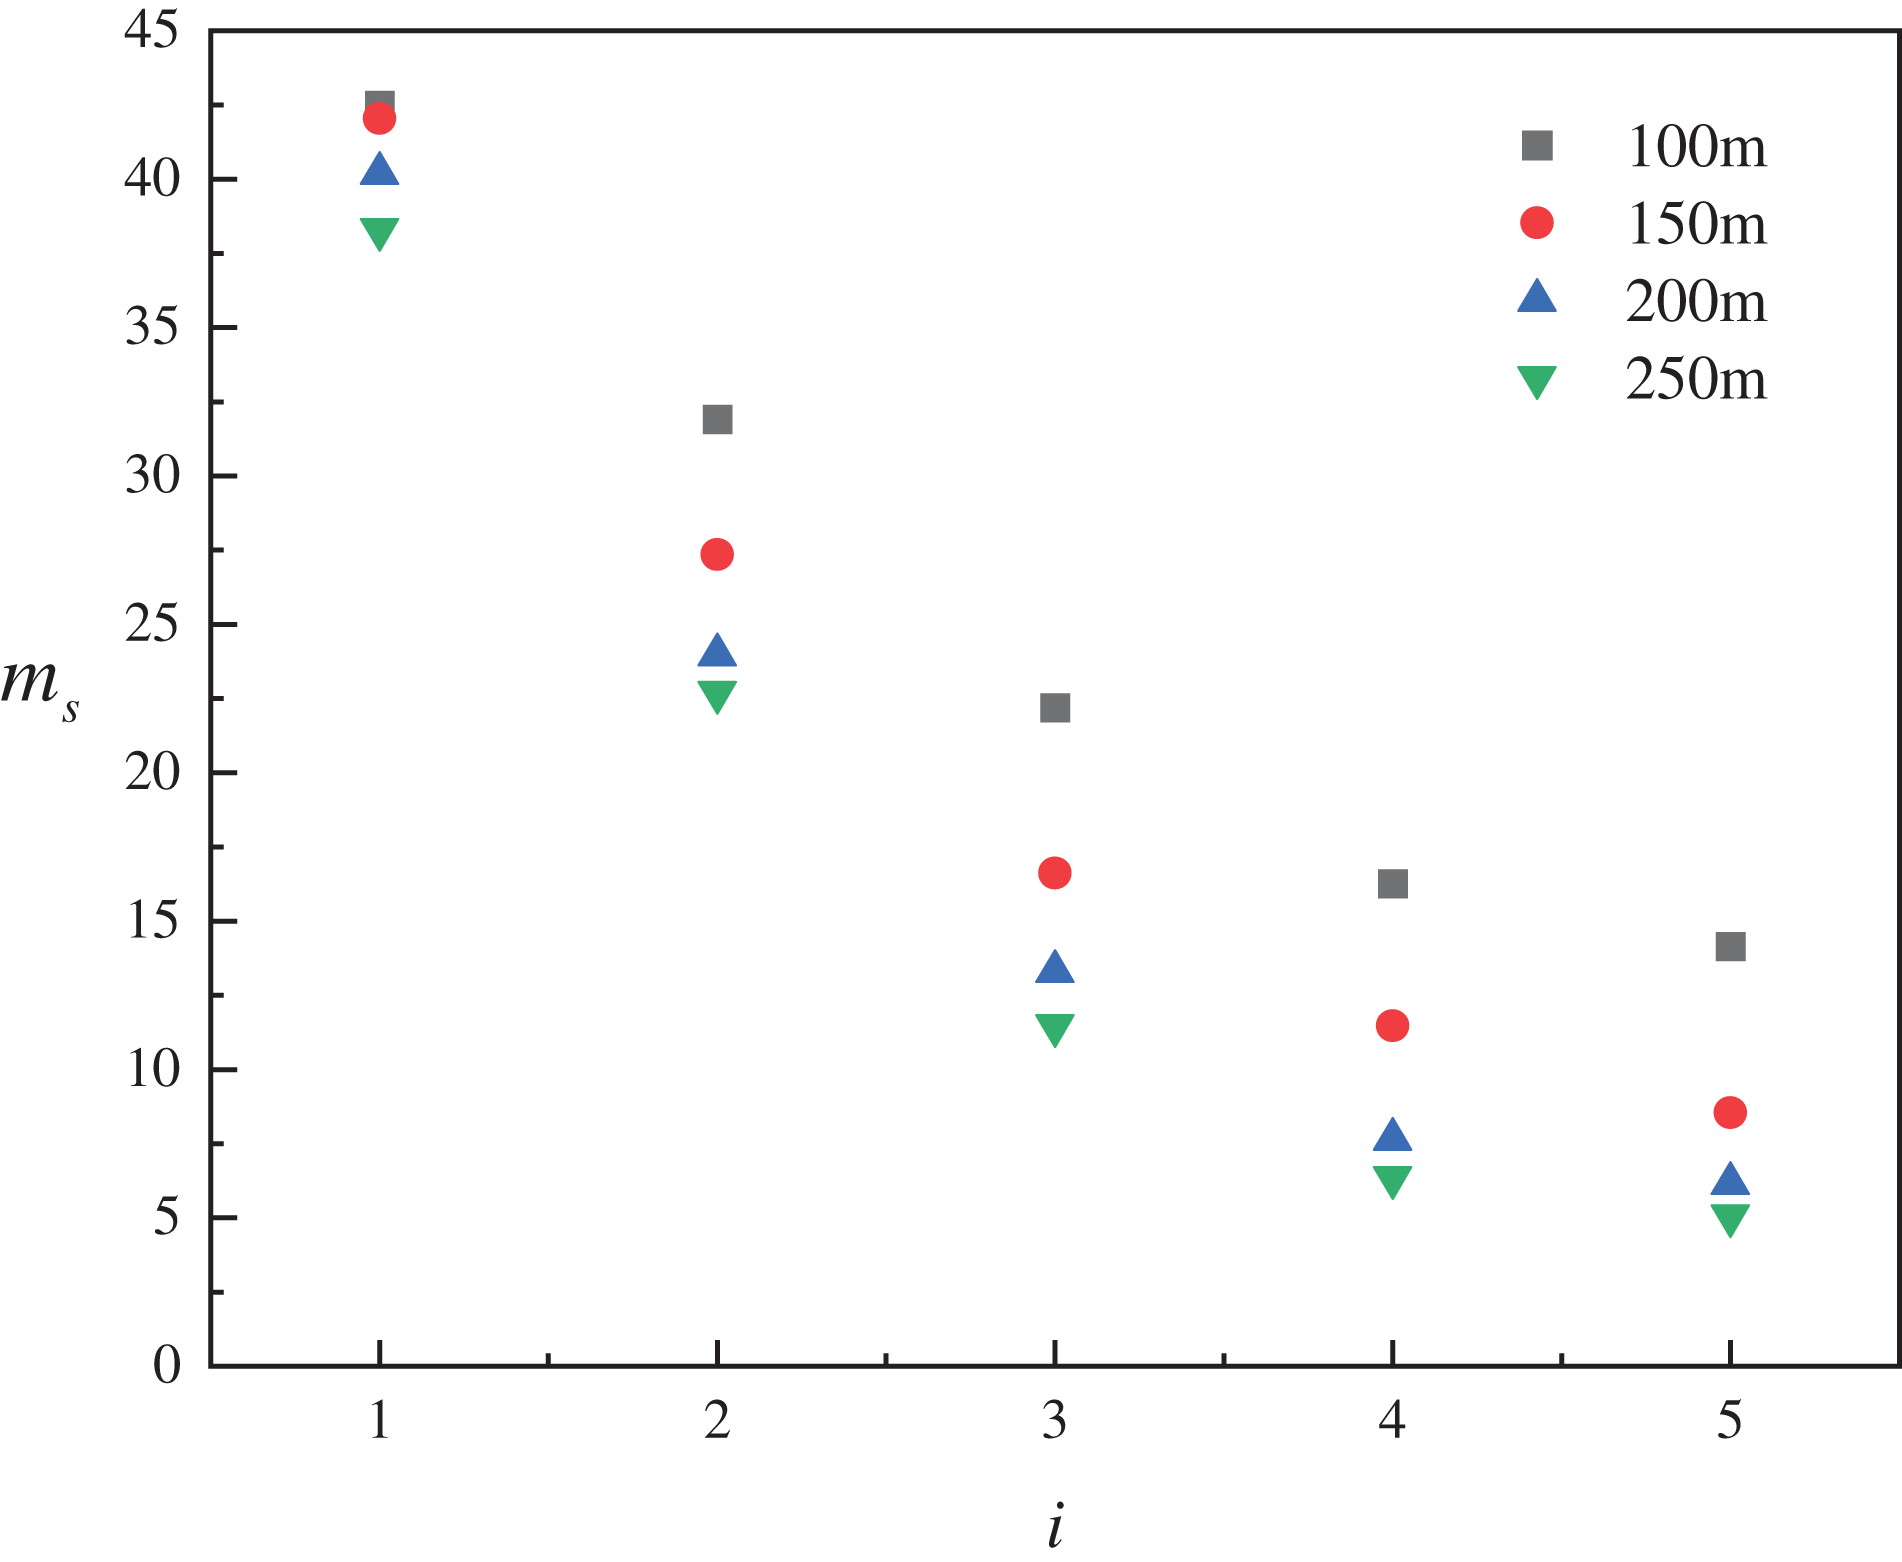
Figure 14: ms vs. i
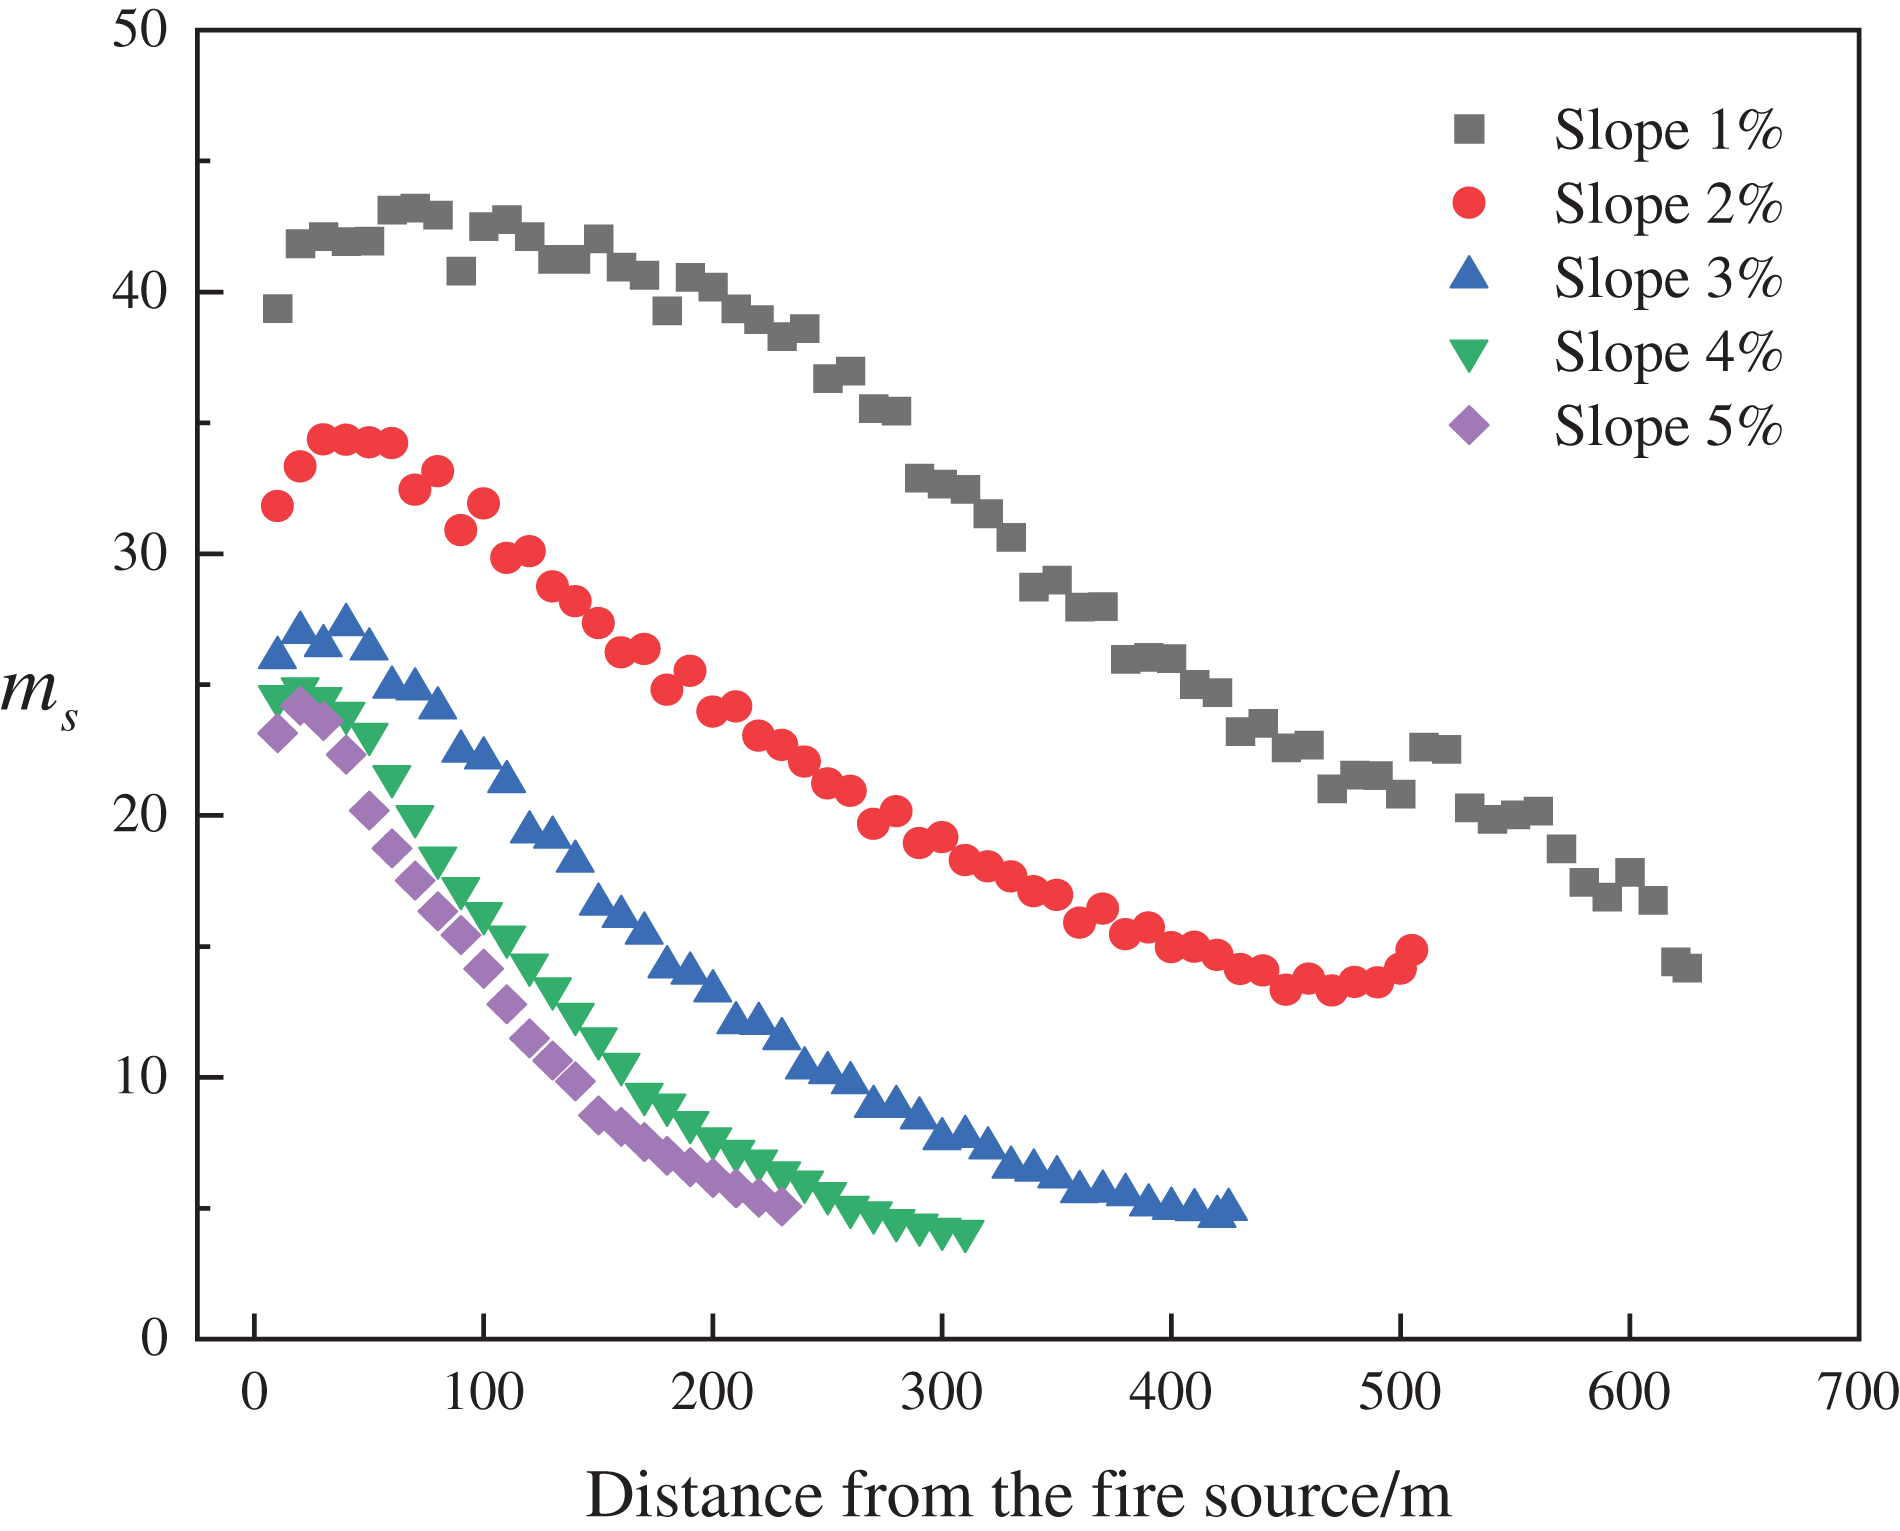
Figure 15: ms vs. x
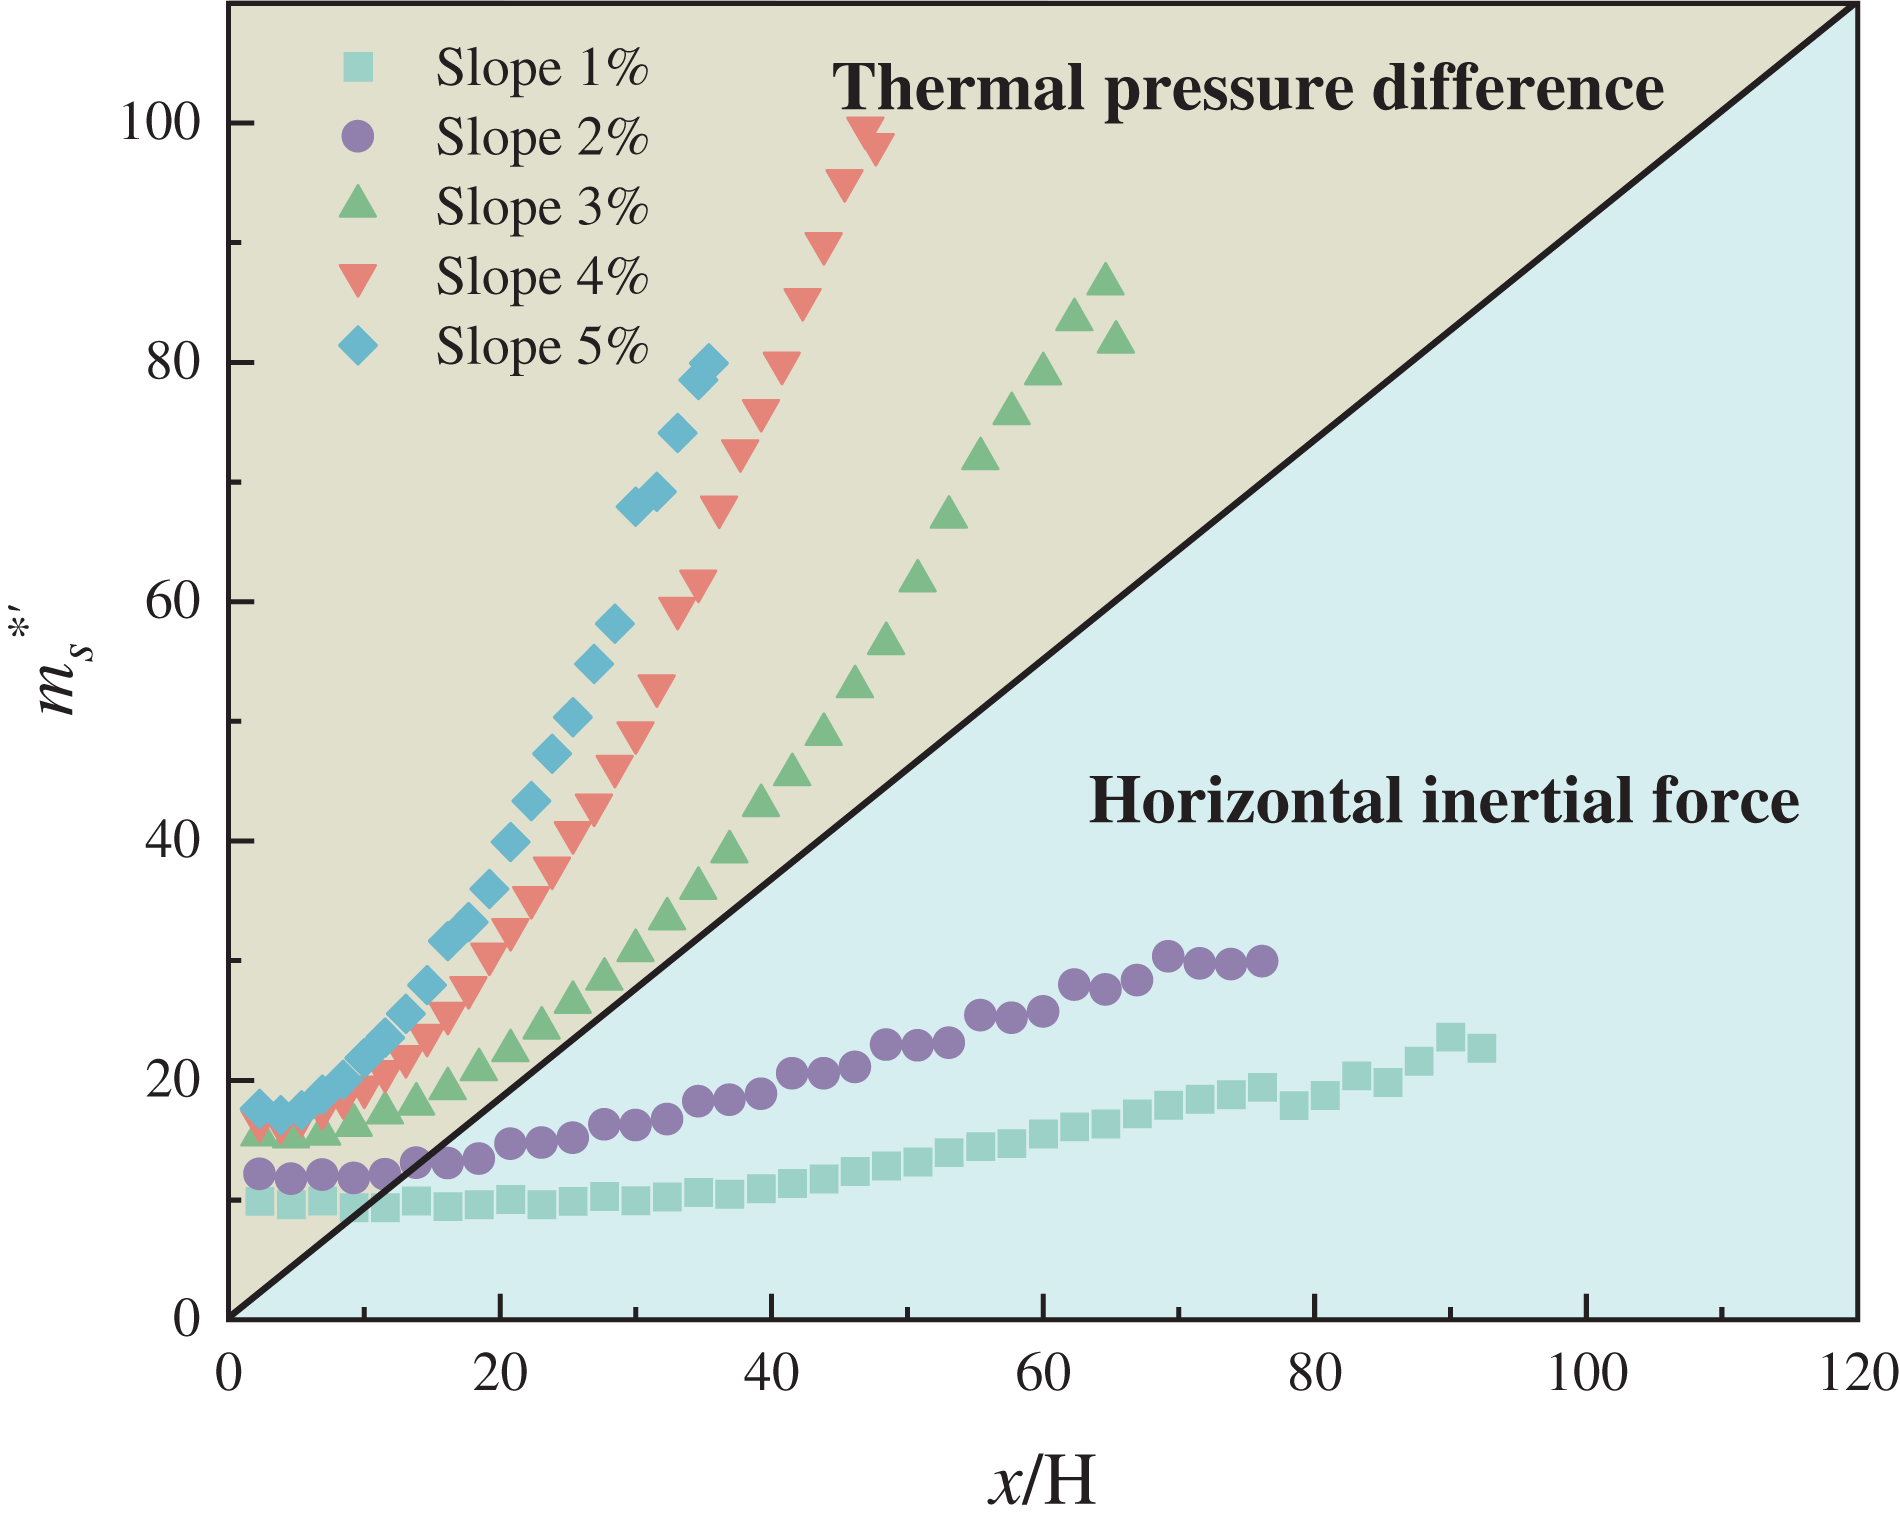
Figure 16:
Based on the analysis, it can be obtained:
where
where x is the distance from the fire source, m.
Fig. 17 illustrates the relationship between the
i = 1%, 2%:
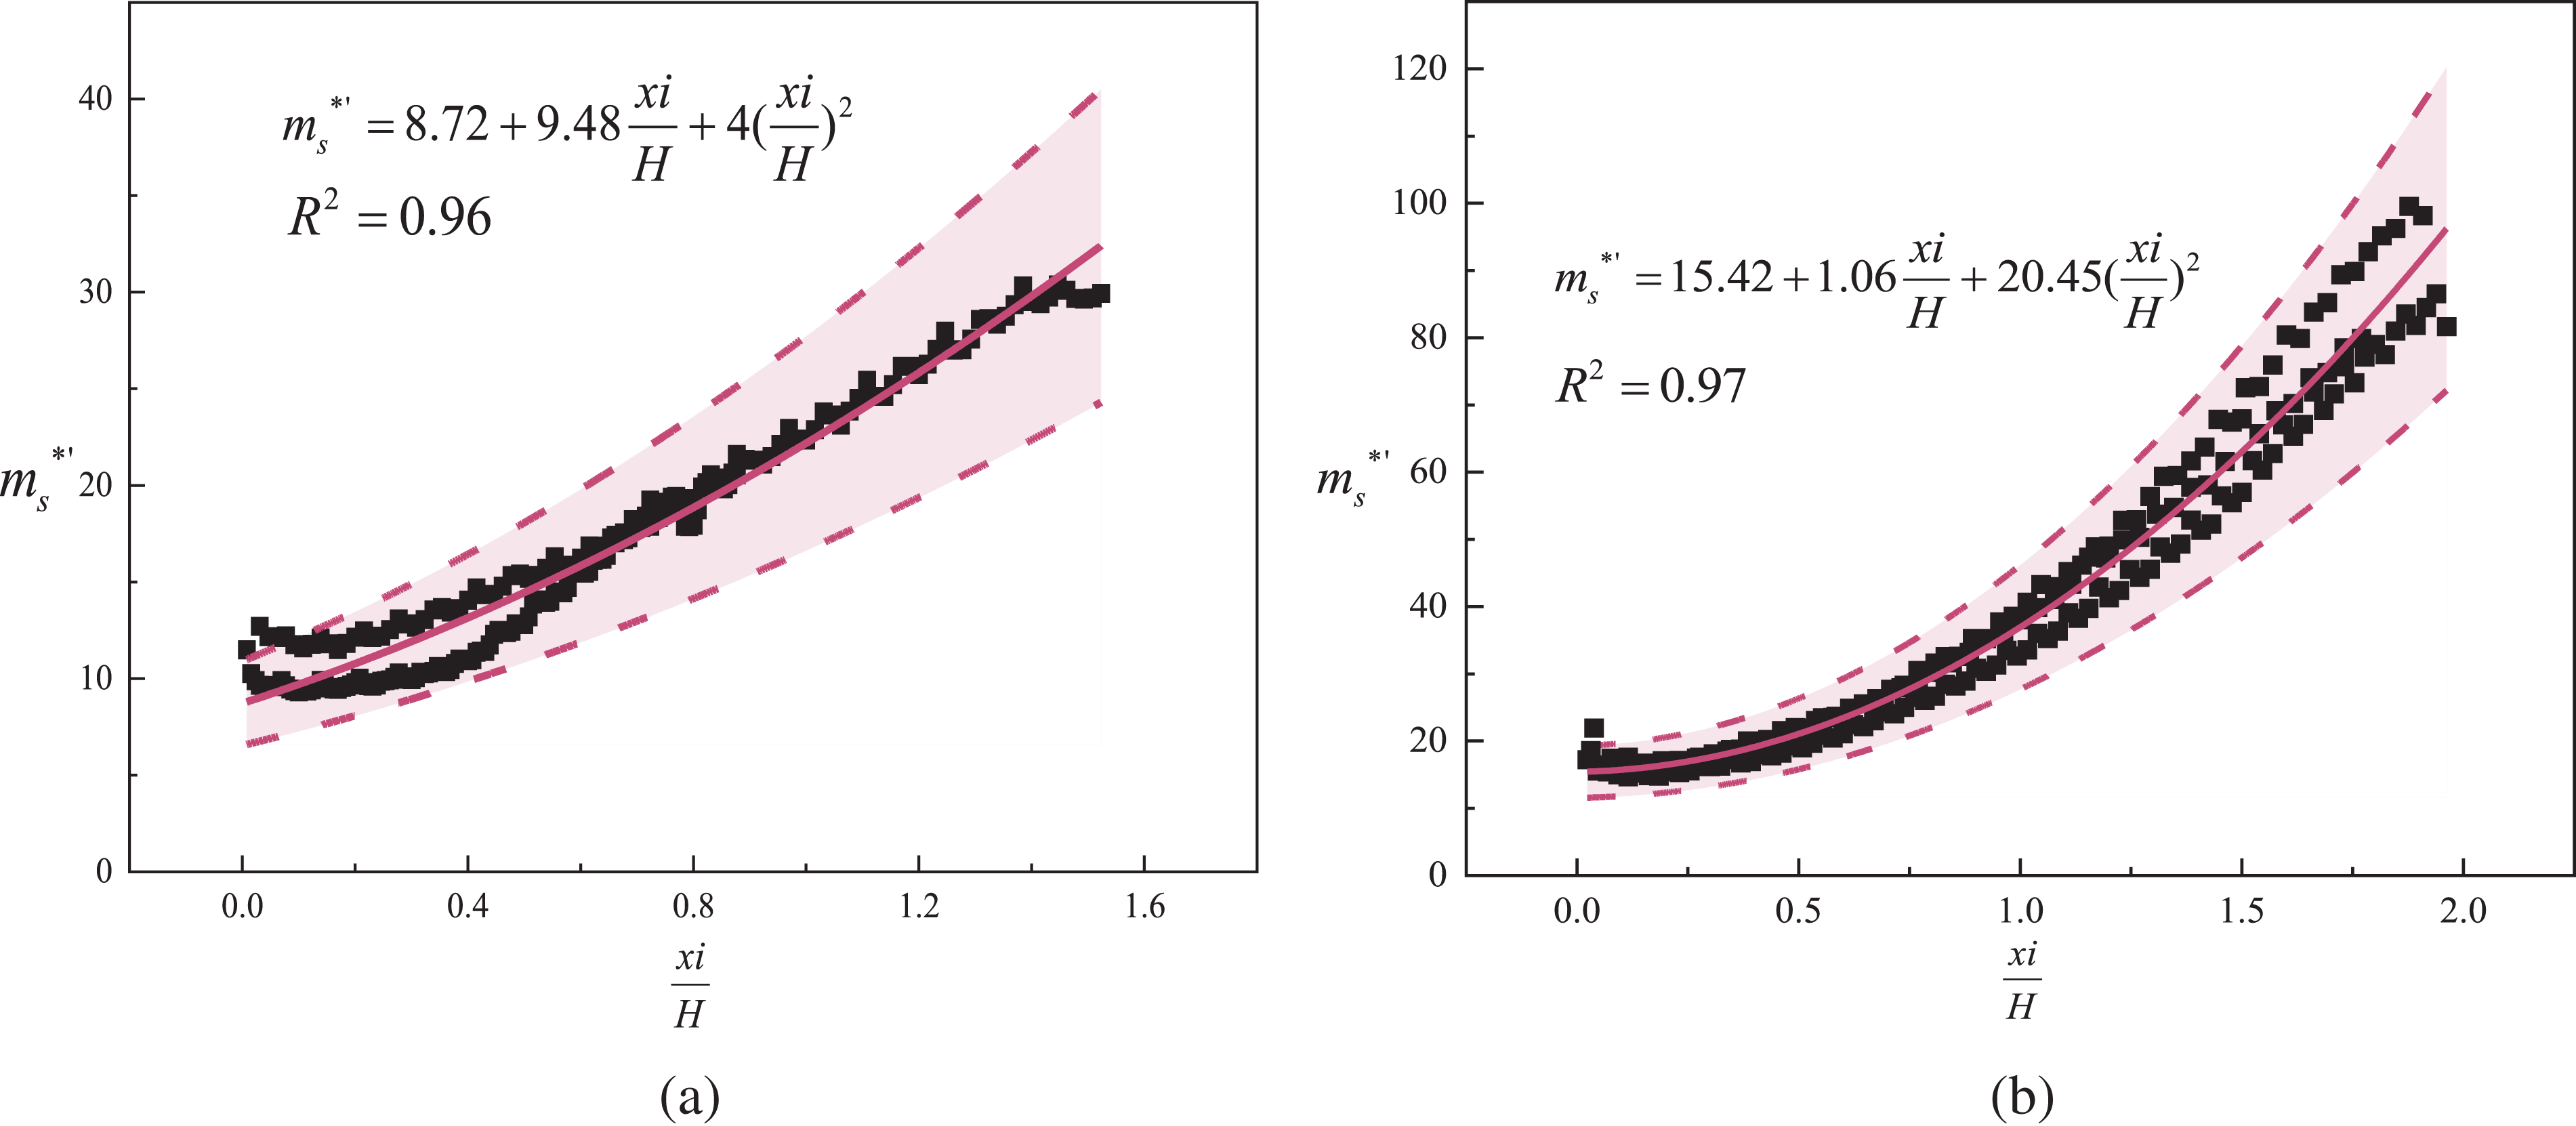
Figure 17:
i = 3 %, 4%, 5%:
To confirm the accuracy of Eqs. (12) and (13), the calculated and measured values are compared and presented in Fig. 18. The predicted values show good agreement with the measured values, with an overall error within ±25%.
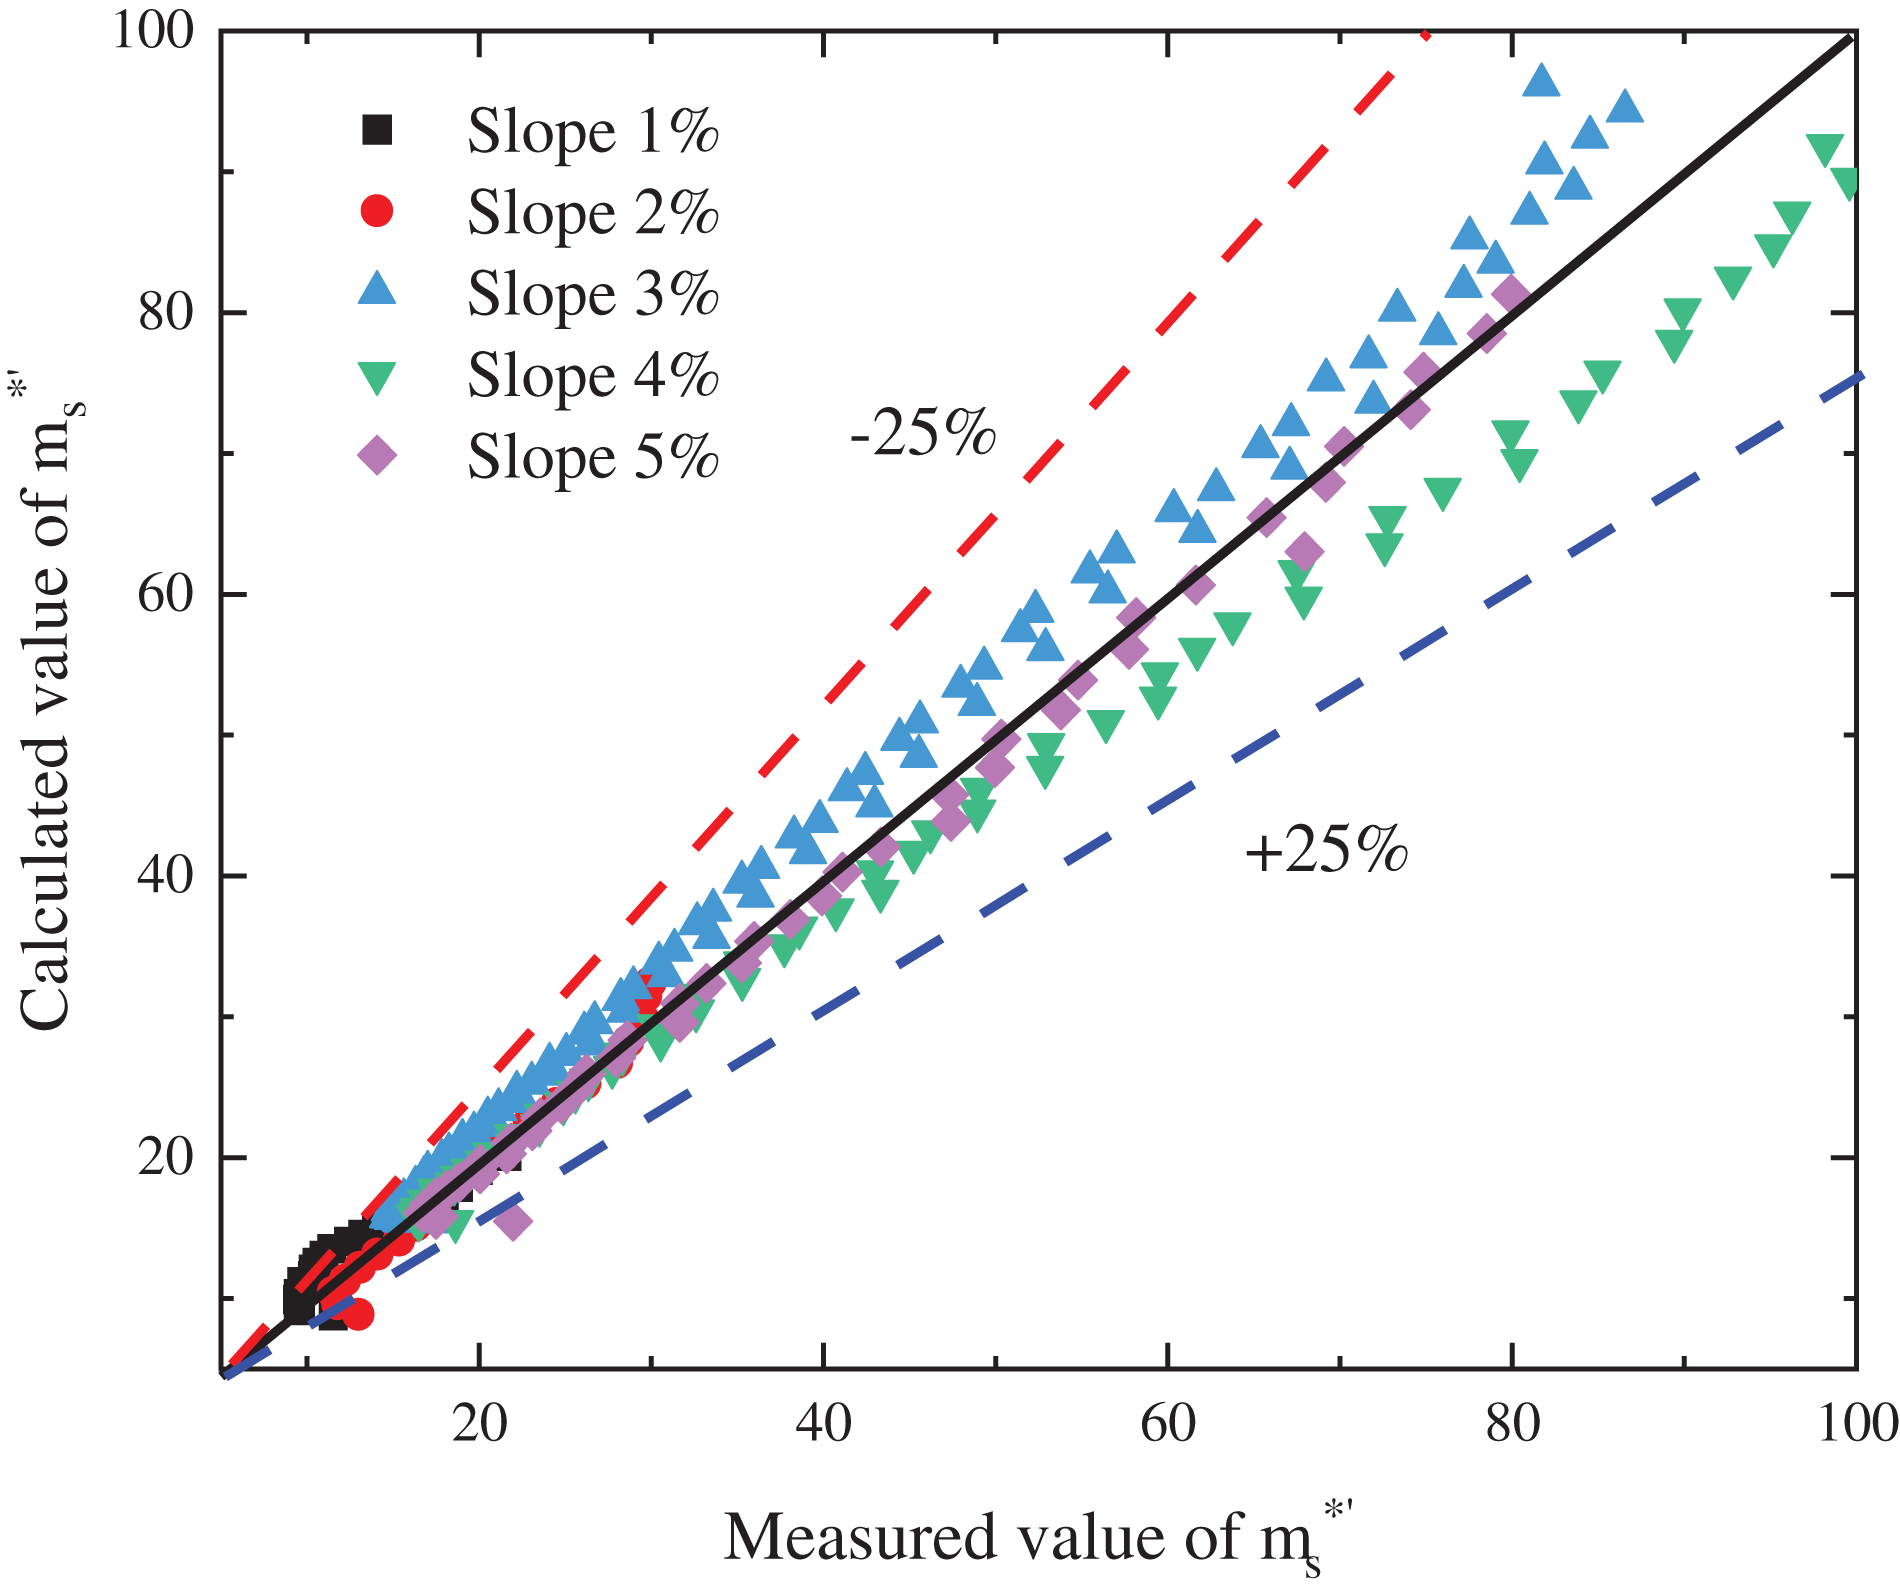
Figure 18: The comparison of
The downstream smoke spread distances at five slopes for four typical fire source locations in a W-shaped tunnel are illustrated in Fig. 19. At the Downhill, the downstream spreading range decreases from 370 to 44 m as the slope increases. At the slope of 1%, only the smoke crosses the change of slope point, with a spreading distance of 120 m in the positive slope section. For the remaining slopes, the smoke does not cross the change of slope point. At 2%~5% tunnel slope, the downstream spreading distance is from 178 to 44 m, suggesting that the augmentation of the slope has impeded the downstream spread of smoke, concentrating the impact of smoke on individuals primarily upstream of the fire source.
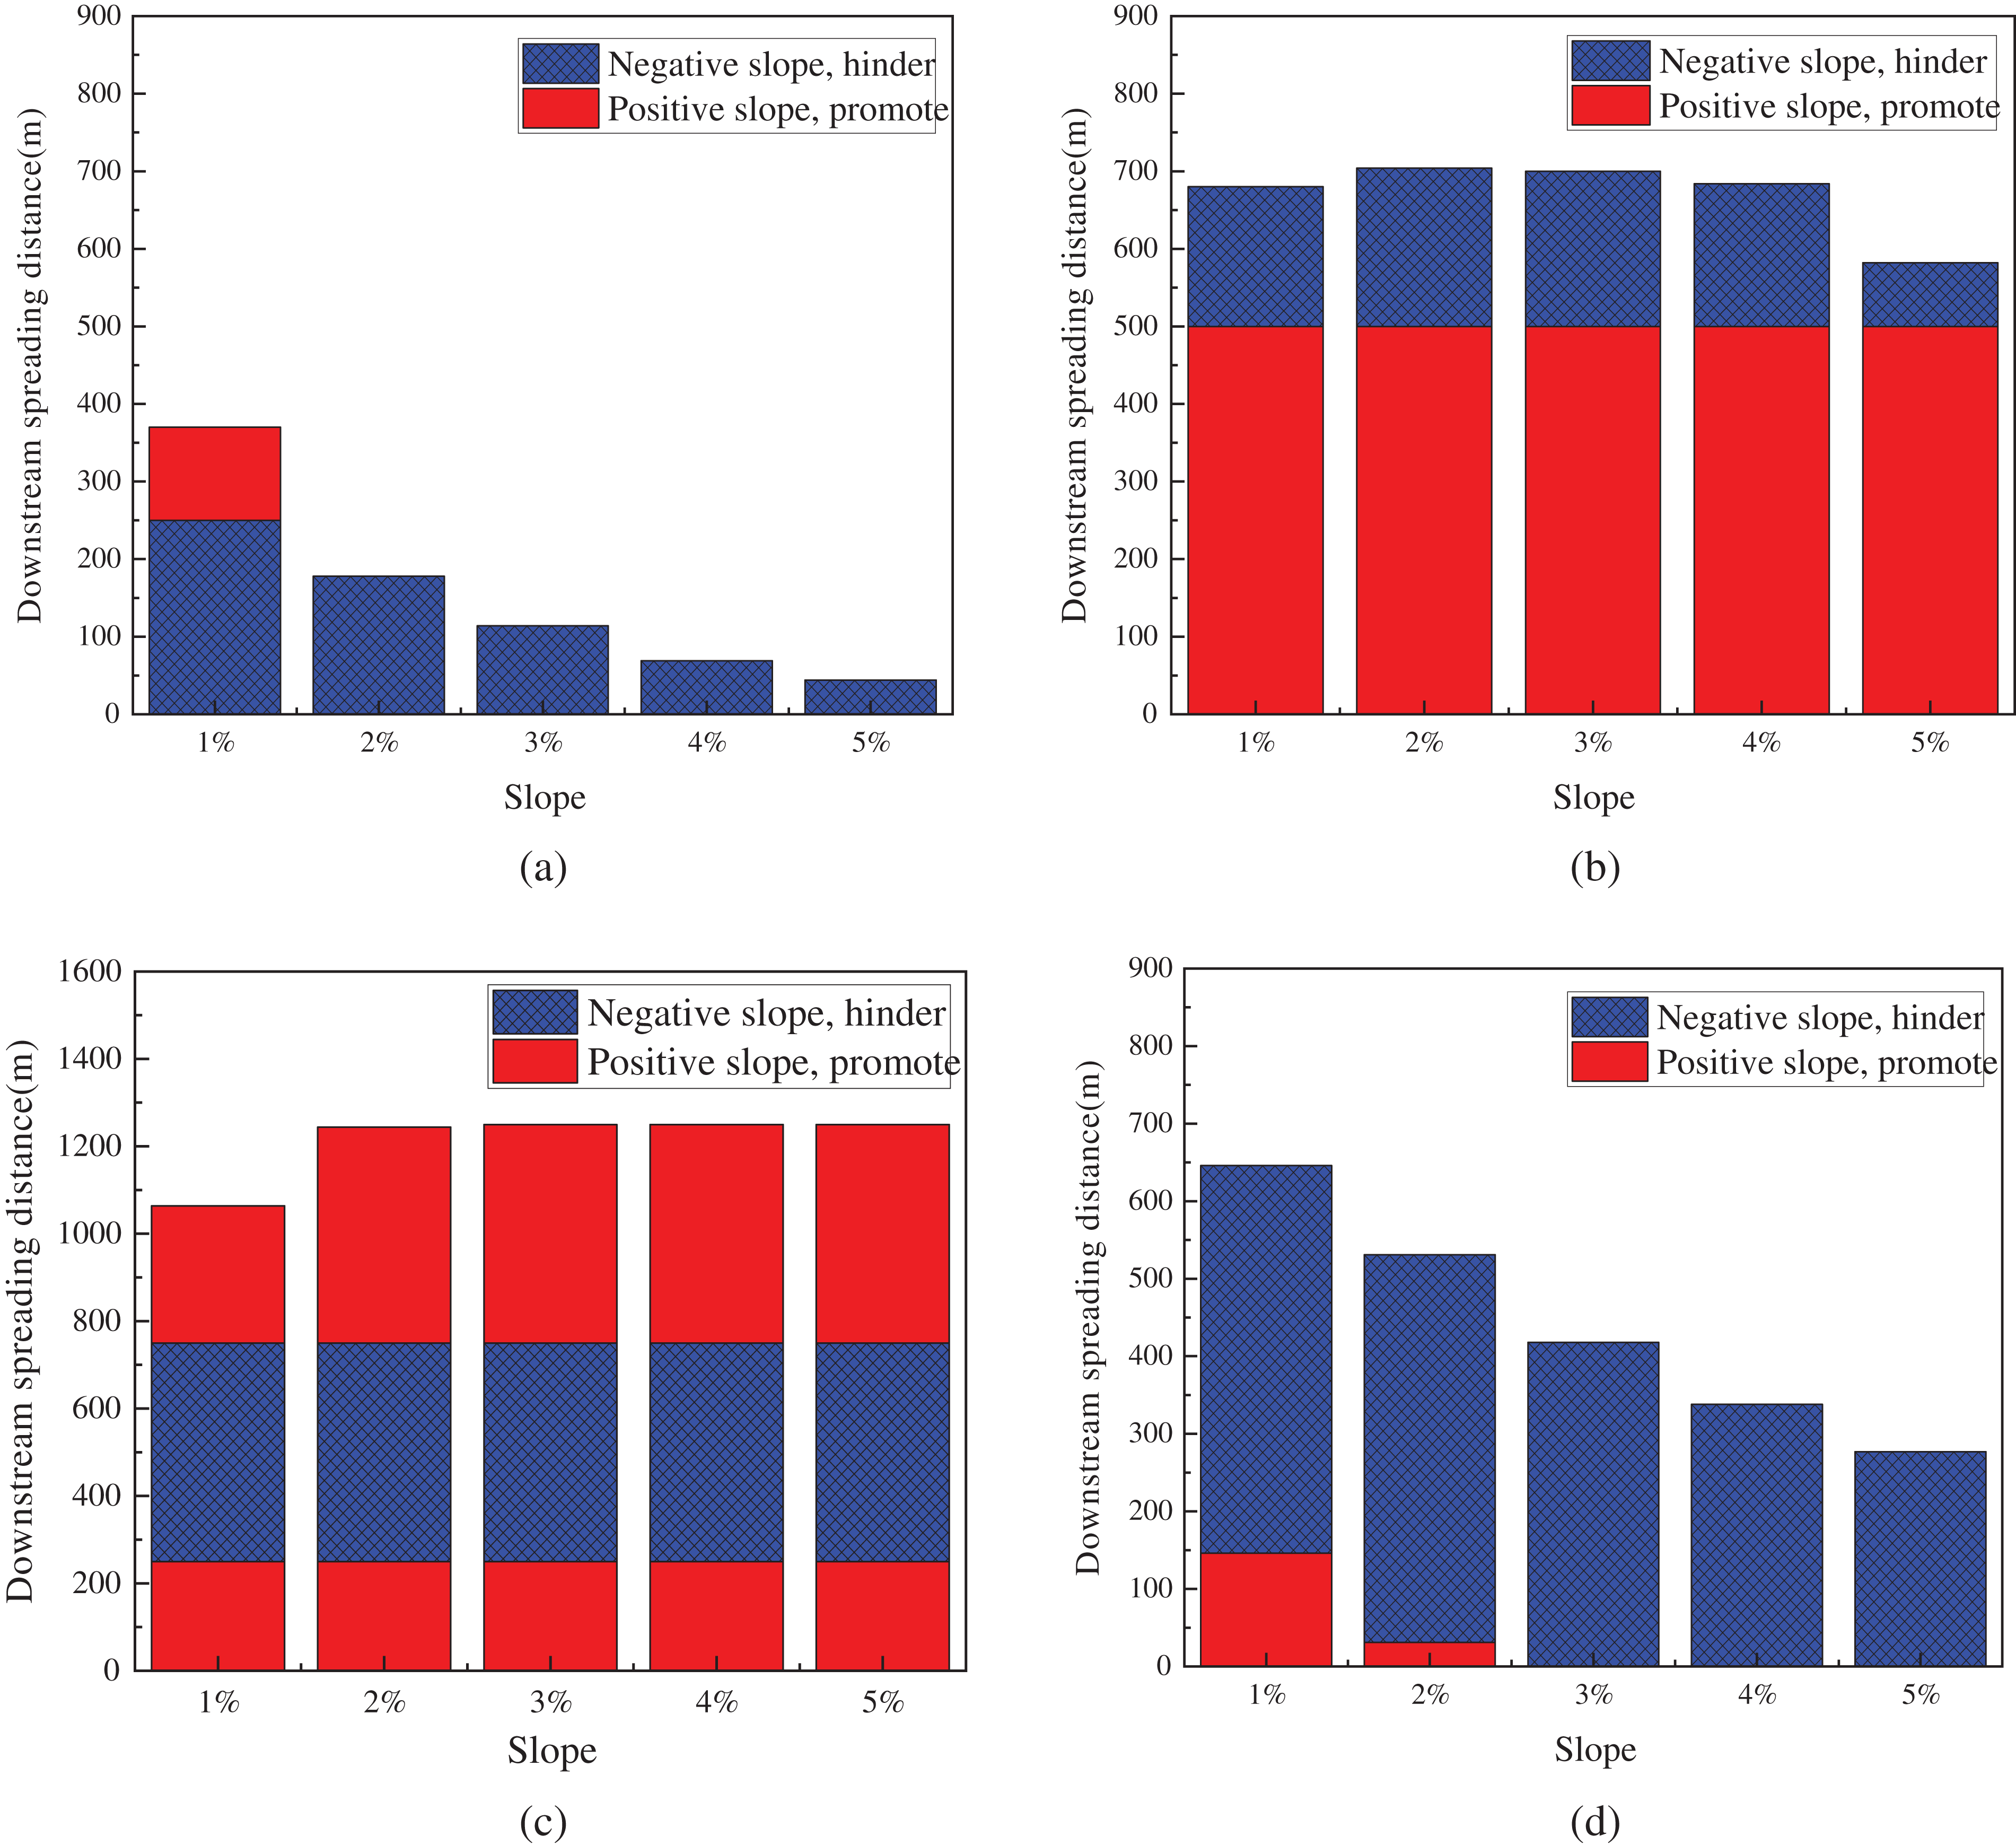
Figure 19: Downstream smoke spread distance at different fire locations: (a) Downhill; (b) V-point; (c) Uphill; (d) Inverted V-point
At the V-point, there is not a significant alteration in the downstream spread distance, with only a slight decrease observed at a 5% slope. Fig. 20 shows the downstream smoke movement in the V-point undergoes an uphill path of 500 m first, and by the chimney effect, the smoke can all pass through the uphill section quickly. As the smoke progresses through the downhill path, resistance induced by the thermal pressure difference impedes further spread. Moreover, as the slope increases, the resistance effect of the thermal pressure difference also intensifies, resulting in a shorter final smoke spread distance at 5% slope. When the Uphill causes a fire, the downstream spread distance is directly proportional to the slope, and a greater amount of smoke spreads downstream. There is a tendency for the smoke to overflow the tunnel exit, concentrating the impact of smoke on personnel downstream of the fire source. As depicted in Fig. 19d, when the flame occurs at the Inverted V-point, the downstream spread distance of smoke decreases as the slope increases. Smoke traverses the slope change point at small slopes, indicating an area conducive to smoke movement. Conversely, in the case of higher slopes, there are only areas where smoke movement is hindered.
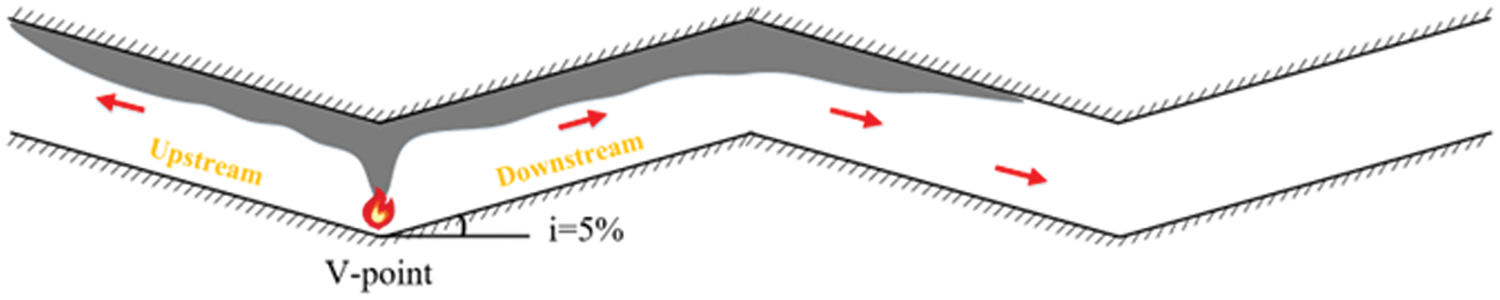
Figure 20: Smoke spread paths when the fire source is located at V-point
Table 2 shows the upstream and downstream spreading distance during a fire located at Inverted V-point, from which it can be seen that the upstream spreading distance is basically the same as the downstream, and the overall symmetrical distribution. This symmetry arises from the flame being positioned at the centrally symmetric point of the W-shaped tunnel, ensuring consistency in the distribution of slope length and inclination both upstream and downstream.
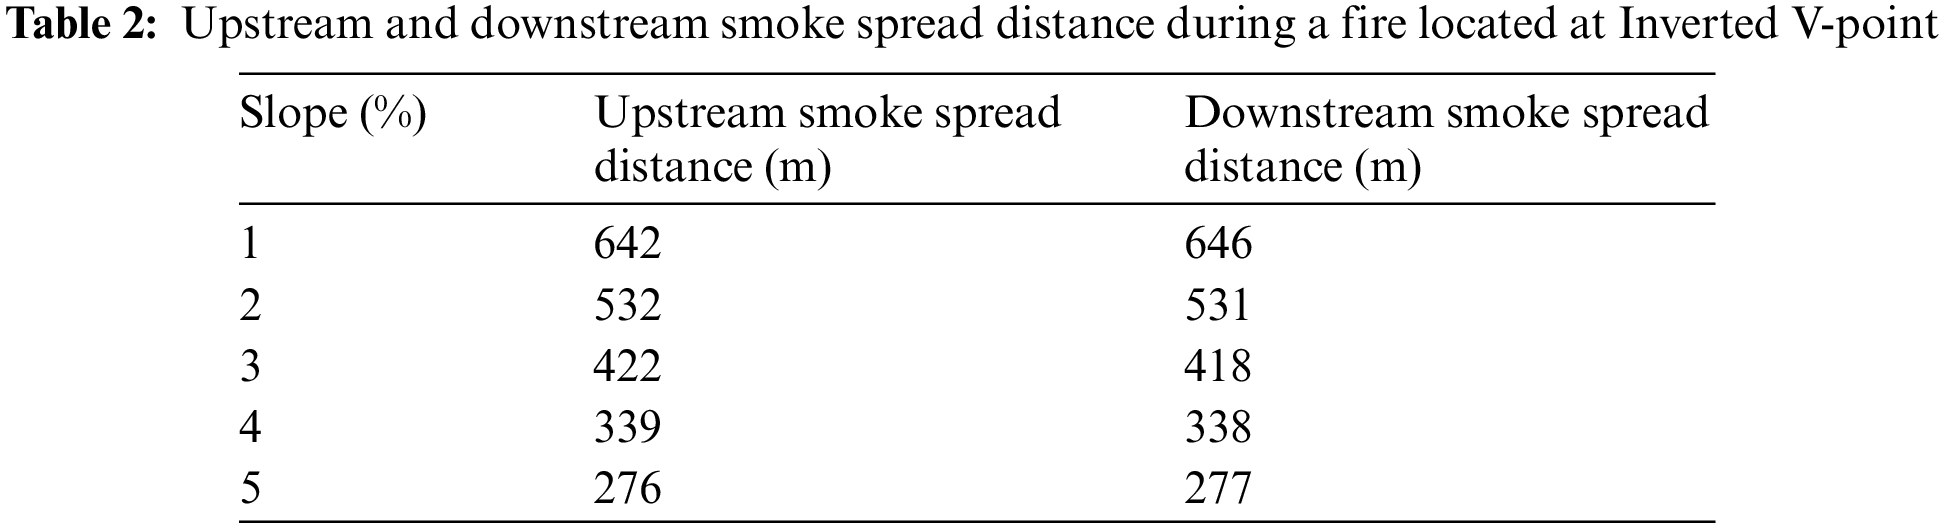
Fig. 21 shows the velocity vector near the flame at different locations at a 5% slope. The thermal pressure difference within the tunnel significantly influences the movement of both smoke and fresh air. As depicted in Fig. 21b,a distinct stratification between smoke and air occurs when the V-point has a fire. The upper layer of smoke disperses along the tunnel’s ceiling towards both sides, influenced by the thermal pressure difference. Concurrently, negative pressure forms beneath the tunnel, facilitating fresh air from the external environment. The distribution of velocity vectors when the fire source is located at the inverted V-point is similar to that of the V-point fire source. Exhibiting a distinct smoke-air stratification layer, both sides of the smoke spread downhill. When the fire source is located on a single slope, as shown in Fig. 21a,c, most of the smoke spreads uphill, while a significant amount of air enters the tunnel from the opposite side to supply oxygen for combustion.
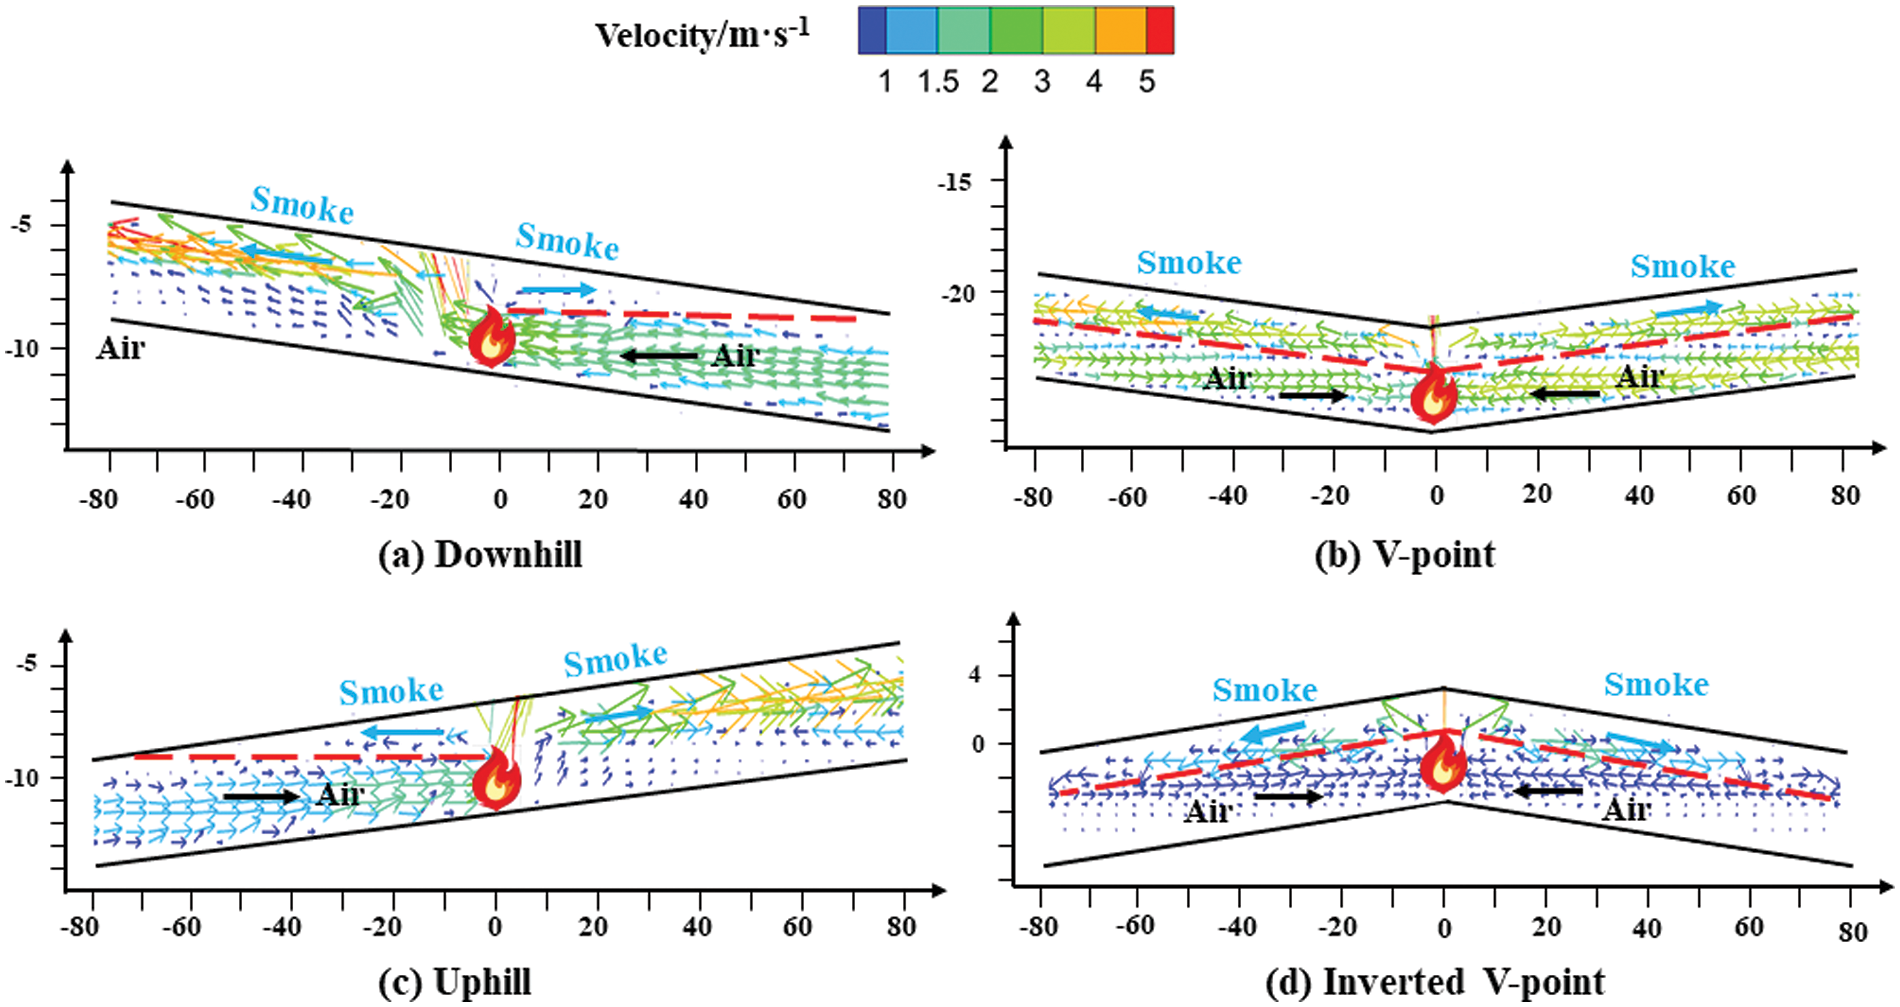
Figure 21: Velocity vector near the fire source at different fire source locations
By comparing the smoke spread distance under different flame locations, one may observe that during a fire breaks out at Uphill and Downhill, the smoke spread law is similar to that of single-gradient tunnels, and the ability of smoke spreading to the downhill direction is relatively weak in the case of a large slope, and the impact on the personnel is concentrated in the uphill direction. During a fire occurs at compound variable slope section, the smoke spreading behavior differs from that of a single slope tunnel. At the V-point, both sides of the smoke flow in the upslope direction, while upstream smoke spreads out of the tunnel entrance and downstream spreads over 580–700 m, significantly affecting personnel evacuation. Conversely, at the Inverted V-point, the spreading distance on both sides is reduced significantly with large slopes, resulting in less impact on personnel compared to the V-point.
The smoke front movement time in the spreading behavior of smoke significantly impacts the evacuation of people. During personnel evacuation analysis, it is typically assumed that the temperature at a height of 2 m must be maintained below 60°C to ensure that individuals are not exposed to the radiant heat of hot fumes during the evacuation process [35]. Fig. 22 shows the spread of the 60°C smoke front at 2 m above the fire source in the scenario of a fire starting in the V-point and the Inverted V-point. In Fig. 22, a high degree of symmetry is evident, where the time to the moment of danger is nearly identical for locations at the same distance on both sides when a fire occurs at each of these two locations. In addition, when a fire occurs at the V-point, the smoke settles to a wider range of dangerous moments; that is, the flame upstream and downstream of the farthest dangerous moments of the distance is larger. The evacuation and rescue of personnel are significantly impacted by this situation, as it affects their ability to exit the area safely. Therefore, the fire hazard of the V-point and the Inverted V-point should be considered separately, and protection measures should be developed accordingly to account for their respective characteristics.
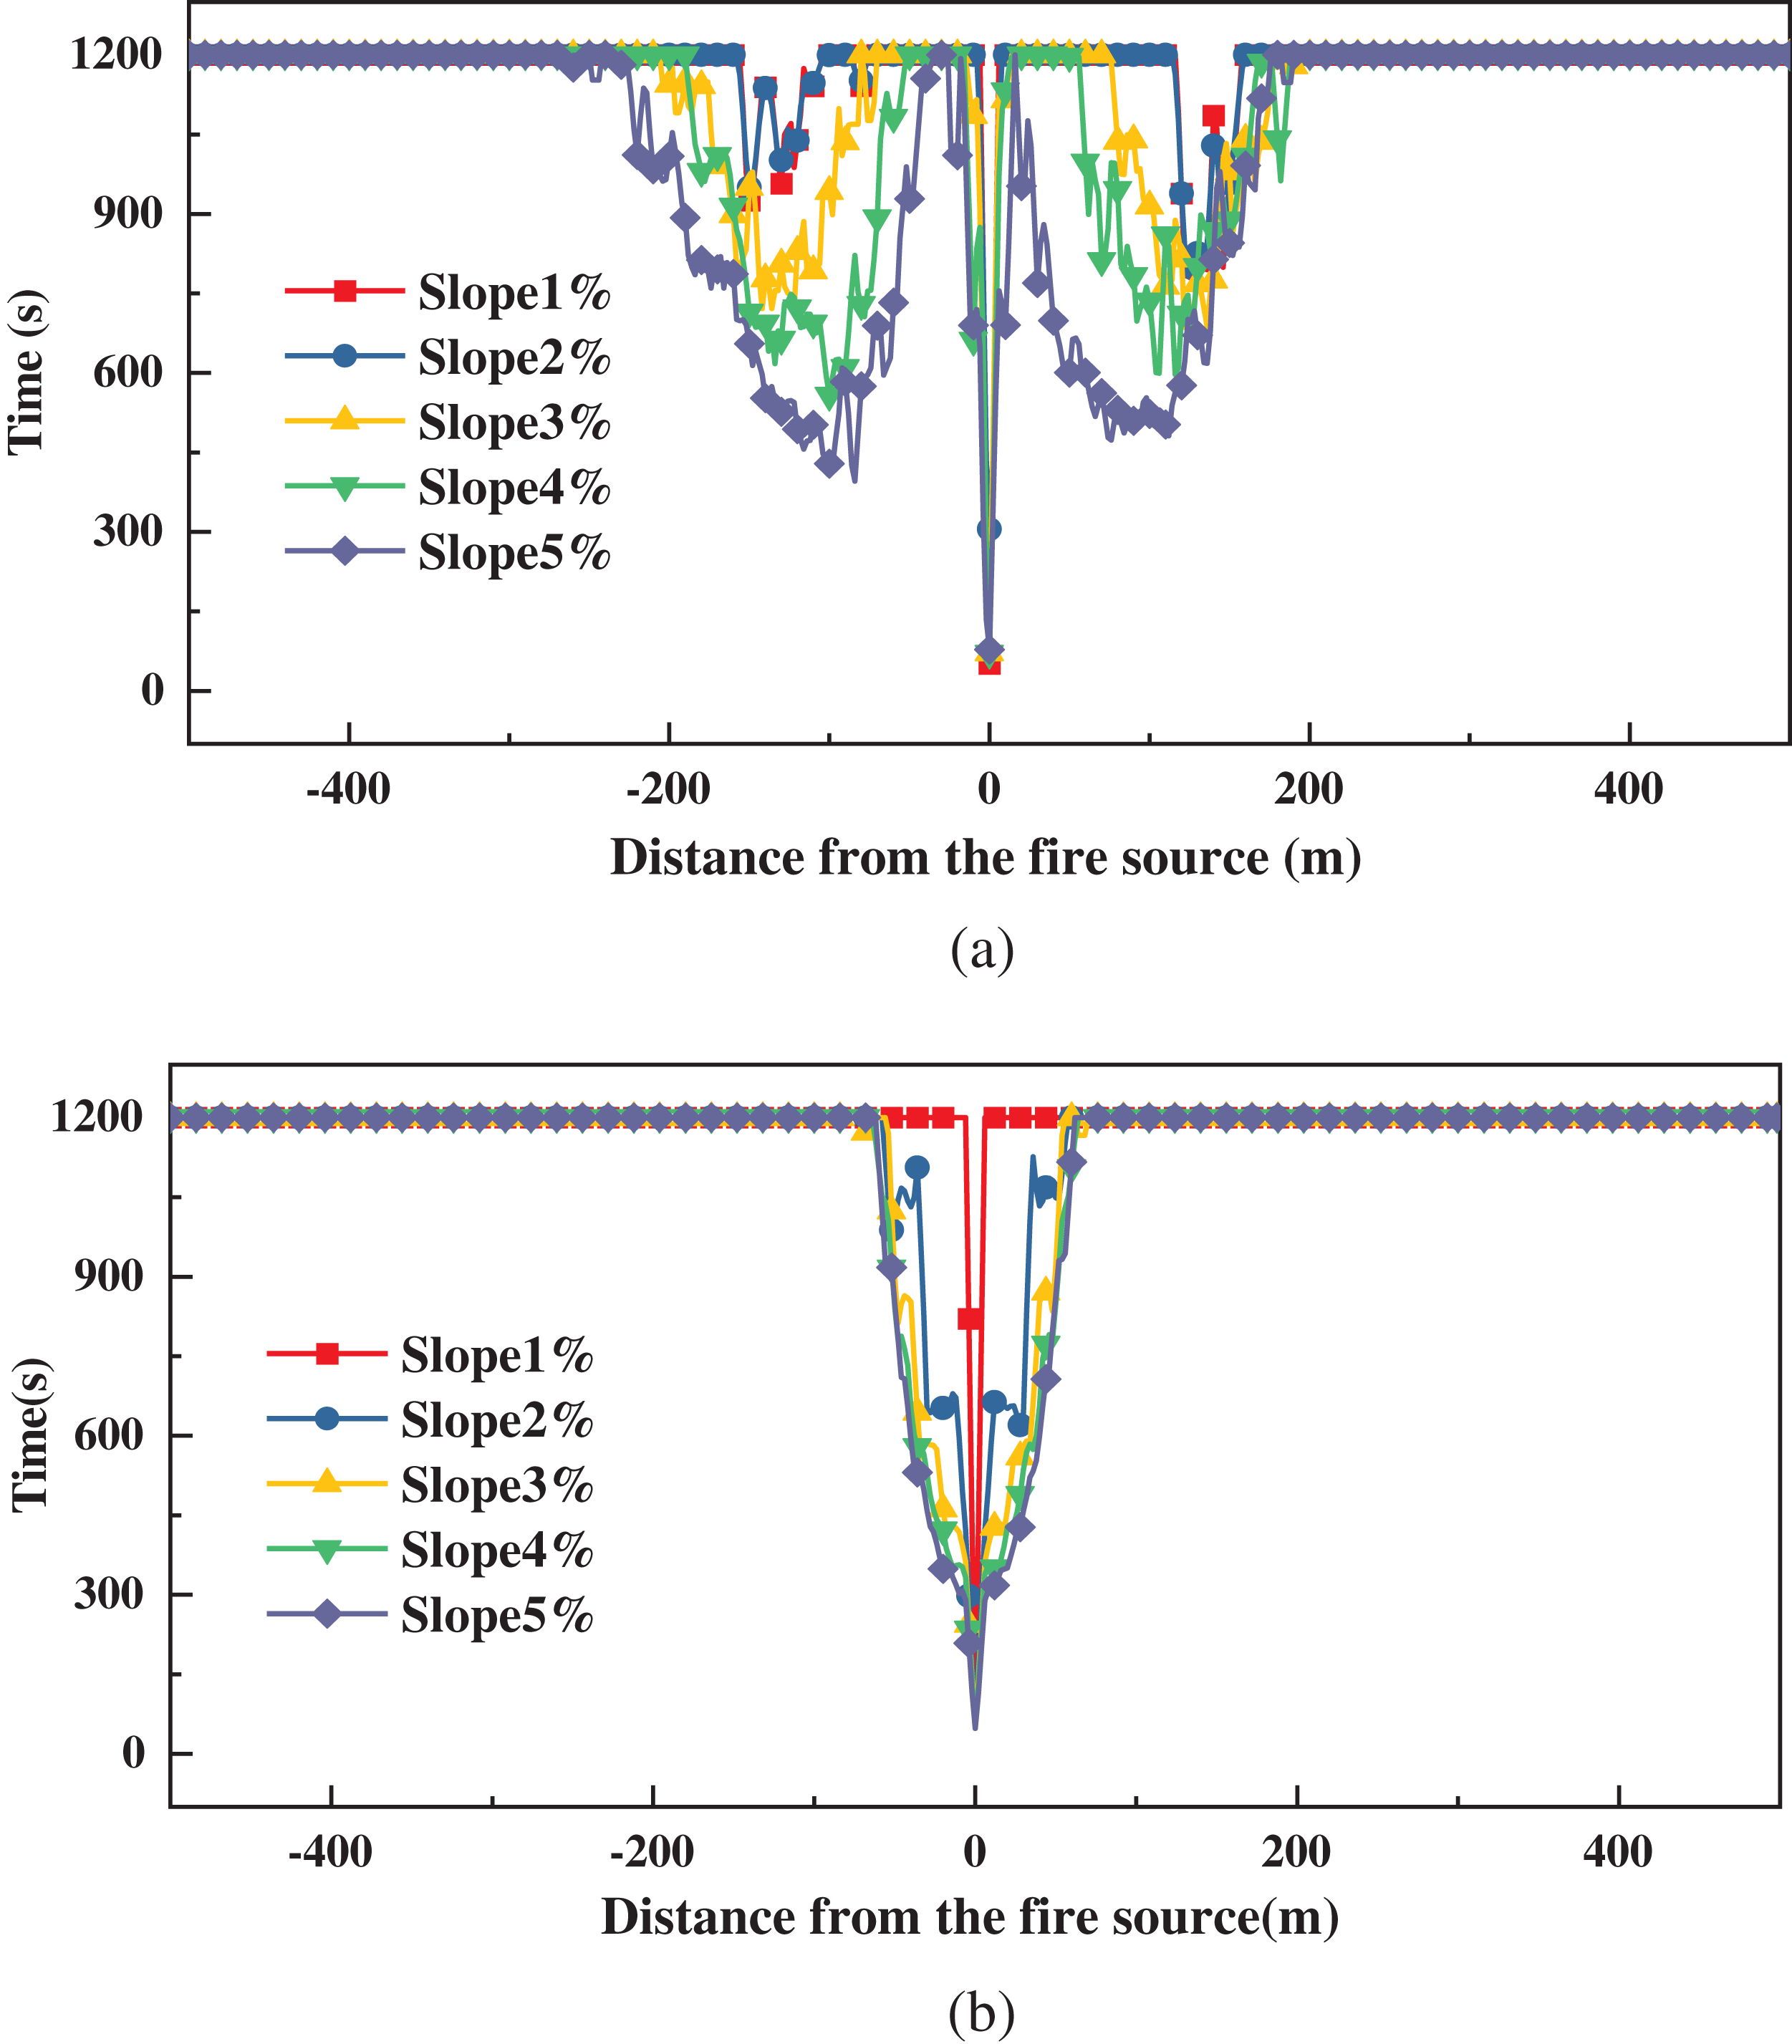
Figure 22: Spread of a 60°C smoke front at a distance of 2 m above the fire source: (a) V-point; (b) Inverted V-point
In no-slope or single-slope tunnels, the tunnel midpoint is typically regarded as the most disadvantageous location for fire sources. This occurs because the center of the tunnel is farthest from both sides of the opening, resulting in a longer path for smoke spread, increased likelihood of settling, and reduced visibility within the tunnel, which impacts personnel evacuation and complicates rescue efforts. Through analysis, it becomes evident that the complexity and variability of the slope in W-shaped tunnels significantly influence the distance of smoke spread, smoke front movement time, and the mass flow rate of smoke due to thermal pressure differences. Consequently, the fire risk varies across different locations within W-shaped tunnels. The fire characteristics must be separately considered in both the V-point and the Inverted V-point. Accordingly, corresponding safety protection measures should be implemented based on their respective characteristics.
To investigate the temperature distribution and smoke spreading behavior at four fire source positions in the underwater W-shaped island-crossing tunnel, a full-scale idealized symmetric model was developed. The ceiling temperature, smoke spreading distance, and mass flow rate were analyzed. The main findings are as follows:
1. The ceiling temperature field shows the pattern that the hot area along the uphill direction is almost parallel to the ceiling of the tunnel, while the hot area along the downhill direction is parallel to the horizontal ground. The high-temperature smoke layer becomes thicker the closer one gets to the fire source. When the fire source is in a single slope, the high-temperature region gradually changes from symmetric distribution to asymmetric distribution with the increase of slope. In the case of fire at the compound slope change point, the high-temperature area maintains the symmetrical distribution.
2. The change in slope affects the magnitude of the thermal pressure difference inside the tunnel. As the slope increases, so does the thermal pressure difference at a given location within the tunnel. The maximum thermal differential pressure is 157 Pa at a tunnel slope of 5% when the fire is located at the V-point.
3. In tunnels without slopes or single-slope tunnels, the tunnel midpoint is typically considered the most disadvantageous location for fire sources. In W-shaped tunnels, fire hazards vary across different locations, necessitating separate consideration of the fire characteristics at the V-point and the Inverted V-point. Corresponding safety protection measures should be developed following these characteristics.
4. The mass flow rate in small and large slope tunnels shows different decay rates due to variations in the main forces acting on the movement. Based on the numerical simulation results, two prediction Eqs. (12) and (13) are established for the upstream smoke mass flow rate of a W-shaped tunnel fire at the Inverted V-point.
It is important to note that this paper focuses on an idealized symmetric model, which does not account for situations where the slopes of the segments in a W-type tunnel are inconsistent or where the lengths of the slopes are asymmetric. Consequently, a fire in such a tunnel may exhibit different smoke spread patterns. It is also necessary to establish prediction models for temperature decay and smoke spread length in symmetric and asymmetric W-shaped tunnels to provide further reference for practical engineering. Therefore, more in-depth simulation experiments should be conducted to explore the relevant patterns.
Acknowledgement: The authors would like to thank Zhisheng Xu for suggestions.
Funding Statement: This research received no external funding.
Author Contributions: The authors confirm contribution to the paper as follows: study conception and design: Jiaming Zhao, Zihan Yu; data collection: Juan Wang, Zihan Yu; analysis and interpretation of results: Zhisheng Xu, Juan Wang; draft manuscript preparation: Jiaming Zhao, Zihan Yu. All authors reviewed the results and approved the final version of the manuscript.
Availability of Data and Materials: Data are contained within the article.
Conflicts of Interest: The authors declare that they have no conflicts of interest to report regarding the present study.
References
1. Wu X, Zhang X, Huang X, Xiao F, Usmani A. A real-time forecast of tunnel fire based on numerical database and artificial intelligence. Build Simul. 2022;15(4):511–24. doi:10.1007/s12273-021-0775-x. [Google Scholar] [CrossRef]
2. Casey N. Fire incident data for Australian road tunnels. Fire Saf J. 2020;111:102909. doi:10.1016/j.firesaf.2019.102909. [Google Scholar] [CrossRef]
3. Tomar MS, Khurana S. Impact of passive fire protection on heat release rates in road tunnel fire: a review. Tunn Undergr Space Technol. 2019;85:149–59. doi:10.1016/j.tust.2018.12.018. [Google Scholar] [CrossRef]
4. Hua N, Tessari A, Khorasani NE. Characterizing damage to a concrete liner during a tunnel fire. Tunn Undergr Space Technol. 2021;109:103761. doi:10.1016/j.tust.2020.103761. [Google Scholar] [CrossRef]
5. Zhang X, Zhang Z, Tao H. A numerical study on critical velocity and back-layering length with trains’ blockage in longitudinally ventilated tunnel fires. Tunn Undergr Space Technol. 2021;116:104093. doi:10.1016/j.tust.2021.104093. [Google Scholar] [CrossRef]
6. Zhang T, Wang G, Li J, Huang Y, Zhu K, Wu K. Experimental study of back-layering length and critical velocity in longitudinally ventilated tunnel fire with various rectangular cross-sections. Fire Saf J. 2021;126:103483. doi:10.1016/j.firesaf.2021.103483. [Google Scholar] [CrossRef]
7. Huang Y, Li Y, Li J, Wu K, Li H, Zhu K, et al. Experimental investigation of the thermal back-layering length in a branched tunnel fire under longitudinal ventilation. Int J Therm Sci. 2022;173(3):107415. doi:10.1016/j.ijthermalsci.2021.107415. [Google Scholar] [CrossRef]
8. Li Q, Kang J, Wu Y, Luo J. Theoretical and numerical study of smoke back-layering length for an inclined tunnel under longitudinal ventilation. Fire Technol. 2022;58(4):2143–66. doi:10.1007/s10694-022-01250-1. [Google Scholar] [CrossRef]
9. Li Z, Gao Y, Li X, Mao P, Zhang Y, Jin K, et al. Effects of transverse fire locations on flame length and temperature distribution in a bifurcated tunnel fire. Tunn Undergr Space Technol. 2021;112(4):103893. doi:10.1016/j.tust.2021.103893. [Google Scholar] [CrossRef]
10. Chen L, Mao P, Zhang Y, Xing S, Li T. Experimental study on smoke characteristics of bifurcated tunnel fire. Tunn Undergr Space Technol. 2020;98(4):103295. doi:10.1016/j.tust.2020.103295. [Google Scholar] [CrossRef]
11. Ma X, Luo S, Fang T, Wang J, Wan L. Maximum smoke temperature in the longitudinally ventilated tunnel fire: influence of the separating distance between two sources. Tunn Undergr Space Technol. 2021;107:103674. doi:10.1016/j.tust.2020.103674. [Google Scholar] [CrossRef]
12. Chow WK, Gao Y, Zhao JH, Dang JF, Chow NC. A study on tilted tunnel fire under natural ventilation. Fire Saf J. 2016;81(1):44–57. doi:10.1016/j.firesaf.2016.01.014. [Google Scholar] [CrossRef]
13. Shen Y, Jiao A, Chen T, Li Y, Gao Y, Xu Z, et al. Experimental study on smoke movement characteristics in tunnel fires with different canyon cross wind yaw angles. Tunn Undergr Space Technol. 2021;117(6):104129. doi:10.1016/j.tust.2021.104129. [Google Scholar] [CrossRef]
14. Tsai KC, Lee YP, Lee SK. Critical ventilation velocity for tunnel fires occurring near tunnel exits. Fire Saf J. 2011;46(8):556–7. doi:10.1016/j.firesaf.2011.08.003. [Google Scholar] [CrossRef]
15. Kong J, Xu Z, You W, Wang B, Liang Y, Chen T. Study of smoke back-layering length with different longitudinal fire locations in inclined tunnels under natural ventilation. Tunn Undergr Space Technol. 2021;107:103663. doi:10.1016/j.tust.2020.103663. [Google Scholar] [CrossRef]
16. Ji J, Wang Z, Ding L, Yu L, Gao Z, Wan H. Effects of ambient pressure on smoke movement and temperature distribution in inclined tunnel fires. Int J Therm Sci. 2019;145(1–2):106006. doi:10.1016/j.ijthermalsci.2019.106006. [Google Scholar] [CrossRef]
17. Shafee S, Yozgatligil A. An analysis of tunnel fire characteristics under the effects of vehicular blockage and tunnel inclination. Tunn Undergr Space Technol. 2018;79:274–85. doi:10.1016/j.tust.2018.05.019. [Google Scholar] [CrossRef]
18. Zhang J, Zhou X, Xu Q, Yang L. The inclination effect on CO generation and smoke movement in an inclined tunnel fire. Tunn Undergr Space Technol. 2012;29:78–84. doi:10.1016/j.tust.2012.01.006. [Google Scholar] [CrossRef]
19. Zhang X, Lin Y, Shi C, Zhang J. Numerical simulation on the maximum temperature and smoke back-layering length in a tilted tunnel under natural ventilation. Tunn Undergr Space Technol. 2021;107(8):103661. doi:10.1016/j.tust.2020.103661. [Google Scholar] [CrossRef]
20. Li J, Li Y, Cheng C, Chow WK. A study on the effects of the slope on the critical velocity for longitudinal ventilation in tilted tunnels. Tunn Undergr Space Technol. 2019;89(2):262–7. doi:10.1016/j.tust.2019.04.015. [Google Scholar] [CrossRef]
21. Jiang X, Chen X, Xiao N, Liao X, Fan C. Influence of the competitive effect of V-shaped slope tunnel on smoke characteristics. Tunn Undergr Space Technol. 2021;118(1):104193. doi:10.1016/j.tust.2021.104193. [Google Scholar] [CrossRef]
22. Fan C, Li X, Mu Y, Guo F, Ji J. Smoke movement characteristics under stack effect in a mine laneway fire. Appl Therm Eng. 2017;110:70–9. doi:10.1016/j.applthermaleng.2016.08.120. [Google Scholar] [CrossRef]
23. Ji J, Guo F, Gao Z, Zhu J, Sun J. Numerical investigation on the effect of ambient pressure on smoke movement and temperature distribution in tunnel fires. Appl Therm Eng. 2017;118:663–9. doi:10.1016/j.applthermaleng.2017.03.026. [Google Scholar] [CrossRef]
24. Lee SR, Ryou HS. A numerical study on smoke movement in longitudinal ventilation tunnel fires for different aspect ratio. Buil Environ. 2006;41(6):719–25. doi:10.1016/j.buildenv.2005.03.010. [Google Scholar] [CrossRef]
25. Ji J, Gao Z, Fan C, Sun J. Large Eddy Simulation of stack effect on natural smoke exhausting effect in urban road tunnel fires. Int J Heat Mass Tran. 2013;66(2):531–42. doi:10.1016/j.ijheatmasstransfer.2013.07.057. [Google Scholar] [CrossRef]
26. McGrattan KB, Forney GP, Floyd J, Hostikka S, Prasad K. Fire dynamics simulator (version 4)–user's guide. USA: US Department of Commerce, Technology Administration, National Institute of Standerds and Technology; 2005. [Google Scholar]
27. Alpert RL. Turbulent ceiling-jet induced by large-scale fires. Combustion Sci and Technol. 1975; 11(5–6):197–213. doi:10.1080/00102207508946699. [Google Scholar] [CrossRef]
28. Karlsson B, Quintiere J. Enclosure fire dynamics. America: CRC Press; 1999. doi:10.1201/9781420050219. [Google Scholar] [CrossRef]
29. Fan C. Studies on characteristics of tunnel fire development and natural ventilation mode using shafts (Ph.D. Thesis). University of Science and Technology of China: China; 2015. [Google Scholar]
30. He K. L., Wang X. H., Yang B., Sheng G. R. Ministry of housing and urban-rural development of the People's Republic of China. Code for design of urban road engineering. China: China Construction Industry Press; 2015 (In Chinese). [Google Scholar]
31. Quintiere JG. Scaling applications in fire research. Fire Saf J. 1989;15(1):3–29. doi:10.1016/0379-7112(89)90045-3. [Google Scholar] [CrossRef]
32. Tao H. Studies on the characteristics of fire-induced smoke and smoke control in underground interconnected infrastructure (Ph.D. Thesis). Centural South University: China; 2022. [Google Scholar]
33. Ingason H, Lönnermark A, Li Y. Model of ventilation flows during large tunnel fires. Tunn Undergr Space Technol. 2012;30(4):64–73. doi:10.1016/j.tust.2012.02.007. [Google Scholar] [CrossRef]
34. Ingason H, Lönnermark A. Heat release rates from heavy goods vehicle trailers in tunnels. Fire Saf J. 2005;40(7):646–8. doi:10.1016/j.firesaf.2005.06.002. [Google Scholar] [CrossRef]
35. Australian Building Codes Board. International fire engineering guidelines. Australia: Building Codes Board; 2005. [Google Scholar]
Cite This Article
 Copyright © 2024 The Author(s). Published by Tech Science Press.
This work is licensed under a Creative Commons Attribution 4.0 International License , which permits unrestricted use, distribution, and reproduction in any medium, provided the original work is properly cited.
 Downloads
 Citation Tools