
 Submit a Paper
 Propose a Special lssue
 Open Access
ARTICLE

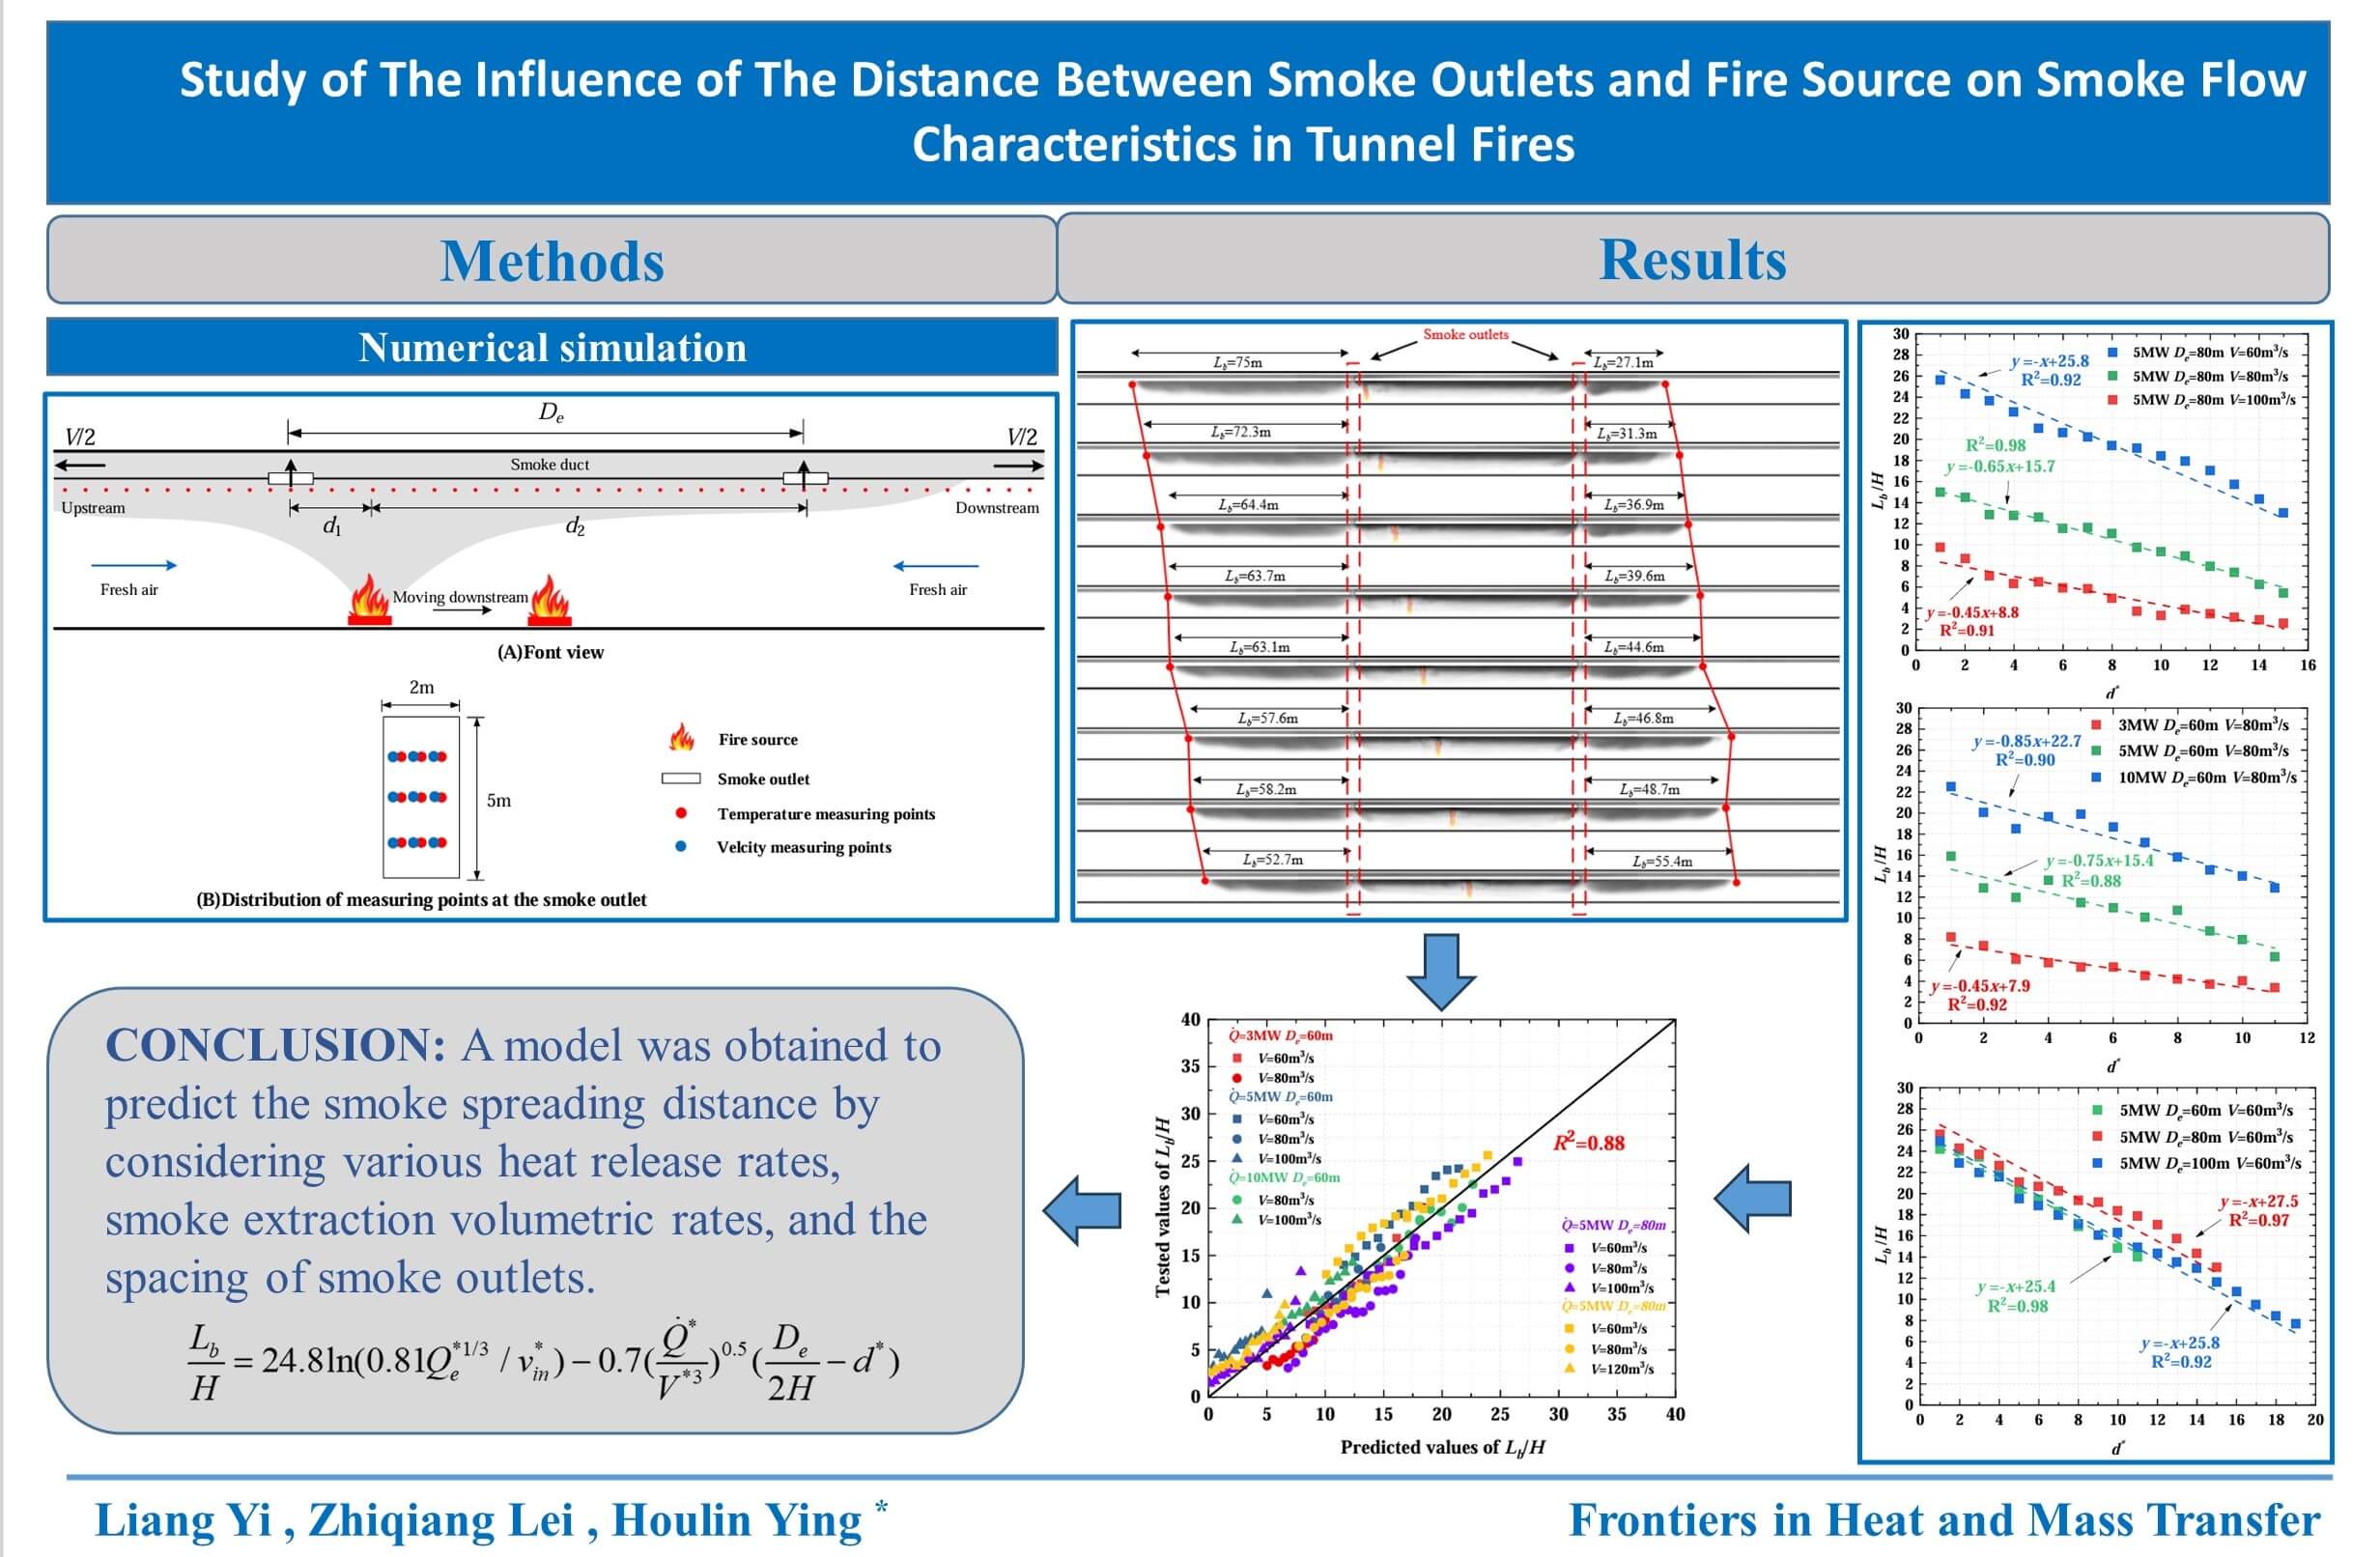
Study of the Influence of the Distance between Smoke Outlets and Fire Source on Smoke Flow Characteristics in Tunnel Fires
School of Civil Engineering, Central South University, Changsha, 410083, China
* Corresponding Author: Houlin Ying. Email:
(This article belongs to the Special Issue: Heat and Mass Transfer in Fire)
Frontiers in Heat and Mass Transfer 2024, 22(4), 977-996. https://doi.org/10.32604/fhmt.2024.053688
Received 07 May 2024; Accepted 17 June 2024; Issue published 30 August 2024
 View Full Text
 Download PDF
Abstract
This paper explores the smoke flow characteristics in tunnel fires, giving a particular emphasis on the effects of different distances between the smoke outlets and the fire source. It examines the smoke behavior under different conditions, including variations in heat release rates, exhaust volumetric flow rates, spacing between smoke outlets, and the longitudinal fire source positions. Results indicate that altering the fire source positions and the smoke outlets in the tunnel leads to variations in the properties of smoke flow both the fire source upstream and downstream; the distance between fire source and smoke outlet increases gradually, airflow rate decreases initially and eventually reaches a stable state. Similarly, smoke mass flow rate exhibits an increasing trend that eventually reaches a stable state. Moreover, the heat exchange between the tunnel walls and hot smoke increases as the smoke outlet moves further away from the fire source. This interaction leads to a reduction in the heat exhaust coefficient and a decrease in the distance the smoke spreads. This study investigates the impact of altering the relative longitudinal fire source positions and smoke outlet on smoke flow characteristics by numerical simulation. A theoretical analytical method is used to give a predictive model for the heat exhaust coefficient and the smoke spreading distance. This research can support the theory and technical process of tunnel smoke exhaust prevention and control.Graphic Abstract
Keywords
In the last twenty years, the number of tunnels had significant increase. Tunnels have become an important means of alleviating traffic pressure and optimizing traffic layout, providing convenient transportation options for people’s travel. The rise in the quantity of tunnels raises the probability of fire incidents occurring [1,2]. Examples include the appearance of a fire in Mont Blanc Tunnel [3] and another fire in Yanhou Tunnel [4] culminated in numerous fatalities and substantial financial damages. The safety of individuals’ lives is endangered by the smoke from fires, and about 85% of victims die from toxic smoke [5]. Mechanical smoke extraction is frequently employed to manage smoke and ensure the safety of individuals within the tunnel, while also creating a suitable environment for rescuers to conduct operations. There are three main methods of mechanical exhaust extraction in tunnels: longitudinal smoke extraction, centralized smoke extraction from the top, and lateral smoke extraction. Numerous researchers have extensively studied centralized smoke extraction, with a primary emphasis on enhancing smoke exhaust efficiency and minimizing the distance smoke spreads.
The mechanical smoke extraction system performance is a vital measure to evaluate the smoke extraction system’s efficacy. Vauquelin [6] examined the smoke extraction system’s effectiveness and suggested two crucial parameters that would evaluate the smoke extraction system’s capability by means of the utilization of the cold smoke study methodology. However, this cold smoke experimental approach differs from the actual burning situation. The reason for this is that heat transfer was not considered. Plug-holing causes cold air to flow into the smoke outlets, diminishing the volume of hot smoke that is released. This ends up resulting in higher energy usage. Li et al. [7] applied a critical Froude number to approximate the plug-holing probability by performing computational simulations with varying exhaust velocities and heat release rates. Furthermore, a parameter for identifying the initiation of plug-holing was obtained. Jiang et al. [8] performed investigations to propose an evaluation principle for non-plug-holing, the transitional stage, and the appearance of plug-holing by experiments. According to Zhao et al. [9], the exhaust volumetric flow rate at which plug-holing occurs increases when the heat release rate (HRR) and aspect ratio expand. This was shown in small-scale experiments where HRRs and smoke outlet settings were varied. Furthermore, when the smoke outlet area grows, the exhaust volumetric flow rate at which plug-holing happens also increases. Yi et al. [10] utilized a series of experiments and investigated the system’s efficiency in terms of heat removal. Moreover, the heat exhaust coefficient increases when the outlets are located in closer proximity to the fire source. Yan et al. [11] conducted a series of numerical simulations to investigate the smoke control efficiency in a large cross-section tunnel equipped with a two-point central smoke extraction system. The results indicated that a higher smoke exhaust rate increases the smoke control efficiency and the longer smoke outlet perpendicular to the longitudinal axis of the tunnel can control smoke better than the shorter one. Liu et al. [12] analyzed the synergistic effect of smoke outlet layout and smoke extraction rate on the performance of the central smoke extraction system. Their results showed that increasing the smoke extraction rate and smoke outlet width can improve the ventilation system efficiency.
Smoke spreading can impede escape and rescue, and smoke must be removed from the tunnel in a reasonable way. Li et al. [13] made a model that calculates the dimensionless smoke spreading distance, taking into account the effects of longitudinal ventilation. In view of this idea, Chen et al. [14] modified the dimensionless smoke spreading distance model created by Li et al. [13] and developed a computational model to forecast the distance at which smoke spreads in a tunnel with one exhaust outlet positioned above the fire source by applying the fire source heat release rate modifying method. Then, Chen et al. [15] investigated situations in which the exhaust outlet positioned the fire source downstream and subsequently modified the aforementioned model by doing experiments on the same small-scale model. Based on the same theory, Tang et al. [16] performed studies using the identical tunnel model and examined the scenario in which the smoke outlet is positioned before the fire source. Wang et al. [17] established a unified smoke spreading distance prediction model by combining the physical laws of conservation of energy and mass to quantify the smoke spreading distances for these three scenarios. Jiang et al. [18] established an equation that defines the correlation between the distance at which smoke spreads and the rate of induced airflow in a centralized smoke exhaust system with only two smoke outlets, derived from small-scale model experiments. Liu et al. [19] proposed a predictive model for the back-layering length of the smoke downstream of the centralized smoke outlet considering the smoke exhaust efficiency, smoke outlet layout, and the distance between the fire source and smoke outlet by combining the physical laws of conservation of energy and mass.
However, a significant portion of the prior research was carried out under the expectation that the fire source exists in the tunnel’s center and that it is equidistant from smoke outlets on both sides, or there is only one smoke outlet. The issue of smoke development could be segmented into four clearly defined stages: the stage of plume ascent, the stage of radial spread, the transition stage, and the one-dimensional horizontal spread stage [20]. If the fire source is equidistant from both exhaust outlets, the smoke should move in a symmetrical manner in both directions. However, if the fire source is not symmetrical from both smoke outlets, the hot smoke created by the combustion of the fire source will not be at an equal distance from the smoke outlets. So there exist disparities in the reduction of velocity, the behavior of air entrainment, and the transmission of heat on the fire source both upstream and downstream [21]. In this study, we focus on the difference in smoke flow characteristics upstream and downstream of the fire. This work aims to examine the variations in smoke flow characteristics resulting from the alteration in the longitudinal fire source location while considering variable HRRs, exhaust volumetric flow rates, and smoke outlet spacing by integrating theoretical analysis with numerical simulation. Based on the discussion of the influence of relative longitudinal fire sources, a predictive model applied heat release rate modifying method for smoke spreading distance was proposed. This study hopes to contribute to the development of both the theoretical framework and technical methods for tunnel smoke emission prevention and control.
The continuous advancement of computer technology has empowered Fire Dynamics Simulator (FDS) to handle increasingly complex, sophisticated, and accurate numerical calculations. Numerical simulation has a more significant advantage in adjusting variable conditions and obtaining detailed parameter distributions than experimentation. The FDS has become prevalent in different fire scenarios, like tunnel fire [22,23], compartment fire [24,25], energy storage station fire [26], and its efficacy has been well-proven. In this study, FDS was used for numerical simulation studies.
As displayed in Fig. 1, the horizontal road tunnel was designed using the FDS, a modeling system that replicates the tunnel environment. The tunnel has measurements of 500 m in length, 5 m in width, and 9 m in height. Two smoke outlets were positioned in the model tunnel ceiling, each measuring 5 by 2 m. The smoke outlet’s short side lies parallel to the tunnel’s longitudinal axis. The distance from one smoke outlet to another was designated as De, which varied from 60 to 100 m at an interval of 20 m. The fire source is positioned along the tunnel’s longitudinal axis and is positioned between two smoke outlets. d was defined as the distance between the fire source and a single smoke outlet. More specifically, d1 is the distance between the fire source and its upstream smoke outlet, and d2 is the distance between the fire source and its downstream smoke outlet. When the fire source exists at the initial position, d1 is 5 m. To study the impact of varying lengths from the fire to smoke outlets on smoke characteristics, the fire source was relocated from its initial position to the midpoint of the two smoke outlets in increments of 5 m until d1 was equal to d2. In the tunnel equipped with the centralized smoke extraction system, the top smoke duct is connected to external shafts at both ends. The fans in both shafts will switch on at the same time after the occurrence of fire. Thus, the exhaust volumetric flow rates upstream and downstream are the same in the smoke duct, as shown in Fig. 1.
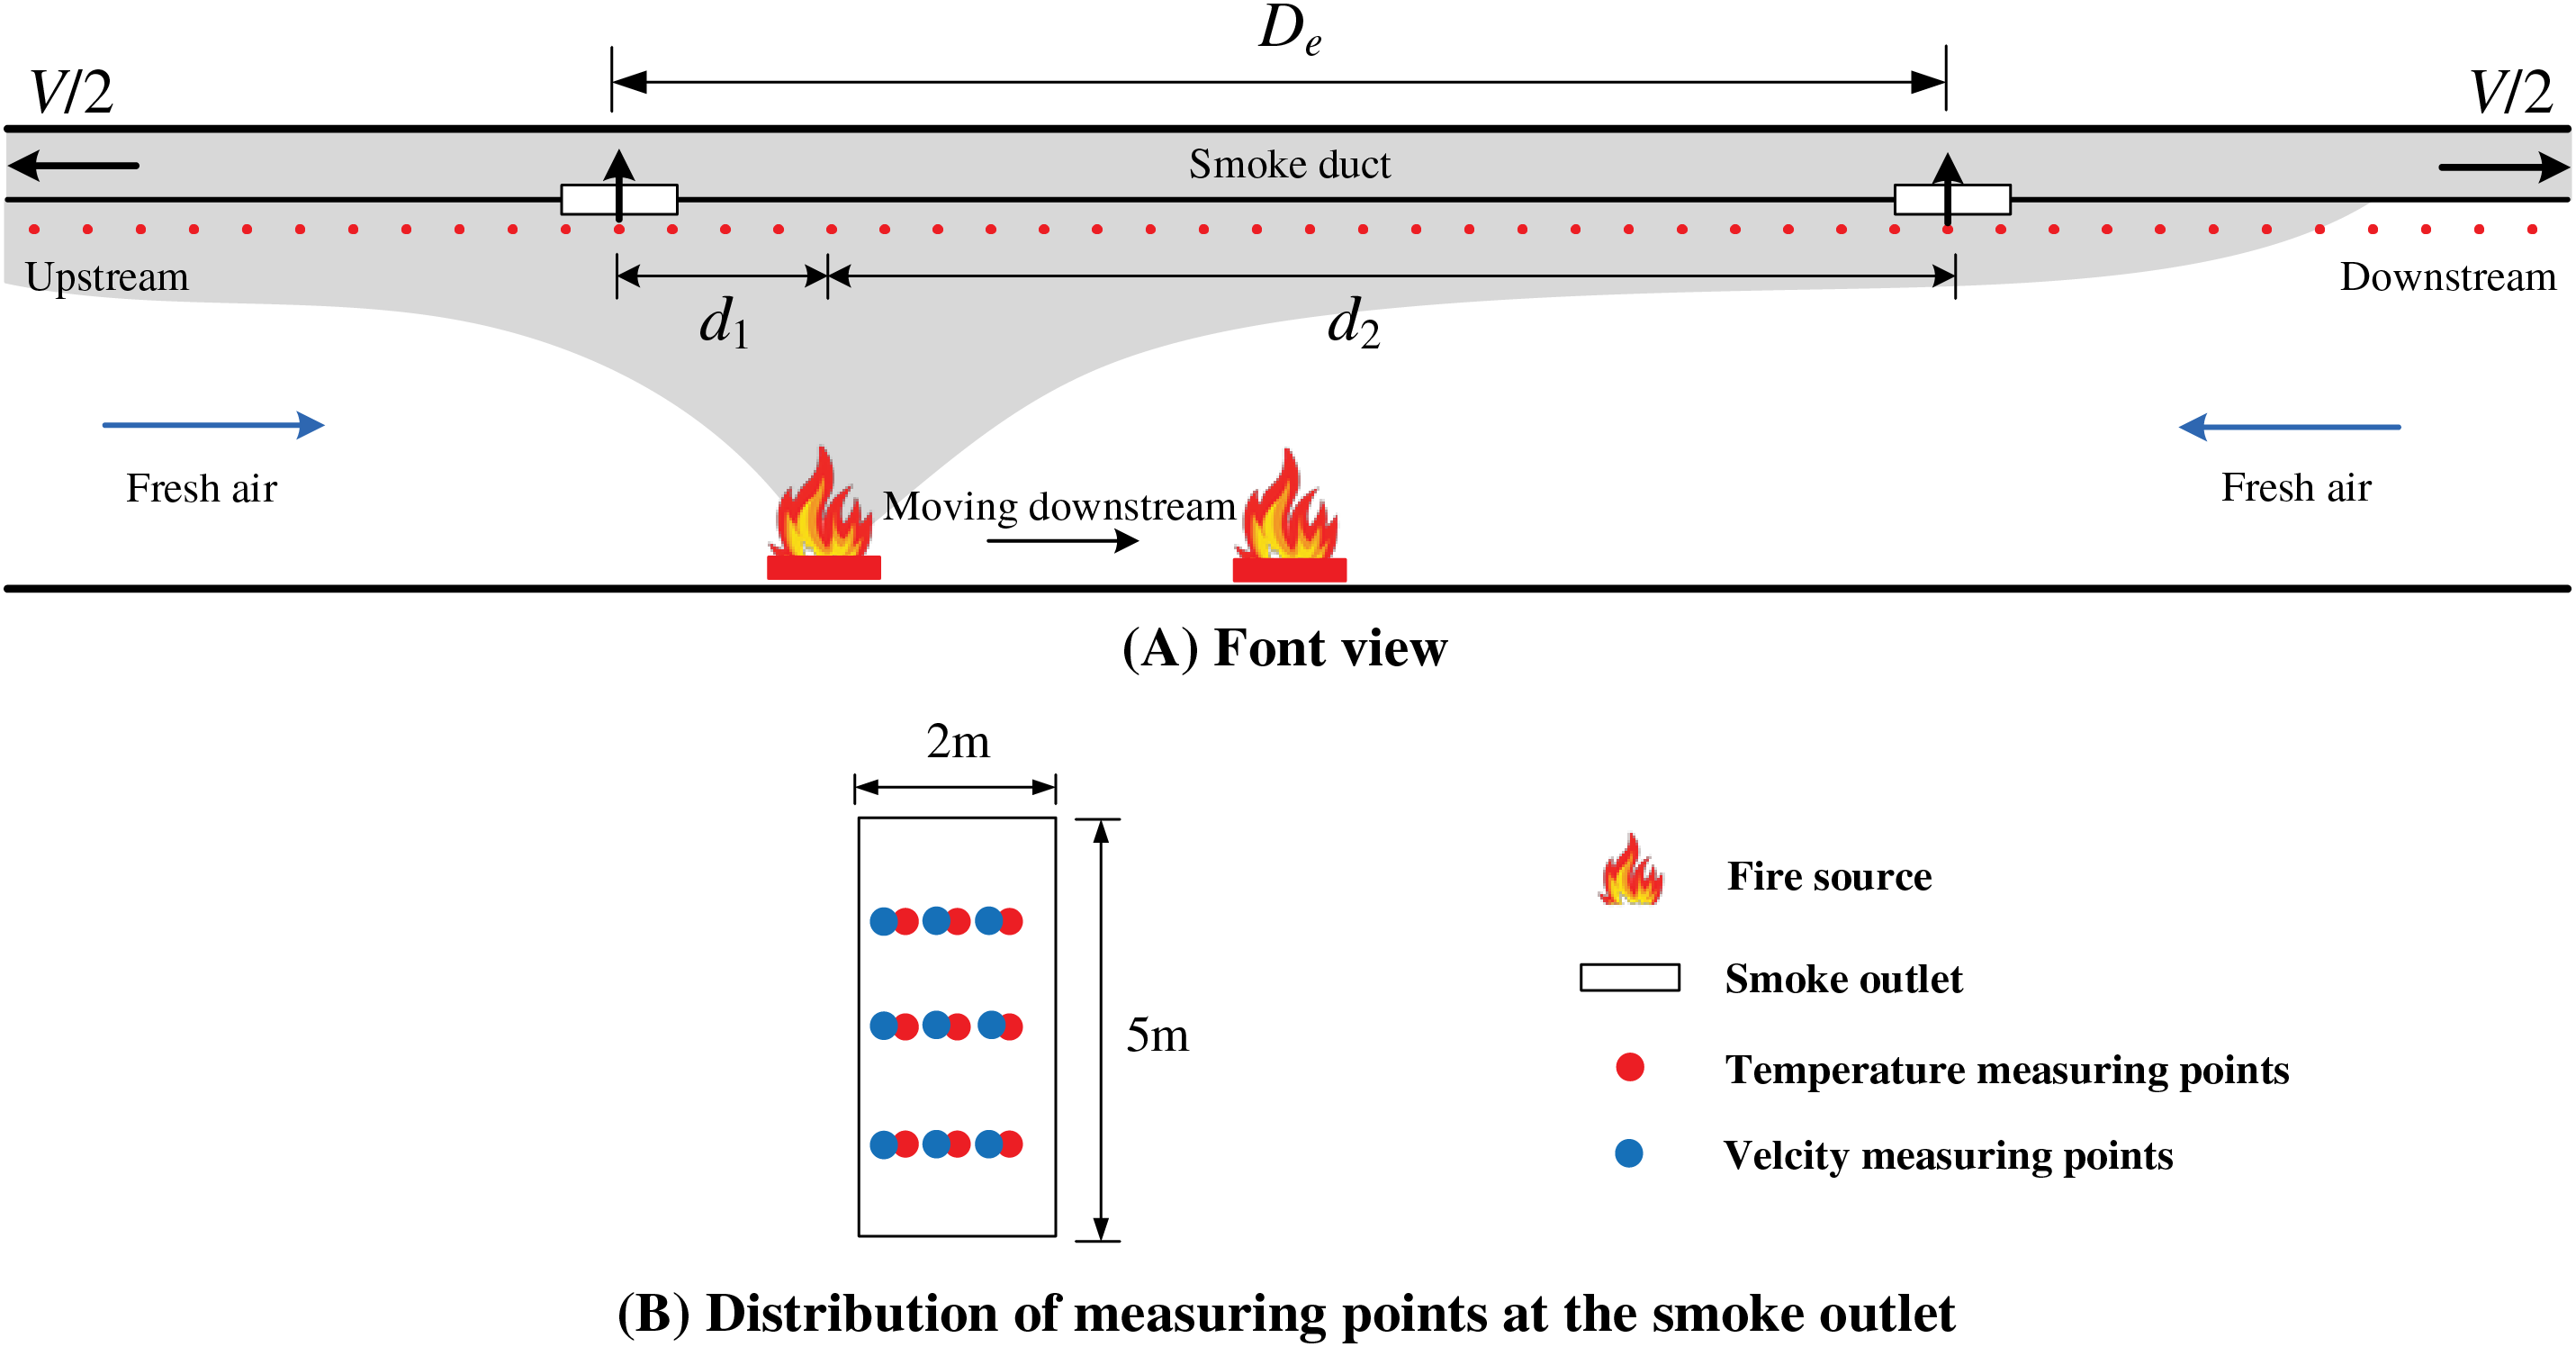
Figure 1: Model tunnel configuration
By dictating a heat release rate per unit area over a 4 m2 square solid surface which is parallel with the floor, the fire source boundary conditions have been established. The current temperature of the surroundings is 293 K, and the current pressure of the surroundings is 101 kPa. Temperature sensors were strategically set up 0.2 m below the tunnel ceiling centerline, spaced with a spacing of 1 m along the tunnel longitudinal axis. Nine measurement points for temperature and velocity were strategically positioned at the smoke outlet.
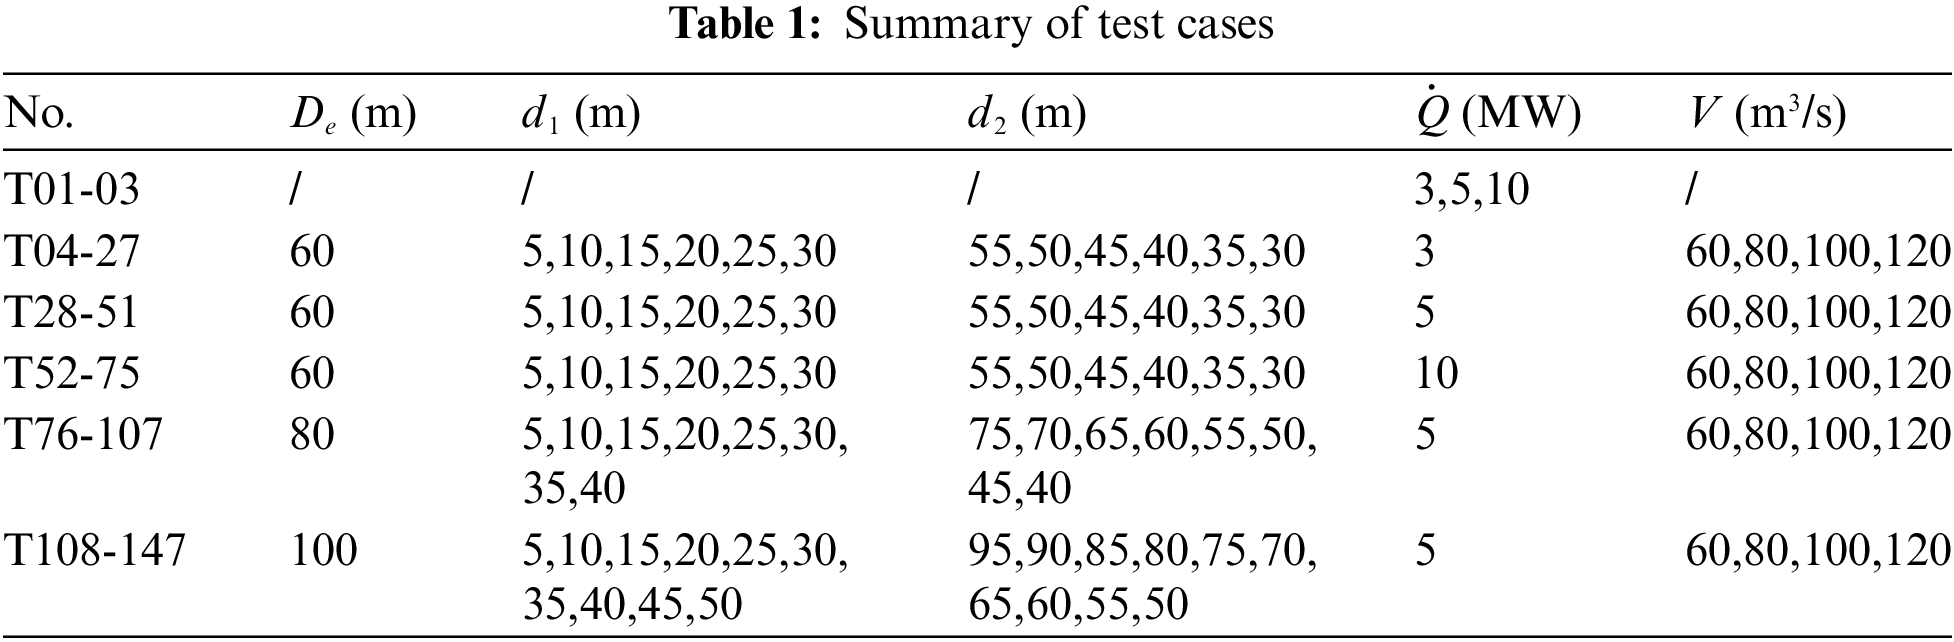
In sum, 147 test cases were established, as detailed in Table 1. Three smoke outlet spacing and 6~10 longitudinal fire source positions were considered. The heat release rates were set at 3, 5, and 10 MW, to simulate vehicle fire [27]. The exhaust volumetric flow rates were 60, 80, 100, and 120 m3/s.
The size of the grid is a vital factor that directly impacts the precision of the simulation outputs. Optimal grid size has significance for achieving accurate numerical simulation results and ensuring computational efficiency. In numerical simulations, the dimensionless parameter
where
The recommended
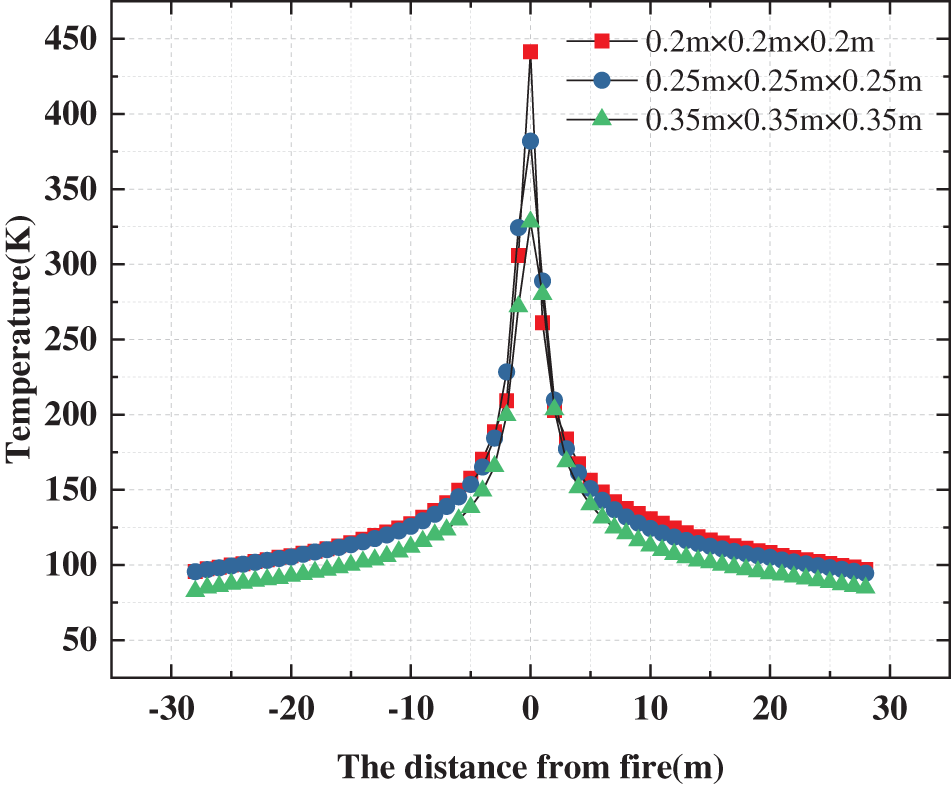
Figure 2: Variations in mesh diameters affect the temperature distribution along the length of the ceiling (
3.1 Influence of Distance between Fire and Smoke Outlet on Mass Flow Rate
When smoke transitions from the point of origin to the ventilation outlet, a large volume of air is drawn in. This mostly happens during three stages: plume rise (Stage 1), one-dimensional longitudinal spreading (Stage 2), and smoke discharge from the smoke outlet (Stage 3) [29], as represented in Fig. 3. This work specifically examines the phenomenon of air entrainment in Stage 3.
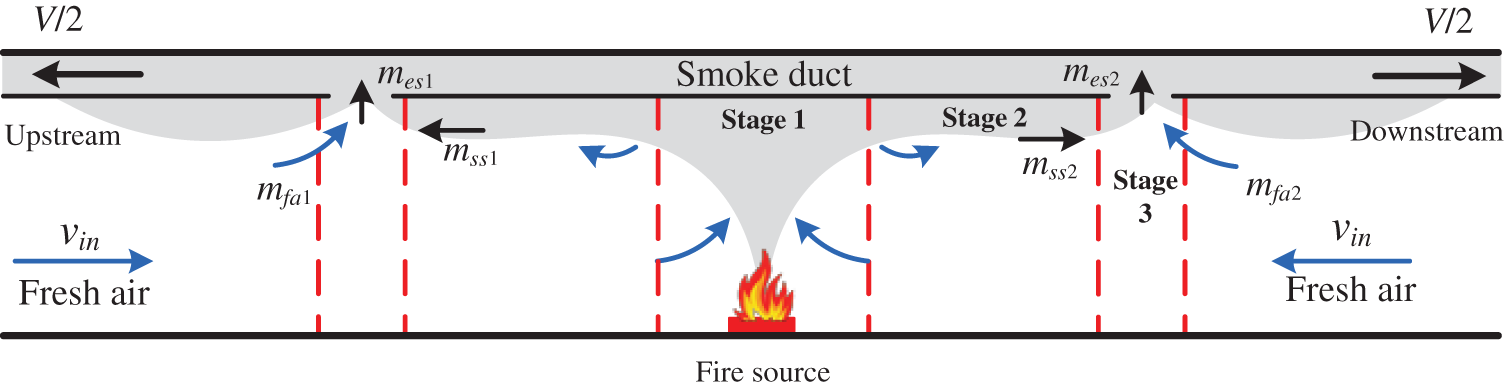
Figure 3: Illustration depicting the centralized smoke extraction system
The smoke mass flow rate emitted from the smoke outlet is determined by adding the smoke mass flow rate generated at the fire source to the fresh air mass flow rate that is drawn in, as indicated by the following equation:
where
Depending on the principle of energy conservation, the following equations could be expressed:
where
Combining Eqs. (4) and (5) with Eq. (2), the following equation can be expressed:
The fresh air mass flow rate and smoke mass flow rate can be calculated using Eqs. (2) and (6). Fig. 4 demonstrates the trend of mass flow rate with longitudinal fire positions at the smoke outlet, considering various heat release rates. Fig. 4a demonstrates that
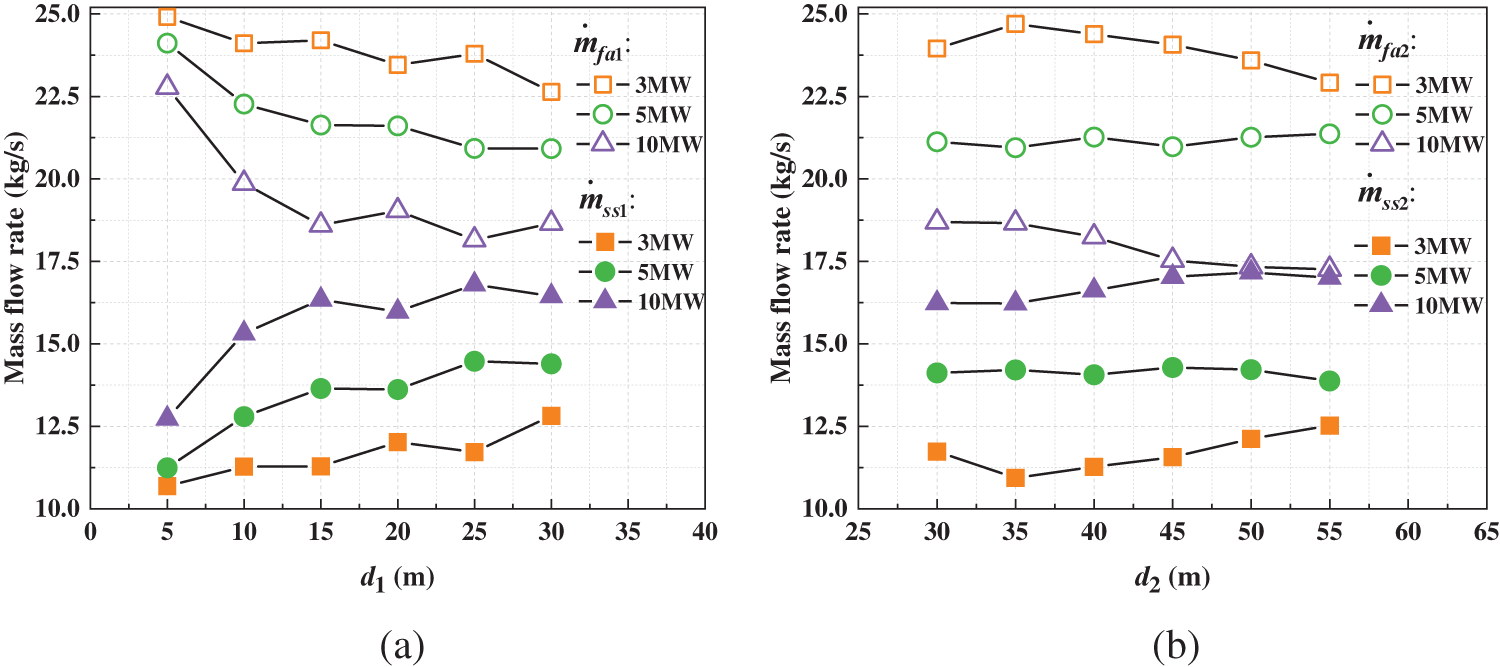
Figure 4: Evolution of mass flow rate with different HRRs and different distances between fire and smoke outlet (V = 60 m3/s, De = 60 m) for (a)
Fig. 5 displays the changes in the
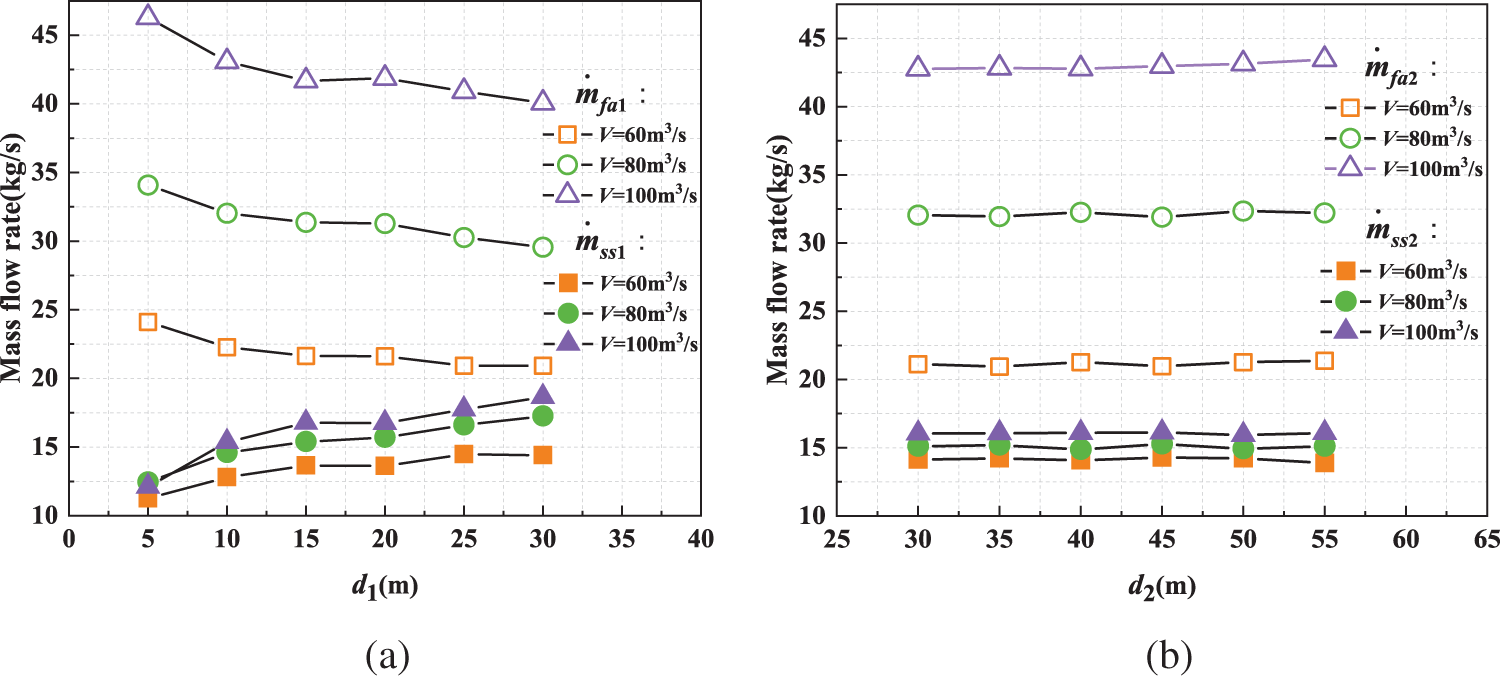
Figure 5: Evolution of mass flow rate with different smoke extraction rates and different distances between fire and smoke outlet (
Fig. 6 illustrates the changes in
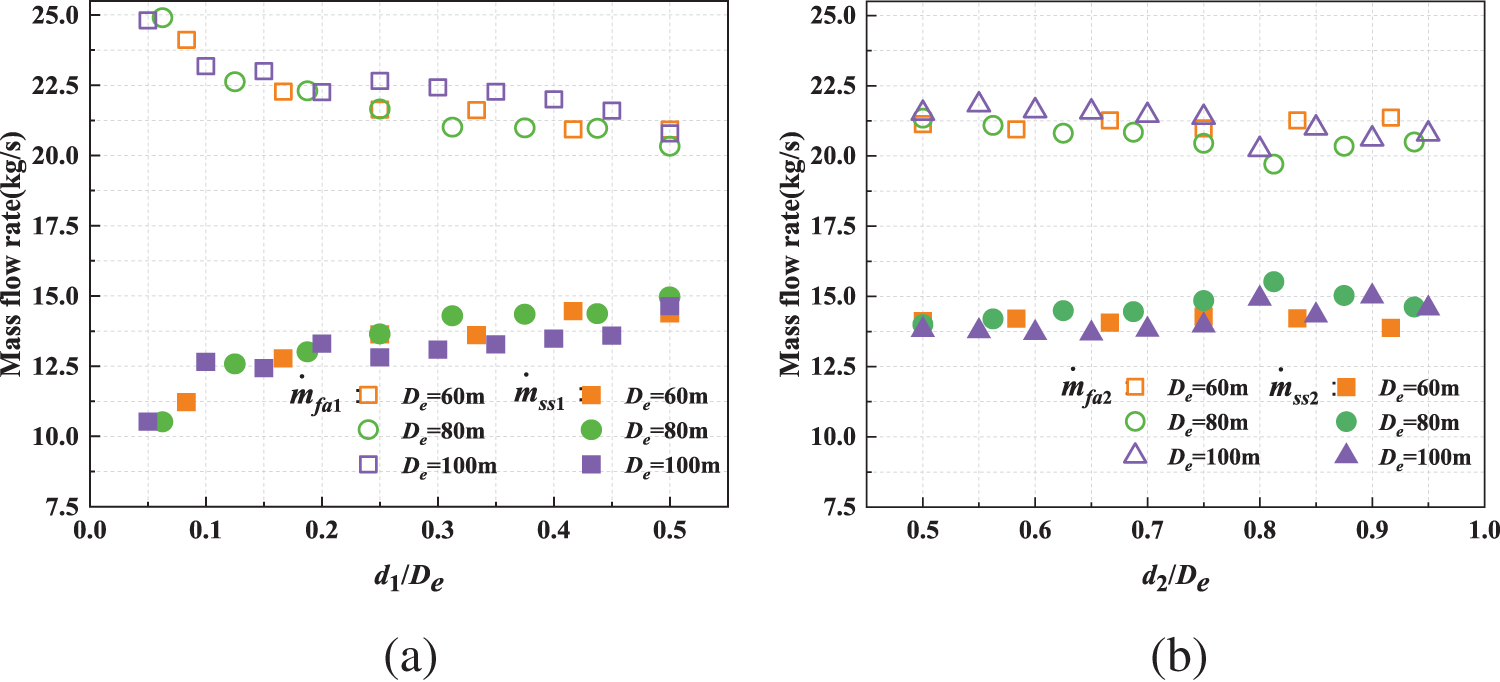
Figure 6: Evolution of mass flow rate with different distances between two smoke outlets and different distances between fire and smoke outlet (
3.2 Influence of the Distance between Fire and Smoke Outlet on Heat Exhaust Coefficient
Given the unpredictability of fire locations, the length from the fire to its nearest upstream and downstream smoke outlets can vary. Consequently, this impacts the heat transfer both before and after the fire source. Define the heat exhaust coefficient as the ratio of the heat expelled from the exhaust outlet to
where
When the fire source is equidistant from both sides of the smoke outlet, two outlets should discharge the same heat. In this scenario, a single smoke outlet’s heat exhaust coefficient can be denoted as
The fundamental magnitudes are selected as the primary quantities, representing the four basic physical quantities
In accordance with similarity theory, Eq. (9) should be substituted with the Eq. (10):
From Eq. (10),
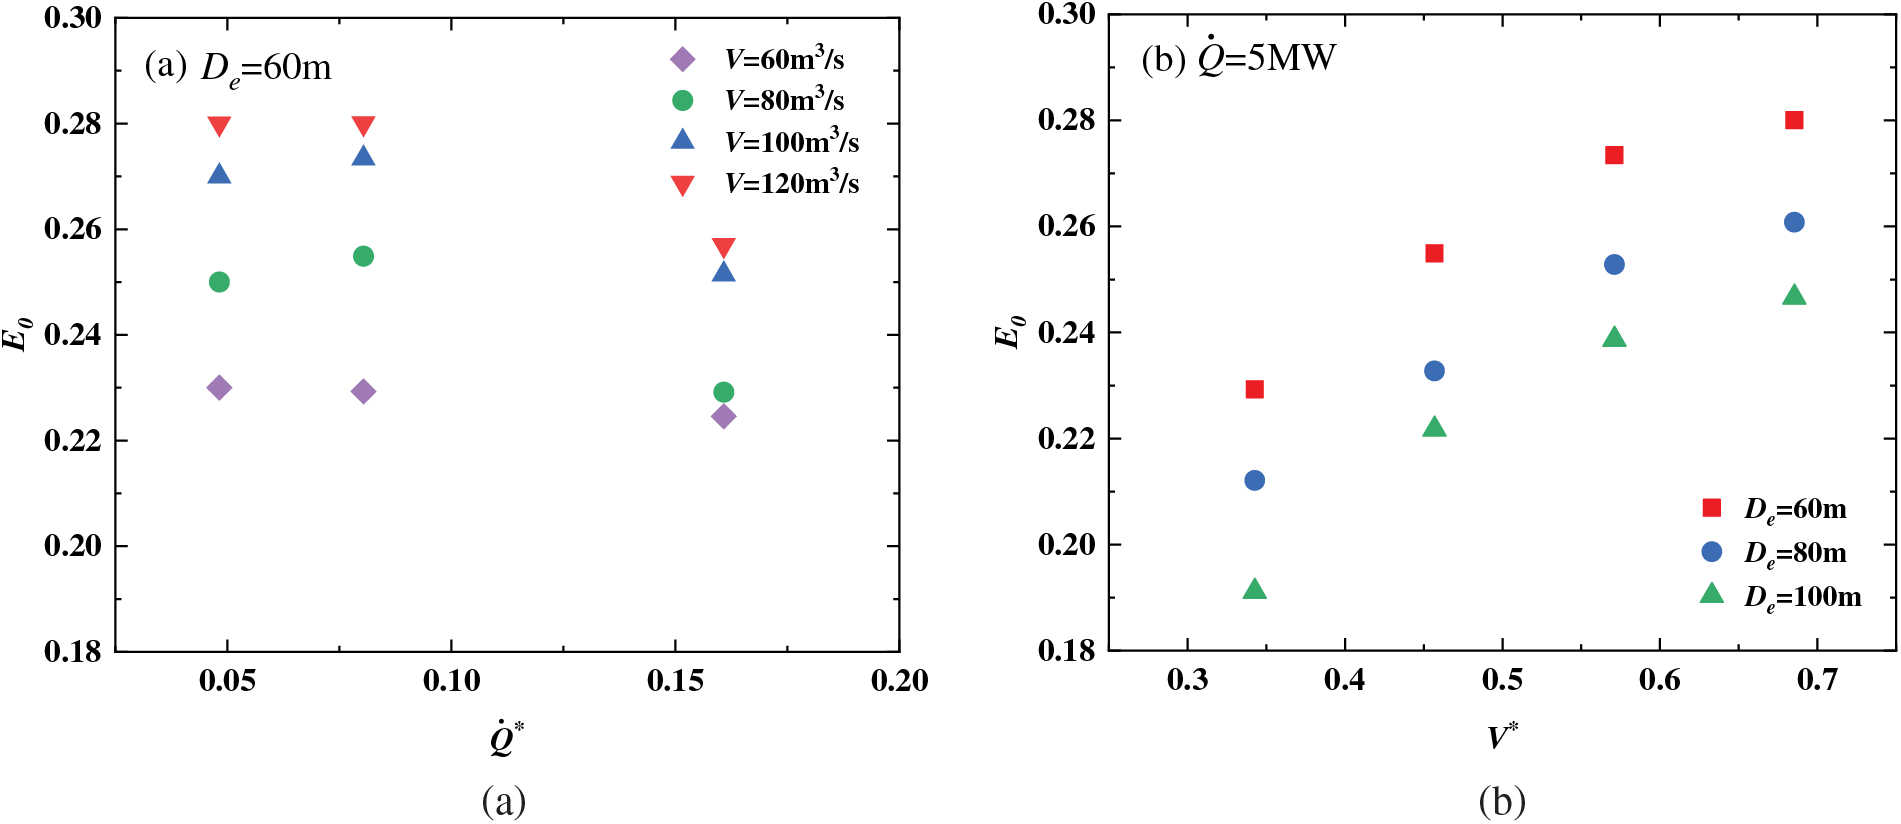
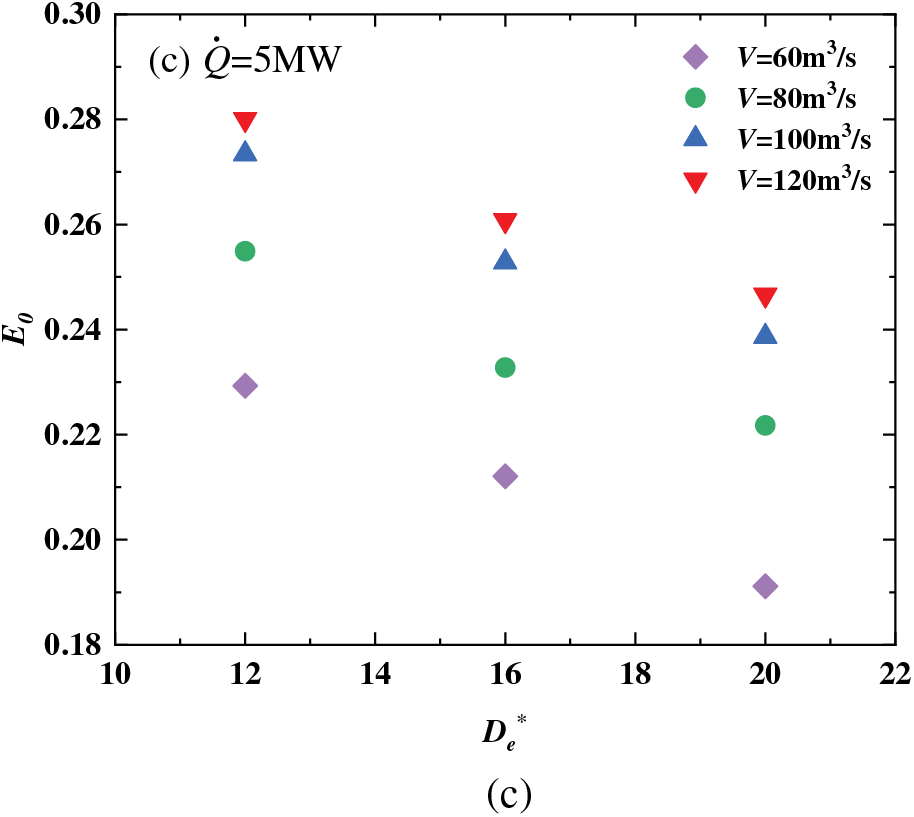
Figure 7: Evolution of E0 (a) with different heat release rates, (b) with different smoke extraction rates, (c) with different distances between two smoke outlets
To explore the relationship among
where
By analyzing the data we obtained the formula for
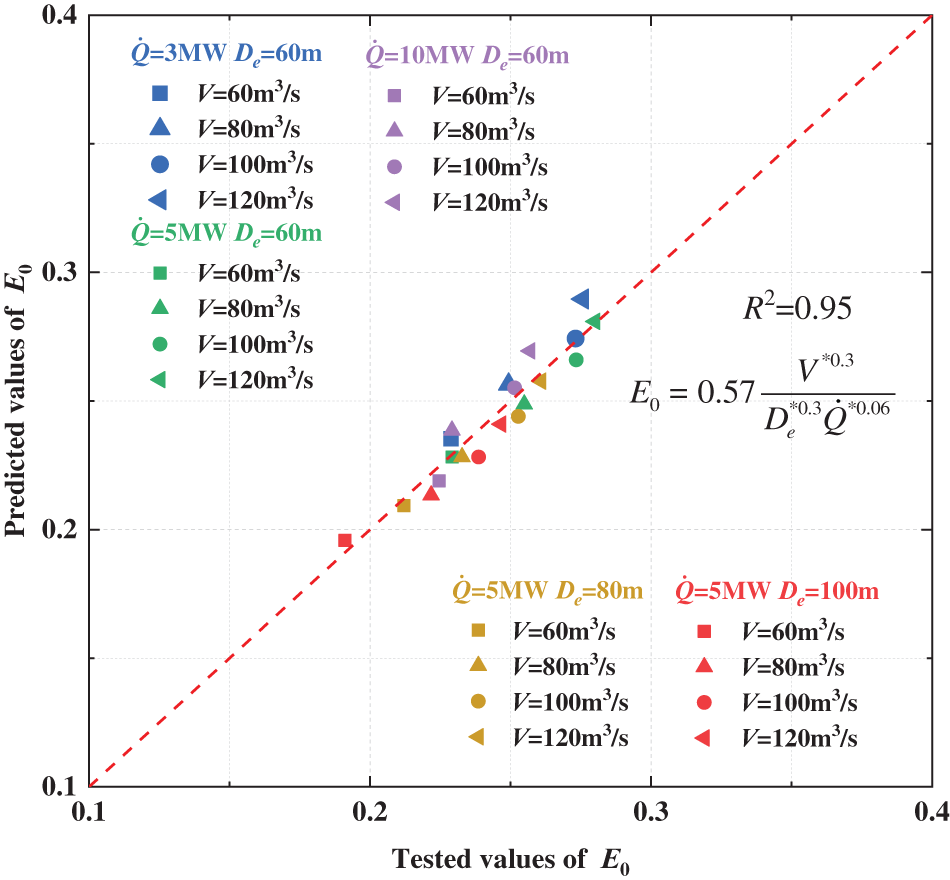
Figure 8: Test results vs. results by the proposed model
Fig. 9 depicts the variation in
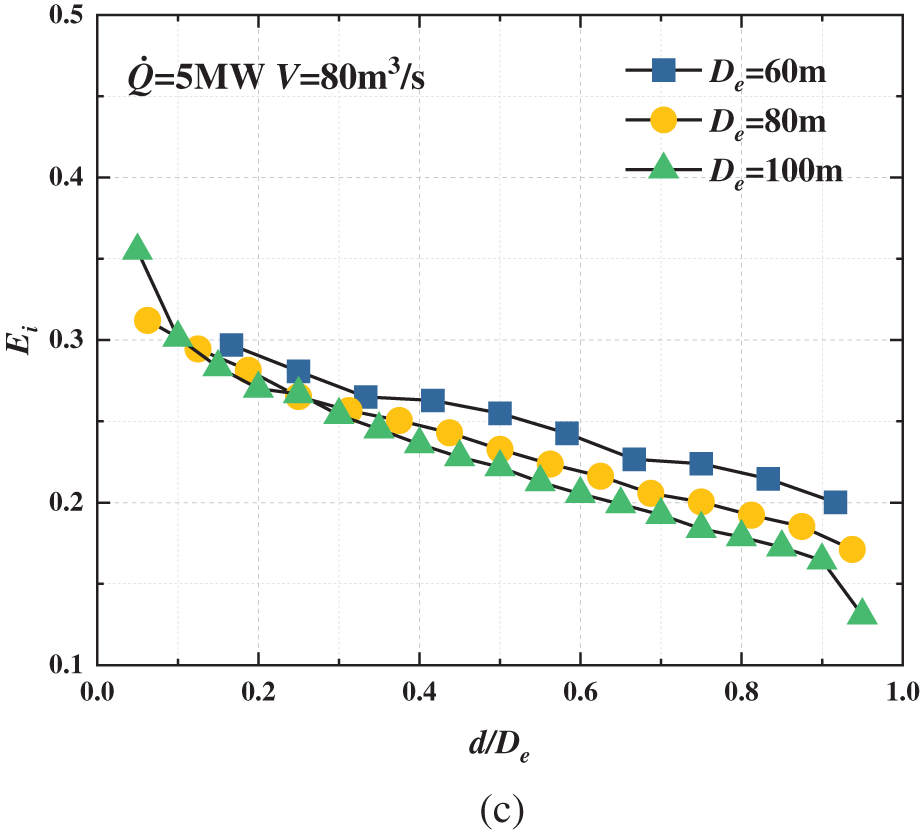
Figure 9: Evolution of
The previous investigation indicates a negative link between
Fig. 10 demonstrates the functional relationship between
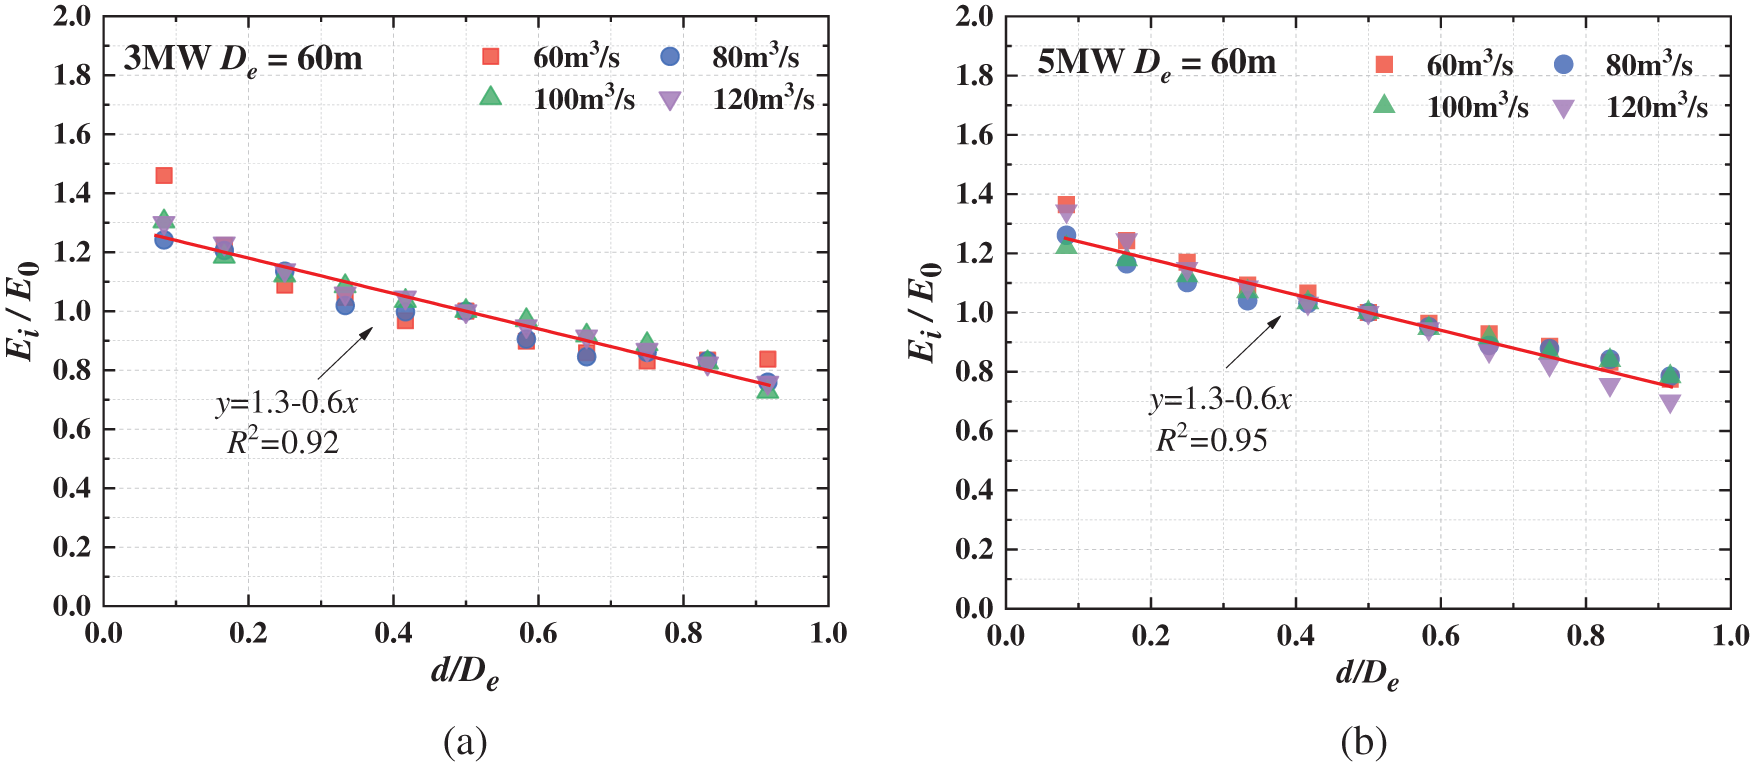
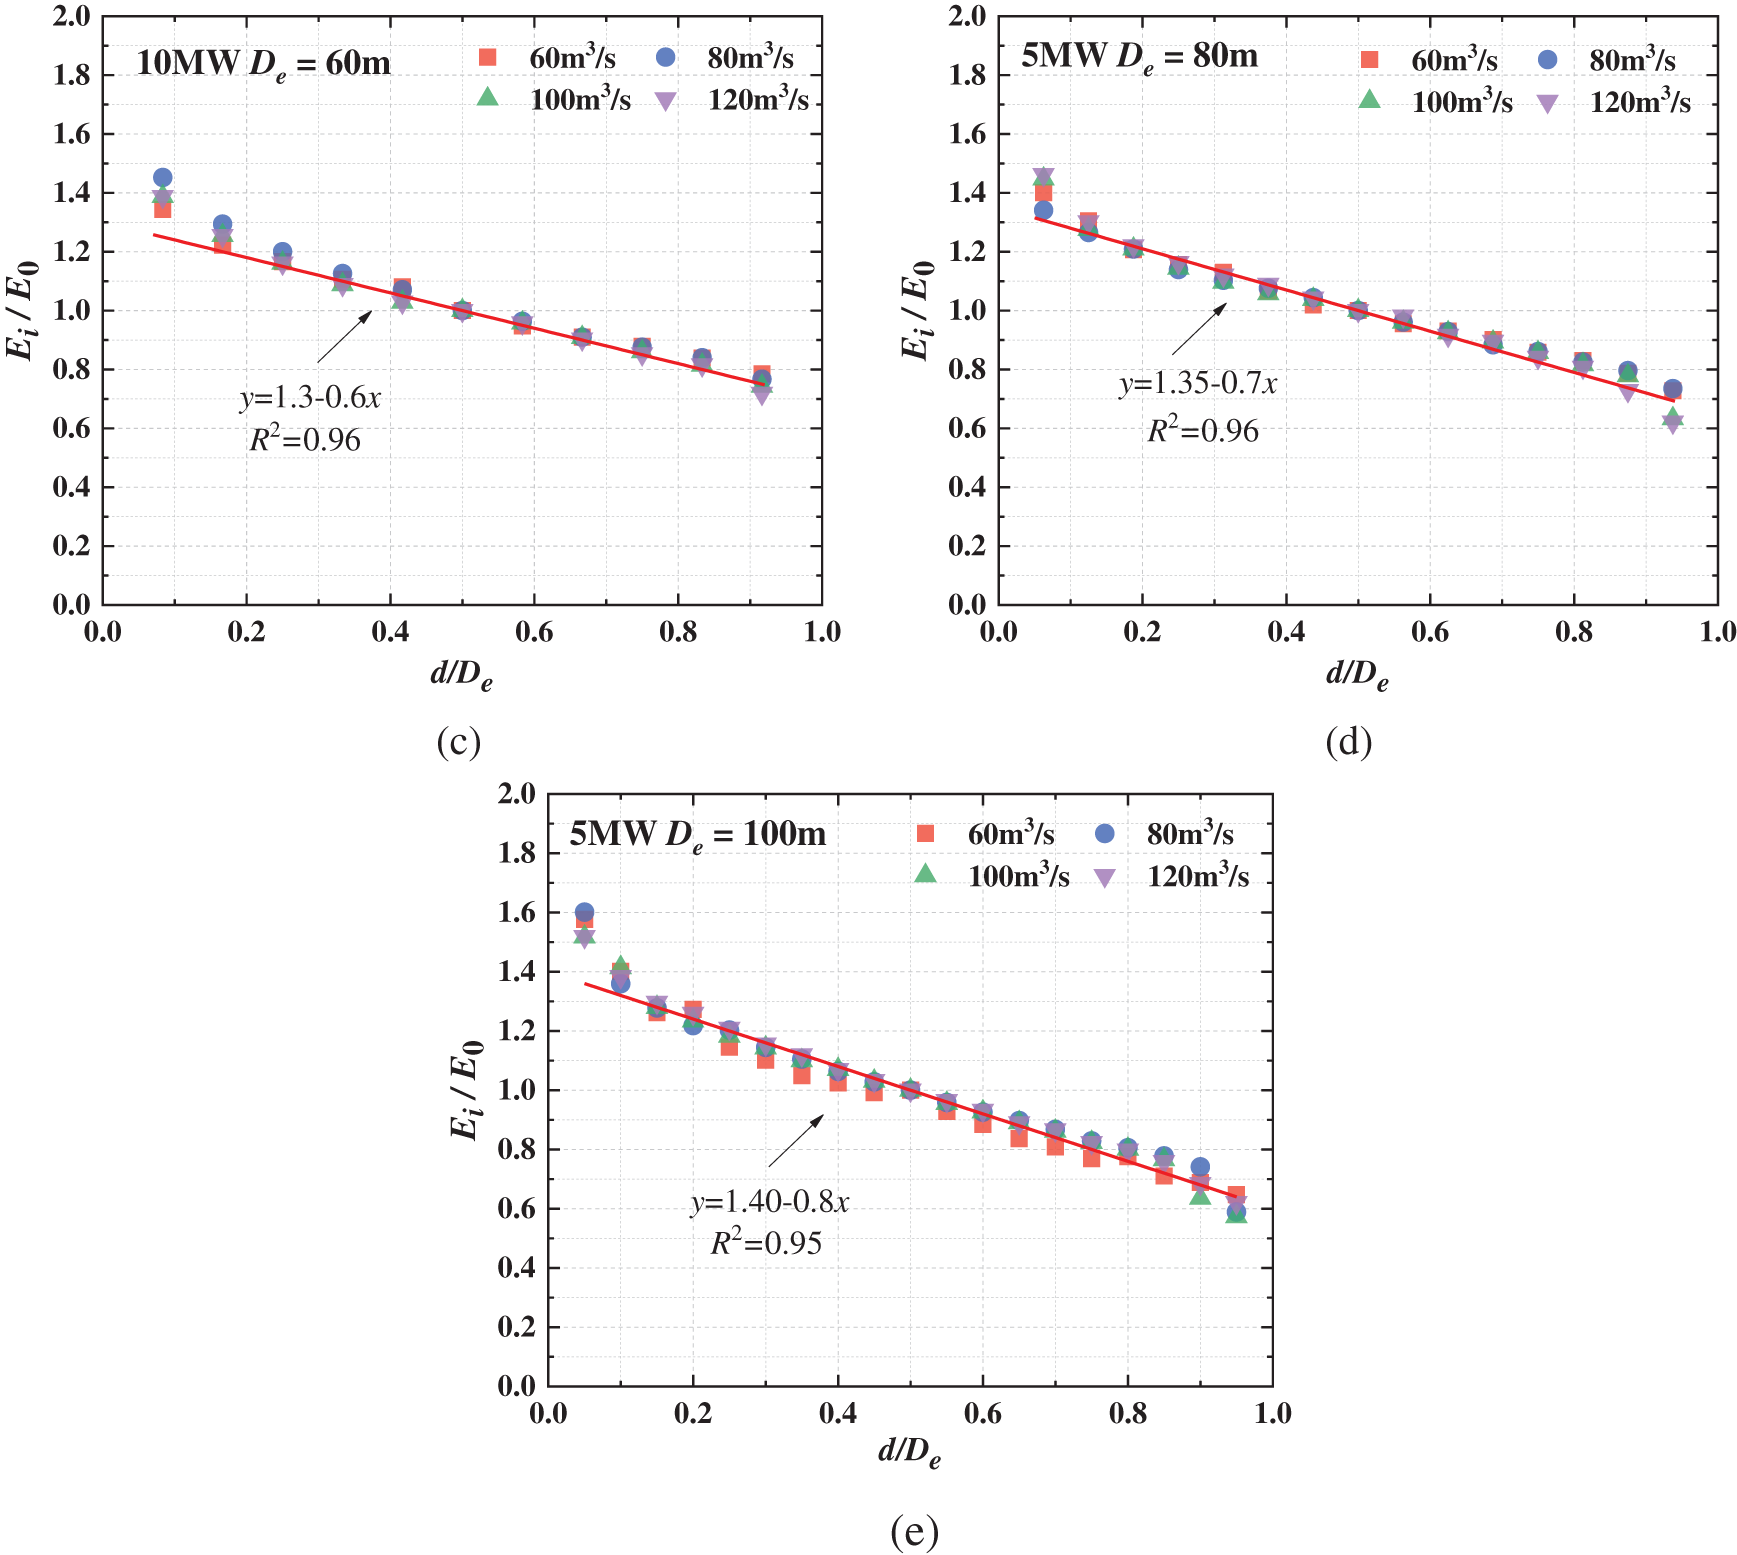
Figure 10: The relationship between
Bringing Eq. (14) into the relationship obtained from the fit, the following equation can be derived:
By linking Eqs. (12) and (15), we can derive a prediction model Eq. (16) for the
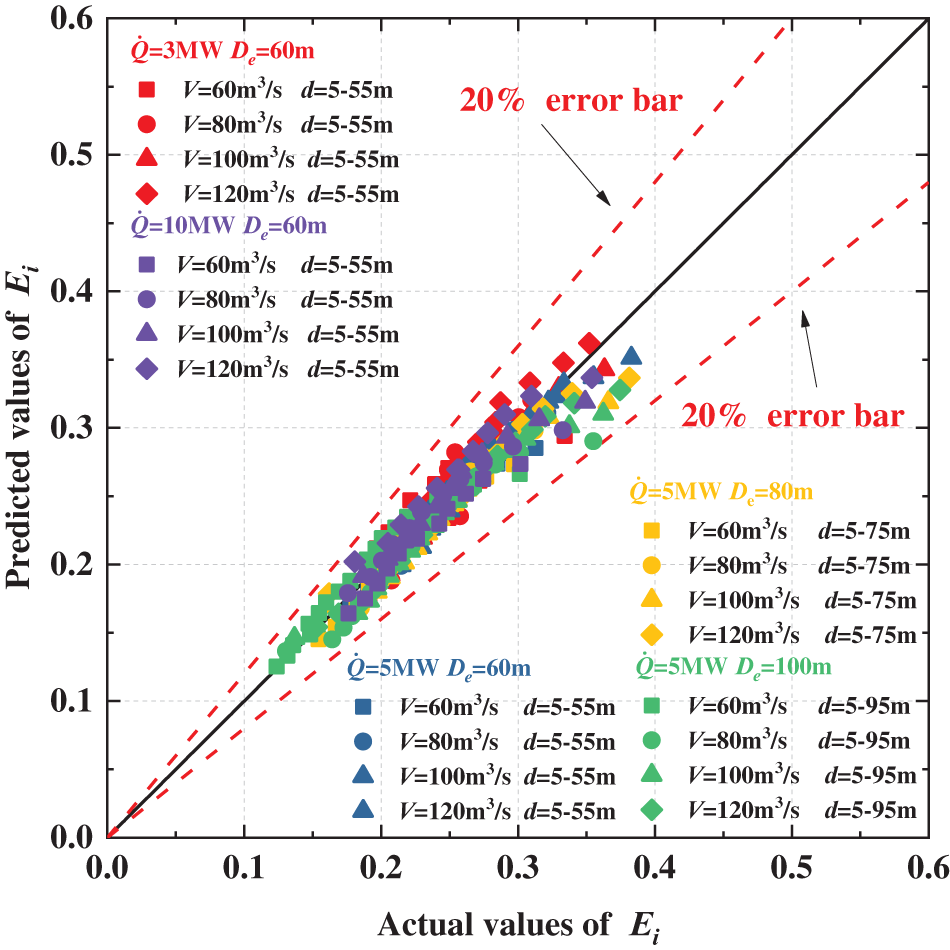
Figure 11: Test results vs. results by the proposed model
3.3 Influence of the Distance between Fire and Smoke Outlet on Smoke Spreading Distance
The length from the smoke exhaust outlet to the smoke front was defined as Lb which is called smoke spreading distance [30]. Fig. 12 illustrates the smoke movement under various fire source positions. The figure clearly demonstrates that while
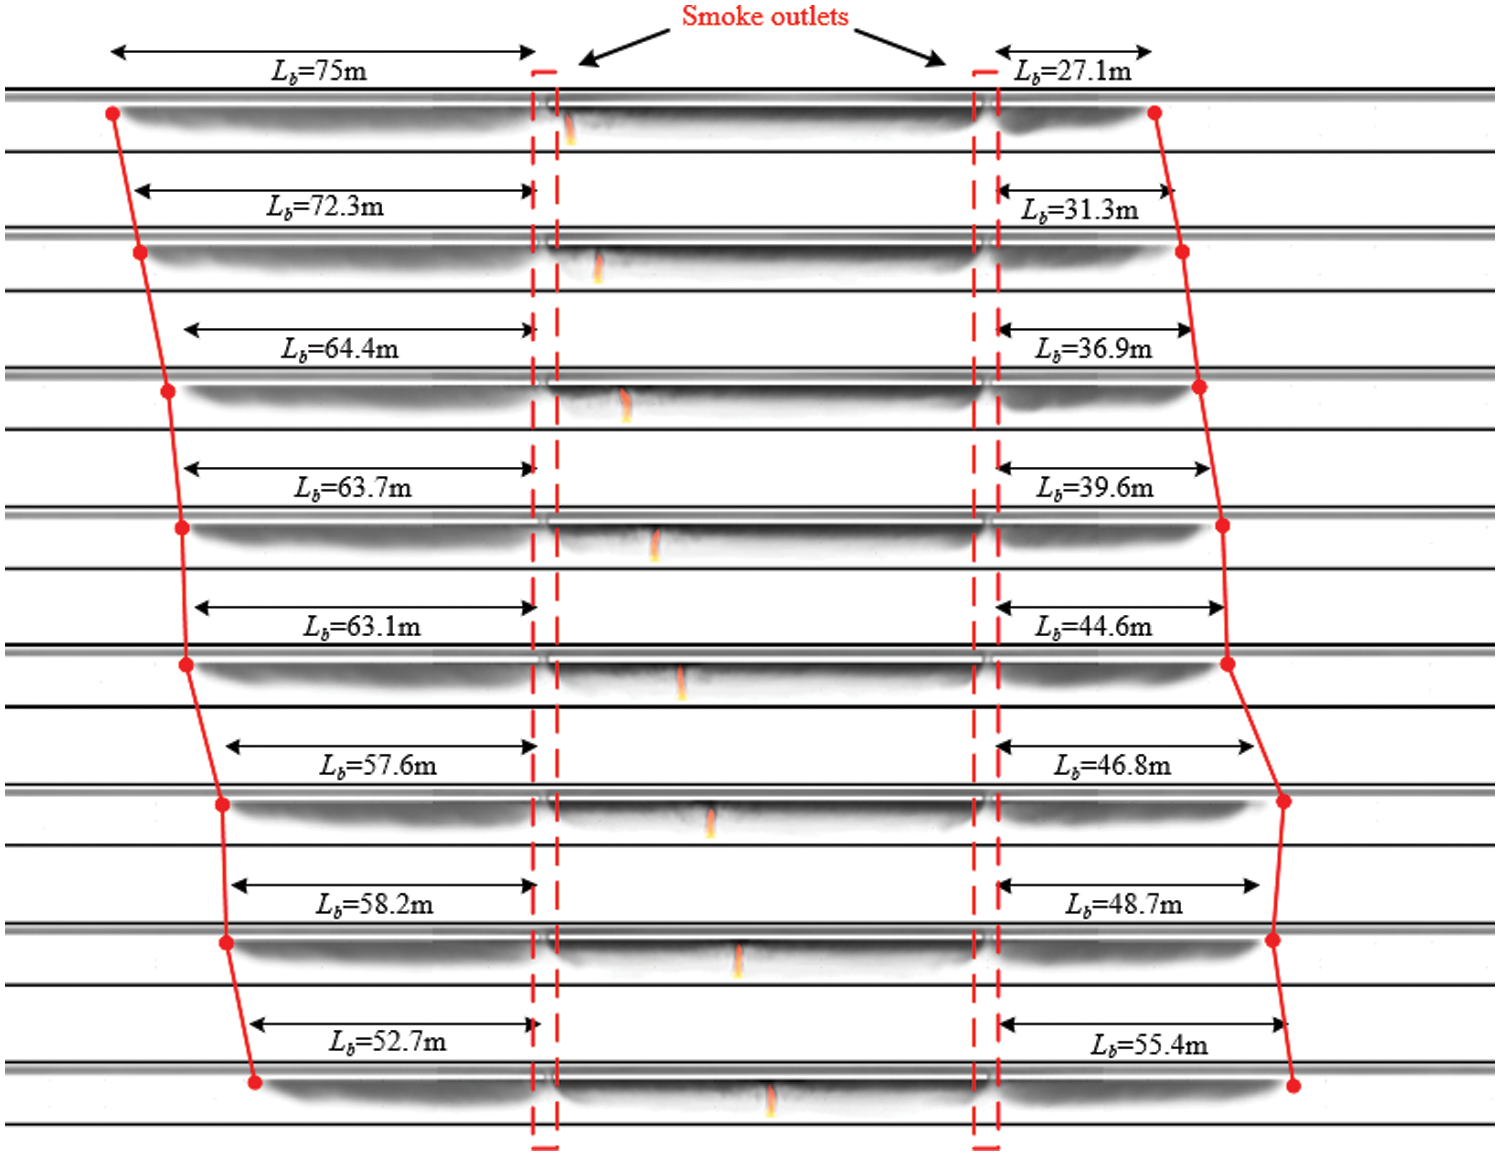
Figure 12: Evolution of smoke spread distance with varying longitudinal fire locations (
Li et al. [13] gave a model for calculating the dimensionless smoke spreading distance combined with theoretical analysis, which can be represented by the subsequent equation:
where v is the longitudinal velocity, m/s;
When d1 = d2, the heat produced by the fire source is discharged through the smoke outlets. Simultaneously, the remaining heat carried by the one-sided smoke in the tunnel due to the extraction effect
The dimensionless induced flow velocity can be defined as:
where
According to Eqs. (17), (20) and (21), in the scenario where the fire source exists at the midpoint of the tunnel, there would be a balance between the spread distance upstream and downstream. Therefore, only one side of the smoke spreading distance is considered, as displayed in Fig. 13. According to Fig. 13, the formulation can provide a more precise description of the smoke spreading distance with different HRRs, exhaust volumetric flow rates, and smoke outlet intervals. Since
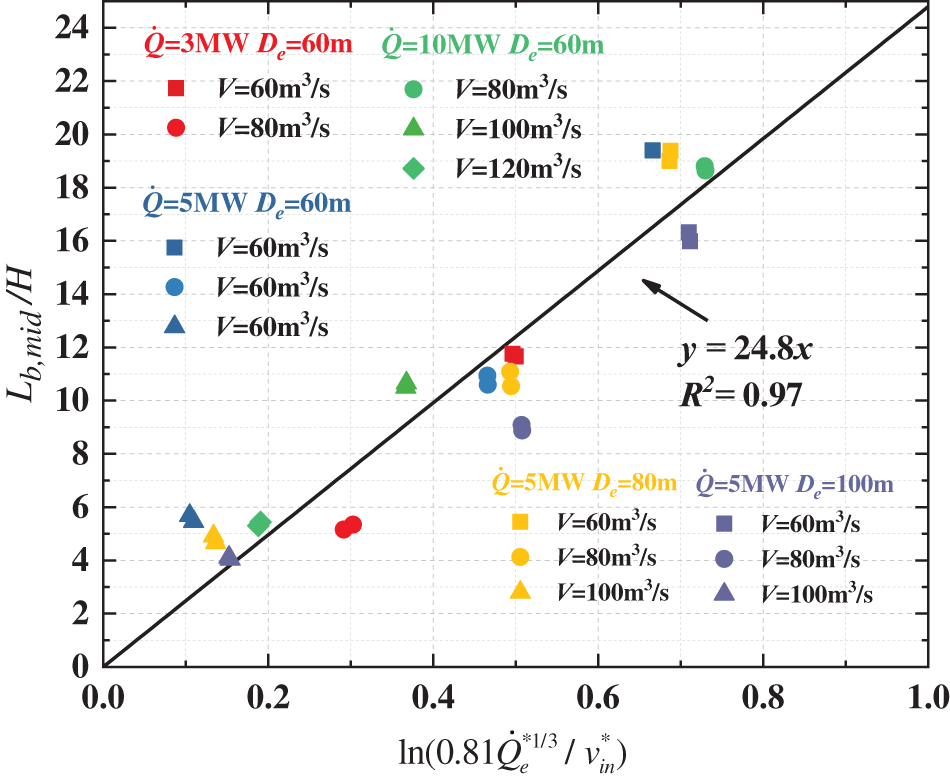
Figure 13: The relationship between
The dimensionless quantity
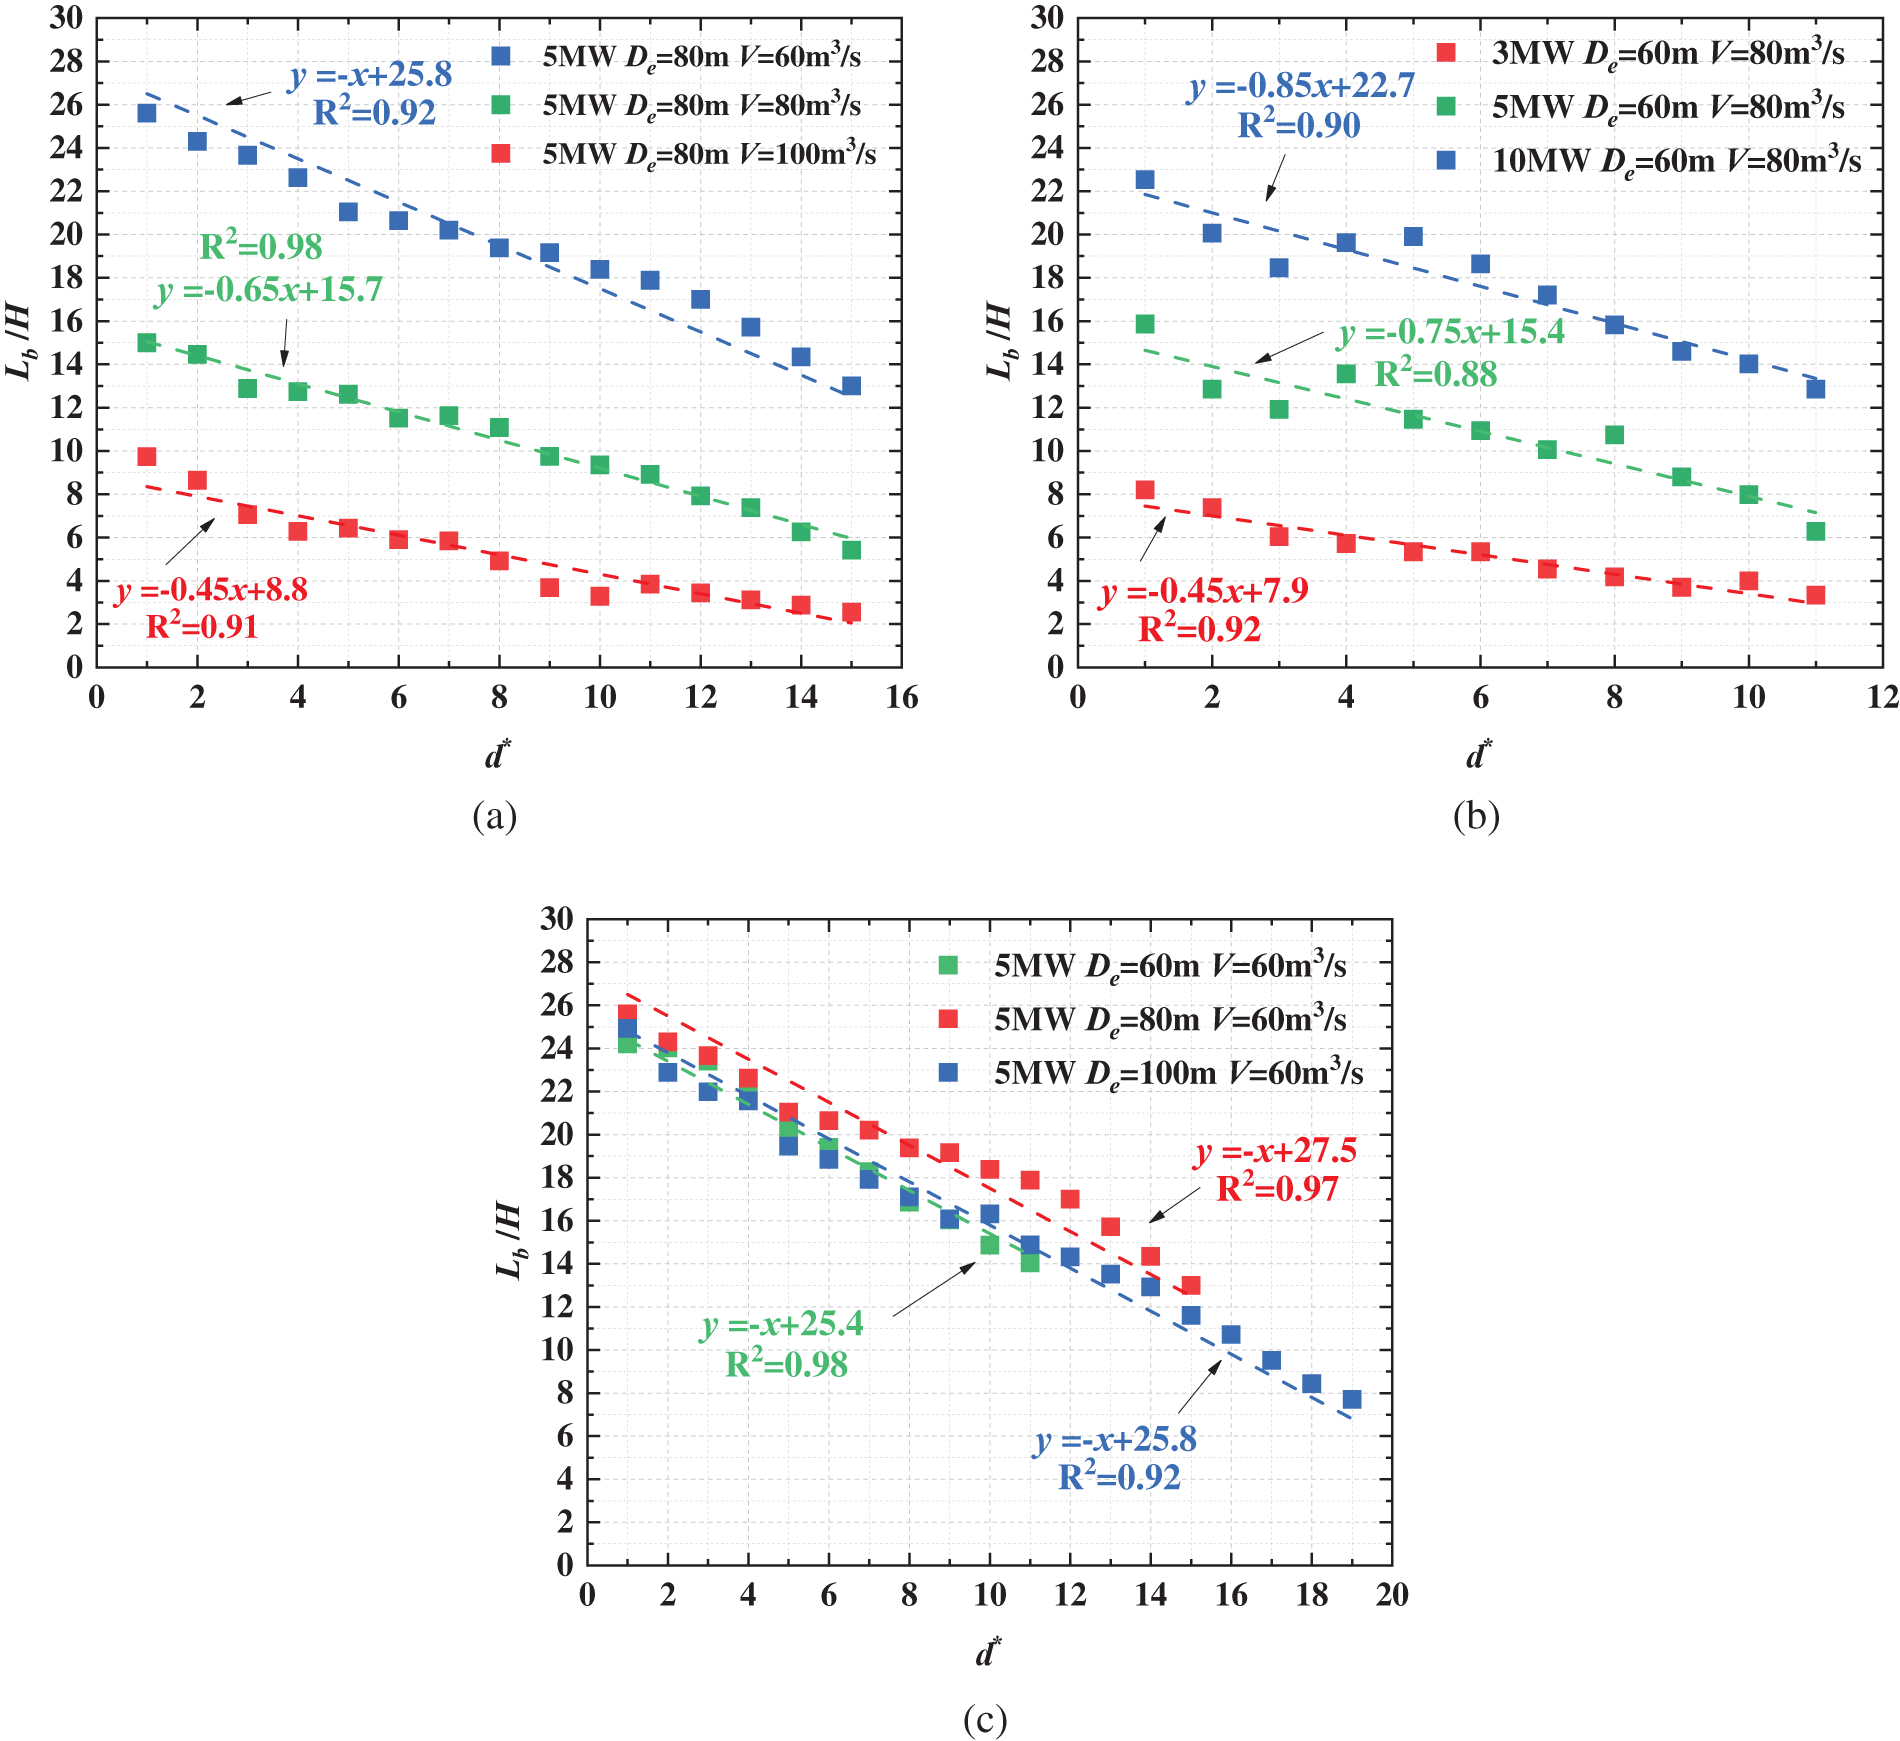
Figure 14: The relation between the smoke spreading distance and
Therefore, it is assumed that the relationship among the rate of change (
where
As shown in Fig. 15, to determine the relationship among
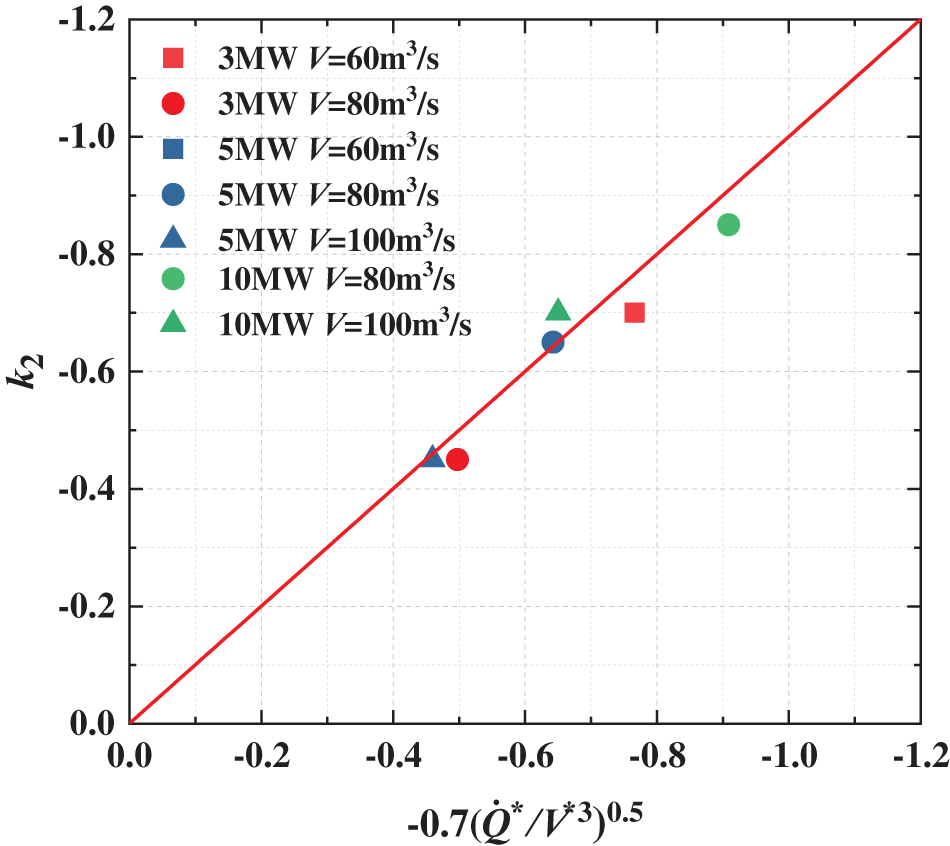
Figure 15: The relationship between
The smoke spreading distance at other fire locations can be expressed by Eq. (25):
where
Therefore, by combining Eqs. (22), (24) and (25), a model for predicting the smoke spreading distance at different locations can be obtained:
All the test results were compared to the predictions, as shown in Fig. 16. The prediction model can better predict the dimensionless smoke spreading distance with different HRRs, different intervals of smoke outlets, and different exhaust volumetric flow rates.
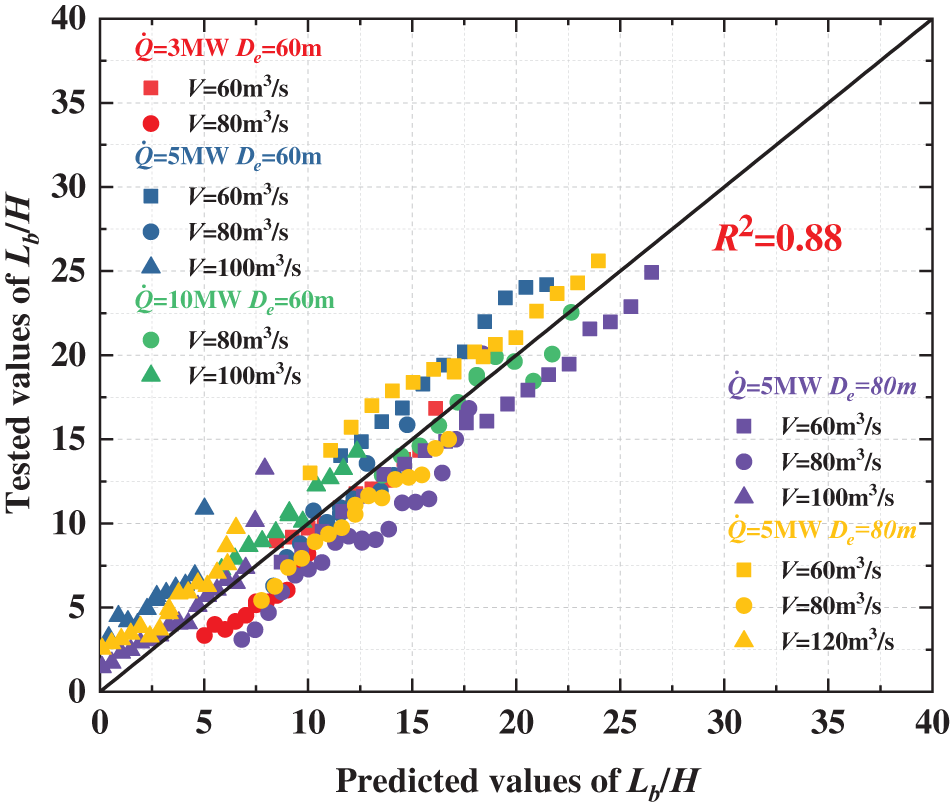
Figure 16: Test results vs. results by the proposed model
This paper examined the alteration in smoke flow characteristics resulting from the relative longitudinal position of tunnel-centralized smoke exhaust outlets and the fire source. This study encompassed four variables: heat release rates, exhaust volumetric flow rates, longitudinal fire locations, and intervals between smoke outlets. The main findings can be summarized as follows:
(1) The fresh air mass flow rate at the smoke outlet is directly proportional to smoke extraction volumetric rate and inversely proportional to heat release rate. The variation of the smoke mass flow rate is opposite to the fresh air mass flow rate. The spacing of smoke outlets has little effect on both air mass flow rate and smoke mass flow rate.
(2) A predictive model for heat exhaust coefficient was derived. The heat exhaust coefficient increases with the smoke extraction volumetric rate and decreases with the increasing distance between the fire source and the smoke outlet and heat release rate.
(3) The smoke spreading distance diminishes with the increased distance between the fire source and the smoke outlet. A model was obtained to predict the smoke spreading distance by considering various heat release rates, smoke extraction volumetric rates, and the spacing of smoke outlets.
The results of this study can contribute to technical methods for tunnel smoke emission prevention and control. However, the study does not consider the effect of the diameter of smoke outlets, the area of the tunnel section and the longitudinal ventilation. The smoke flow characteristics under the relative longitudinal positions of tunnel-centralized smoke outlets and the fire source will be studied in the future by taking these factors into account.
Acknowledgement: The authors acknowledge the support of Central South University’s High-Performance Computing Center.
Funding Statement: The authors received no specific funding for this study.
Author Contributions: The authors confirm contribution to the paper as follows: study conception and design: Liang Yi; data collection and analysis: Zhiqiang Lei; interpretation of results: Yaolong Yin, Zhisheng Xu; draft manuscript preparation: Zhiqiang Lei, Houlin Ying. All authors reviewed the results and approved the final version of the manuscript.
Availability of Data and Materials: There is no data that is unavailable in this study.
Conflicts of Interest: The authors declare they have no conflicts of interest to report regarding the present study.
References
1. Heidarinejad G, Mapar M, Pasdarshahri H. A comprehensive study of two fire sources in a road tunnel: considering different arrangement of obstacles. Tunnelling Undergr Space Technol. 2016 Oct 1;59:91–9. doi:10.1016/j.tust.2016.06.016. [Google Scholar] [CrossRef]
2. Shaw T, Gibson T, Karlovšek J, Emberley R, Torero JL. Experimental evaluation of the heat flux induced by tunnel fires. Tunnelling Undergr Space Technol. 2016 Nov 1;60:49–55. doi:10.1016/j.tust.2016.07.015. [Google Scholar] [CrossRef]
3. Carvel RO, Beard AN, Jowitt PW. Fire spread between vehicles in tunnels: effects of tunnel size, longitudinal ventilation and vehicle spacing. Fire Technol. 2005 Oct;41(4):271–304. doi:10.1007/s10694-005-4050-y. [Google Scholar] [CrossRef]
4. Carvel R. A review of tunnel fire research from edinburgh. Fire Saf J. 2019 Apr;105:300–6. doi:10.1016/j.firesaf.2016.02.004. [Google Scholar] [CrossRef]
5. Alarie Y. Toxicity of fire smoke. Crit Rev Toxicol. 2002;32(4):259–89. doi:10.1080/20024091064246. [Google Scholar] [PubMed] [CrossRef]
6. Vauquelin O. Experimental simulations of fire-induced smoke control in tunnels using an “air-helium reduced scale model”: principle, limitations, results and future. Tunnelling Undergr Space Technol. 2008 Mar 1;23(2):171–8. doi:10.1016/j.tust.2007.04.003. [Google Scholar] [CrossRef]
7. Li L, Gao Z, Ji J, Han J, Sun J. Research on the phenomenon of plug-holing under mechanical smoke exhaust in tunnel fire. Procedia Eng. 2013;62:1112–20. doi:10.1016/j.proeng.2013.08.168. [Google Scholar] [CrossRef]
8. Jiang X, Liu M, Wang J, Li K. Study on air entrainment coefficient of one-dimensional horizontal movement stage of tunnel fire smoke in top central exhaust. Tunnelling Undergr Space Technol. 2016;60:1–9. doi:10.1016/j.tust.2016.07.010. [Google Scholar] [CrossRef]
9. Zhao P, Yuan Z, Yu N, Liang C. Effect of heat release rate and exhaust vent settings on the occurrence of plug-holing during tunnel fires with two-point extraction ventilation. Tunnelling Undergr Space Technol. 2020 Dec;106:103617. doi:10.1016/j.tust.2020.103617. [Google Scholar] [CrossRef]
10. Yi L, Wei R, Peng J, Ni T, Xu Z, Wu D. Experimental study on heat exhaust coefficient of transversal smoke extraction system in tunnel under fire. Tunnelling Undergr Space Technol. 2015 Jun;49:268–78. doi:10.1016/j.tust.2015.05.002. [Google Scholar] [CrossRef]
11. Yan Z, Zhang Y, Guo Q, Zhu H, Shen Y, Guo Q. Numerical study on the smoke control using point extraction strategy in a large cross-section tunnel in fire. Tunnelling Undergr Space Technol. 2018 Dec 1;82:455–67. doi:10.1016/j.tust.2018.08.019. [Google Scholar] [CrossRef]
12. Liu Y, Yang D. Experimental study on synergistic effect of exhaust vent layout and exhaust rate on performance of ceiling central smoke extraction in road tunnel fires. Int J Therm Sci. 2023 Jan;183:107886. doi:10.1016/j.ijthermalsci.2022.107886. [Google Scholar] [CrossRef]
13. Li YZ, Lei B, Ingason H. Study of critical velocity and backlayering length in longitudinally ventilated tunnel fires. Fire Saf J. 2010 Nov 1;45(6):361–70. [Google Scholar]
14. Chen LF, Hu LH, Tang W, Yi L. Studies on buoyancy driven two-directional smoke flow layering length with combination of point extraction and longitudinal ventilation in tunnel fires. Fire Saf J. 2013 Jul 1;59:94–101. doi:10.1016/j.firesaf.2013.04.003. [Google Scholar] [CrossRef]
15. Chen LF, Hu LH, Zhang XL, Zhang XZ, Zhang XC, Yang LZ. Thermal buoyant smoke back-layering flow length in a longitudinal ventilated tunnel with ceiling extraction at difference distance from heat source. Appl Therm Eng. 2015 Mar;78:129–35. doi:10.1016/j.applthermaleng.2014.12.034. [Google Scholar] [CrossRef]
16. Tang F, Li LJ, Mei FZ, Dong MS. Thermal smoke back-layering flow length with ceiling extraction at upstream side of fire source in a longitudinal ventilated tunnel. Appl Therm Eng. 2016 Aug;106(1–2):125–30. doi:10.1016/j.applthermaleng.2016.05.173. [Google Scholar] [CrossRef]
17. Wang J, Yuan J, Fang Z, Tang Z, Qian P, Ye J. A model for predicting smoke back-layering length in tunnel fires with the combination of longitudinal ventilation and point extraction ventilation in the roof. Tunnelling Undergr Space Technol. 2018 Oct;80(4):16–25. doi:10.1016/j.tust.2018.05.022. [Google Scholar] [CrossRef]
18. Jiang X, Liu M, Wang J, Li Y. Study on induced airflow velocity of point smoke extraction in road tunnel fires. Tunnelling Undergr Space Technol. 2018 Jan;71(1):637–43. doi:10.1016/j.tust.2017.09.020. [Google Scholar] [CrossRef]
19. Liu Y, Yang D, Guo X. Theoretical model for predicting smoke back-layering length downstream of centralised ceiling exhaust vent in tunnel fires. Tunnelling Undergr Space Technol. 2023 Jul;137(4):105134. doi:10.1016/j.tust.2023.105134. [Google Scholar] [CrossRef]
20. Ji J, Tan T, Gao Z, Wan H, Zhu J, Ding L. Numerical investigation on the influence of length-width ratio of fire source on the smoke movement and temperature distribution in tunnel fires. Fire Technol. 2019 May;55(3):963–79. doi:10.1007/s10694-018-00814-4. [Google Scholar] [CrossRef]
21. Yu L, Wan H, Ji J. Asymmetric flow effect in a horizontal natural ventilated tunnel with different aspect ratios under the influence of longitudinal fire locations. Build Simul. 2021 Aug;14(4):1311–23. doi:10.1007/s12273-020-0742-y. [Google Scholar] [CrossRef]
22. Yao Y, Li YZ, Ingason H, Cheng X. Numerical study on overall smoke control using naturally ventilated shafts during fires in a road tunnel. Int J Therm Sci. 2019 Jun;140:491–504. doi:10.1016/j.ijthermalsci.2019.03.016. [Google Scholar] [CrossRef]
23. Tan T, Yu L, Ding L, Gao Z, Ji J. Numerical investigation on the effect of ambient pressure on mechanical smoke extraction efficiency in tunnel fires. Fire Saf J. 2021 Mar 1;120(3):103136. doi:10.1016/j.firesaf.2020.103136. [Google Scholar] [CrossRef]
24. Mahmud HM, Moinuddin K. The effects of variation in shape of smoke reservoirs and numbers and distribution of smoke extraction points on the tenability within a compartment. Front Heat Mass Transfer. 2023;20:1–17. doi:10.5098/hmt.20.2. [Google Scholar] [CrossRef]
25. Lafdal B, Djebbar R, Boulet P, Mehaddi R, Koutaiba E, Beji T, et al. Numerical study of the combustion regimes in naturally-vented compartment fires. Fire Saf J. 2022 Jul 1;131(2):103604. doi:10.1016/j.firesaf.2022.103604. [Google Scholar] [CrossRef]
26. Lou Z, Huang J, Wang M, Zhang Y, Lv K, Yao H. Inhibition performances of lithium-ion battery pack fires by fine water mist in an energy-storage cabin: a simulation study. Phys Fluids. 2024 Apr 22;36(4):045141. doi:10.1063/5.0206160. [Google Scholar] [CrossRef]
27. Li YZ, Ingason H. Overview of research on fire safety in underground road and railway tunnels. Tunnelling Undergr Space Technol. 2018 Nov;81:568–89. doi:10.1016/j.tust.2018.08.013. [Google Scholar] [CrossRef]
28. McGrattan K, Hostikka S, Floyd J, McDermott R, Vanella M, Mueller E. Fire dynamics simulator (version 6user’s guide. Gaithersburg: National Institute of Standards and Technology; 2023. [Google Scholar]
29. Liu Q, Xu Z, Zhu J, Tagne SMS, Mahmood S, Xie B. Study of the impact of the distance between the lateral exhaust vent and ceiling on heat exhaust coefficient and air entrainment in tunnel fires. Tunnelling Undergr Space Technol. 2024 Jun 1;148:105766. doi:10.1016/j.tust.2024.105766. [Google Scholar] [CrossRef]
30. Ingason H, Ying Zhen Li. Model scale tunnel fire tests with point extraction ventilation. J Fire Protect Eng. 2011 Feb 1;21(1):5–36. doi:10.1177/1042391510394242. [Google Scholar] [CrossRef]
Cite This Article
 Copyright © 2024 The Author(s). Published by Tech Science Press.
This work is licensed under a Creative Commons Attribution 4.0 International License , which permits unrestricted use, distribution, and reproduction in any medium, provided the original work is properly cited.
 Downloads
 Citation Tools