
 Submit a Paper
 Propose a Special lssue
 Open Access
ARTICLE

Simulation and Optimization of Energy Efficiency and Total Enthalpy Analysis of Sand Based Packed Bed Solar Thermal Energy Storage
1 Faculty of Mechanical Engineering, Jimma Institute of Technology, Jimma University, P.O. Box 378, Jimma, Ethiopia
2 Aksum University, Shire Campus, Aksum, P.O. Box 1010, Ethiopia
3 Department of Mechanical Engineering, College of Engineering, Prince Mohammad Bin Fahd University, Al-Khobar, 31952, Saudi Arabia
4 Department of Mechanical and Industrial Engineering, College of Engineering, Majmaah University, Al-Majmaah, 11952, Saudi Arabia
5 National Water and Energy Center, United Arab Emirates University, Al Ain, 15551, United Arab Emirates
* Corresponding Author: Matiewos Mekonen Abera. Email:
(This article belongs to the Special Issue: Entropy Generation and Exergy Analysis of Thermal Devices)
Frontiers in Heat and Mass Transfer 2024, 22(4), 1043-1070. https://doi.org/10.32604/fhmt.2024.049525
Received 10 January 2024; Accepted 22 March 2024; Issue published 30 August 2024
 View Full Text
 Download PDF
Abstract
This study is focused on the simulation and optimization of packed-bed solar thermal energy storage by using sand as a storage material and hot-water is used as a heat transfer fluid and storage as well. The analysis has been done by using the COMSOL multi-physics software and used to compute an optimization charging time of the storage. Parameters that control this optimization are storage height, storage diameter, heat transfer fluid flow rate, and sand bed particle size. The result of COMSOL multi-physics optimized thermal storage has been validated with Taguchi method. Accordingly, the optimized parameters of storage are: storage height of 1.4 m, storage diameter of 0.4 m, flow rate of 0.02 kg/s, and sand particle size 12 mm. Among these parameters, the storage diameter result is the highest influenced optimized parameter of the thermal storage from the ANOVA analysis. For nominal packed bed thermal storage, the charging time needed to attain about 520 K temperature is more than 3500 s, while it needs only about 2000 s for the optimized storage which is very significant difference. Average charging energy efficiency of the optimized is greater than the nominal and previous concrete-based storage by 13.7%, and 13.1%, respectively in the charging time of 2700 s.Keywords
Nomenclature and Abbreviations
| STEM | Sensible Thermal Energy Storage |
| PCM | Phase Change Material |
| GPS | Global Positioning System |
| HTF | Heat Transfer Fluid |
| Specific heat of the sand | |
| Specific heat capacity of fluid | |
| Initial Sand Temperature | |
| Initial fluid temperature | |
| D | Diameter of the storage |
| H | Height of the storage |
| Density | |
| SRNA | Signal-to-Noise ratio |
| V | Volume |
| Q | Flow rate |
| Time change | |
| Porosity | |
| As | Surface area |
| Mass flow rate | |
| Hot temperature | |
| Cold temperature | |
| v | Specific volume |
Occasionally, more and more solar energy is being used for various purposes because of its affordability and dependability from both an environmental and financial standpoint. However, because it is sporadic, storage optimization is required to increase its consistency. When liquids or solids are heated or cooled, thermal energy can be stored. In the latent phase, thermal energy is stored during the phase transition, typically in proximity to an isothermal process, but in the sensible phase, thermal energy is stored in the material by increasing its temperature. The heat transfer fluid goes through an interior structure, such as a concrete matrix, or a solid storage material made up of spheres, irregularly shaped pebbles, or gravel, in packed-bed thermal reservoirs. The packing is enclosed in a steel containment vessel that has the potential to be pressured, together with one or more layers of insulation (Sarbu et al. [1]; Izquierdo-Barrientos et al. [2]; Labus et al. [3]; Suresh et al. [4]; Royo [5]; Li et al. [6]).
Sensible thermal energy is the simplest and most common form of the build-up of thermal energy. Thermal stores that use specific heat of the substance accumulate energy by an increase in the temperature of the medium (a solid or liquid). This system operates on heat capacity and change in the temperature of the material during accumulating and discharging energy from the storage. The amount of thermal energy accumulated in a homogeneous material depends on its specific heat, temperature changes, and the volume change of material.
The amount of sensible thermal energy accumulated in a homogeneous material depends on its specific heat, temperature changes, and the volume change of material according. Development of effective and economical methods of storage of thermal energy obtained from Renewable Energy Sources is today a key issue for the development of renewable energy. Out of the locally available and cheap, that can store thermal energy are different types of sands (Diago et al. [7]; Tetteh et al. [8]; Al-Nimr et al. [9]; Barbi et al. [10]). Ratuszny [11] has tested sand deposited as thermal storage for low temperature and has reported that the temperature drops of 18°C was observed in the 10% moist sand and 25°C temperature drop on the dry sand. This indicates that in the case of low-temperature storage the temperature drops decrease due to the presence of water in the moist sand. This is because; water has high specific heat capacity. Based on the Özkahraman et al. [12], the thermal conductivity, based on Schärli et al. [13]; the specific heat, Abddaim et al. [14] observed the specific heat of rock reaching to 34.84% at 400°C and the thermal expansion of rocks does not exceed by 1.25% at 600°C and mass is decreased by 1.75% for thermal storage applications.
Rizeiqia et al. [15] and Cruickshank et al. [16] reported that solid materials such as rocks, metals, concrete, sand, and brick can be used for low as well as high-temperature heat storage. Typically, the size of rock used varies from 1 to 5 cm. The optimum size of solar thermal storage for space heating/cooling system depends on the type of application, and is a function of several parameters, such as type of material, storage temperature, storage heat losses, costs of the storage medium and container, type of heat exchanger and pumps, cost of auxiliary energy if any, climatic data such as solar radiation, ambient temperature, wind speed, sky conditions etc., heating or cooling load, collector type. its area and efficiency, a solar fraction of the total heat load, thermophysical properties of the storage materials etc.
Concerning the numerical models developed for packed beds, a comparative investigation was published by Hanmant Rao et al. [17], who also performed a parametric study using water and air as working fluids. From this parametric study, it indicates that the ratio of charging times of the packed bed of air to water is 5 to 1 in the same condition. This is because the thermal capacity of water is very much larger than that of air. Hence, considerable researches have been reported that water/steam can be used as heat transfer fluid and/or thermal storage in the mood of direct contact with the packed bed or porous media as can be referred in Li et al. [18–21].
Trevisan et al. [22] reported that earlier models proposed on packed beds were developed on a number of assumptions and the inlet fluid temperature was not varied with time. However, on actual practice, a packed bed system receives the energy during charging from a heat source, which provides it with a variable inlet fluid temperature. They used rocks as a storage material for sensible heat storage with water as heat transfer fluid. The model developed by them presented the prediction of the temperature distribution in the column for a variable inlet fluid temperature. Experimental results were compared with the results of the model.
Phase change materials (PCMs) which are high potential for latent thermal energy storage (LTES) are broadly studied by many authors for different applications such as for building sector, drying, industrial purpose as well as home utility scale for hot water and food preparation (Manish et al. [23], and Demirbas [24]).
The aspect ratio is the diameter to height ratio
It has been reviewed in the aforementioned articles that almost all studies focused on sand as sensible thermal energy storage for low and high temperatures and literature review of different latent heat phase change materials (Barbi et al. [25], Ghalambaz et al. [26], Cunha et al. [27], Sarcinella et al. [28], and Sutar et al. [29]). There is no work on sand has been reported for medium temperature. Hence, this paper inspected the possibility of sand as medium temperature thermal energy storage. Due to the intermittency of solar energy resources and the cost and availability problem, as well as the women and children of the rural (off grid electricity) are suffering from air indoor pollution and wood fetching from far away their home for house energy consumption, this study has been dealt mainly with the simulating and optimizing of sand based solar thermal energy storage for injera baking with the locally available material sand to solve the mentioned problems. The objective of this study is: to simulate and optimize sand based sensible thermal energy storage system, and to optimize charging time for temperature distribution and charging energy efficiency within the storage material with control parameters of storage height, storage diameter, sand bed particle size and heat transfer flow rate.
Fig. 1 presents the schematic diagram of the system description of solar thermal storage. The main components consist of (1) parabolic dish collector, (2) absorber, (3) hot pipe, (4) valves, (5) storage tank, (6) steel tube, (7) backing pan, (8) water tank, (9) cold pipe, (10) valve, and (11) valve. The cold water which is stored in the storage tank is made to flow through the cold pipe and it reaches the absorber. The absorber is kept at the focal point of the parabolic dish collector. Thus, the water gets heated up because of the concentration of solar radiation at the focus of the concentrating collector.

Figure 1: Schematic diagram of the system description of solar thermal storage
The hot water is then enforced to flow through the stainless-steel tube (hot pipe) in a thermosyphon way and transfers the heat energy to the sand and fluid inside the storage tank. In the discharging phase of the stored heat is transferred through the stainless-steel tube from the storage material to injera baking pan. However, if the system is required to bake the pan cake directly from the receiver, the valves must be adjusted to guide the hot water to the baking pan. Then, the hot water after heating the pan will return to the thermal storage tank when off-sun baking and to the receiver when directly baking. The diagram below is briefly described how the system works.
The main objective of this study laid in the simulation and optimization of thermal energy storage. Based on the energy requirement of the injera baking pan for a session sizing, and simulation of the storage has been implemented. Hence, this procedure embraced a detailed description and numerical computations using the COMSOL multi-physics software which is the finite element-based program to optimize the thermal storage.
Fig. 2 depicts the thermal energy storage and its operating principle. During charging, hot water or steam enters the storage through the top, transfers thermal energy or heat to the sand, and exits through the bottom. During heat removing (discharging) the flow is inverted: water gets through the bottom, is heated by the sand, and exits through the top. The direction of the flow uses buoyancy forces to make and maintain thermal stratification, with the hottest region at the top of the storage and the coldest at the bottom.
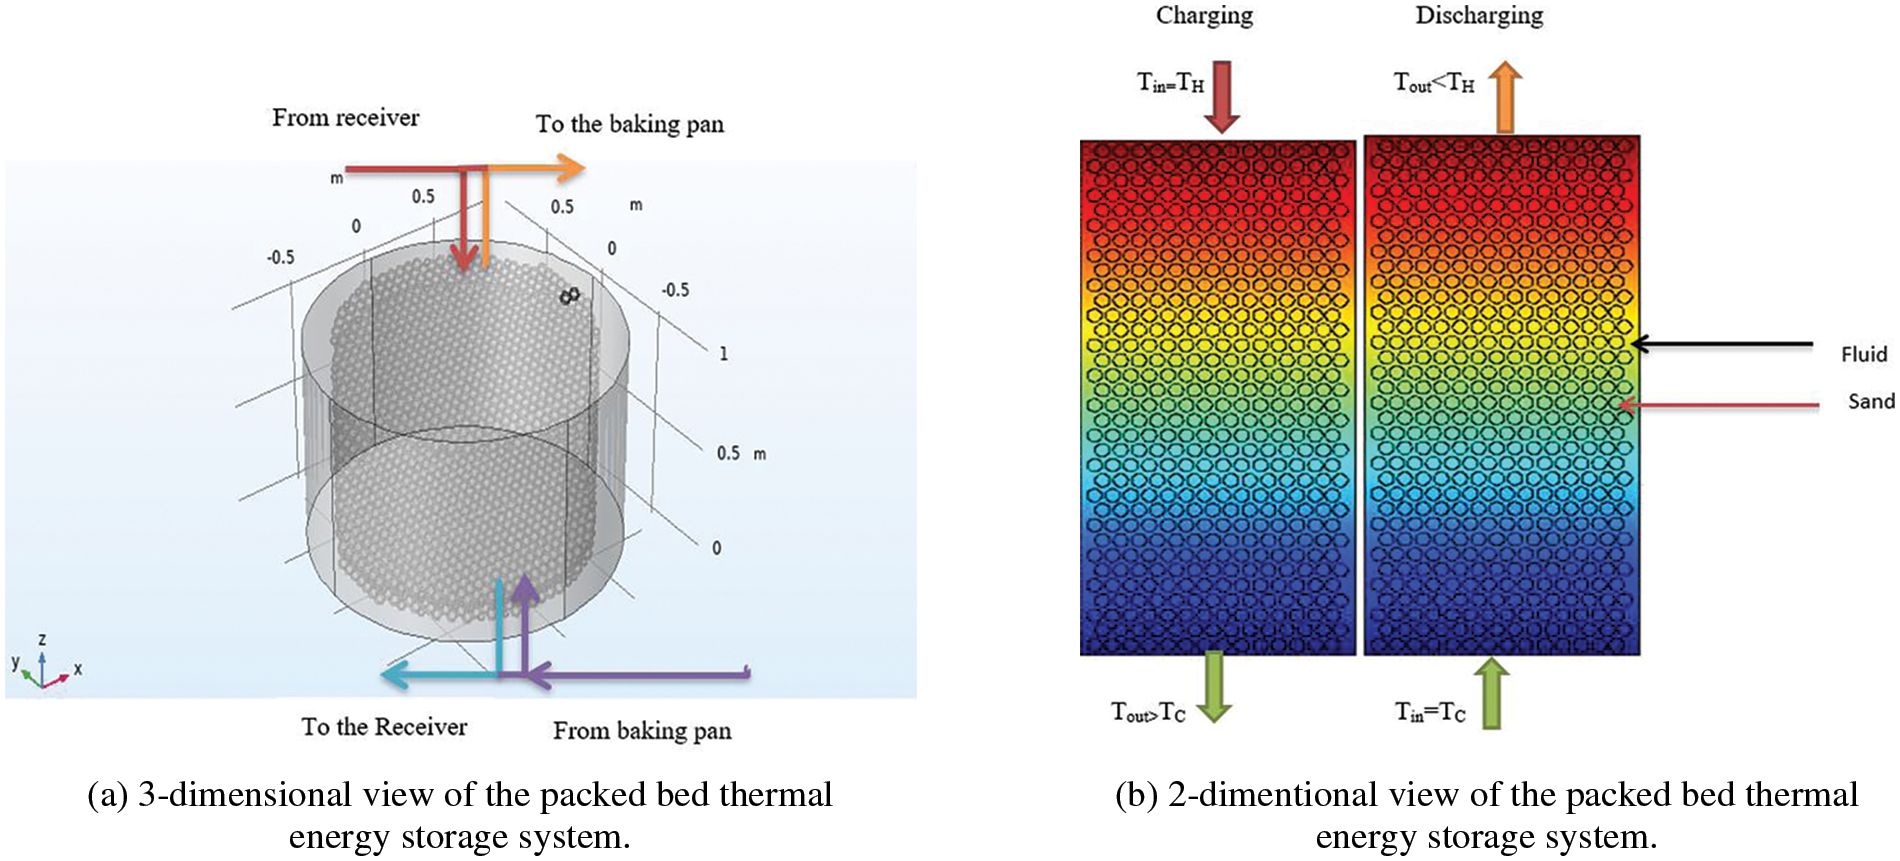
Figure 2: Thermal energy storage system
The circulation has simulated for different flow rates aiming of optimization. After optimization and at the time of installation loop aspect ratio
The 3-dimensional view of the packed bed thermal energy storage system is provided in Fig. 2a and the 2-dimentional view of the packed bed thermal energy storage system with inlet and outlet operating conditions are shown in the Fig. 2b.
A simple storage process is the combined effect of three main sub-processes explicitly charging, storing and discharging. The capacity of the energy stored in the storage media is proportional to the temperature increase and the specific heat capacity or in this case packed bed sand in the storage container and is governed by:
where,
The sand thermal energy storage system design investigated in this paper typically consists of a cylindrical sand packed bed. A larger product of density and heat capacity
For the fluid thermal storage alone, the stored hot fluid (at a higher temperature of
The thermal power delivery can be expressed as:
If the time of thermal power delivery is
2.2 Conceptual Storage Size Design
2.2.1 Aspect Ratio and Particle Size
Considering the space allotment, length and the heat transfer within the storage easily, the storage diameter
By considering the minimum surface area
Using the Engineering Equation Solver (EES) the optimal aspect ratio become 1. But due to the heat transfer rate and space and height allotment of the storage, for this study 0.4 aspect ratio is selected in designing the other parameters.
In conclusion, as the size of the storage material increases, the surface area per volume of the same mass will increase. Accordingly, the heat transfer coefficient of the storage in the charging phase will be improved because of increasing the contact of the hot and cold heat transfer fluid respectively with the solid media.
2.2.2 Packed Bed Particle Size and Porosity
The particles’ diameter has a very significant influence on the heat transfer between particles and fluid and within the solid. Small solid size increases the total fluid/solid heat exchange surface and enhances stratification as it is observed by Lew et al. [30], and Zhen et al. [31]. The numerical studies that have been proved experimentally from the article cited below, the investigational results for packed bed sensible heat storage have been limited to the beds of spheres or cylinders with large characteristic diameters on the order of 1 cm (Beasley et al. [32]) and 1.5 cm diameter of silica sand and 0.22 porosity (
2.2.3 The Mass Flow Rate of the Heat Transfer Fluid
The mass flow rate for the system can be derived from the total energy required and the time taken to bake injera. Hence, the energy flow rate of the system between the baking reservoir and the thermal storage is:
Initially, the storage is filled with fluid and sand at an ambient temperature of 25°C. But, after a charging and discharging cycle reaching the stable state, the lower temperature has been adjusted to 100°C based on the outlet the temperature of the baking pan in few kinds of literature conducted researches and numerical models reviewed above. The inlet temperature of the heat transfer fluid is adjusted to 250°C. The specific heat capacity of hot water from the thermodynamic property of hot water or steam using Engineering Equation Solver (EES) and that of sand is 0.85 kJ/kg K. The density of sand is 1600 kg/m3.
The average time taken to bake as reviewed is 2 up to 3 h. An average time of 2.5 h is taken to design for this work.
Therefore, the mass flow rate of the system can be obtained from the following relation:
2.2.4 Ideal and Real Volume Storage Design
For this study, the energy requirement for Injera baking as has been calculated is 37.841 MJ. This energy is estimated as higher energy consumption due to safety in case of high sunshine hour days.
The whole energy stored in the material after fully charged is expressed in the formula below. Here, the temperature of the solid and fluid will be the same as in Jaluria [34].
The ideal storage material or the thermocline storage using the fluid that is hot water alone is considered first to design the volume capacity of the storage material. In cases where a solid medium is mainly used for the thermal storage, with a fluid flowing through in direct contact with particle bed to carry heat in and out, the storage tank volume,
According to the given values and Eq. (5), the ideal and real volume have been calculated in Engineering equation solver as
Mass of the storage:
The total volume of the storage is equal to 0.173 m3. The volume ratio of the storage is 4:1 sand to hot water, respectively. Hence, the sand volume is 0.1384 m3 and hot water 0.0346 m3.
3 Mathematical Modelling of Packed Bed
Before, modeling of the heat transfer within the packed bed mathematically, some considerations must be specified. Hence the following conditions are considered: The assumptions generally made for mathematical analysis of heat transfer in sand bed storage systems are the following: (i) there is no heat transfer between the vessel and the environment which is thermally insulated, i.e., heat loss to the environment is neglected, (ii) sand particles are arranged uniformly, and (iii) the flow is axial that is top to down only.
3.1 Boundary and Initial Conditions
Initially
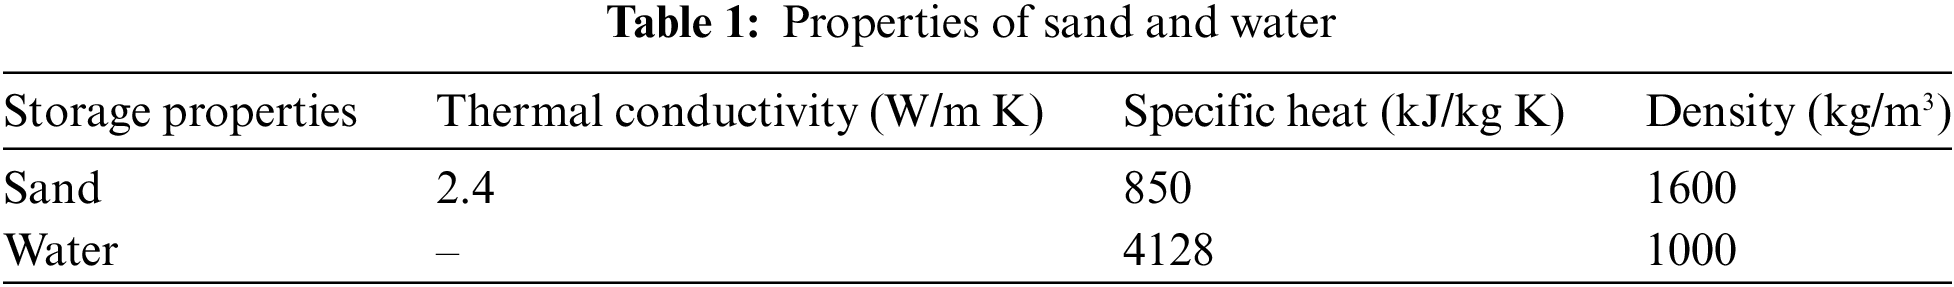
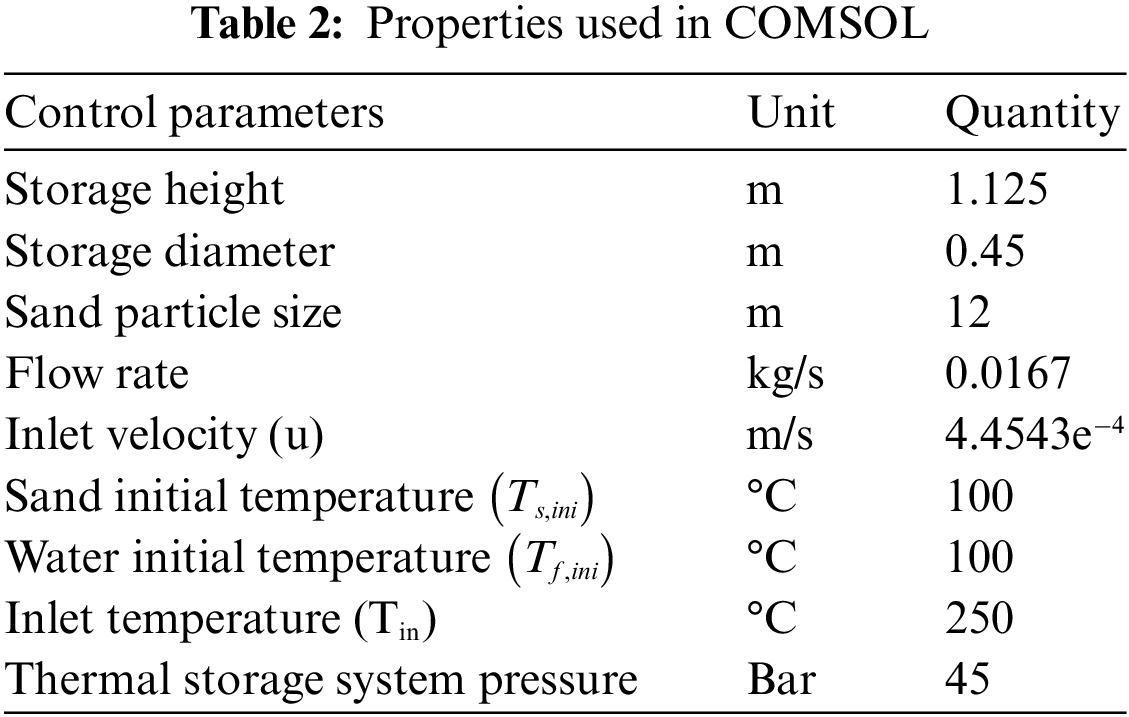
Based on the above designed parameters and their properties from literatures, the following properties and control variable are considering during the design and simulation of the thermal storage. Properties of sand and water is given in Table 1. The input parameters used for COMSOL multi-physics software is provided in Table 2.
3.3 Storage Charging Energy Efficiency
The thermocline storage efficiency is defined as an overall process efficiency that is a combination of the charging, storing, and discharging efficiencies. Based on the first law of Thermodynamics, efficiency is the fraction of heat recovered by the charging, storing, and discharging processes. The following equation is formulated by Chan et al. [36].
For this study charging energy efficiency only has been evaluated. This is the efficiency based on the storage material capability to gain thermal energy from HTF at a given period of time. The Charging energy efficiency had been reported by Mawire et al. [37] is the ratio of actual energy stored by storage material to maximum energy available as input to storage material with time provided by Niyas et al. [38].
3.4 Parametric Optimization Analysis
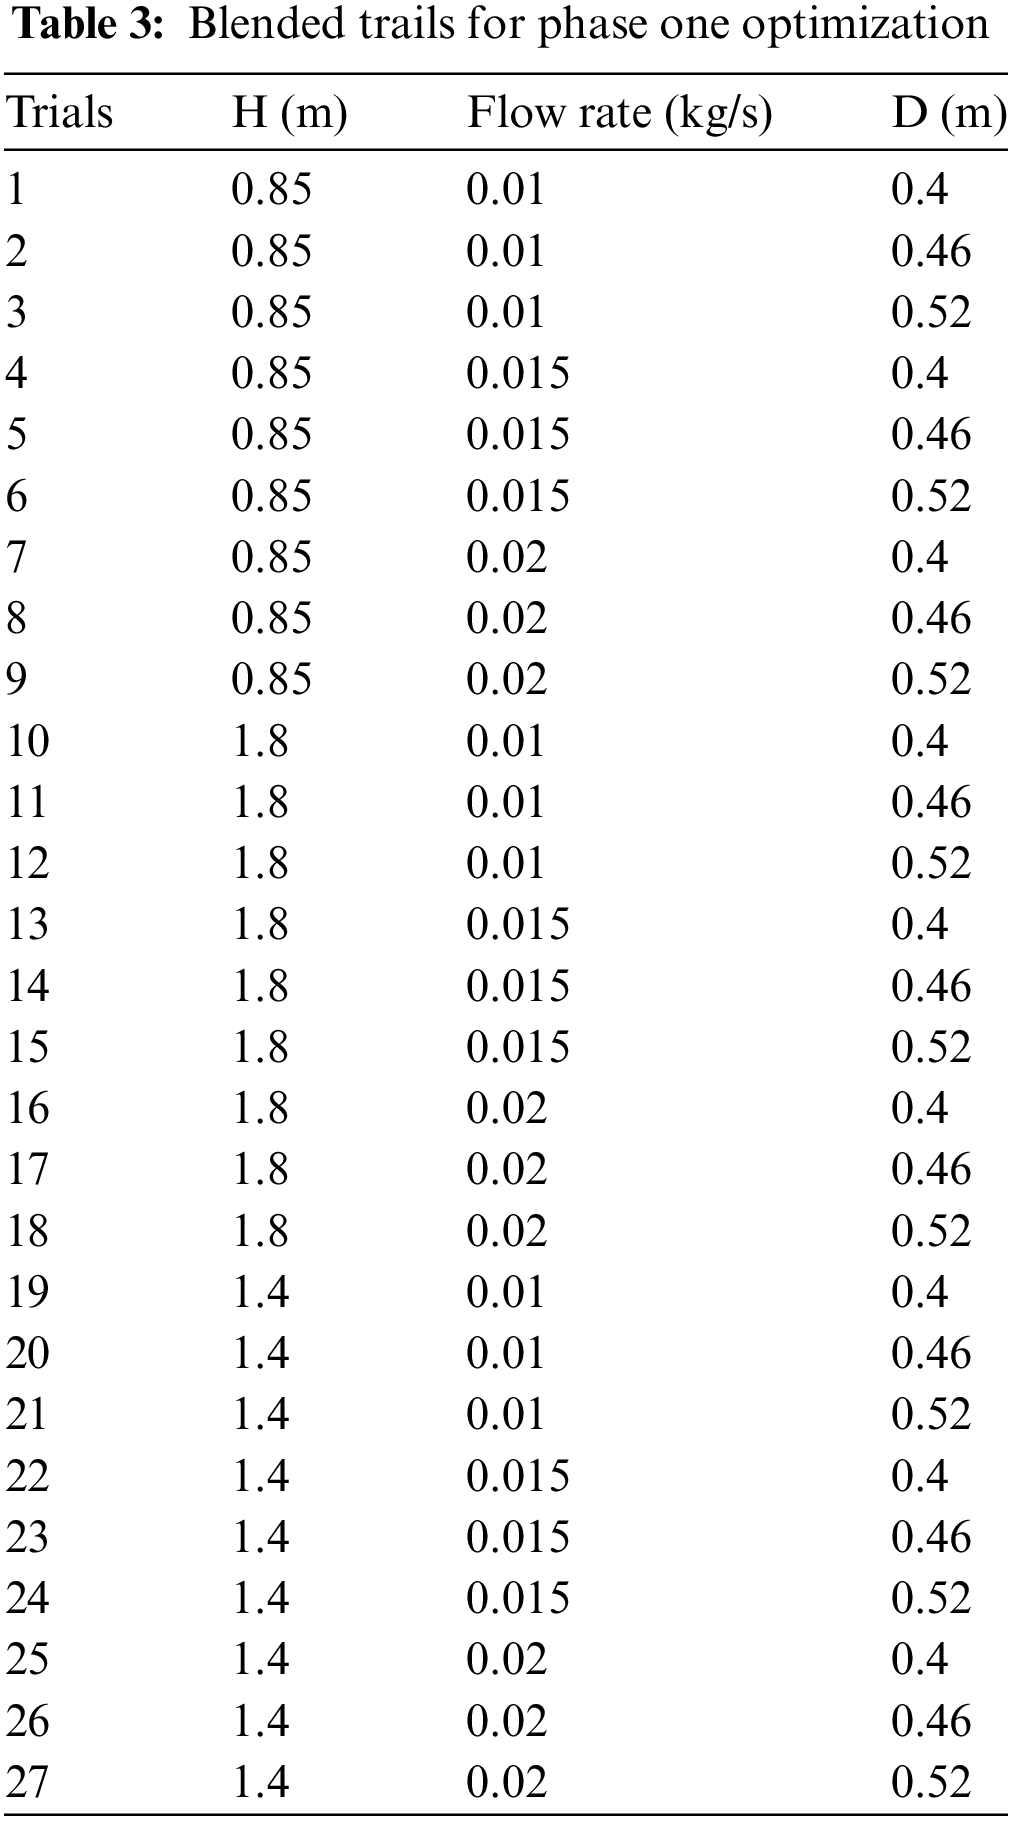
In this section, storage height, storage diameter, mass flow rate, and sand particle size, of the solar thermal energy storage will be simulated and optimized concerning the charging time. These parameters are derived from the nominal parameters values of the solar thermal energy storage system designed and simulated in previous work. To find the optimal combined parameter out of the four parameters aforementioned, different values are given for each factor. These values are the levels of the parameters. In this study, there are totally four parameters or factors and three levels. The three levels are a guess value, a minimum and maximum value. The total trail of these factors and levels in combination is eighty-one which is difficult to simulate in COMSOL Multiphysics with the same time due to time and computer capacity available. Therefore, it is necessary to optimize these parameters in two phases. Phase one combination of the parameters which are twenty-seven trial blends of storage height, storage diameter, and flow rate. Phase two optimization embraces three levels of sand particle size factor with the total trials of three. The good result of the trials is based on the larger the better principle for temperature distribution and surface enthalpy of the storage within the charging time, correspondingly.
Phase one optimization has twenty-seven blended trials as can be observed in Table 3. In order to simulate the parametric sweep study, it had taken 4 days. However, this depends on the meshing and computer capacity.
3.4.2 Validation of Storage Height, Storage Diameter, and Flow Rate Optimization
Optimization of parameters is done to have great control over quality, productivity and cost aspects of the process. Taguchi method is used to validate the optimization simulated in COMSOL Multiphysics for this study. This method is a statistical analysis technique and was innovated and contributed by Genichi Taguchi to robust design and quality planning activities through the integrated use of loss functions and orthogonal arrays in industrial level. The Taguchi method contains system design, parameter design, and tolerance design procedures to achieve a robust process and result in the best product quality (Karna et al. [39]). Hence, for this study of particular parameters optimization using COMSOL, Taguchi method is applied to validate it. L9 orthogonal array is used to represent the twenty-seven trials that were simulated in COLMSOL and these trials are reduced to only nine blended parameters. Hence, the L9, i.e., nine trials form of Taguchi method with three factors of storage height, storage diameter, and mass flow rate, and three levels of for is shown in Table 4.
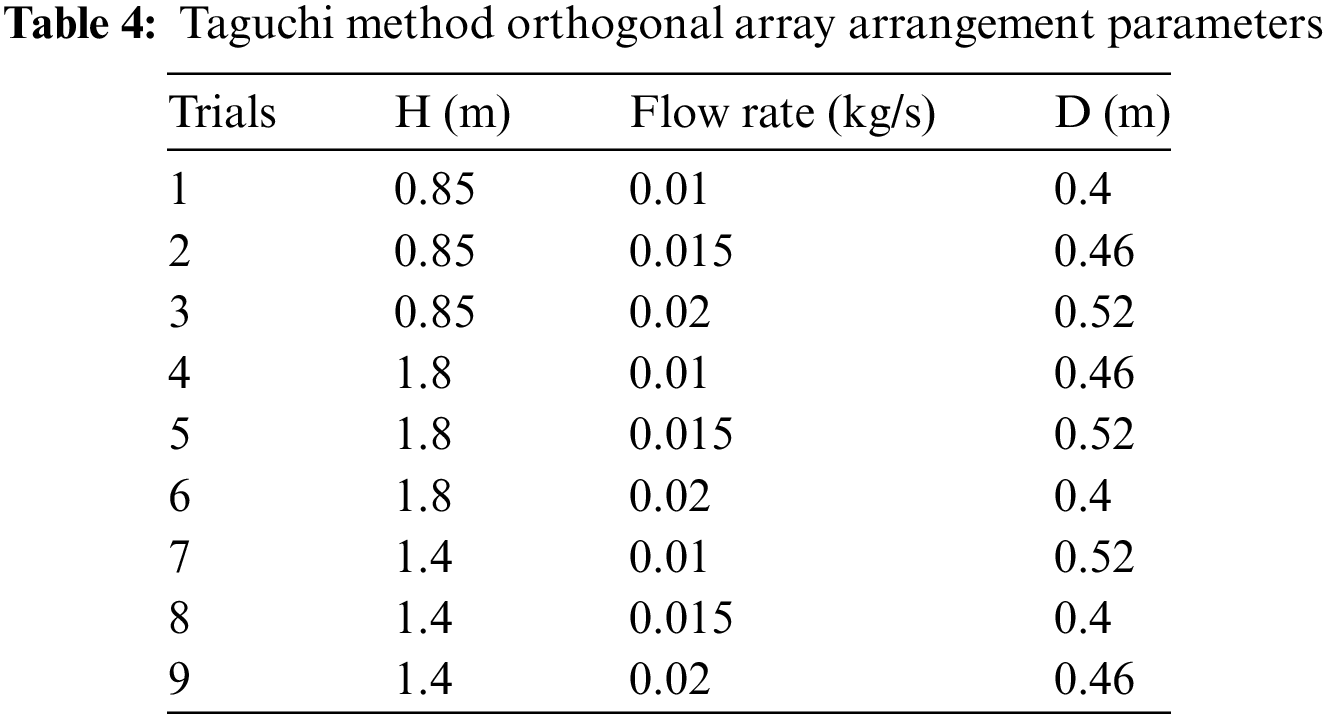
It can be noticed from Table 4, that the optimized trial 25 (H = 1.4 m, flow rate = 0.2 kg/s D = 0.4 m) is not included in the combinations in contrast to the COMSOL input blended parameters in Table 3. After analyzing the Taguchi statistical method, this trial going to validate or invalidate. Signal-to-noise (S/N) ratio has been used to determine the most significant factor with the larger the better optimization method.
Having completed, phase one optimization with storage height, storage diameter and flow rate, phase two optimization with sand particle size parameterizing is followed. In this phase, three levels of the sand particle sizes are studied holding the first phase optimized parameters (storage height = 1.4 m, storage diameter = 0.4 m, and flow rate = 0.02 kg/s) constant. The sizes are 9, 11, and 14 mm and inserted into COMSOL.
Fig. 3 shows the temperature distribution as a function of charging time for the simulated STES with nominal settings. Two- and one-dimensional graphical representations are provided below. There are 12,945 boundary elements and 131,088 domain elements in the entire courser mesh. Meshing with the courser is acceptable because there are a lot of domain elements.
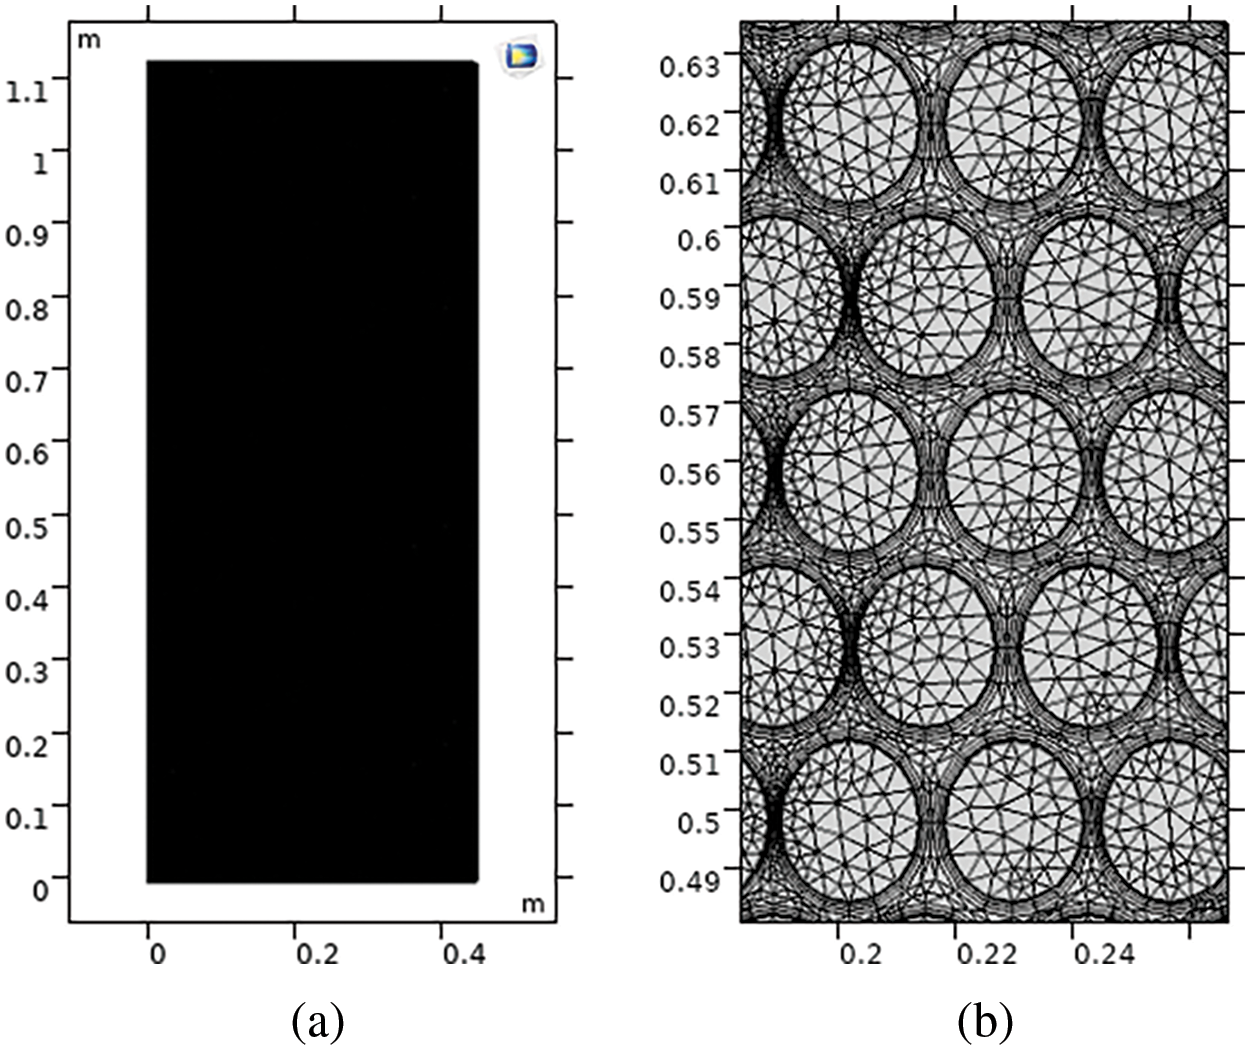
Figure 3: Mesh results view of thermal energy storage: (a) course mech, and (b) zoom mesh
4.1.2 Simulation with the Design Parameters of the Thermal Storage: 2D Simulation
The 2D simulated nominal designed storage in Fig. 4 shows the temperature distribution difference between 20 and 180 s insignificant compared with the temperature distribution between 180 and 900 s because the charging time interval of 20 to 180 s is smaller. At the time of 900 s, the temperature of the storage reached about 520 K up to the depth of 0.1 m from the inlet position. Whereas, the time of 3600 s the temperature of the cross-section of the whole storage becomes about 523 K.
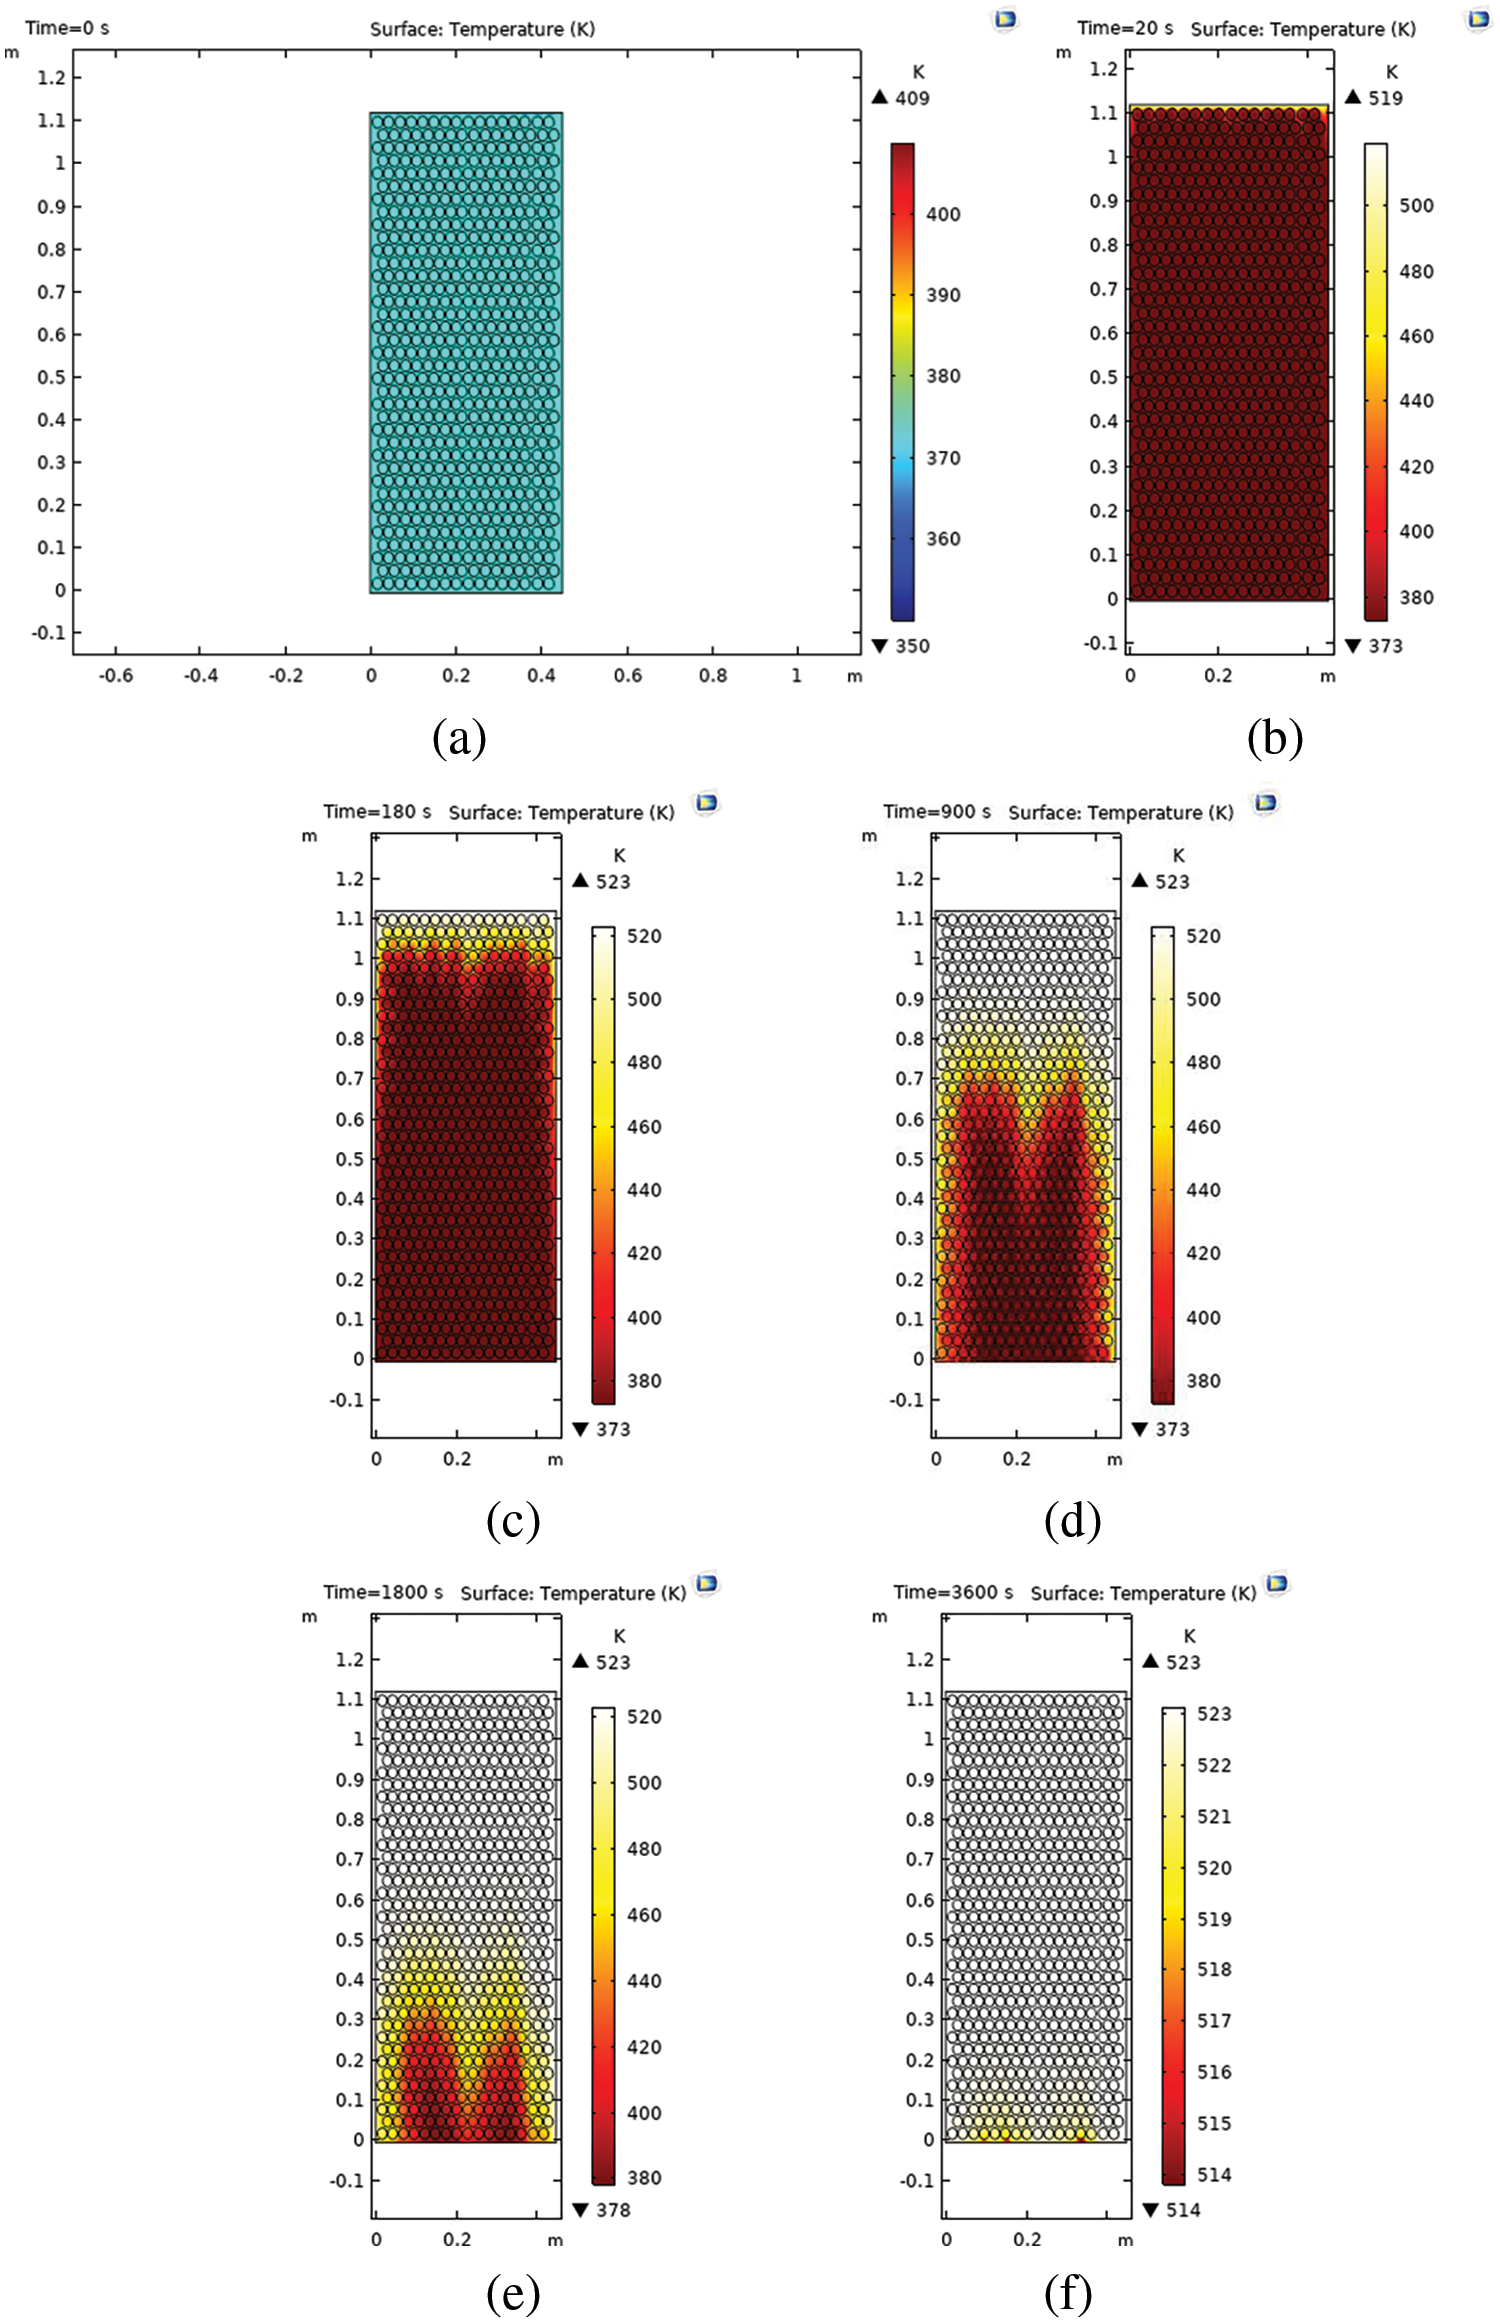
Figure 4: Surface temperature distribution of thermal storage as a function of time: (a) time at 0 s, (b) time at 20 s, (c) time at 180 s, (d) time at 900 s, (e) time at 1800 s, and (f) time at 3600 s
The temperature conditions for the cut point 2D graph presented in at the top, middle and bottom of the storage as a function of charging time is plotted in the following Fig. 5. As can be seen from the graph above, to reach 520 K the charging time of the hot water at the top (inlet) of the thermal storage is around 100 s but for that of the sand particle at the same height is around 300 s. This is because the heat transfer fluid is hot water and this inflow heat is quickly disseminated with hot water rather than with the sand particle. At the middle, the hot water reaches 520 K at approximately 2000 s whereas for sand around 2300 s. At the bottom (outlet), the hot water charged to 520 K at approximately 3500 s charging time and the sand around 3800 s.
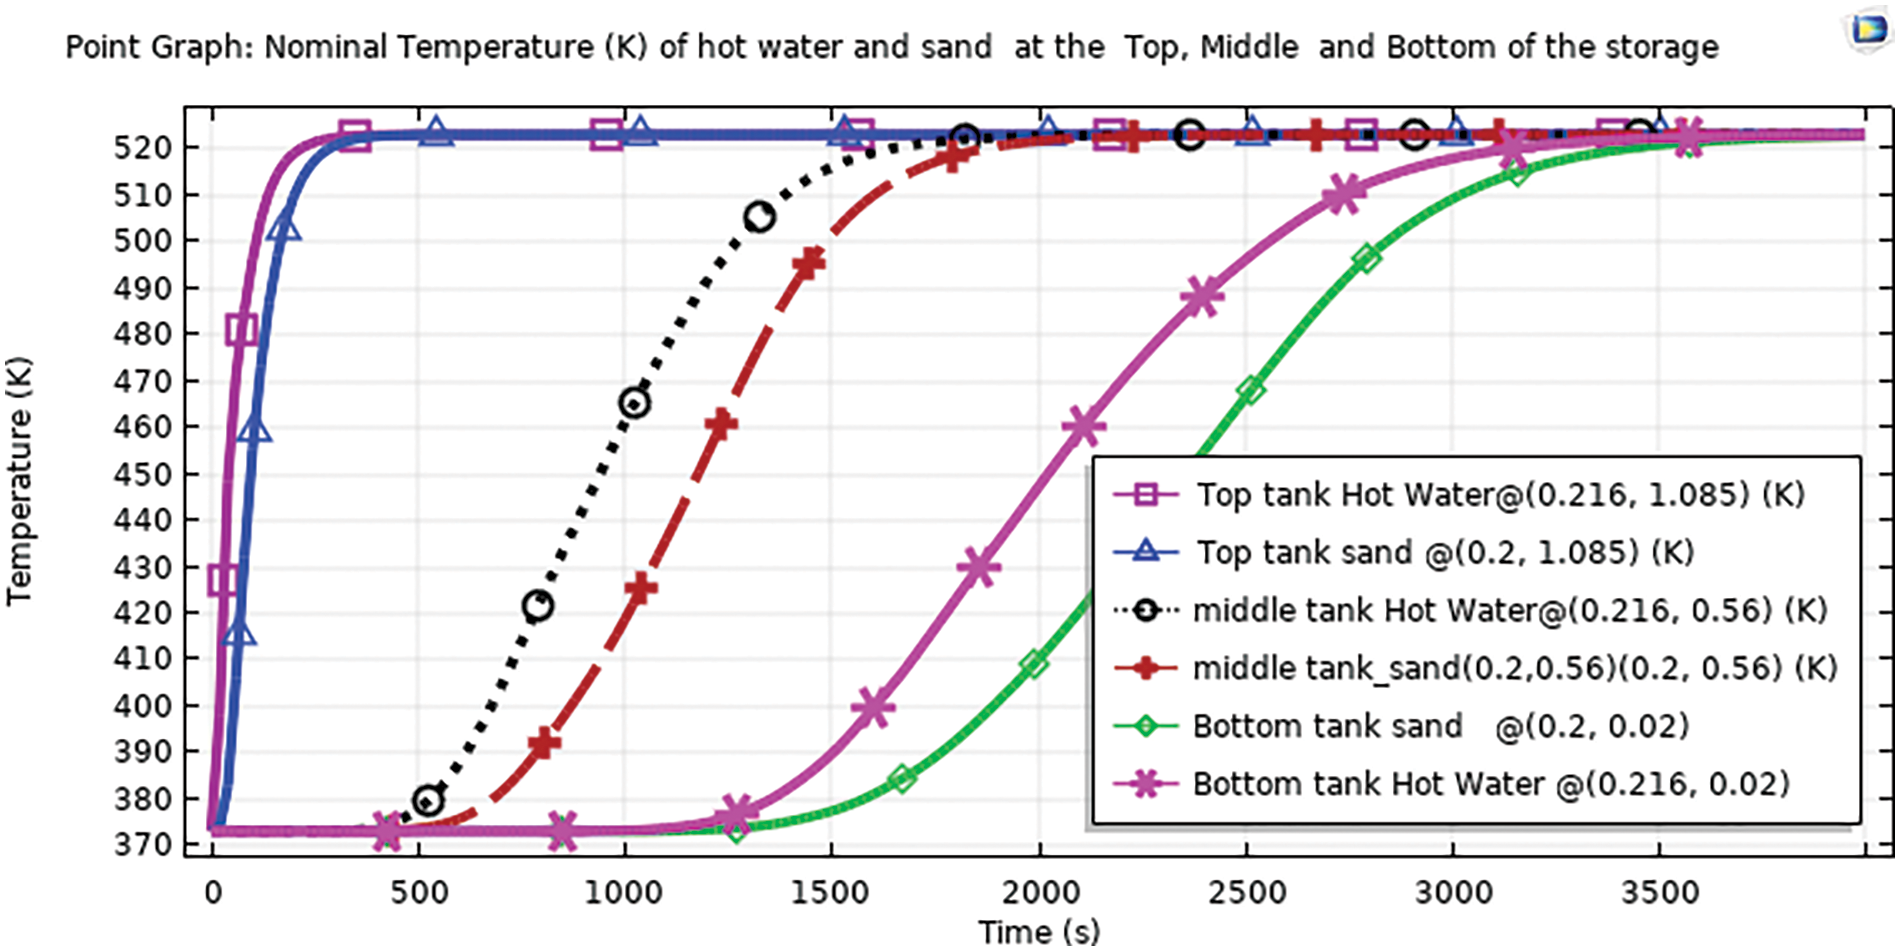
Figure 5: Nominal temperature distribution of hot-water and sand particles at top, middle, and bottom
The simulation results of twenty-seven trails are tabulated and graphically compared to select the best blend of parameters.
4.2.1 Sand Particle Temperature Analysis at Specific Point
Temperature Distribution of a sand particle at the bottom specified point (x = 0.2 m, y = 0.02 m) indicated in the following figures of Fig. 6a–c. The line with the asterisk symbol of the result has a significant difference in an obtaining higher temperature in the provided charging time. In Fig. 6a, there is a green line with asterisk symbol of the blended parameter that shows the significantly higher temperature of the sand particle at point (0.2, 0.02). This combination trial of 25 from Table 3 (H = 1.4 m, flow rate = 0.02 kg/s, and D in = 0.4 m). In this split graph with trial 25, the storage is almost fully charged in about 2500 s as indicated from the point graph. In Fig. 6b, the storage did not approach to be fully charged at the charging time allocated. Even the highest temperature of around 480 k is recorded with the blended parameters of trail 23 from Table 3 (H = 1.4 m, flow rate =0.02 kg/s, and D in = 0.46 m).
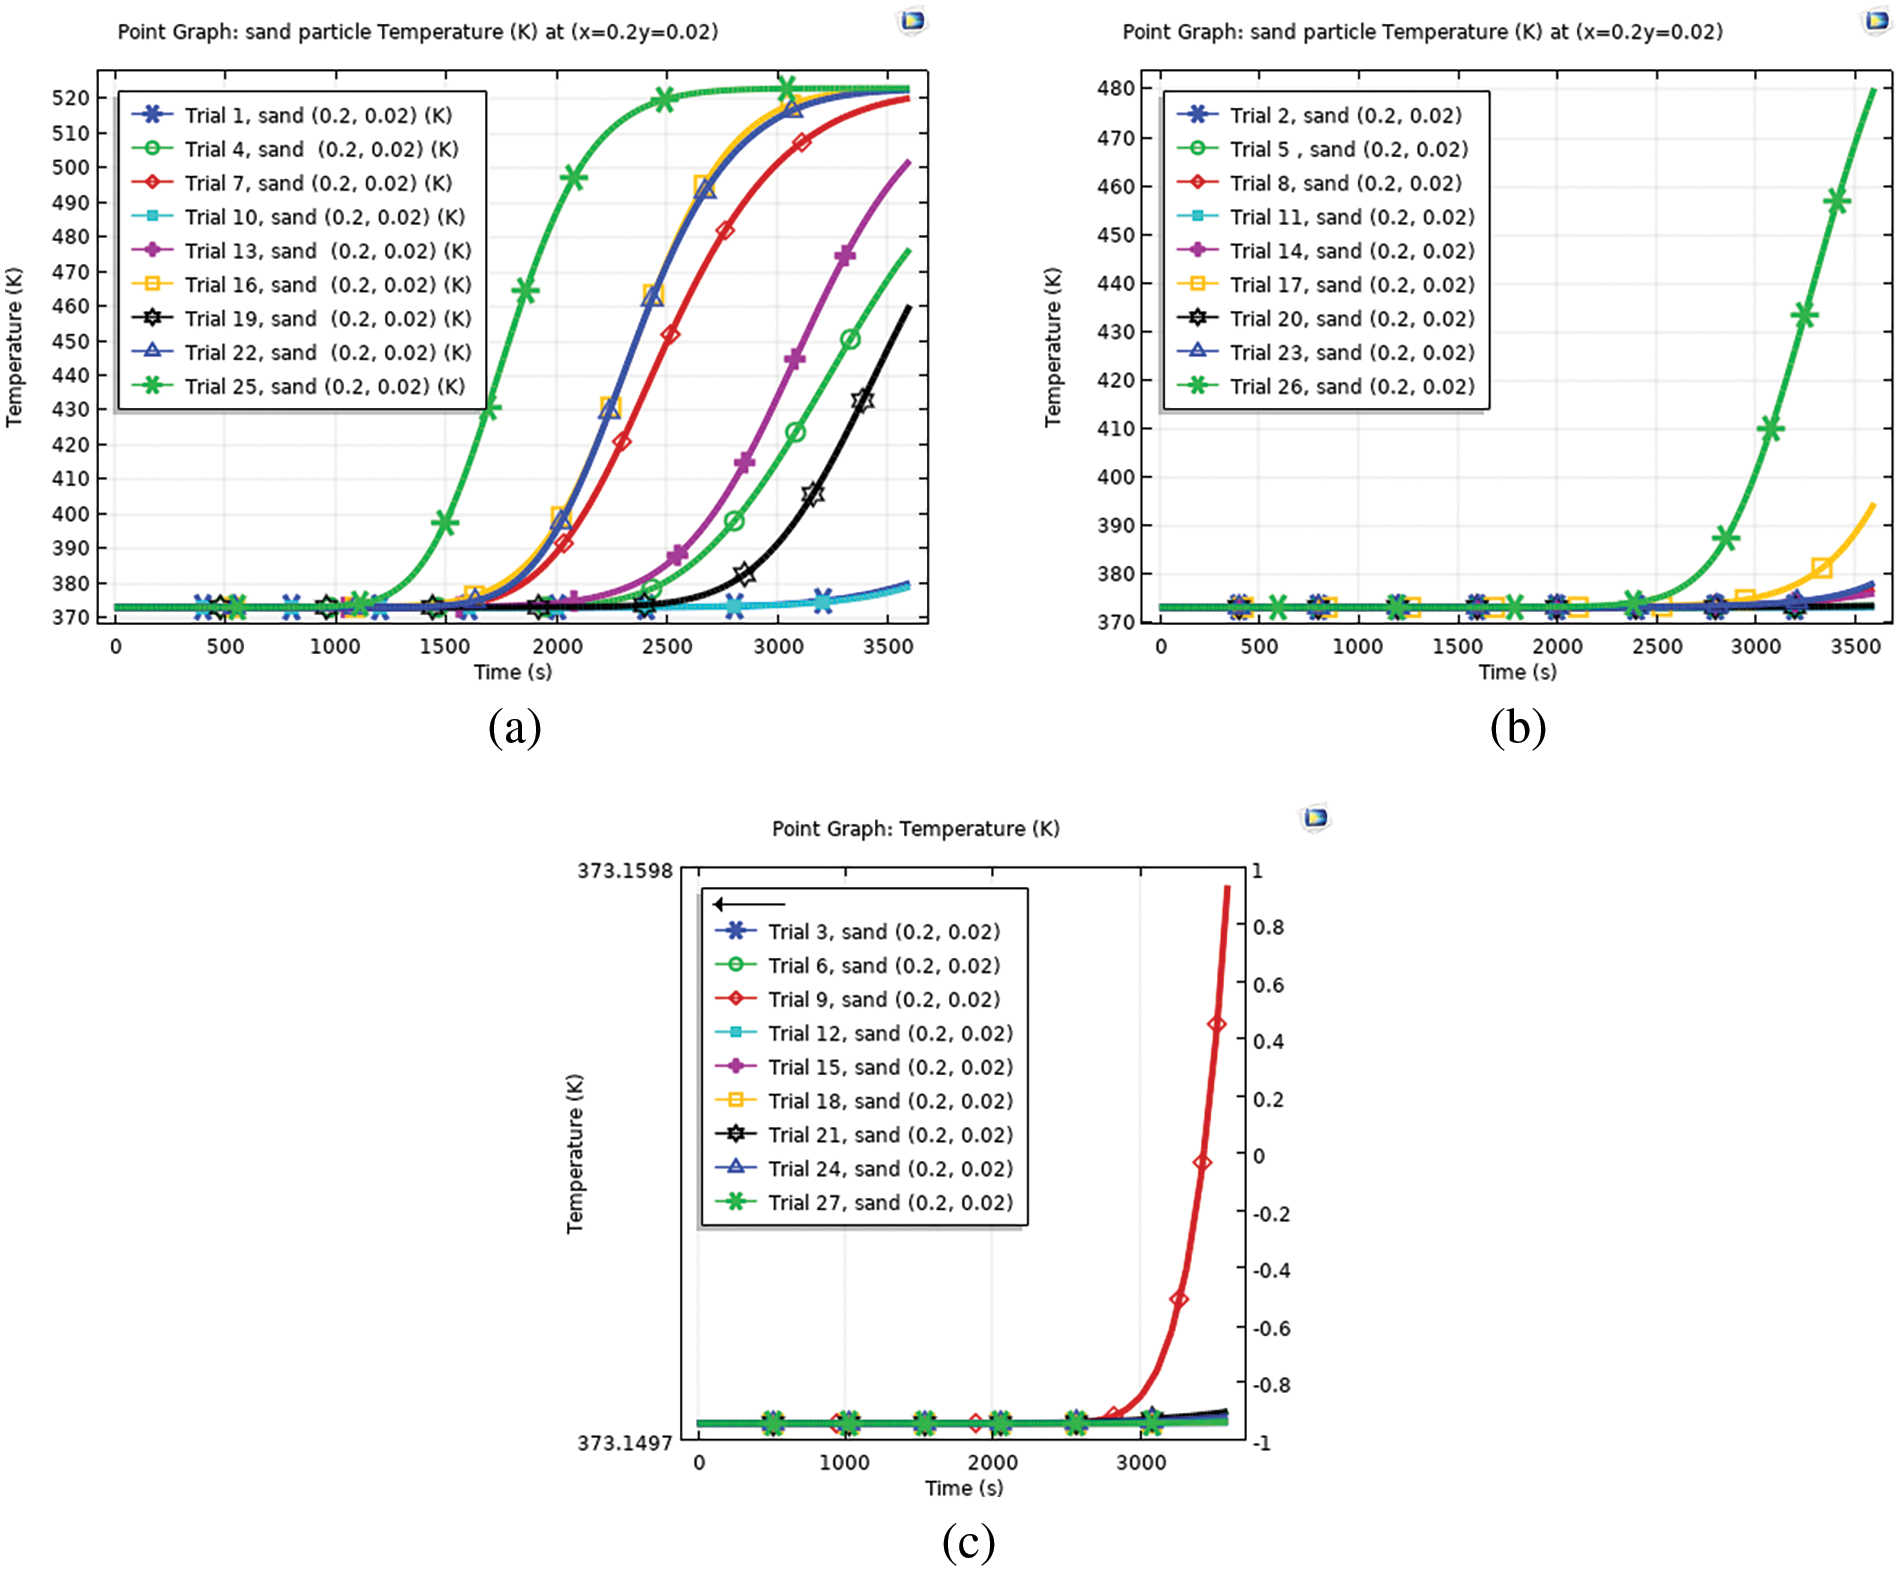
Figure 6: Temperature profile of sand particles, (a) height (H) and flow rate combination with 0.4 diameter, (b) flow rate combination with 0.46 diameter, (c) H and flow rate combination with 0.52 diameter
In this split, the charging time of all trials is much more than the split graph of Fig. 6a. Hence, no blended parameters in this split graph of Fig. 6b are comparable with trials of split graph 1 of Fig. 6a. For a split graph of Fig. 6c, the largest temperature distribution of all the trials in the specified charging time had not approached to be fully charged with the storage and even the temperature range of the graph is the in the initial temperature of a sand particle. Hence, no blended parameters are expected to select as optimal from this split graph. To conclude, it is clear that trail 25 from Table 3, with blended parameters of (H = 1.4 m, flow rate = 0.02 kg/s, and D = 0.4 m) and from the split graph of Fig. 6b, is the optimal trail in an early charging of the sand particle of the storage at the outlet specified point of (x = 0.2, y = 0.02).
4.2.2 Optimum Parameter of Temperature and Enthalpy of the Storage
From Table 5, for maximum thermal storage cross section temperature and enthalpy result, trail 25 (H = 1.4 m, flow rate = 0.02 kg/s, and D = 0.4 m) shows the highest record of maximum storage cross-section temperature and enthalpy of 523.1399 K and 949398.2 J/kg respectively out of the twenty-seven trials in the charging time bound of 3600 s. The second trail that records 522.9585 K and 948649.3 J/kg is trial 22 (H = 1.4 m, flow rate = 0.015 kg/s and D = 0.4 m).
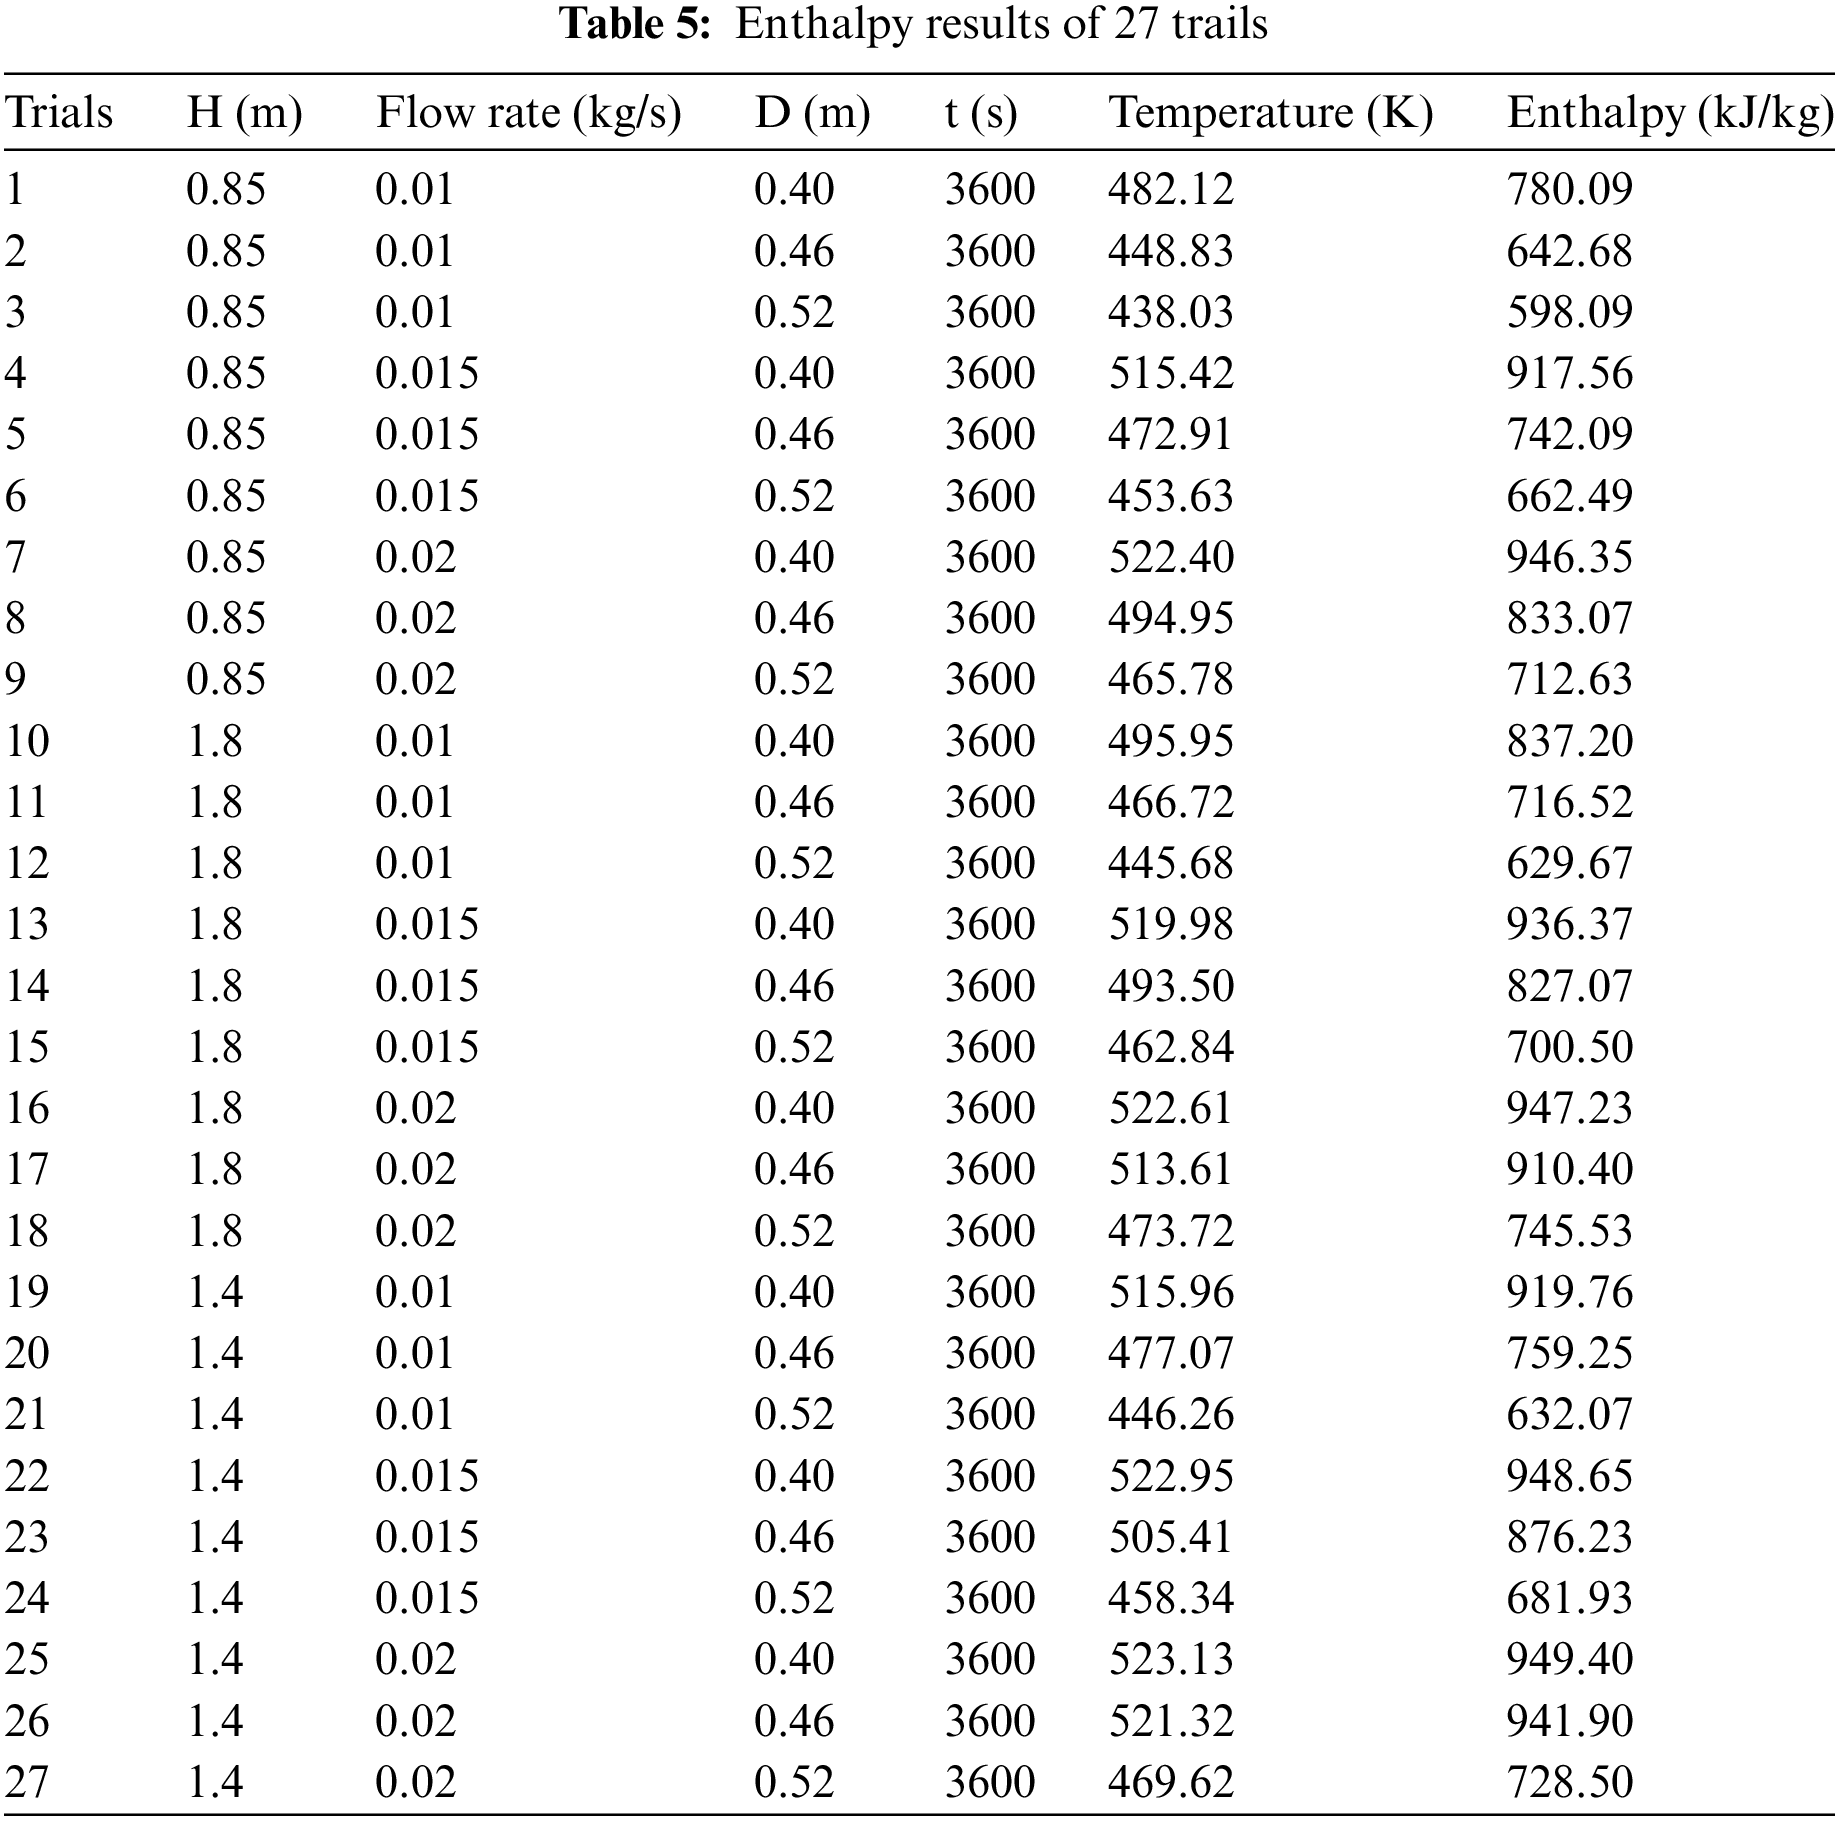
From the Fig. 6a–c, and Table 5, the analysis of point temperature, maximum temperature and maximum enthalpy as a function of charging time, trial 25 (H = 1.4 m, flow rate = 0.02 kg/s and D = 0.4 m) has attained the highest value for all circumstances. Hence, the optimum blended parameters to charge the storage quickly in phase one optimization are storage height 1.4 m, storage diameter 0.4 m and flow rate 0.02 kg/s.
For the optimized parameters, the charging time for sand and hot water at the same height of the thermal storage point is different as indicated in the above discussion. The reason is that the heat transfer fluid and the hot water storage are homogenous that makes the heat transfer faster than to the sand.
4.3 Taguchi Optimization Result of Parameters
Based on the response variable of the average temperature profile of the thermal storage, the Taguchi method in the Minitab software has analyzed and validated the result of COMSOL optimized blended parameters. The result of the optimization of parameters using Taguchi is provided in Table 6.
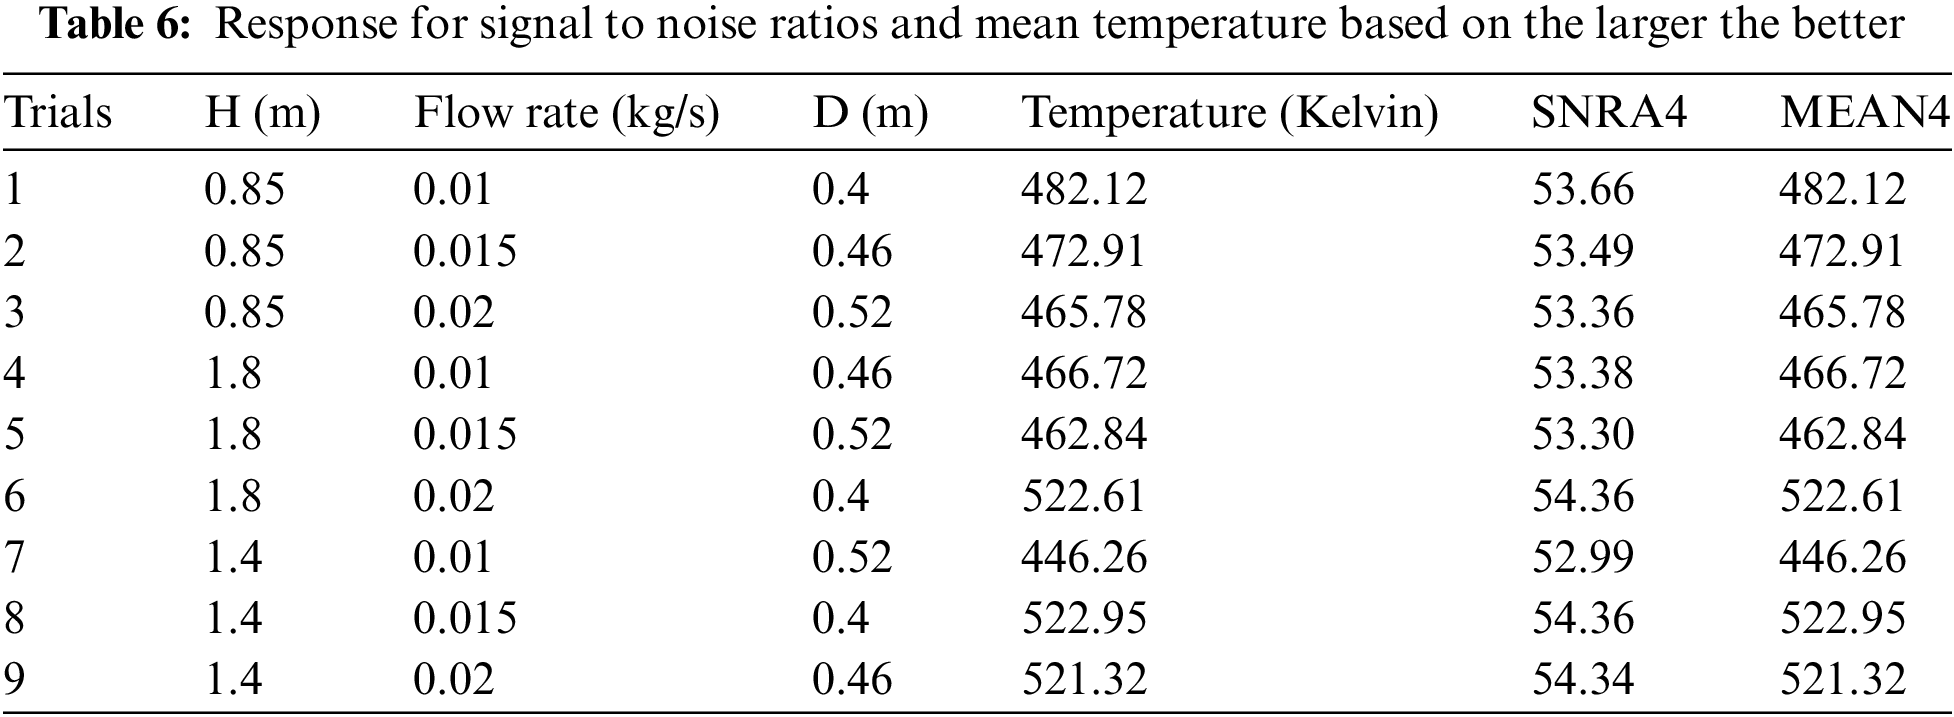
The largest Signal-to-Noise ratio from SNRA4 is 54.36934453 in the blended parameters of H = 1.4 m, flow rate 0.015 kg/s and D = 0.4 m which is trial 22 in Table 6. However, it is not always true that the blended parameter with the largest number of Signal-to-Noise ratio from the result response table of Taguchi is the optimized one. Because there are many other combinations of parameters which are not included in the analyses results. For instances, the blended parameters for phase one optimization Table 3, of this study are twenty-seven as has been optimized in COMSOL. But, in Taguchi method of optimization, only nine combinations are used. Therefore, additional validation of Table 6 using the Signal-to-Noise ratio graph is analyzed in Fig. 7a–c.

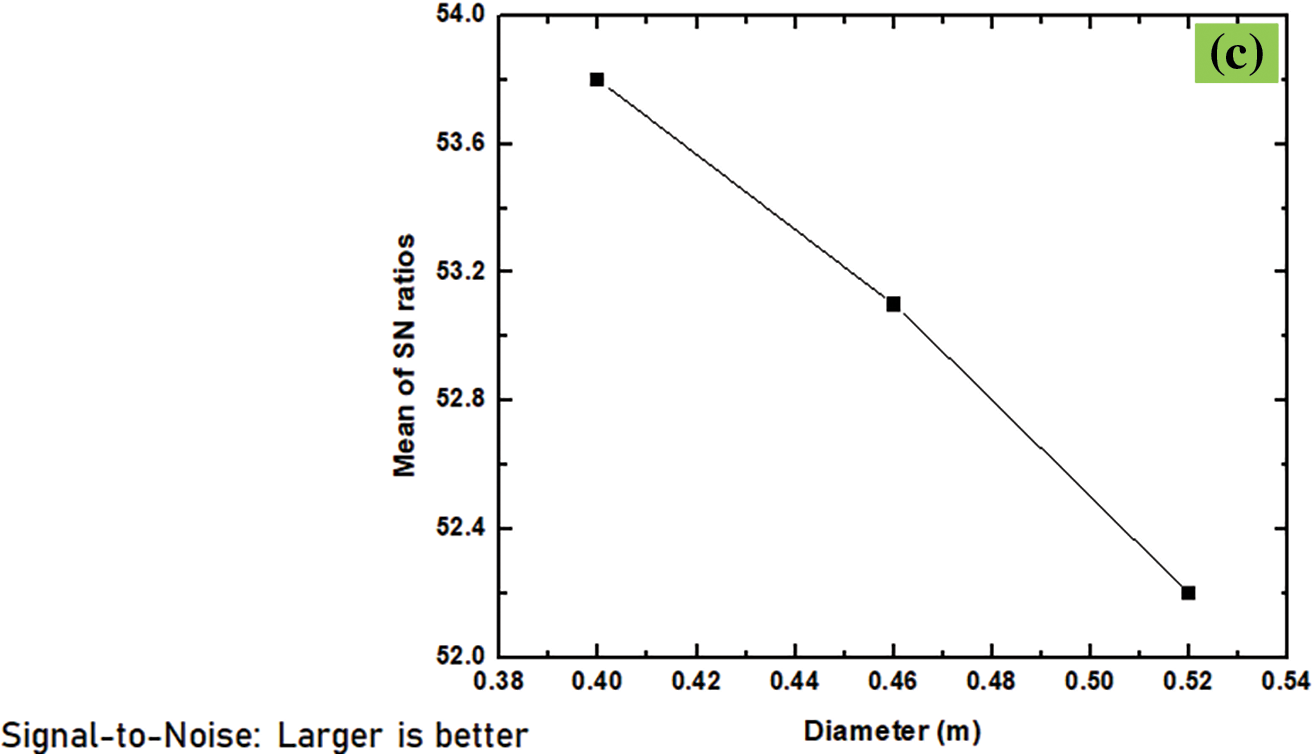
Figure 7: Signal to Noise ratio plot of the parameters: (a) with respect to height, (b) with respect to mass flow rate, and (c) with respect to diameter
From this Signal-to-Noise ratio in the figure, it can be simply identified that where the optimal point for the three parameters. Since the starting point for the optimization is the larger the better for the cross-section average temperature profile of the system, the optimal points are storage height (H) at 1.4 m, the flow rate at 0.02 kg/s and storage diameter (D) at 0.4 m. Hence, the finest combination of the parameters of the storage is (H = 1.4 m, flow rate = 0.02 kg/s, and D = 0.4) which is perfectly equal to the blended parameter optimized using COMSOL multi-physics in Table 5, of trial 25 (H = 1.4 m, flow rate = 0.02 kg/s, and D = 0.4 m). This combination was not included in the Taguchi method of orthogonal array. But, thanks to the Signal-to-Noise ratio graph of this method that identified these blended parameters.
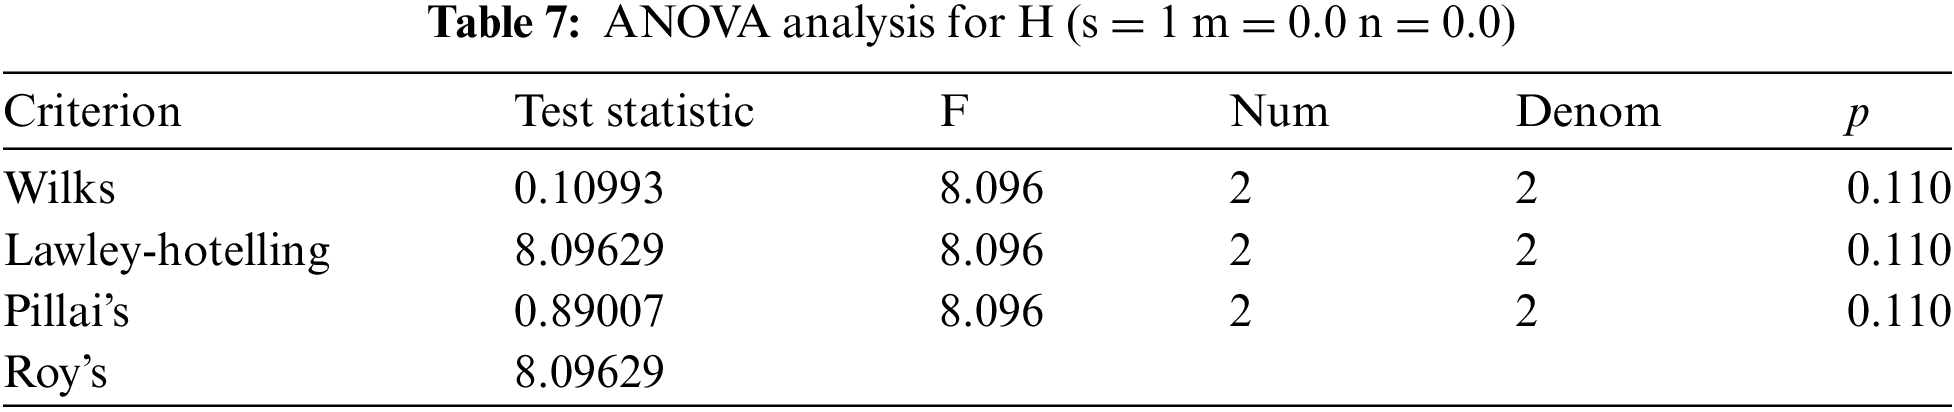
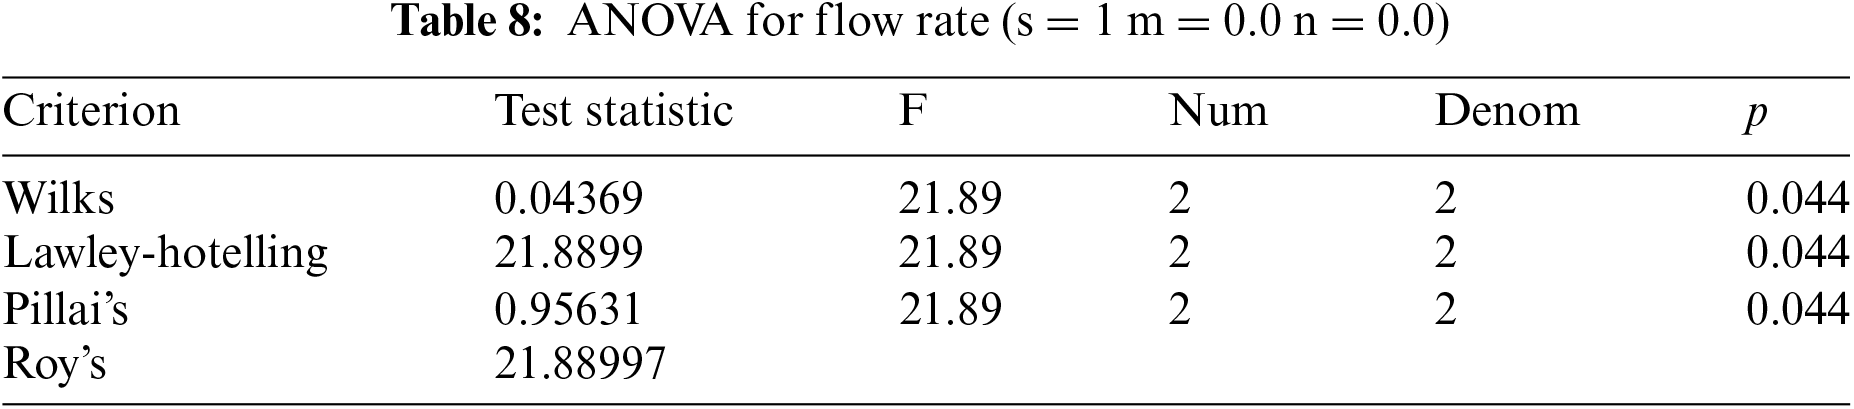
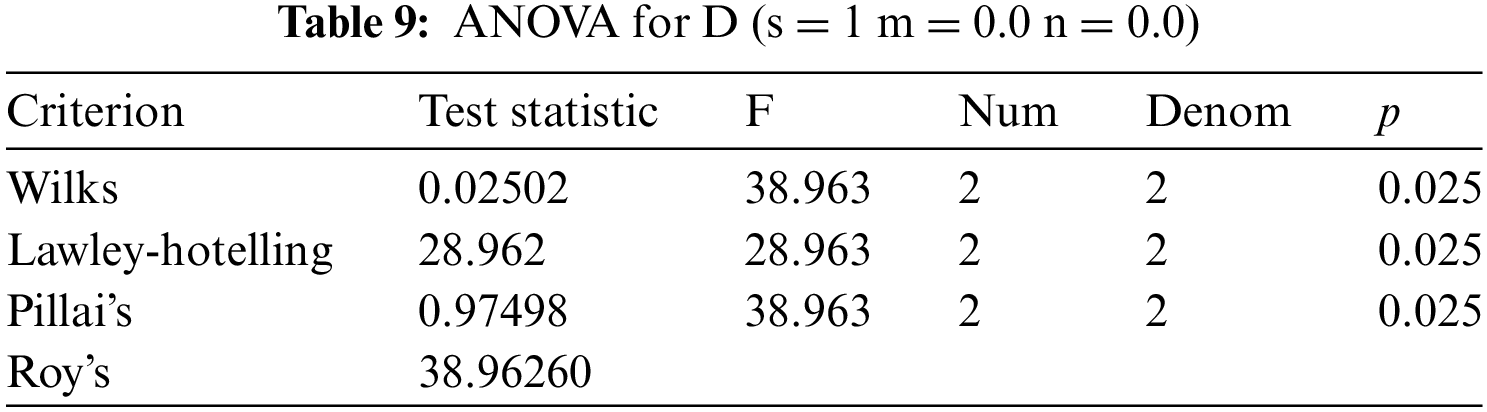
To know the contribution of these parameters in the optimization process of the thermal storage, ANOVA analysis result is necessary. This analysis result is put in Tables 7–9.
General Linear Model: Temperature vs. H, flow rate, D.
From the ANOVA analysis of the parameter’s contribution displayed here above, the p value indicates that either the parameter contributes a significant value in the optimization process or not. In any engineering design and optimization, a parameter contributes significantly to the design and optimization process if its p value is less than 5%. Based on this principle, for this study of phase one optimization, the two parameters of storage diameter (D) (Table 9) with a p value of 2.5% and flow rate with the p value of 4.4% contribute significantly in optimizing the average temperature of the storage system within the allocated time. The p value for storage height is 11% which is above 5% has the least significant contribution for this phase one temperature optimization. Out of the three parameters storage diameter is the most influential parameter in designing and optimization of the thermal storage cross-section average temperature distribution within the charging time allotted.
The optimized temperature distribution in the storage cross-section average temperature is analyzed for the three sand particle size parameters. For the cut point 2D analysis, a specified point for sand bed and hot water temperature is also evaluated as in the case of phase one optimization.
Parameterizing of the sand particles size of the thermal storage has not shown any significant change in the sand and hot water temperature as indicated in the respective graph on Fig. 8 for sand and hot water temperature of the bottom (outlet) of the thermal storage. Hence, the nominal particle size 12 mm itself is optimal for this study.
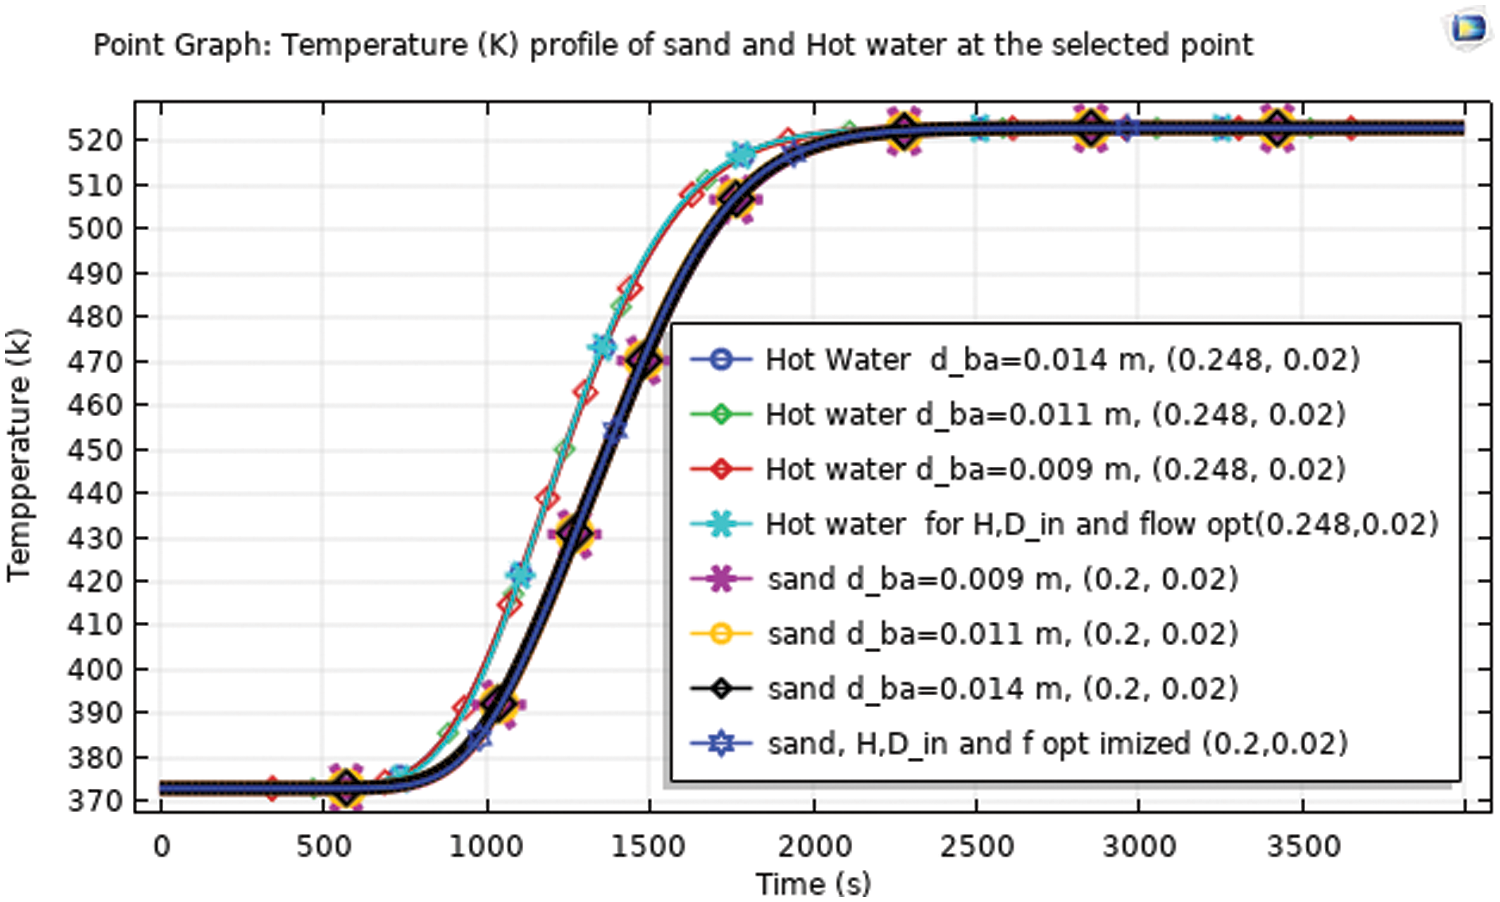
Figure 8: Temperature profile of the selected point of sand and hot water of sand particle optimized
4.5 Pressure Drops of the System
In the packed bed sensible thermal energy storage (STES), pressure drop is key concern since higher pressure drop leads into lower energy storage efficiency. As can be observed fro the graph of Fig. 9, the pressure difference between the outlet and the inlet is higher at 20 s charging time is greater than that of 1800 and 3600 s charging time. Hence the pressure drop is maximum at the initial charging time and decreasing with time. Hence, the pressure drops of the STES are 0.7, 0.5, and 0.45 Pa for 20, 1800 and 3600 s, respectively.
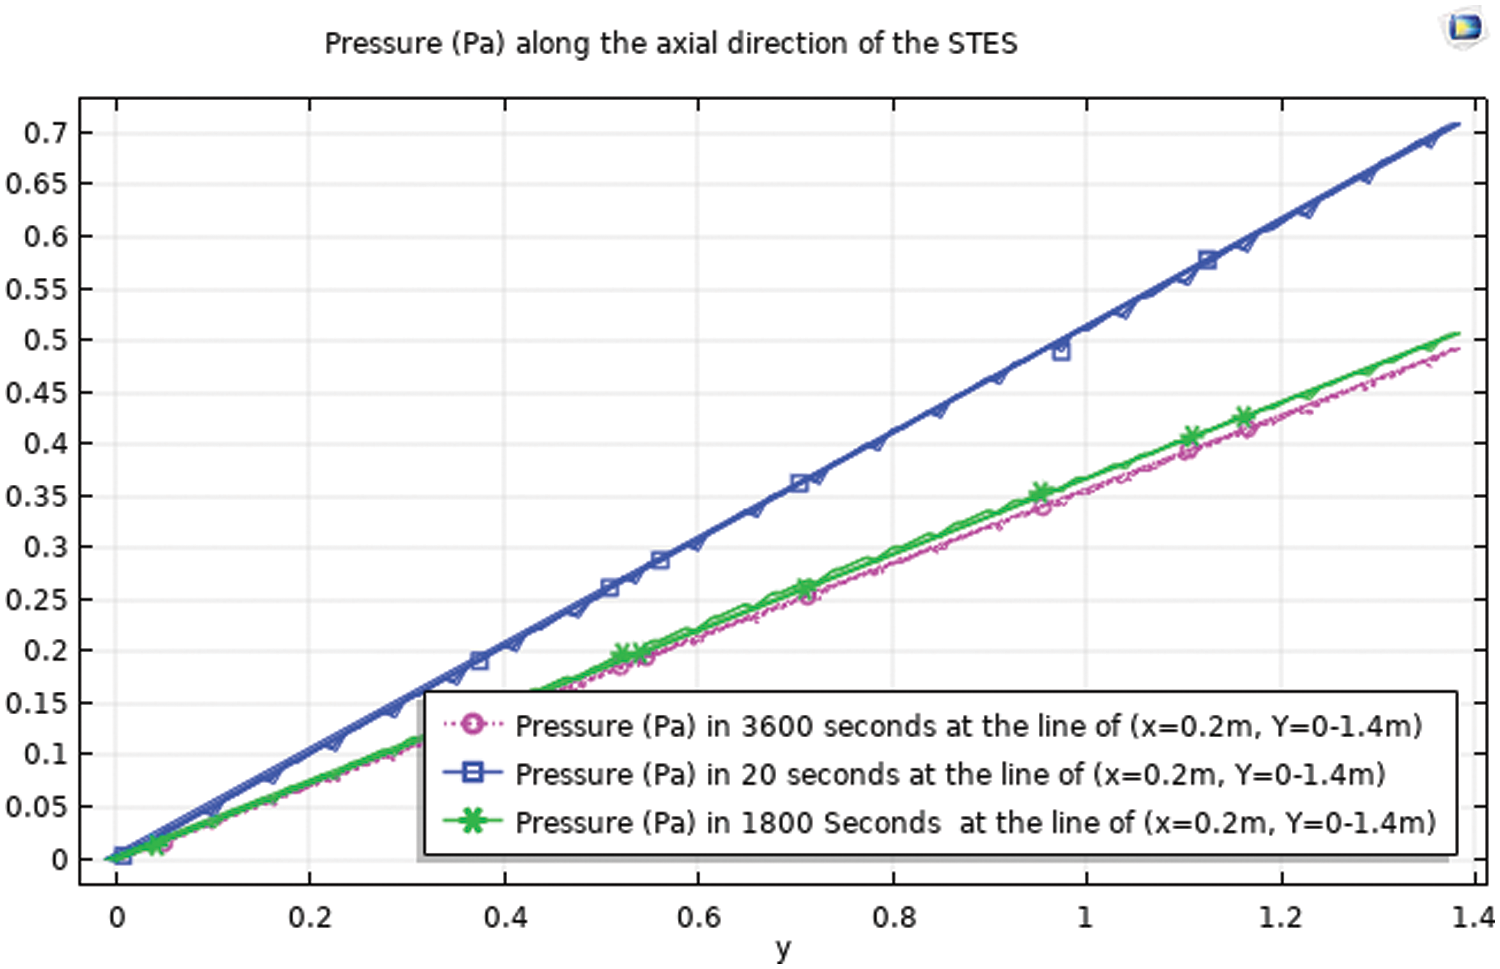
Figure 9: Pressure drop of the system
4.6 Comparison between Optimized and Nominal Simulated Thermal Energy Storage
4.6.1 2D Simulated Nominal and Optimized
From the surface temperature simulated below, the temperature profile is varying with time. Surface temperature comparison between nominal and optimized solar thermal energy storage system (STES) are shown in Fig. 10a–d.

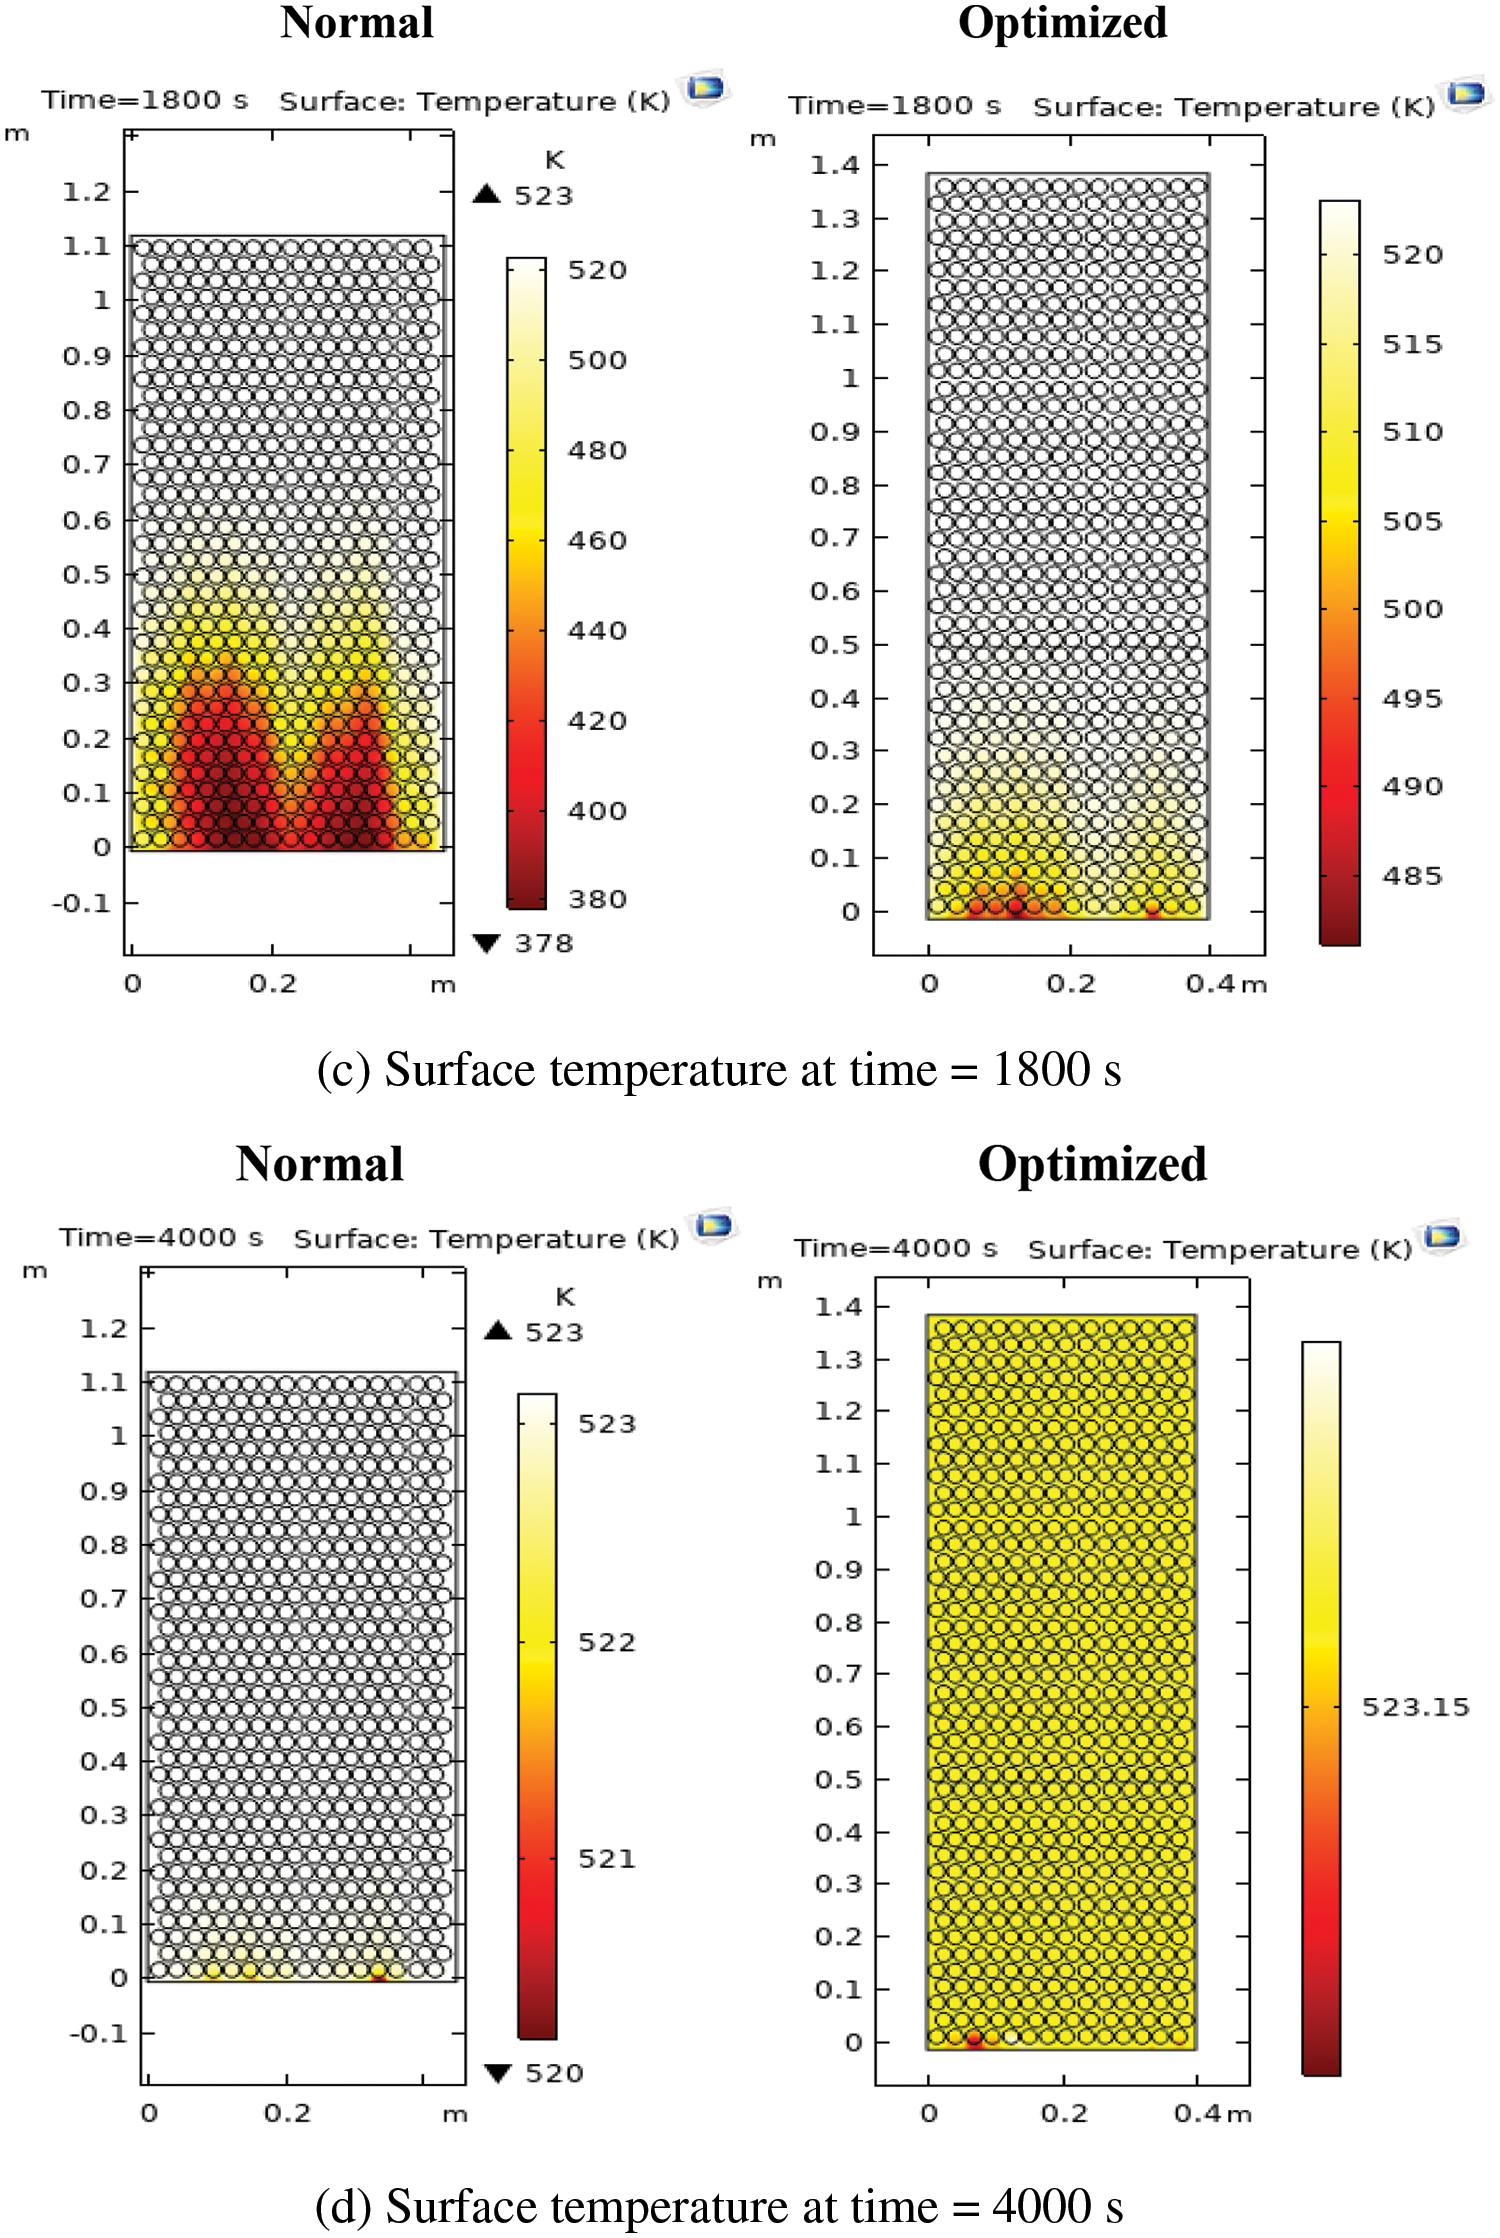
Figure 10: (a) Nominal and optimized surface temperature at time 20 s. (b) Nominal and optimized surface temperature at time 900 s. (c) Nominal and optimized surface temperature at time 1800 s. (d) Nominal and optimized surface temperature at time 4000 s
4.6.2 Temperature Profile of the Optimized and Nominal SETS at Bottom, Middle and Top
In this section, the temperature profile of the point in the bottom (outlet), the middle and the top (inlet) of the packed bed storage for sand and hot water storage materials are analyzed and compared depending the charging time. The detailed discussion on the comparisons of optimal and nominal thermal energy storage is argued from the following graph.
The Fig. 11 is the compared result of the temperature profile of the storage in the case of the nominal parameters in cut point 2D graph of and that of the optimized parameters cut point. For the nominal and optimized storage, the temperature distribution at the inlet of the storage appears somewhat similar for both the hot water and sand particle. Of course, that is it because the points of the specified location are so short from the inlet. Even though, the hot water at the top of the optimized storage attained a temperature of 520 K at about 100 s out of the other temperature profiles. As the axial distance from the inlet of the storage increases, the temperature of the sand and hot water between optimized and nominal designed thermal storage increased. For instance, from the figure, sand particle temperature at the bottom (x = 0.2, y = 0.02) of the optimized storage attained a temperature of 520 K at about 2000 s charging time, but for the nominal storage of the same sand in the same point of sand particle it needs approximately 3800 s to reach the same temperature of 520 K.
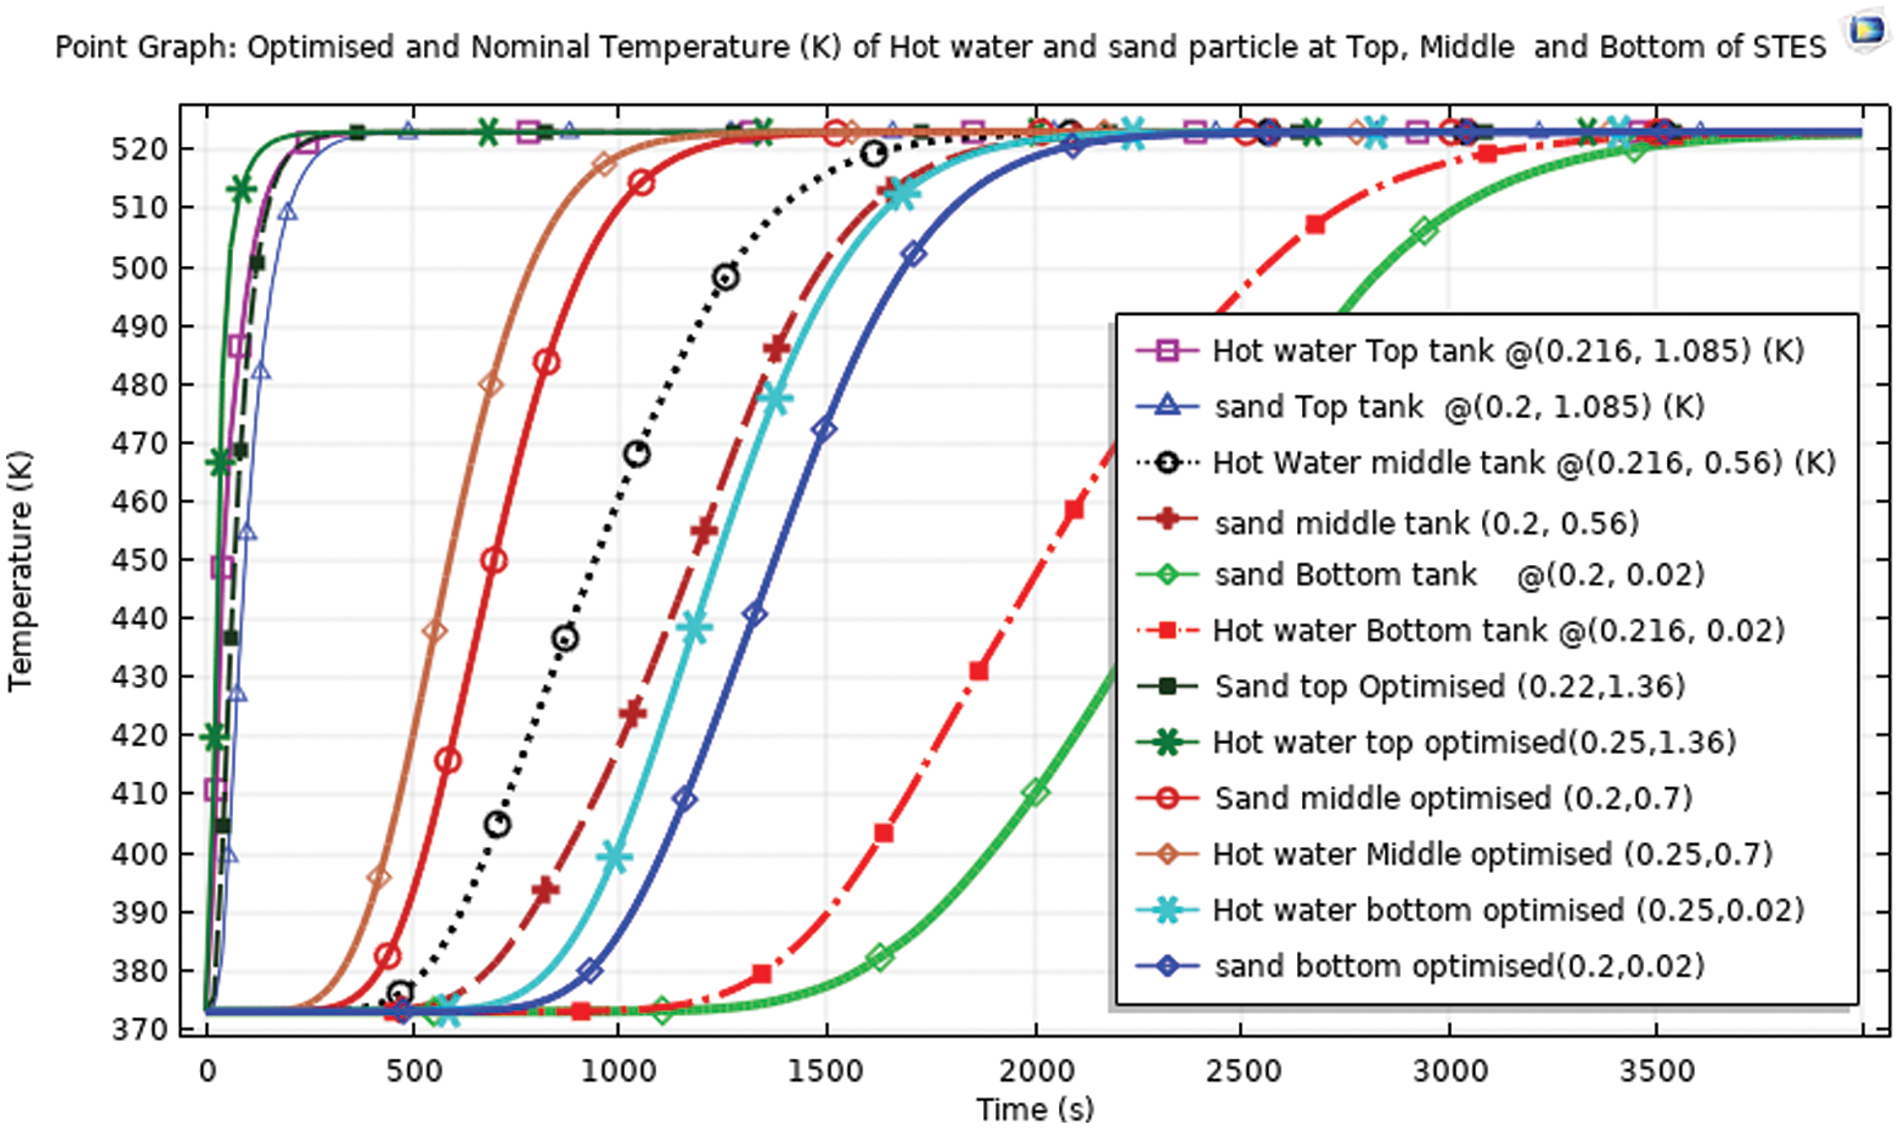
Figure 11: Sand and hot water temperature at top, middle and bottom point for optimized and nominal storage
The bottom hot water temperature of the optimized storage and the middle sand particle temperature of the nominal storage has gotten a temperature of 520 K approximately at the same charging time of about 1900 s. This is an admiring significant difference between the optimized and nominal parameters in charging time of the storage. Because the time taken to charge the optimal storage is approximately the same with the charging time to charge half of the nominal storage. The hot water and sand particle at the middle of the optimized storage attained a temperature of 520 K at approximately 900 and 1000 s respectively while for the nominal storage, it needs about 1900 and 2000 s, respectively.
4.6.3 Nominal and Optimized Average Temperature and Total Enthalpy
From the temperature and enthalpy graph plotted in Fig. 12, the average total enthalpy of the optimized thermal storage has gotten an enthalpy amount of approximately 0.53 MJ/kg at about 2000 s charging time, in contrast the nominal thermal storage attained nearly 0.49 MJ/kg with the provided charging time of 4000 s which is very significantly different result of the amount of total enthalpy considering charging time. Similarly, while the average temperature of optimized thermal storage charged and reached about 523.15 K with the charging time of 2000 K, the nominal thermal storage attained this temperature 1500 s later compared to the optimized i.e., 3500 s.
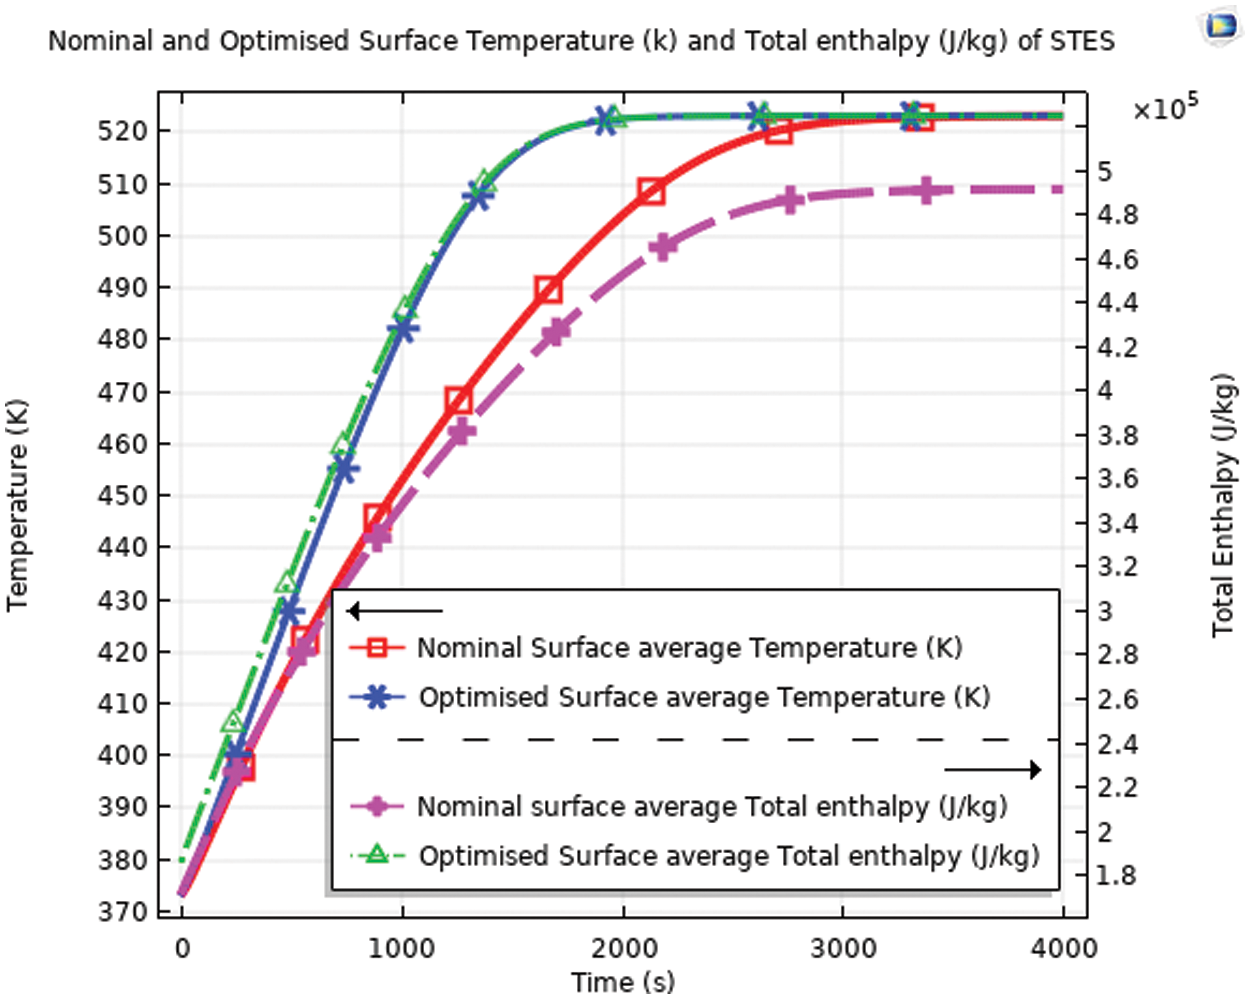
Figure 12: Nominal and optimized average temperature and enthalpy
4.6.4 Charging Energy Efficiency Comparison with the Literature Work
Even, there is no article report for the same storage material designed and optimized, Prasad et al. have reported the charging energy efficiency of concrete, cast iron and cast steel in the title of Design and optimization of lab-scale sensible heat storage. For this study, the concrete charging energy efficiency has been chosen to compare and the results are shown in Fig. 13.
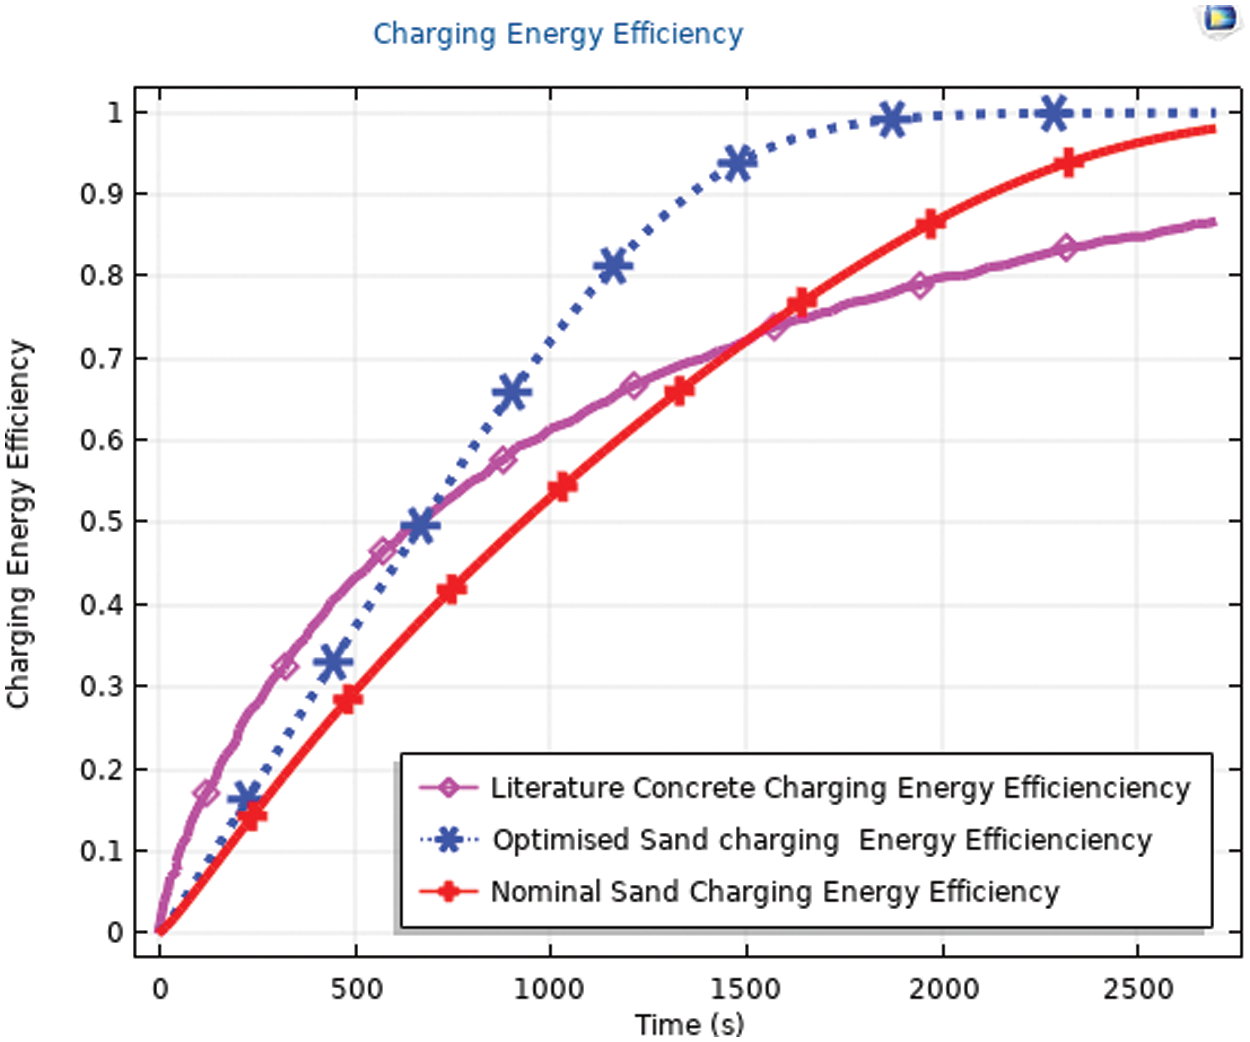
Figure 13: Charging energy efficiency comparison
The charging energy efficiency of the optimized sand thermal storage approached to 100% charged approximately in 2000 s whereas for the nominal sand thermal storage is about 87% charged for the same time. The charging energy efficiency of the previous work on concrete is higher than the optimized and nominal sand thermal storage of this study up to about 600 and 1600 s, respectively. Above the charging time of 600 and 1600 s charging energy efficiency, the optimized and nominal sand based thermal storage respectively are greater than concrete charging energy efficiency. For instance, the charging energy efficiency of sand optimized thermal storage in 2000 s is approximately 100% whereas for the thermal storage of sand nominal and concrete from literature is about 87% and 80%. During the charging time of 0 to 2700 s, the average charging energy efficiency of the optimized sand thermal storage is greater than the nominal sand thermal storage and previous work concrete sensible thermal storage by 13.7% and 13.1%, respectively.
Mass of the storage:
The total volume of the storage is equal to 0.173 m3. The volume ratio of the storage is 4:1 sand to hot water, respectively. Hence, the sand volume is 0.1384 m3 and hot water 0.0346 m3.
The enthalpy
In phase one optimizing that includes storage height, storage diameter, and flow rate, the optimum blended parameters obtained are storage height 1.4 m, storage diameter 0.4 m and flow rate0.02 kg/s considering the charging time for temperature and enthalpy distribution. These results have been validated by Taguchi method. From the ANOVA analysis in Minitab software, out of these parameters, storage diameter with 2.5% p value is highly significant. Flow rate with a p value of 4.4 is the second significant parameter. The third parameter storage height with a p value of 11% is not significant. Hence, storage diameter is highly effective in the optimization of the packed bed storage. Phase two optimization of particle size did not show any difference with the nominal value. Hence, the nominal value itself is taken as an optimal one.
1. The result of the average cross-section temperature and average total enthalpy of the optimized storage have been changed to 523.15 K, and 0.53 MJ/kg in the charging time of 4000 s.
2. In contrast to the nominal storage that attained nearly 0.49 MJ/kg of enthalpy with the provided charging time of 4000 s, the optimized storage recorded this amount of enthalpy with the charging time of 1400 s which is a very significantly different result.
3. Similarly, while the cross-section average temperature of optimized thermal storage charged and reached about with the charging time of 2000 s, the nominal one attained this temperature 1500 s later to the optimized, i.e., 3500 s.
4. During the charging time of 0 to 2700 s, the average charging energy efficiency of the optimized sand thermal storage is greater than the nominal sand thermal storage and previous work on concrete by 13.7% and 13.1% respectively.
Acknowledgement: The author, Matiewos Mekonen Abera, acknowledges the Jimma University and Aksum University for providing the necessary support. Partial support from JiT Center of Excellence is gratefully acknowledged.
Funding Statement: The authors received no specific funding for this study.
Author Contributions: The authors confirm contribution to the paper as follows: Matiewos Mekonen Abera: study conception and design; Venkata Remayya Ancha: data collection; Balewgize Amare: analysis and interpretation of results; L. Syam Sundar: data analysis and comparison of the data; Kotturu V. V. Chandra Mouli: initial drat writing. All authors reviewed the results and approved the final version of the manuscript.
Availability of Data and Materials: This statement should make clear how readers can access the data used in the study and explain why any unavailable data cannot be released.
Conflicts of Interest: The authors declare that they have no conflicts of interest to report regarding the present study.
References
1. Sarbu, I., Sebarchievici, C. (2018). A comprehensive review of thermal energy storage. Sustaianbility, 10(1), 191. https://doi.org/10.3390/su10010191 [Google Scholar] [CrossRef]
2. Izquierdo-Barrientos, M. A., Sobrino, C., Almendros-Ibáñez, J. A., Barreneche, C., Ellis, N. et al. (2016). Characterization of granular phase change materials for thermal energy storage applications in fluidized beds. Applied Energy, 181, 310–321. [Google Scholar]
3. Labus, M., Labus, K. (2018). Thermal conductivity and diffusivity of fine-grained sedimentary rocks. Journal of Thermal Analysis and Calorimetry, 132, 1669–1676. [Google Scholar]
4. Suresh, C., Saini, R. P. (2020). Review on solar thermal energy storage technologies and their geometrical configurations. International Journal of Energy Research, 44, 4163–4195. [Google Scholar]
5. Royo, P., Acevedo, L., Ferreira, V. J., García-Armingol, T., López-Sabirón, A. M. et al. (2019). High-temperature PCM-based thermal energy storage for industrial furnaces installed in energy-intensive industries. Energy, 173, 1030–1040. [Google Scholar]
6. Li, Y., Klausner, J. F., Mei, R., Knight, J. (2006). Direct contact condensation in packed beds. International Journal of Heat and Mass Transfer, 49, 4751–4761. [Google Scholar]
7. Diago, M., Iniesta, A. C., Delclos, T., Shamim, T., Calvet, N. (2015). Characterization of desert sand for its feasible use as thermal energy storage medium. Energy Procedia, 75, 2113–2118. [Google Scholar]
8. Tetteh, S., Juul, G., Järvinen, M., Santasalo-Aarnio, A. (2024). Improved effective thermal conductivity of sand bed in thermal energy storage systems. Journal of Energy Storage, 86 Part B, 111350. [Google Scholar]
9. Al-Nimr, M. A., Abu-Qudais, M. K., Mashaqi, M. D. (1996). Dynamic behaviour of a packed bed energy storage system. Energy Conversion and Manage, 37, 23–30. [Google Scholar]
10. Barbi, S., Barbieri, F., Marinelli, S., Rimini, B., Merchiori, S. et al. (2021). Phase change material-sand mixtures for distributed latent heat thermal energy storage: Interaction and performance analysis. Renewable Energy, 169, 1066–1076. [Google Scholar]
11. Ratuszny, P. (2017). Thermal energy storage in granular deposits. International Conference Energy, Environment and Material Systems (EEMS 2017), pp. 1–6, 01022. https://doi.org/10.1051/e3sconf/20171901022 [Google Scholar] [CrossRef]
12. Özkahraman, H. T., Selver, R., Işık, E. C. (2004). Determination of the thermal conductivity of rock from P-wave velocity. International Journal of Rock Mechanics and Mining Sciences, 41(4), 703–708. https://doi.org/10.1016/j.ijrmms.2004.01.002 [Google Scholar] [CrossRef]
13. Schärli, U., Rybach, L. (2001). Determination of specific heat capacity on rock fragments. Geothermics, 30, 93–110. [Google Scholar]
14. Abddaim, E., Sakami, S., Hassnaoui, A. E., Boukhattem, L. (2024). Impact of temperature on chemical, thermo-physical, and mechanical properties of four rock materials for sensible thermal energy storage. Journal of Energy Storage, 89, 111602. [Google Scholar]
15. Rizeiqia, N. A., Jedda, M., Liewa, P. Y. (2023). Silica sand as thermal energy storage for renewable-based hydrogen and ammonia production plants. Chemical Engineering Transactions, 106, 1111–1116. [Google Scholar]
16. Cruickshank, C. A., Baldwin, C. (2016). Sensible thermal energy storage: Diurnal and seasonal. Storing energy with speicial reference to renewable energy source. Storing Energy, 291–311. https://doi.org/10.1016/B978-0-12-803440-8/00015-4 [Google Scholar] [CrossRef]
17. Hanmant Rao, L., Dirbude, S. (2003). Numerical modelling and optimization of packed-bed thermal-energy storage system. Journal of Physics: Conference Series, 2178, 012003. https://doi.org/10.1088/1742-6596/2178/1/012003 [Google Scholar] [CrossRef]
18. Li, X., Liu, S., Cui, X., Li, H. (2013). Experimental study of direct contact steam condensation in structured packing. Asia-Pacific Journal of Chemical Engineering, 8(5), 657–664. https://doi.org/10.1002/apj.1706 [Google Scholar] [CrossRef]
19. Edwards, J., Bindra, H. (2017). An experimental study on storing thermal energy in packed beds with saturated steam as heat transfer fluid. Solar Energy, 157, 456–461. https://doi.org/10.1016/j.solener.2017.08.065 [Google Scholar] [CrossRef]
20. Khor, J. O., Sze, J. Y., Li, Y., Romagnoli, A. (2020). Overcharging of a cascaded packed bed thermal energy storage: Effects and solutions. Renewable and Sustainable Energy Reviews, 117, 109421. https://doi.org/10.1016/j.rser.2019.109421 [Google Scholar] [CrossRef]
21. Alnaimat, F., Klausner, J. F., Mei, R. (2011). Transient analysis of direct contact evaporation and condensation within packed beds. International Journal of Heat and Mass Transfer, 54(15–16), 3381–3393. https://doi.org/10.1016/j.ijheatmasstransfer.2011.03.048 [Google Scholar] [CrossRef]
22. Trevisan, S., Jemmal, Y., Guedez, R. (2021). Packed bed thermal energy storage: A novel design methodology including quasi-dynamic boundary conditions and techno-economic optimization. Journal of Energy Storage, 36, 102441. https://doi.org/10.1016/j.est.2021.102441 [Google Scholar] [CrossRef]
23. Manish, K. R., Banerjee, J. (2013). Thermal stability of phase change materials used in latent heat energy storage systems: A review. Renewable and Sustainable Energy Reviews, 18, 246–258. https://doi.org/10.1016/j.rser.2012.10.022 [Google Scholar] [CrossRef]
24. Demirbas, M. F. (2006). Thermal energy storage and phase change materials: An overview. Energy Sources, Part B: Economics, Planning, and Policy, 1(1), 85–95. https://doi.org/10.1080/009083190881481 [Google Scholar] [CrossRef]
25. Barbi, S., Barbieri, F., Marinelli, S., Rimini, B., Merchiori, S. et al. (2022). Phase change material evolution in thermal energy storage systems for the building sector, with a focus on ground-coupled heat pumps. Polymers, 14(3), 620. [Google Scholar] [PubMed]
26. Ghalambaz, M., Mehryan, S. A. M., Shirivand, H., Shalbafi, F., Younis, O. et al. (2021). Simulation of a fast-charging porous thermal energy storage system saturated with a nano-enhanced phase change material. Energies, 14(6), 1575. [Google Scholar]
27. Raquel, S., Luís, J., Aguiar, B. D. (2020). Phase change materials and energy efficiency of buildings: A review of knowledge. Journal of Energy Storage, 27. https://doi.org/10.1016/j.est.2019.101083 [Google Scholar] [CrossRef]
28. Sarcinella, A., Aguiar, B. D., Jesus, C., Frigione, M. (2023). Thermal properties of PEG-based form-stable phase change materials (PCMs) incorporated in mortars for energy efficiency of buildings. Journal of Energy Storage, 67. https://doi.org/10.1016/j.est.2023.107545 [Google Scholar] [CrossRef]
29. Sutar, A., Pal, A., Malwadkar, P. (2016). Application of phase change materials for thermal management of buildings: State of the art and review. 5th International Conference on Recent Trends in Engineering Science & Management, pp. 1097–1108. [Google Scholar]
30. Lew, J. T. V., Li, P., Chan, C. L., Karaki, W., Stephens, J. (2011). Analysis of heat storage and delivery of a thermocline tank having solid filler material. Journal of Solar Energy Engineering, 133(2), 021003. https://doi.org/10.1115/1.4003685 [Google Scholar] [CrossRef]
31. Zhen, Y., Garimella, S. V. (2010). Thermal analysis of solar thermal energy storage in a molten-salt thermocline. Solar Energy, 84(6), 974–985. https://doi.org/10.1016/j.solener.2010.03.007 [Google Scholar] [CrossRef]
32. Beasley, D. E., Clark, J. A. (1984). Transient response of a packed bed for thermal energy storage. International Journal of Heat and Mass Transfer, 27, 1659–1669. [Google Scholar]
33. Chekifi, T., Boukraa, M. (2022). Thermocline storage for concentrated solar power plants: Descriptive review and critical analysis. Journal of Energy Storage, 55, 105773. [Google Scholar]
34. Jaluria, Y. (1989). Optimization and control of a thermal energy storage system. In: Kilkiss, B., Kakac, S. (Eds.Energy storage systems. NATO ASI series, vol. 167. Dordrecht: Springer. https://doi.org/10.1007/978-94-009-2350-8_5 [Google Scholar] [CrossRef]
35. Allen, K. G., Backström, W., Kröger, D. G. (2014). Packed rock bed thermal storage in power plants: Design considerations. Energy Procedia, 49, 666–675. [Google Scholar]
36. Chan, M. C., Smereka, P. S., Giusti, D. (1983). A numerical study of transient mixed convection flows in a thermal storage tank. Journal of Solar Energy Engineering, 105(3), 246–253. [Google Scholar]
37. Mawire, A., Phori, A., Taole, S. (2015). De-stratification and heat loss comparison of three thermal oils in a small storage tank. Solar World Congress, Republic of Korea. [Google Scholar]
38. Niyas, H., Prasad, L., Muthukumar, P. (2015). Performance investigation of high-temperature sensible heat thermal energy storage system during charging and discharging cycles. Clean Technologies and Environmental Policy, 17, 501–513. [Google Scholar]
39. Karna, S. K., Singh, R. V., Sahai, R. (2012). Application of Taguchi method in Indian industry. International Journal of Emerging Technology and Advanced Engineering, 2(11), 387–391. [Google Scholar]
Cite This Article
 Copyright © 2024 The Author(s). Published by Tech Science Press.
This work is licensed under a Creative Commons Attribution 4.0 International License , which permits unrestricted use, distribution, and reproduction in any medium, provided the original work is properly cited.
 Downloads
 Citation Tools