
 Submit a Paper
 Propose a Special lssue
 Open Access
ARTICLE

Experiments and Analyses on Heat Transfer Characteristics from a Solid Wall to a Strip-Shaped Wick Structure
1 Department of Mechanical and Mathematical Engineering, Graduate School of Science and Technology, Kumamoto University, Kumamoto, 860-8555, Japan
2 Division of Industrial Fundamentals, Faculty of Advanced Science and Technology, Kumamoto University, Kumamoto, 860-8555, Japan
* Corresponding Author: Yasushi Koito. Email:
Frontiers in Heat and Mass Transfer 2024, 22(3), 687-702. https://doi.org/10.32604/fhmt.2024.052928
Received 19 April 2024; Accepted 31 May 2024; Issue published 11 July 2024
 View Full Text
 Download PDF
Abstract
Centered or striped wick structures have been used to develop ultrathin heat pipes. Differing from traditional heat pipes, the centered or striped wick structures leave noncontact container surfaces with the wick structure. In this study, experiments and numerical analyses were conducted to investigate the influence of these noncontact surfaces. In the experiments, a strip-shaped wick structure was placed vertically, the top was sandwiched between wider rods and the bottom was immersed in a working fluid. The rod width was greater than the wick width; thus, noncontact surfaces were left between the rod and the wick structure. The heat was applied from the rod to the wick structure, and the evaporation heat transfer characteristics of the working fluid from the wick structure were evaluated. Water was used as the working fluid. The experiments were conducted by varying the rod and wick widths. The experimental results were obtained when the wick structures were placed separately. In the numerical analyses, the temperature and heat flux distributions in the rod were obtained. From the experimental and numerical results, it was confirmed that the noncontact surfaces caused the heat flux in the rod near both surfaces of the wick structure to concentrate, which increased the evaporation thermal resistance of the wick structure. A reduction in the noncontact surface area by increasing the wick width was found to be effective in decreasing the evaporation thermal resistance and increasing the maximum heat transfer rate of the wick structure. The separation of the wick structure increased the evaporation surface area. However, its effectiveness was limited when the heat transfer rate was small.Keywords
Nomenclature
| A | Cross-sectional area (m2) |
| h | Height (mm) |
| L | Length (mm, m) |
| n | Coordinate normal to surface (m) |
| Q | Heat transfer rate (W) |
| q | Heat flux (W/m2) |
| q | Heat flux vector (= (qx, qy)) (W/m2) |
| T | Temperature (°C) |
| Tsat | Saturation temperature (°C) |
| t | Time (s) |
| W | Width (mm, m) |
| x, y, z | Coordinates (mm, m) |
| Z | Dimensionless coordinate (−) |
| Greek Symbols | |
| ΔT | Superheat (°C) |
| λ | Thermal conductivity (W/(mK)) |
| ξ | Coordinate (m) |
| Subscripts | |
| 1–8 | Measurement point |
| e | Evaporation |
| l | Left rod |
| max | Maximum |
| r | Right rod |
| s | Surface |
| w | Wick structure |
Two-phase cooling technologies are widely used for thermal management of electronic devices. Heat removal is essential for stable operation of electronic devices. The latent heat of the vaporization of a working fluid is used for heat transfer; thus, a large amount of heat is removed effectively with a small temperature drop. Two-phase cooling technologies can be classified into active and passive cooling depending on the presence or absence of an external power source. In active cooling, a pump is employed as the external power, and a working fluid is supplied to the evaporator section, where a heat source is cooled via liquid evaporation. Microchannels [1–3], sprays [4,5], and jets [6,7] are commonly used as the evaporator section, and microstructures [8,9] and operating conditions [10] have been proposed to enhance the heat transfer at the evaporator section. Understanding the evaporation heat transfer characteristics is important to optimize the thermal performance of the evaporator section. In contrast, in passive cooling, the liquid is supplied without using external power. A heat pipe is a typical two-phase device for a passive cooling system. A traditional heat pipe comprises a cylindrical container, a capillary-wick structure, and a working fluid [11–13]. The cylindrical container has a wick structure on the inner wall, and the wick structure pumps the condensate to the evaporator section. In addition to traditional heat pipes, various other types of heat pipes have been developed, e.g., vapor chambers [14,15], loop heat pipes [16,17], pulsating heat pipes [18,19], and rotating heat pipes [20,21].
Recently, ultrathin heat pipes have been developed with centered [22–24] or striped [25–27] wick structures. This type of heat pipe, which is much thinner than traditional heat pipes, was designed primarily for the thermal management of very thin electronic devices. The operating principle of an ultrathin heat pipe is essentially the same as that of the traditional heat pipes; however, the cross-sectional view differs considerably. Fig. 1 shows the cross-sectional view of an ultrathin heat pipe with a striped wick structure. The differences from traditional heat pipes are characterized by a sandwiched structure and a noncontact surface with a wick structure. In the ultrathin heat pipe, the wick structure is sandwiched between the upper and lower container walls. This structure is unique, and in a previous study the authors conducted heat transfer experiments on the evaporation characteristics of the sandwiched structure [28]. Strip-shaped wick structures with thicknesses of 0.5, 1.0, and 1.5 mm were employed in the experiments, and the effect of the wick thickness was also discussed.
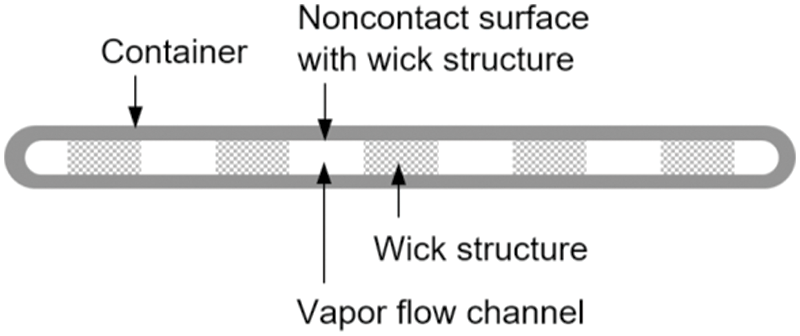
Figure 1: Cross-sectional view of the ultrathin heat pipe with a striped wick structure
In addition to the sandwiched structure, the centered or striped wick structures leave noncontact container surfaces with the wick structure. As a result, heat flow is expected to be constricted in the container wall at the evaporator section and spread at the condenser section, which causes additional constriction/spreading thermal resistances [29] in the heat pipe. In addition, the constriction of heat flow is expected to make heat flux distributions in the wick structure nonuniform. Up to now, many studies have been conducted to improve the thermal performance of wick structures and ultrathin heat pipes. Very recently, Yuan et al. [30] prepared a multi-scale microgroove wick structure by nanosecond laser irradiation for high-performance ultrathin ceramic heat pipes. Zhou et al. [31] proposed a novel method of fabricating resistance-welded laminated mesh microgroove composite wick structures. Wu et al. [32] prepared multiscale structures, including superhydrophilic nanosheet structures and microparticles, on copper meshes to enhance the capillary performance of wick structures. However, to the best of our knowledge, the influence of the noncontact surfaces on the heat transfer characteristics of ultrathin heat pipes has not been discussed extensively. Moreover, understanding the influence of nonuniform heat flux distributions is important for further improvement of wick structures. Thus, in this study, extended experiments and numerical analyses were conducted based on our previous experiments [28]. Here, a strip-shaped wick structure was sandwiched between wider rods, and noncontact surfaces were left between the rod and wick structure. The conduction heat transfer characteristics in the rod and evaporation heat transfer characteristics of the working fluid from the wick structure were investigated by changing the rod width and wick width. In addition, the heat transfer characteristics were investigated when the wick structures were placed separately. This study presents the corresponding experimental and numerical results, and the influence of the noncontact surface area is discussed.
2 Experimental Methods and Numerical Analyses
Fig. 2 shows the experimental apparatus. This apparatus was also used in our previous study [28]; however, in the current study, two rectangular rods that sandwiched a wick structure were changed to increase the rod width from 10 to 20 mm. This paper summarizes the experimental apparatus and procedure, and additional details can be found in the literature [28]. Strip-shaped wick structures with widths of 5, 10, and 15 mm were fabricated by sintering copper powder. The length and thickness of all wick structures were 70 and 1.0 mm, respectively. A representative photograph of the wick structure and its microscope photograph are shown in Fig. 3. The sintering was performed in a reducing atmosphere in an electric furnace. The average porosities of the 5, 10, and 15-mm-wide wick structures were 0.43, 0.46, and 0.43, respectively. As shown in Fig. 2, the wick structure was oriented vertically. The top 10 mm was sandwiched between the rods, and the bottom 10 mm was immersed in the working fluid; thus, the liquid lifting height was 50 mm. The top 10 mm was the evaporator section, and the noncontact surfaces were left between the rod and wick structure. An upper view of the rods is shown in Fig. 4. Two cartridge heaters were inserted into the left rod for heating, and the heating rate was controlled using a wattmeter and a power supply. The working fluid temperature was controlled using a thermostatic bath and a thermocouple. The temperature measurement points in the rods are also shown in Fig. 4. In this study, the temperatures were measured at four points on each of the left (T1 − T4) and right (T5 − T8) rods, and the load sandwiching the wick structure was measured using a load cell. To minimize heat loss, the rods were covered with thermal insulation material (Styrofoam™, thermal conductivity: less than 0.036 W/(mK) [33]) except for the ends on the wick side. Water was used as the working fluid.
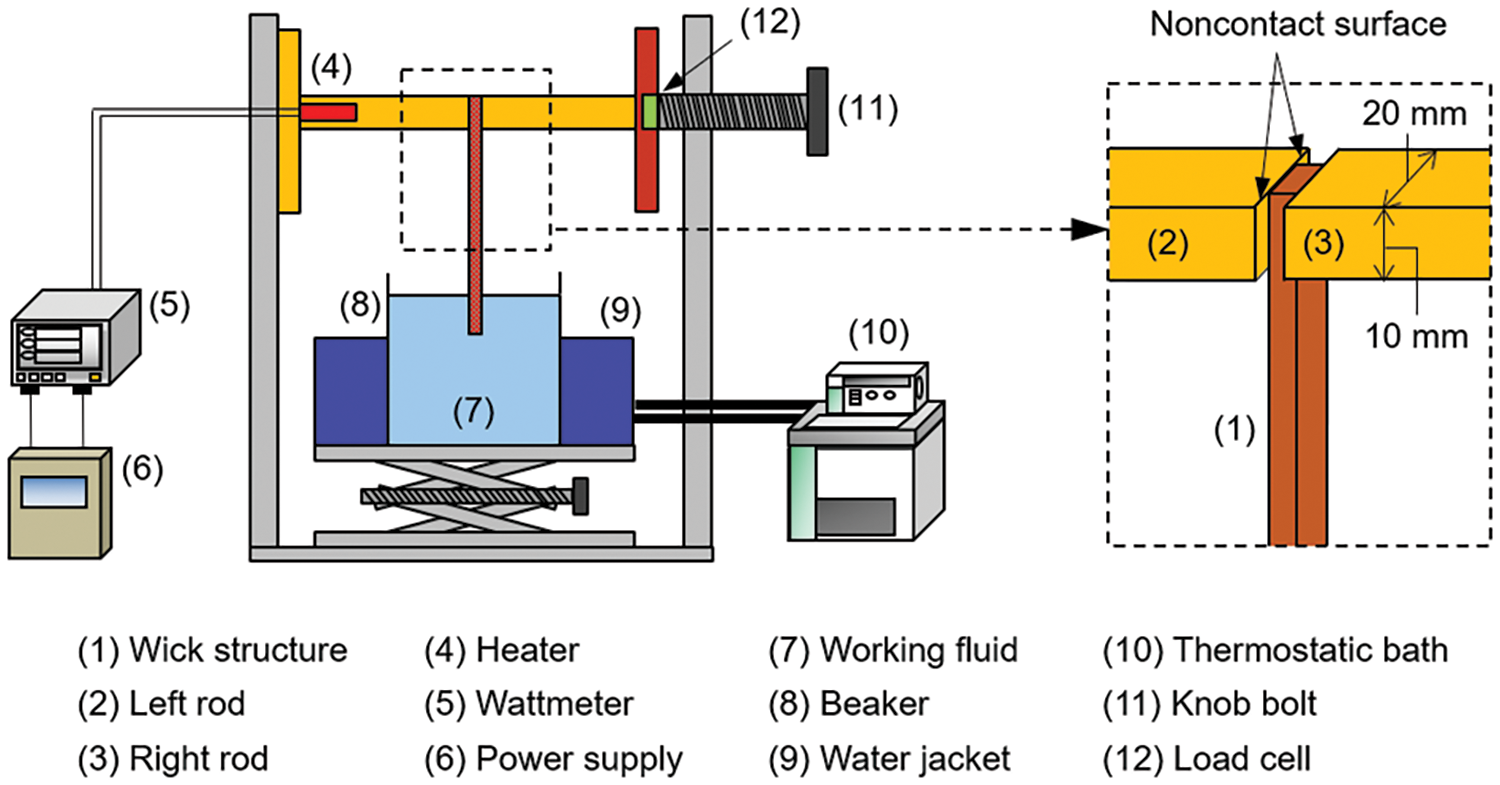
Figure 2: Schematic diagram of experimental apparatus (Case A)
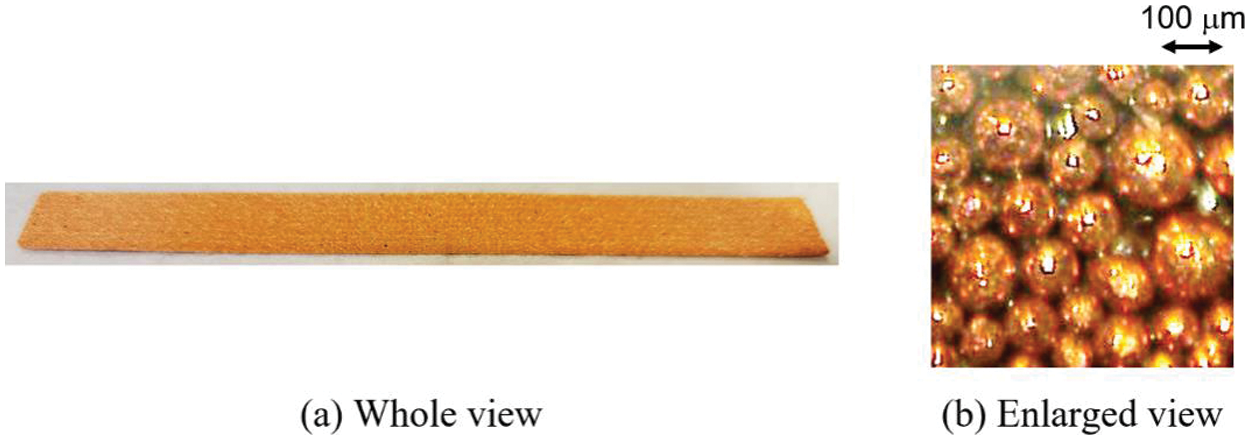
Figure 3: Photographs of the 10-mm-wide wick structure
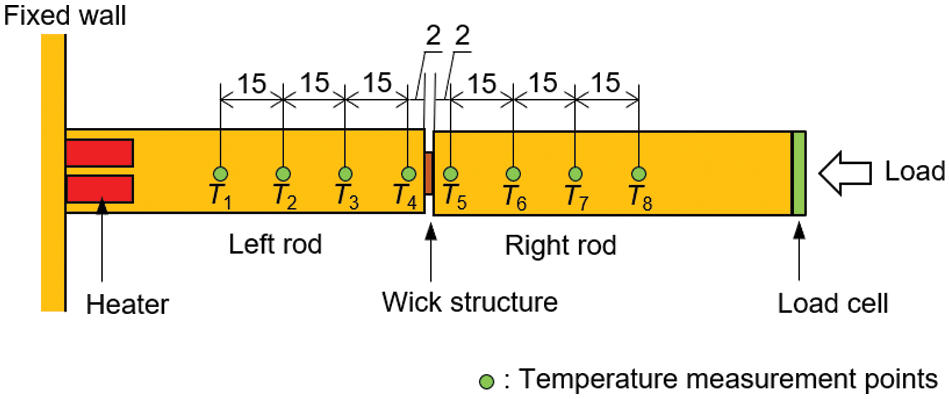
Figure 4: Upper view of the rods and temperature measurement points
In this experiment, heat was applied to the top of the wick structure, and temporal temperature changes were recorded. The electrical power to the heaters was initially 25 W, which was then increased stepwise when the temperature distributions reached a steady state. The experiment was terminated when T1−T4 continued to increase due to the occurrence of dryout. The working fluid temperature was maintained at 20°C. Using the three wick structures with widths of 5, 10, and 15 mm, the layout between the rods was varied as shown in Fig. 5. Note that the previous experiment [28] was conducted in Case D. Compared with Case D, only the rod width was increased from 10 to 20 mm in Case A. In Case B, the wick width was increased from 10 (Case A) to 15 mm. In Case C, two wick structures with a width of 5 mm were placed separately and sandwiched between the rods. The total width of the wick structures in Case C was the same as that in Case A; however, the evaporation surface area in the length direction in Case C was twice that of Case A.
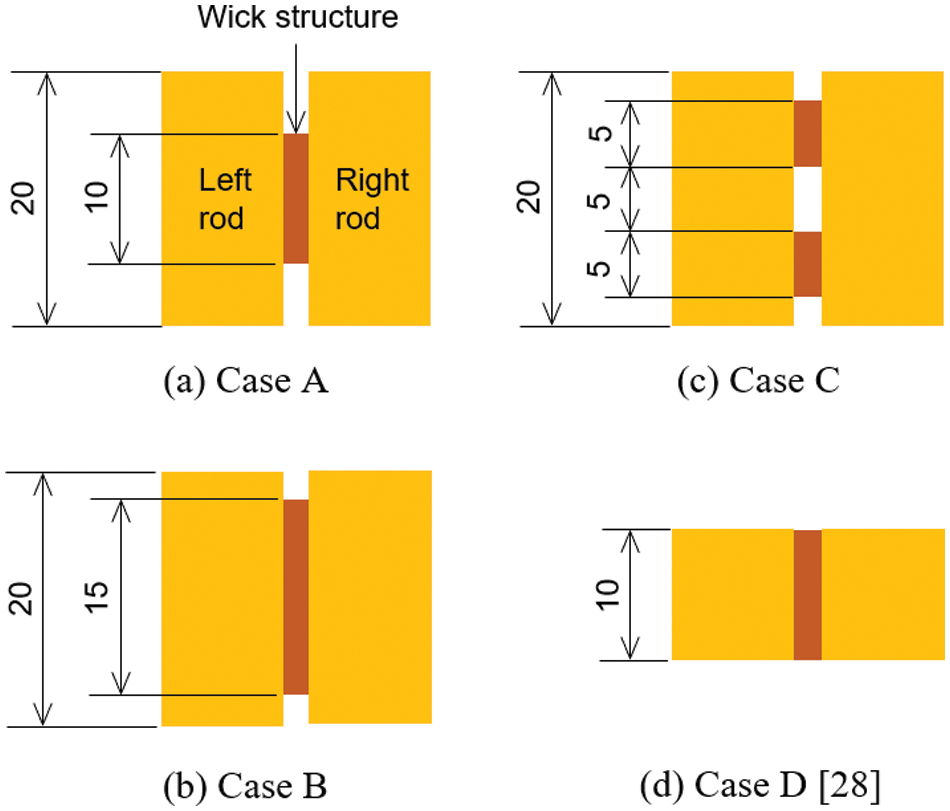
Figure 5: Layout of wick structures
Based on Fourier’s law, the heat transfer rates through the left (Ql) and right (Qr) rods were calculated using Eqs. (1) and (2), respectively.
Here, λ is the thermal conductivity of the rod, ξ is the coordinate along the rods from the measurement point of T1 to T8, and A is the cross-sectional area of the rod. (dT/dξ)|l is the temperature gradient in the left rod, and its value was obtained from the T1, T2, T3, and T4 values after confirming their linearity. In the same way, the T5, T6, T7, and T8 values were used for the calculation of (dT/dξ)|r in Eq. (2). The evaporation heat transfer rate (Qe) was then obtained using Eq. (3).
The superheat (ΔT) was defined by Eq. (4) using the contact surface temperature of the left rod (Ts) and the saturation temperature (Tsat).
In the previous experiment [28], the Ts value was obtained by extrapolating the T1, T2, T3, and T4 values linearly to the contact surface. However, the current two rods were wider than the wick structure; thus, constriction heat flow would occur in the left rod. Therefore, numerical analyses were conducted on the heat transfer characteristics of the left rod, and the Ts value was obtained by comparing numerical and experimental results. The heaters were inserted from the left end, and the right end was cooled by the wick structure; thus, the analytical system was given as shown in Fig. 6. The rod length, rod width, and wick width are denoted L, Wr, and Ww, respectively. Note that the x-axis is set in the direction from the cooled section to the heated section. The governing equation is given in as follows:
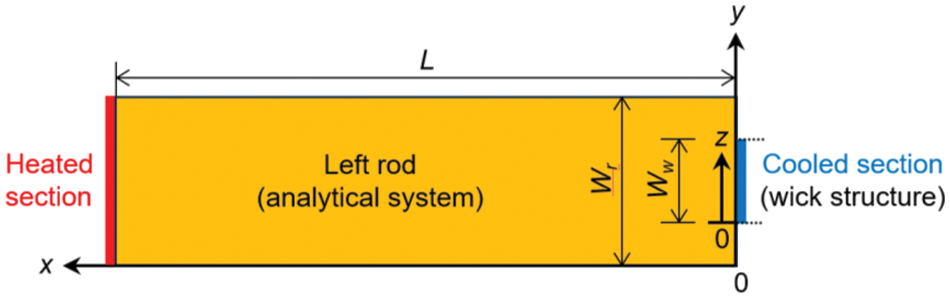
Figure 6: Analytical system
In addition, the boundary conditions at the heated and cooled sections are expressed as follows.
An adiabatic condition (Eq. (8)) was also applied to the boundary, except for the heated and cooled sections.
Here, n is the coordinate normal to the surface. Eqs. (5)–(8) were discretized using the control volume method [34], and the discretized equations were solved with iteration to obtain the temperature distributions. The iteration continued until the heat transfer rates at the heated and cooled sections agreed to within 10−7%. A numerical calculation code was developed for this calculation. Nonuniform grids were employed, and the number of grid points and the results of grid independence test are shown in Appendix A.
When experimental conditions were used for numerical analyses, only Ts was unknown in Eqs. (5)–(8). Thus, numerical results of the temperature distributions in the left rod were obtained with Ts as a parameter. Among the numerical results, the optimal Ts value was obtained when the numerical and experimental results were in the best agreement.
3.1 Wicking Performance and Sandwiching Load
Prior to conducting these experiments, two preliminary experiments were conducted to investigate the wicking performance of the wick structures and the effect of load sandwiching the wick structure.
In this experiment, the wick structure was oriented vertically, and the bottom 10 mm was immersed in a working fluid. The transient change in the liquid height (h) in the wick structure after immersion was measured using an IR camera [35]. Here, water at 20°C was used as the working fluid, and the measurement was terminated when h reached 50 mm because the liquid lifting height was 50 mm in Fig. 2. A representative wicking-visualization image is shown in Fig. 7a,b shows the changes in h with time (t) after immersion for wick structures with widths of 5, 10, and 15 mm. Sufficient images like Fig. 7a were obtained to measure the h value. As expected, h began to increase immediately after immersion, and the increment became smaller with increasing t. Very small differences between the three experimental results confirmed that the three wick structures gave approximately the same liquid rising velocity in the wick structure. Thus, the following discussion proceeds under the assumption that the wicking performance of the three wick structures was the same.
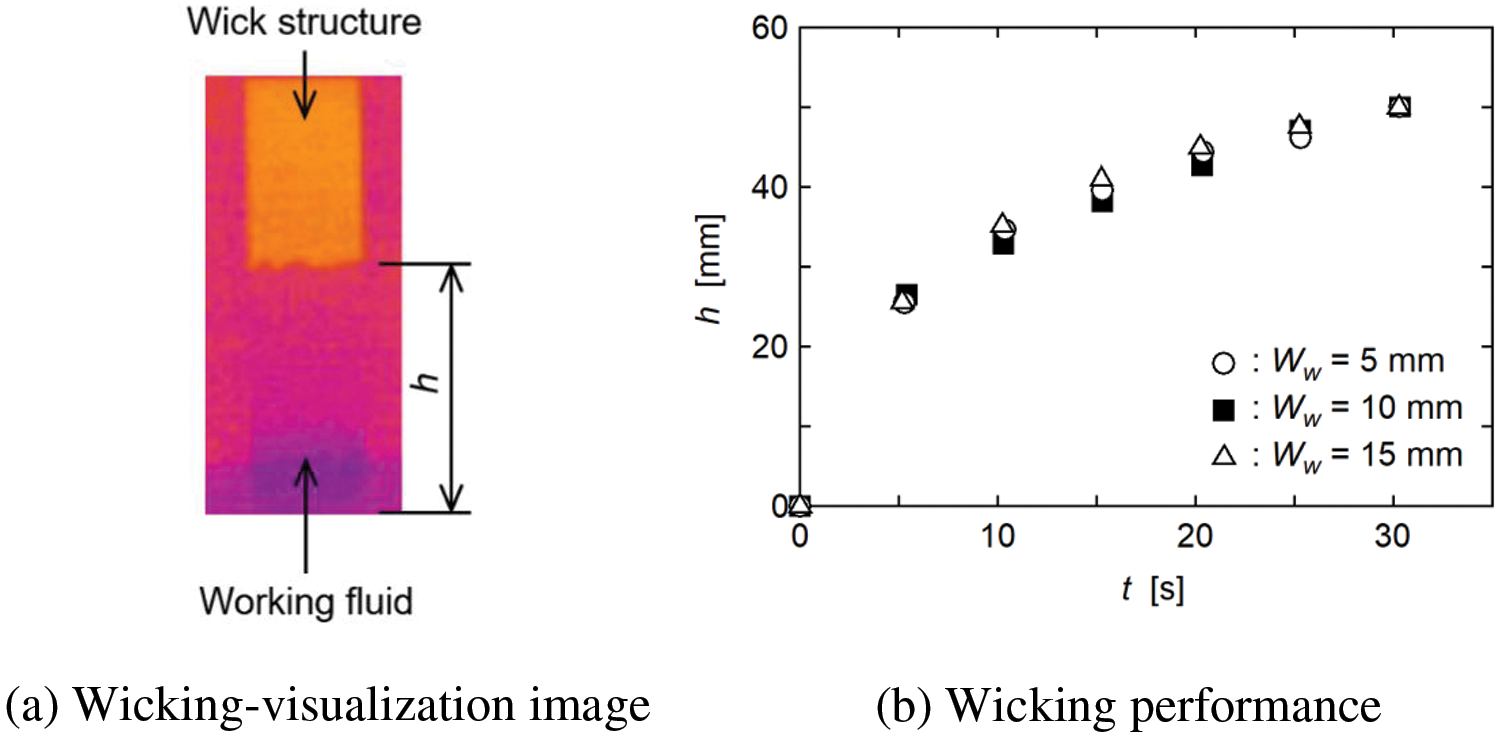
Figure 7: Wicking-visualization image and wicking performance
The experiment was conducted using the experimental apparatus shown in Fig. 2. For Case D, where the wick width was equal to the rod widths, the load sandwiching the wick structure was changed, and Fig. 8 shows the relation between Qe and ΔT when the load was 15, 25, and 45 N. The cross-sectional area of the rods was 10 mm × 10 mm; thus, these loads correspond to 0.15, 0.25, and 0.45 MPa, respectively. Note that the differences between the three experimental results were very small. As discussed in the previous paper [28], the relation between Qe and ΔT can be characterized by three regions, i.e., Region Ⅰ, Region Ⅱ, and Region III. Region Ⅰ is a subcooled region, where Ts was lower than Tsat; thus, ΔT was negative. In Region Ⅱ, due to evaporation, the increment in ΔT with Qe was less than those in the other two regions. Liquid was pumped to the evaporator section effectively. In Region III, a large increase in ΔT was observed due to the capillary limit of the wick structure. The characteristics of the three regions were clearly identified in the three experimental results. Moreover, the very small differences between the experimental results confirmed that the effect of the load on the evaporation heat transfer characteristics of the wick structure was very small when the load was 15–45 N and 0.15–0.45 MPa. The following experiments were conducted by changing the wick layout (Fig. 5) under the condition that the load was 25 N. In Case B, the wick structure was wider; thus, the pressure (0.17 MPa) was less than that of the other three cases (0.25 MPa). However, Fig. 8 confirms that this difference can be neglected when the experimental results for Case B are compared with those for the other three cases.
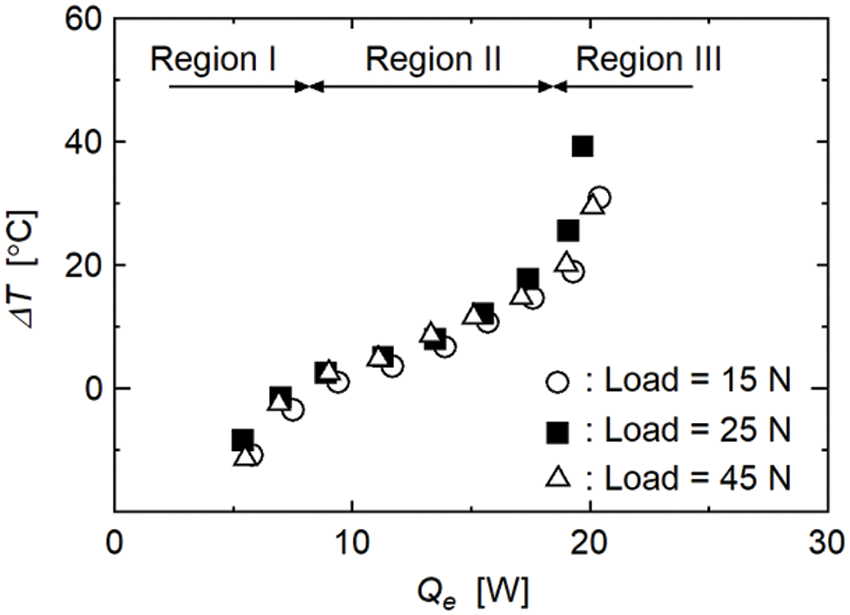
Figure 8: Influence of sandwiching load on evaporation heat transfer characteristics
3.2 Evaporation Heat Transfer Characteristics in Case A
Fig. 9 shows the relationship between Qe and ΔT for Case A. As mentioned earlier, the ΔT value was obtained from the two-dimensional heat transfer calculation in the left rod. For comparison, the ΔT value is also shown in Fig. 9 as Case A′ when a one-dimensional heat flow was assumed in the rod. In this case, the Ts value was obtained by extrapolating the T1, T2, T3, and T4 values linearly to the contact surface, and then ΔT was calculated using Eq. (4). Fig. 10a shows the numerical result of the temperature distribution in the left rod near the cooled section for Case A. Eq. (5) was solved numerically with Eqs. (6)–(8) with L = 20 mm, Wr = 20 mm, Ww = 10 mm, Ql = 18.0 W, and Ts = 121.6°C, which correspond to the conditions at Qe = 14.6 W in Fig. 9. Due to the noncontact surfaces on both sides of the cooled section, the heat flow was constricted in the rod, which caused constriction thermal resistance [29], i.e., an additional temperature drop in the rod. In the one-dimensional calculation, the constriction thermal resistance was neglected; thus, ΔT was greater than that obtained from the two-dimensional calculation. However, the maximum difference in the ΔT value obtained from the one-dimensional and two-dimensional calculations was only 2.3°C, which confirmed that the effect of the constriction thermal resistance was very small in the left rod.
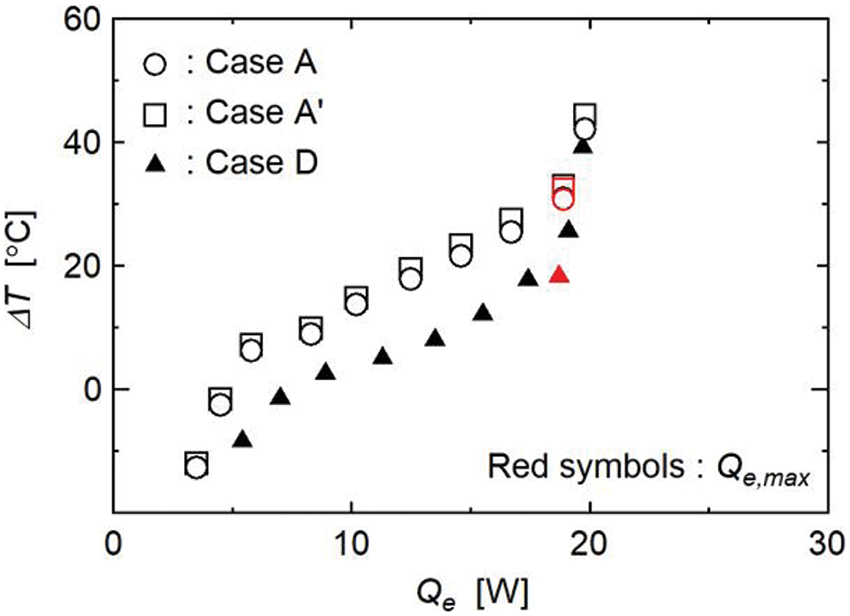
Figure 9: Evaporation heat transfer characteristics in Cases A and D
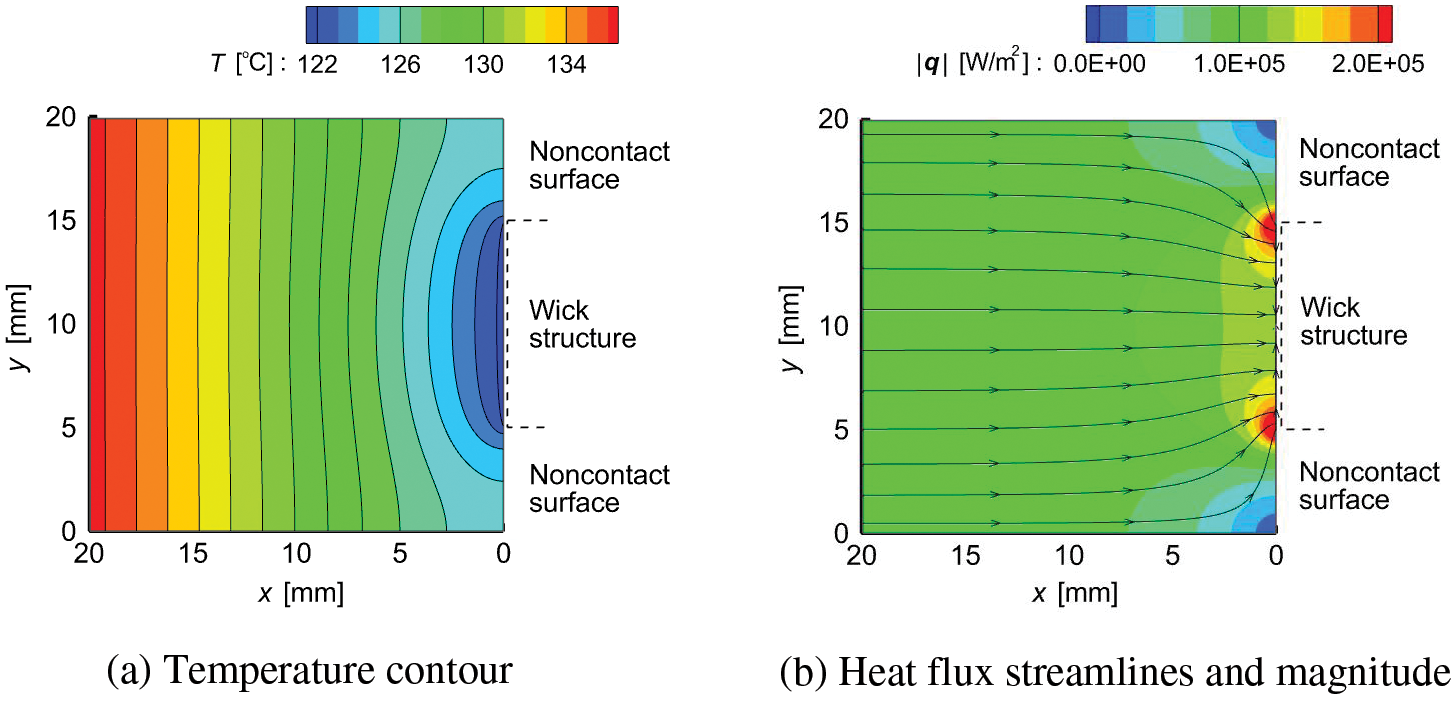
Figure 10: Temperature and heat flux in the left rod (Case A)
The relationship between Qe and ΔT for Case D is also shown in Fig. 9. The size of the wick structure for Case A was the same as that for Case D; however, ΔT for Case A was clearly greater than that of Case D. From the temperature distribution shown in Fig. 10a, the heat flux vector (q) in the left rod was evaluated using Eq. (9).
The heat flux streamlines and magnitude in the rod near the cooled section are shown in Fig. 10b. The constriction of the heat flow also caused the concentrations of heat flux near both ends of the cooled section. Fig. 11 shows the numerical results for the heat flux distribution on the cooled section when the rod width (Wr) was varied. As shown in Fig. 6, the z-axis was set from the lower end of the cooled section, and |qx|, i.e., the magnitudes of qx, at z are shown for Wr = 10, 15, and 20 mm under the conditions of L = 20 mm, Ww = 10 mm, Ql = 18.0 W, and Ts = 121.6°C. Note that Wr = 10 and 20 mm correspond to Cases D and A, respectively. For Wr = 10 mm, due to the lack of noncontact surfaces, the distribution of |qx| was uniform over the entire cooled section. However, when Wr > 10 mm, due to an increase in the noncontact surface area, |qx| at both ends of the cooled section increased while that at the center decreased with increasing Wr. A remarkable increase in |qx| was observed when Wr = 20 mm, which must have caused local dryout in the wick structure. The occurrence of local dryout increases the evaporation thermal resistance; thus, ΔT for Case A was greater than that of Case D.
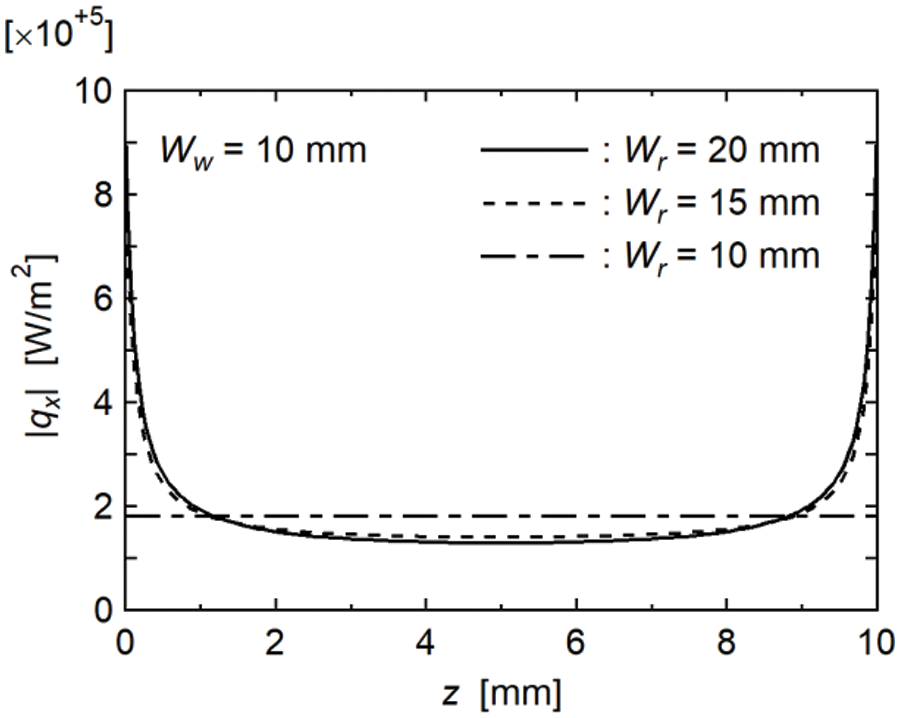
Figure 11: Influence of rod width on heat flux distribution
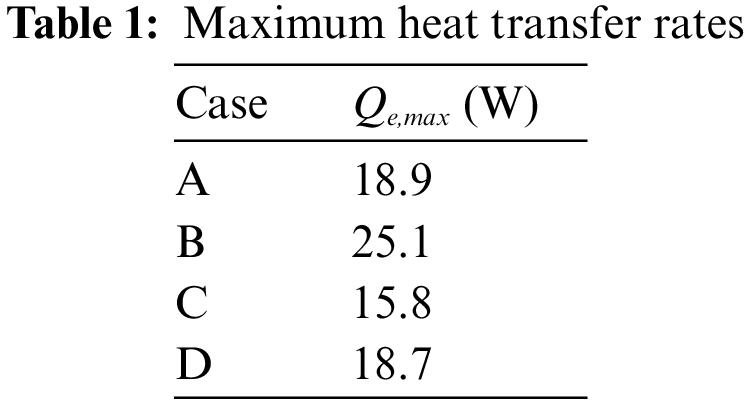
The Qe value at the end of Region Ⅱ was defined as the maximum heat transfer rate (Qe,max). Table 1 shows the Qe,max values for each case, and the values for Cases A and D are shown in Fig. 9 by the red symbols. The same wick structure was used in Cases A and D; thus, although there were differences in the occurrence of local dryout, the Qe,max value, i.e., the amount of heat when the entire evaporation section of the wick structure dried out, was approximately the same for Cases A and D.
3.3 Evaporation Heat Transfer Characteristics in Case B and Case C
Fig. 12 shows the relationships between Qe and ΔT for Cases B and C. The relationship for Case A is also shown for comparison. In addition, the Qe,max values for each case are shown by the red symbols. As can be seen, the ΔT values of Cases B and C were less than that of Case A. Fig. 13 shows the numerical results for the temperature and heat flux contours in the rod near the cooled section for Case B. Here, except for the wick layout, the numerical conditions were the same as those shown in Fig. 10. Although the concentrations of heat flux were observed at both ends of the cooled section, their magnitudes were less than those of Case A (Fig. 10b). Fig. 14 shows the numerical results for the heat flux distribution on the cooled section when Ww was varied. Here, the wick widths differed; thus, the dimensionless Z-axis was defined by Eq. (10), and the magnitudes of qx at Z are shown for Ww = 10, 15, and 20 mm with L = 20 mm, Wr = 20 mm, Ql = 18.0 W, and Ts = 121.6°C. Note that Ww = 10 and 15 mm correspond to Cases A and B, respectively.
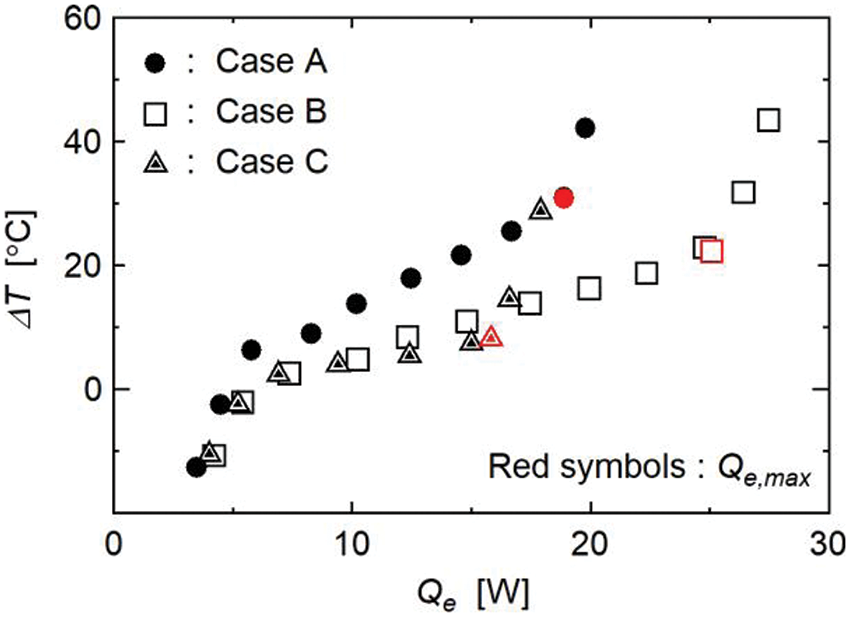
Figure 12: Evaporation heat transfer characteristics in Cases B and C
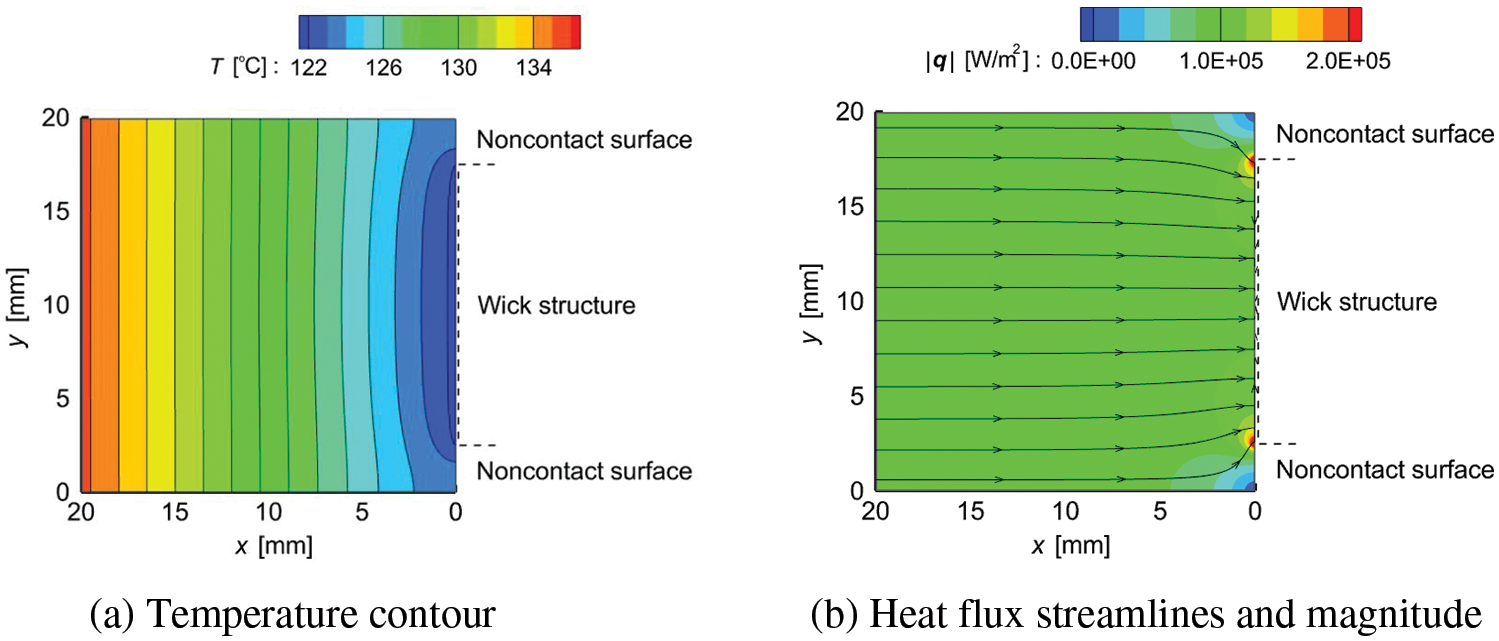
Figure 13: Temperature and heat flux in the left rod (Case B)
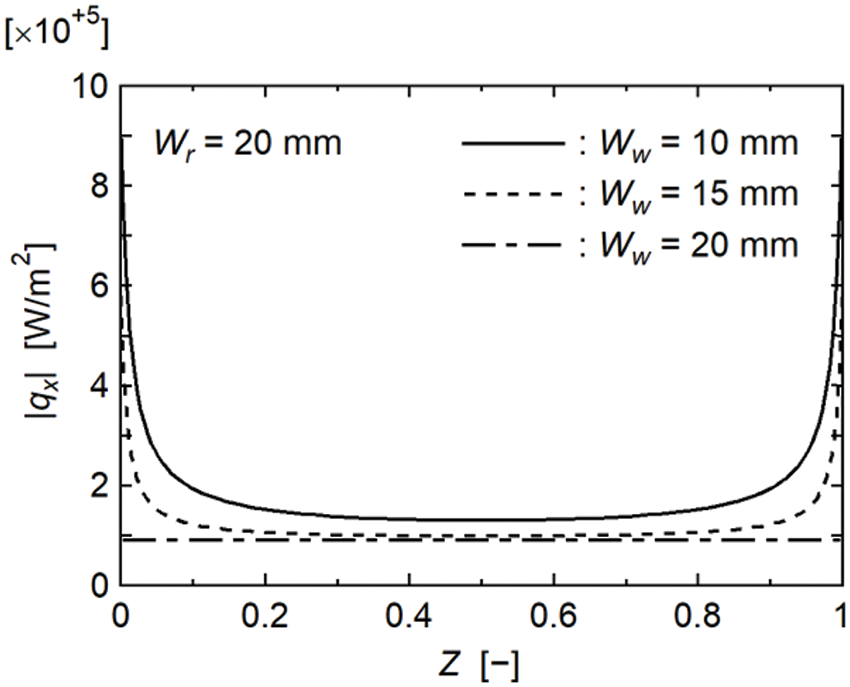
Figure 14: Influence of wick width on heat flux distribution
A remarkable increase in |qx| was observed when Ww = 10 mm; however, the concentrations of heat flux were reduced with increasing Ww. In addition, |qx| decreased with increasing Ww over the entire cooled section. This decrease in |qx| must have reduced the occurrence of local dryout; thus, the ΔT value of Case B was less than that of Case A. Furthermore, the amount of liquid supplied to the evaporator section of the wick structure increased with increasing Ww; thus, Qe,max of Case B was greater than that for Case A. A reduction in the noncontact surface areas by increasing the wick width is effective for decreasing the evaporation thermal resistance and increasing the maximum heat transfer rate. Note that increasing the wick width makes it difficult for vapor bubbles generated inside the wick structure to be released to the outside. Therefore, when increasing the wick width, it is important to design effective paths within the wick structure for releasing vapor bubbles.
The numerical results for the temperature and heat flux contours in the rod near the cooled section for Case C are shown in Fig. 15, and Fig. 16 compares the numerical results of heat flux distributions for Cases A and C. In the calculation for Case C, two cooled sections of the same width were given on the right boundary of the analytical system. Except for these cooled sections, the numerical conditions were the same as those in Fig. 10, and the magnitudes of qx at y are shown in Fig. 16. The total width of the wick structures for Case C was the same as the wick width for Case A; however, the evaporation surface area in the length direction for Case C was twice that of Case A. When Qe was small, the increase in the evaporation surface area enhanced the evaporation heat transfer effectively; thus, the ΔT value for Case C was less than that of Case A. However, when Qe was increased, the concentrations of heat flux became conspicuous, as shown in Figs. 15 and 16. In addition, in Case C, although the maximum |qx| value was reduced compared with Case A, the concentrations of heat flux were still observed, and the number of locations where the concentrations of heat flux occurred doubled. As a result, the dryout of the wick structure was enhanced; thus, Qe,max for Case C was less than that of Case A.
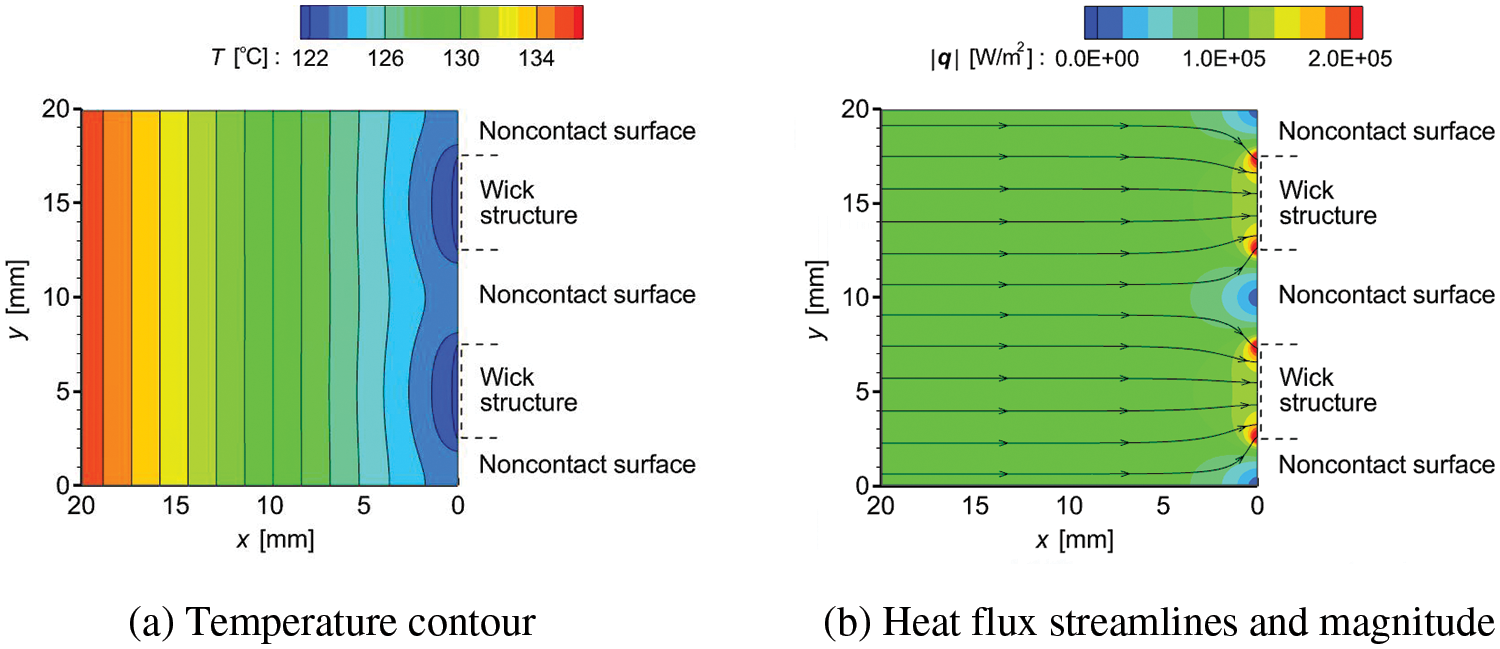
Figure 15: Temperature and heat flux in the left rod (Case C)
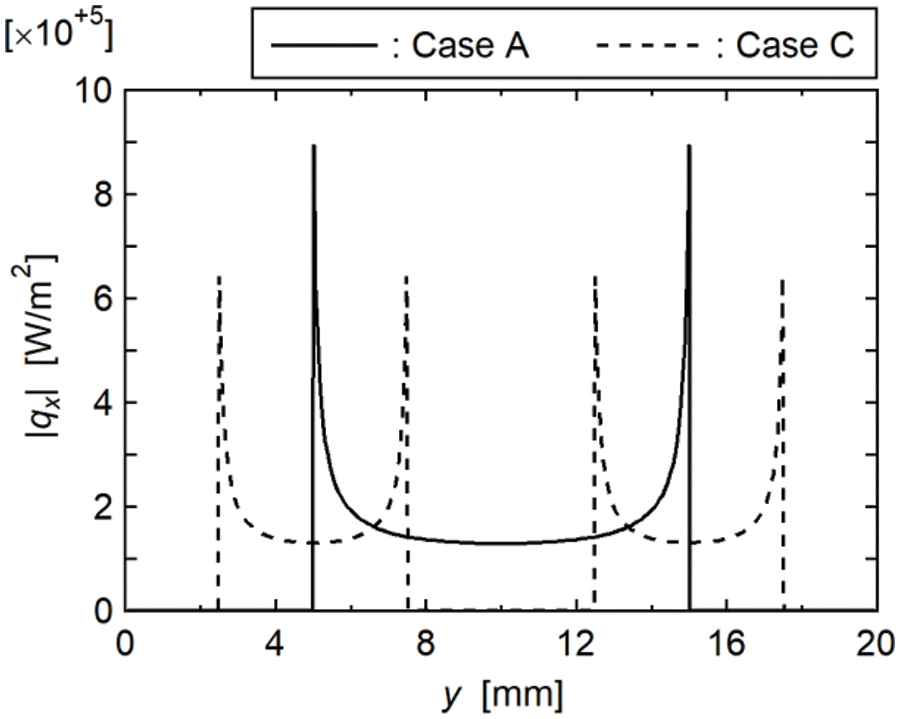
Figure 16: Heat flux distributions in Cases A and C
In this study, experimental and numerical investigations were conducted on the heat transfer characteristics from a rod to a strip-shaped wick structure. Here, the rod width was greater than the wick width; thus, noncontact surfaces were left between the rod and the wick structure. The influence of the noncontact surface area was discussed by varying the rod and wick widths. The heat transfer characteristics were also discussed when the wick structures were placed separately. Note that water was used as the working fluid in this study. The findings of this study are summarized as follows:
• The noncontact surfaces caused the heat flow in the rod to constrict. However, the influence of the noncontact surfaces on the temperature distribution in the rod was very small.
• Due to the noncontact surfaces, the heat flux was concentrated in the rod near both surfaces of the wick structure. The concentrations of heat flux caused the evaporation thermal resistance of the wick structure to increase.
• A reduction in the noncontact surface area by increasing the wick width was effective for decreasing the evaporation thermal resistance and increasing the maximum heat transfer rate of the wick structure.
• The separation of the wick structure increases the evaporation surface area while keeping the noncontact surface area constant. However, the effectiveness of the wick separation was limited to when the heat transfer rate was small.
• The concentrations of heat flux were the main factor that degraded the thermal performance of the wick structures. Therefore, as a future work, it is necessary to develop wick structures that can supply liquid effectively to locations where heat flux is concentrated.
Acknowledgement: The authors thank T. Takayama for his help conducting the experiments.
Funding Statement:: The authors received no specific funding for this study.
Author Contributions: The authors confirm contribution to the paper as follows: study conception and design: Kenta Hashimoto, Guohui Sun, Yasushi Koito; data collection: Kenta Hashimoto, Guohui Sun; analysis and interpretation of results: Kenta Hashimoto, Guohui Sun, Yasushi Koito; draft manuscript preparation: Kenta Hashimoto, Guohui Sun, Yasushi Koito. All authors reviewed the results and approved the final version of the manuscript.
Availability of Data and Materials: The data are available from the corresponding author upon reasonable request.
Conflicts of Interest: The authors declare that they have no conflicts of interest to report regarding the present study.
References
1. Mengjie, S., Chaobin, D., Eiji, H. (2020). Experimental investigation on the heat transfer characteristics of novel rectangle radial microchannel heat exchangers in two-phase flow cooling system for data centers. Journal of Thermal Analysis and Calorimetry, 141(1), 199–211. https://doi.org/10.1007/s10973-019-09090-y [Google Scholar] [CrossRef]
2. Halon, S., Krolicki, Z., Revellin, R., Zajaczkowski, B. (2022). Heat transfer characteristics of flow boiling in a micro channel array with various inlet geometries. International Journal of Heat and Mass Transfer, 187(10), 122549. https://doi.org/10.1016/j.ijheatmasstransfer.2022.122549 [Google Scholar] [CrossRef]
3. Jiang, Z., Song, M., Shen, J., Zhang, L., Zhang, X. et al. (2023). Experimental investigation on the flow boiling of two microchannel heat sinks connected in parallel and series for cooling of multiple heat sources. Micromachines, 14(8), 1580. https://doi.org/10.3390/mi14081580. [Google Scholar] [PubMed] [CrossRef]
4. Bostanci, H., Altalidi, S., Nasrazadani, S. (2018). Two-phase spray cooling with HFC-134a and HFO-1234yf on practical enhanced surfaces. Applied Thermal Engineering, 131(3), 150–158. https://doi.org/10.1016/j.applthermaleng.2017.11.142 [Google Scholar] [CrossRef]
5. Fu, H., Zheng, L., Chen, H., Cheng, W. (2024). Influence of parameters in two-phase spray heat dissipation of electronic components. Journal of Physics: Conference Series 2nd International Conference on Energy and Power Engineering, 2683(1), 012030. https://doi.org/10.1088/1742-6596/2683/1/012030 [Google Scholar] [CrossRef]
6. Ndao, S., Peles, Y., Jensen, M. (2012). Experimental investigation of flow boiling heat transfer of jet impingement on smooth and micro structured surfaces. International Journal of Heat and Mass Transfer, 55(19–20), 5093–5101. https://doi.org/10.1016/j.ijheatmasstransfer.2012.05.009 [Google Scholar] [CrossRef]
7. Joshi, S., Dede, E. (2017). Two-phase jet impingement cooling for high heat flux wide band-gap devices using multi-scale porous surfaces. Applied Thermal Engineering, 110(22), 10–17. https://doi.org/10.1016/j.applthermaleng.2016.08.146 [Google Scholar] [CrossRef]
8. Ma, D., Xia, G., Zong, L., Jia, Y., Tang, Y. et al. (2019). Experimental investigation of flow boiling heat transfer performance in zigzag microchannel heat sink for electronic cooling devices. International Journal of Thermal Sciences, 145(5), 106003. https://doi.org/10.1016/j.ijthermalsci.2019.106003 [Google Scholar] [CrossRef]
9. Hu, Y., Lei, Y., Liu, X., Yang, R. (2022). Heat transfer enhancement of spray cooling by copper micromesh surface. Materials Today Physics, 28(11), 100857. https://doi.org/10.1016/j.mtphys.2022.100857 [Google Scholar] [CrossRef]
10. Cen, M., Deng, S., Hu, C., Luo, J., Tan, S. et al. (2023). Enhanced boiling heat transfer of HFE-7100 on copper foams under overflow conditions. Applied Thermal Engineering, 224(14–15), 120083. https://doi.org/10.1016/j.applthermaleng.2023.120083 [Google Scholar] [CrossRef]
11. Li, Y., Chen, S., He, B., Yan, Y., Li, B. (2016). Effects of vacuuming process parameters on the thermal performance of composite heat pipes. Applied Thermal Engineering, 99, 32–41. https://doi.org/10.1016/j.applthermaleng.2016.01.035 [Google Scholar] [CrossRef]
12. Seo, J., Kim, D., Kim, H., Hassan, Y. (2022). An experimental investigation on the characteristics of heat pipes with annular type composite wick structure. Nuclear Engineering and Design, 390(6), 111701. https://doi.org/10.1016/j.nucengdes.2022.111701 [Google Scholar] [CrossRef]
13. Wang, E., Li, L. (2023). Numerical analysis of high temperature potassium heat pipe under marine condition. International Communications in Heat and Mass Transfer, 147(10), 106978. https://doi.org/10.1016/j.icheatmasstransfer.2023.106978 [Google Scholar] [CrossRef]
14. Huang, D., Jia, L., Wu, H., Aaker, O. (2021). Experimental investigation on the vapor chambers with sintered copper powder wick. Journal of Thermal Science, 30(6), 1938–1950. https://doi.org/10.1007/s11630-020-1366-3 [Google Scholar] [CrossRef]
15. Liu, T., Yan, W., Wu, W., Wang, S. (2021). Thermal performance enhancement of vapor chamber with modified thin screen mesh wick by laser etching. Case Studies in Thermal Engineering, 28(14–15), 101525. https://doi.org/10.1016/j.csite.2021.101525 [Google Scholar] [CrossRef]
16. Liu, C., Chen, Y., Feng, D., Zhang, H., Miao, J. et al. (2022). Experimental study on temperature uniformity and heat transfer performance of nitrogen loop heat pipe with large area and multi-heat source. Applied Thermal Engineering, 210(25–26), 118344. https://doi.org/10.1016/j.applthermaleng.2022.118344 [Google Scholar] [CrossRef]
17. Xia, G., Zhou, T., Zhang, Y., Jiao, G. (2023). Steady-state performance analysis of loop heat pipe radiator in space reactor. Annals of Nuclear Energy, 193(13), 110053. https://doi.org/10.1016/j.anucene.2023.110053 [Google Scholar] [CrossRef]
18. Zamanifard, A., Muneeshwaran, M., Wang, Y., Wang, C. (2023). A novel 3-D pulsating heat pipe module for high heat-flux applications. Applied Thermal Engineering, 228, 120549. https://doi.org/10.1016/j.applthermaleng.2023.120549 [Google Scholar] [CrossRef]
19. Wang, Z., Fan, Y., Zhang, Y., Lai, Z. (2024). Chaotic index analysis of ethanol-based graphene nanofluid pulsating heat pipe. Applied Thermal Engineering, 236(4), 121870. https://doi.org/10.1016/j.applthermaleng.2023.121870 [Google Scholar] [CrossRef]
20. Wang, H., Bao, Y., Liu, M., Zhu, S., Du, X. et al. (2022). Experimental study on dynamic characteristics of cylindrical horizontal axially rotating heat pipe. Applied Thermal Engineering, 209(3), 118248. https://doi.org/10.1016/j.applthermaleng.2022.118248 [Google Scholar] [CrossRef]
21. Luo, F., Ma, C., Liu, J., Zhang, L., Wang, S. (2023). Theoretical and experimental study on rotating heat pipe towards thermal error control of motorized spindle. International Journal of Thermal Sciences, 185(5–8), 108095. https://doi.org/10.1016/j.ijthermalsci.2022.108095 [Google Scholar] [CrossRef]
22. Ahamed, M., Saito, Y., Mashiko, K., Mochizuki, M. (2017). Characterization of a high performance ultra-thin heat pipe cooling module for mobile hand held electronic devices. Heat and Mass Transfer, 53(11), 3241–3247. https://doi.org/10.1007/s00231-017-2022-7 [Google Scholar] [CrossRef]
23. Yang, K., Tu, C., Zhang, W., Yeh, C., Wang, C. (2017). A novel oxidized composite braided wires wick structure applicable for ultra-thin flattened heat pipes. International Communications in Heat and Mass Transfer, 88(2), 84–90. https://doi.org/10.1016/j.icheatmasstransfer.2017.08.014 [Google Scholar] [CrossRef]
24. Tang, H., Xie, Y., Tang, Y., Wu, X., Wu, C. et al. (2022). Stress analysis and thermal performance of ultra-thin heat pipes for compact electronics. International Communications in Heat and Mass Transfer, 139, 106484. https://doi.org/10.1016/j.icheatmasstransfer.2022.106484 [Google Scholar] [CrossRef]
25. Lv, L., Li, J. (2017). Managing high heat flux up to 500 W/cm2 through an ultra-thin flat heat pipe with superhydrophilic wick. Applied Thermal Engineering, 122, 593–600. https://doi.org/10.1016/j.applthermaleng.2017.05.050 [Google Scholar] [CrossRef]
26. Cui, Z., Jia, L., Wang, Z., Dang, C., Yin, L. (2022). Thermal performance of an ultra-thin flat heat pipe with striped super-hydrophilic wick structure. Applied Thermal Engineering, 208(11), 118249. https://doi.org/10.1016/j.applthermaleng.2022.118249 [Google Scholar] [CrossRef]
27. Wang, M., Yang, Y., Sun, Y., Li, J., Hao, M. (2023). Experimental study on the thermal performance of ultra-thin flat heat pipes with novel multiscale striped composite wick structures. Heliyon, 9(10), e20840. https://doi.org/10.1016/j.heliyon.2023.e20840. [Google Scholar] [PubMed] [CrossRef]
28. Koito, Y., Hitotsuya, S., Takayama, T., Hashimoto, K. (2023). Evaporation heat transfer characteristics from a sintered powder wick structure sandwiched between two solid walls. Frontiers in Heat and Mass Transfer, 21(1), 33–46. https://doi.org/10.32604/fhmt.2023.041829. [Google Scholar] [CrossRef]
29. Lee, S., Song, S., Au, V., Moran, K. (1995). Constriction/spreading resistance model for electronics packaging. Proceedings of the 4th ASME/JSME Thermal Engineering Joint Conference, no. 4, pp. 199–206. Hawaii, USA. [Google Scholar]
30. Yuan, X., Yan, C., Huang, Y., Tang, Y., Zhang, S. et al. (2024). Fabrication and capillary performance of multi-scale microgroove ceramic wicks via nanosecond laser irradiation for ultrathin ceramic heat pipes. Applied Thermal Engineering, 236, 121927. https://doi.org/10.1016/j.applthermaleng.2023.121927 [Google Scholar] [CrossRef]
31. Zhou, Z., Wu, B., Xu, J., Lu, J., Cheng, T. et al. (2024). Novel for the resistance welding of laminated wire mesh microgroove composite wicks with enhanced capillary performance. Thermal Science and Engineering Progress, 48, 102386. https://doi.org/10.1016/j.tsep.2024.102386 [Google Scholar] [CrossRef]
32. Wu, C., Tang, Y., Zhu, L., Sun, Y., Zhang, S. et al. (2024). Enhanced capillary performance of nanostructures copper woven mesh wick for ultrathin heat pipes. Applied Thermal Engineering, 242, 122476. https://doi.org/10.1016/j.applthermaleng.2024.122476 [Google Scholar] [CrossRef]
33. DuPont Styro Corporation (2023). Catalog of StyrofoamTM. https://www.dupontstyro.co.jp/images/catalog/styrofoam_sougou.pdf (accessed on 22/05/2024). [Google Scholar]
34. Patankar, S. (1980). Numerical Heat Transfer and Fluid Flow, 1st edition. USA: CRC Press. [Google Scholar]
35. Tang, Y., Deng, D., Lu, L., Pan, M., Wang, Q. (2010). Experimental investigation on capillary force of composite wick structure by IR thermal imaging camera. Experimental Thermal and Fluid Science, 34(2), 190–196. https://doi.org/10.1016/j.expthermflusci.2009.10.016 [Google Scholar] [CrossRef]
Appendix A. Number of Grid Points and Results of Grid Independence Test
The numerical results shown in Fig. 10 were obtained with 121 × 185 (x × y) grid points because the difference in the numerical results between this grid points and much finer 241 × 369 grid points was less than 0.06°C. This grid points were also employed for other numerical analyses except for Fig. 11, where the rod width (Wr) was varied. Since the analytical system became smaller with decreasing Wr, the grid points were reduced according to the decrease in Wr.
Cite This Article
 Copyright © 2024 The Author(s). Published by Tech Science Press.
This work is licensed under a Creative Commons Attribution 4.0 International License , which permits unrestricted use, distribution, and reproduction in any medium, provided the original work is properly cited.
 Downloads
 Citation Tools