
 Submit a Paper
 Propose a Special lssue
 Open Access
ARTICLE

Study on the Influence of Setting Parameters of Tunnel Centralized Smoke Extraction System on Fire Smoke Flow and Temperature Decay
School of Civil Engineering, Central South University, Changsha, 410075, China
* Corresponding Author: Zhisheng Xu. Email:
(This article belongs to the Special Issue: Heat and Mass Transfer in Fire)
Frontiers in Heat and Mass Transfer 2024, 22(3), 791-816. https://doi.org/10.32604/fhmt.2024.051058
Received 26 February 2024; Accepted 28 April 2024; Issue published 11 July 2024
 View Full Text
 Download PDF
Abstract
The centralized smoke exhaust system of shield tunnel is an important determinant for tunnel fire safety, and the use of different design parameters of the tunnel smoke exhaust system will affect the smoke exhaust effect in the tunnel, and the influence of different design parameters on the smoke exhaust effect and temperature attenuation of the tunnel can help engineers in designing a more effective centralized smoke exhaust system for the tunnel. In this paper, the Fire Dynamic Simulator (FDS) is utilized to examine smoke exhaust vent settings for a centralized exhaust system in shield tunnel with both flat and sloped conditions, including slopes of +4.5% and −4.5%, under a 30 MW fire power with a 150 m/s smoke exhaust rate. The results suggest that maintaining a vent spacing of 60 m and a vent size of 4.0 m × 1.5 m is a reasonable configuration for centralized smoke exhaust systems in both flat and slope shield tunnels. This choice helps minimize construction costs and prevent excessive smoke accumulation. It also promotes favorable conditions for maintaining temperature distribution at 2-m height, visibility, smoke spread distance, and temperature below the ceiling, all below the threshold values, while ensuring high smoke extraction efficiency. However, in the slope section, the chimney effect can disrupt exhaust efficiency, visibility, ceiling temperature, and temperature distribution at a height of 2 m. Employing different opening methods, such as having 2 vents up and 4 vents down in a +4.5% slope and 4 vents up and 2 vents down in a −4.5% slope, can help mitigate these effects. Furthermore, the temperature decay formula for shield tunnels follows a bi-exponential decay pattern, and different design parameters of centralized smoke exhaust systems have minimal effects on temperature decay in shield tunnels.Keywords
Nomenclature
| Characteristic length, m | |
| Mesh grid size, m | |
| Specific heat capacity of air, kJ/(kg·K) | |
| Gravitational acceleration constant, m/s2 | |
| Fire heat release rate, kW | |
| Plume mass flow rate, kg/s | |
| Height from the burning surface to the bottom of the smoke layer, m | |
| Convective Heat Release Rate, kW | |
| Limiting elevation, m | |
| Average temperature of the flue gas, K | |
| Gas density at ambient temperature, kg/m3 | |
| Ambient temperature, K | |
| Smoke production rate of fire, m/s | |
| Represents the exhaust efficiency | |
| Stands for the CO2 mass flux, kg/s | |
| Enteriment velocity, m/s | |
| Smoke flow section area, m2 | |
| Wet perimeter of the smoke flow, m | |
| Total net heat transfer coefficient on the tunnel walls, kW/(m2·K) | |
| Velocity of smoke, m/s | |
| Velocity of air, m/s | |
| Tunnel height, m | |
| Change in temperature downstream of the tunnel, K | |
| Change in maxmium temperature downstream of the tunnel, K |
Tunnel fires can be very dangerous and cause harm to people and property. Fires usually result in the significant accumulation of hot smoke in the tunnel because of the confined space and insufficient exits. It is extremely hazardous for drivers and rescue teams due to the rising temperature, the reduced visibility and high content of carbon monoxide (CO) [1].
For example, in the Mont Blanc tunnel, Tauern tunnel, and Gotthard road tunnel, these fires led to 39, 12, and 11 deaths, respectively [2,3]. Based on investigations, tunnel fires often lead to injuries mainly due to the large amounts of poisonous smoke created by fires that do not burn completely and the reduced visibility caused by this smoke [4,5], and thus research into the smoke control in tunnel fire has increased in recent years. Currently, tunnel fire safety measures worldwide are in line with modern advancements. Scientists from both domestic and international backgrounds have conducted thorough research on implementing effective heat control and smoke prevention measures in tunnels [6,7].
Fire smoke control systems have two main functions, where they must ensure safe evacuation and provide a safe route to the fire source for rescuers. These systems mainly comprise a longitudinal extraction system and transverse extraction system [8]. A transverse extraction system, the smoke moves across the tunnel, perpendicular to its length. This allows the smoke to be quickly removed, preventing it from spreading lengthwise or disrupting its natural layering. However, setting up a transverse extraction system can be both complex and costly [7]. Although longitudinal ventilation is effective in certain situations, particularly in one-way tunnels with low traffic. However, when used to clear smoke, it can lead to a buildup of smoke at the tunnel’s rear, creating a highly polluted and unsafe area for human evacuation, rescue efforts, and firefighting [9,10]. The common utilization of centralized smoke exhaust systems installed in the tunnel ceilings in road tunnels across the globe [11,12]. Due to the rapid growth of tunnel construction, shield tunnels typically include smoke extraction ducts to address the issue of fire smoke removal [11,12]. Ceiling smoke exhaust systems are highly effective in containing and removing smoke. They offer control in both directions, ensuring efficient smoke management [13]. In this study, the centralized exhaust system is applied in the tunnel in case of fire as shown in Fig. 1.

Figure 1: Centralized ceiling smoke exhaust system in road tunnel
Over the past few decades, research on the design of smoke exhaust systems in tunnel fires has been extensively documented [14,15]. While field experiments in tunnels provide valuable insights into the effects of different smoke designs, they entail high complexity and economic costs. As a result, much of the research in this field relies on numerical simulation. For instance, scholars have thoroughly investigated the impacts of ventilation conditions [16,17] and the configuration of exhaust vents (including their location, size, and quantity) [18,19] on temperature, smoke distribution, and visibility. A series of publications [13,20] have delved into the evaluation of ventilation efficiency through a combination of simulation and experiments. Oucherfi et al. [21] evaluated the effectiveness of a transversal ventilation system via simulation, with a particular focus on highlighting the significance of the ventilation rate as the predominant parameter. Concurrently, Chaabat et al. [13] investigated the containment of smoke flow between neighboring exhaust vents in their experimental study, systematically measuring the influence of both damper shape and position. Mechanical ventilation is a prevalent method in tunnel fires and forms a crucial component of smoke control design. The layout of vents, encompassing both exhaust vents and air supply vents, profoundly influences smoke exhaust efficiency. This efficiency serves as a pivotal indicator of the overall effectiveness of smoke control strategies in tunnel fire scenarios. Yan et al. [1] studied the fire characteristics and smoke control in tunnel centralized smoke exhaust mode under different horizontal fire source locations, smoke outlet sizes and smoke exhaust volumes. When a fire occurs in a inclined tunnel, most of the smoke spreads in the uphill direction, and the difficulty of controlling the smoke in the tunnel is greatly increased [13,22]. In 2014, Lin et al. [23] took MTFVTP data as a reference to verify the applicability of the CFD program and VHS combustion model adopted in tunnel fires with semi-horizontal smoke protection system, and found that slope had a significant impact on the semi-horizontal smoke exhaust performance of rectangular tunnels, with slope from 0 to slightly a small increase to 1% will disrupt the symmetrical pattern of the air flow.
Although a number of studies have been carried out on centralized exhaust systems in tunnel fires over the past few decades, the use of different design parameters of the tunnel smoke exhaust system will affect the smoke exhaust effect in the tunnel. The influence of different design parameters on the smoke exhaust effect, especially for those equipped with complex exhaust systems, remains to be fully explored. At the same time, there is a lack of investigation regarding the modes of exhaust systems that would contribute to enhancing users’ safety, reducing damage, and facilitating control efforts during a fire emergency.
This paper extends its investigation to the Nanjing project, which entails a three-lane shield tunnel situated beneath the Yangtze River. The primary objective of this study is to analyze temperature, visibility, smoke spread, smoke exhaust efficiency and temperature attenuation within the tunnel. To achieve this, numerical analysis is employed to evaluate the performance of the centralized exhaust system, with a specific focus on key variables such as the spacing of smoke exhaust dampers, the opening area, and the number of dampers opening groups under slopes ranging from −4.5% to +4.5%. The study aims to ascertain the influence of these parameters on the system’s operational efficiency, particularly in terms of visibility, temperature, and smoke spread, following the guidelines outlined in the SFPE Fire Engineering Handbook [24].
In order to conduct a numerical simulation analysis, the researcher makes use of the Fire Dynamic Simulator (FDS), a simulation tool created by the National Institute of Standards and Technology (NIST) in the USA. It is a numerical simulation program for computational fluid mechanics built on computer, fluid mechanics, and other interdisciplinary technologies. It may be used to analyze smoke spreading and flow characteristics under fire circumstances, as well as to mimic changes in the temperature field and flow field [25,26]. FDS uses large eddy simulation to solve the Reynolds stress equation [27].
A complex model was created using FDS 6.7.5 software, featuring a length of 600 m as shown in Fig. 2. The model adhered to engineering specifications, including a 4.5-m building height limit and a lane width of 10.75 m (comprising three lanes of 3.5 m each, with an additional 3.75 m). The shield tunnel consists of three lanes and has an inner diameter of 13.3 m, an outer diameter of 14.5 m, and a segment structure thickness of 0.6 m, as depicted in Fig. 3. The total tunnel air area is 79.50 square meters, equivalent to 9.87-m diameter. Additionally, a 600-m-long duct, measuring 8.7 m in width and 1.5 m in height, was utilized.

Figure 2: FDS 3D model of shield tunnel

Figure 3: Shield tunnel cross-section layout plan
2.2 Analysis of Mesh Independence
In FDS software, the accuracy of the computation output is directly impacted by the mesh size. The
where the fire heat release rate (kW), Fire characteristic diameter (m), ambient temperature (293 K), ambient air density
When the fire source heat release rate is 30 MW, the fire characteristic diameter D* is approximately 3.75 m, and a proposed mesh size range of 0.937–0.234 m is established. Four mesh sizes were selected for comparison: 0.2 m × 0.5 m × 0.5 m, 0.25 m × 0.5 m × 0.5 m, 0.4 m × 0.5 m × 0.5 m, and 0.5 m × 0.5 m × 0.5 m. These sizes aimed to evaluate temperature changes at a distance of 30 m downstream from the fire source to determine the appropriate mesh size, as illustrated in Fig. 4. Fig. 4 demonstrates a stepped temperature distribution in the grid independence verification, with minimal variation in the vertical temperature curve, indicating uniformity among grid temperatures.

Figure 4: Vertical temperature distribution with different grid sizes at 30 m distance from center of fire source
To ensure compliance with the integer multiple relationship between vent length, width, and mesh size, and to meet the simulation accuracy requirements, a grid size of 0.25 × 0.5 × 0.5 was selected near the fire source on both sides, while a grid size of 0.5 × 0.5 × 0.5 was chosen further away. Through the grid independence verification, it was found that both grid sizes produced favorable simulation effects, optimizing computational resources while maintaining accuracy. A finer mesh resolution of 0.25 × 0.5 × 0.5 is necessary near the fire source to accurately capture the intense energy release from the fire source and provide detailed thermal information, extending 50 m on either side of the fire to account for its effects. Conversely, larger grid sizes of 0.5 × 0.5 × 0.5 are suitable for areas farther from the fire source, where high-resolution mesh is less critical. This approach ensures computational efficiency without compromising simulation accuracy. The number of mesh cells in the model, 774,000, determines the total number of mesh sizes, and heptane is employed as the fuel source for simulation.
2.3 Accuracy Verification of Numerical Simulation
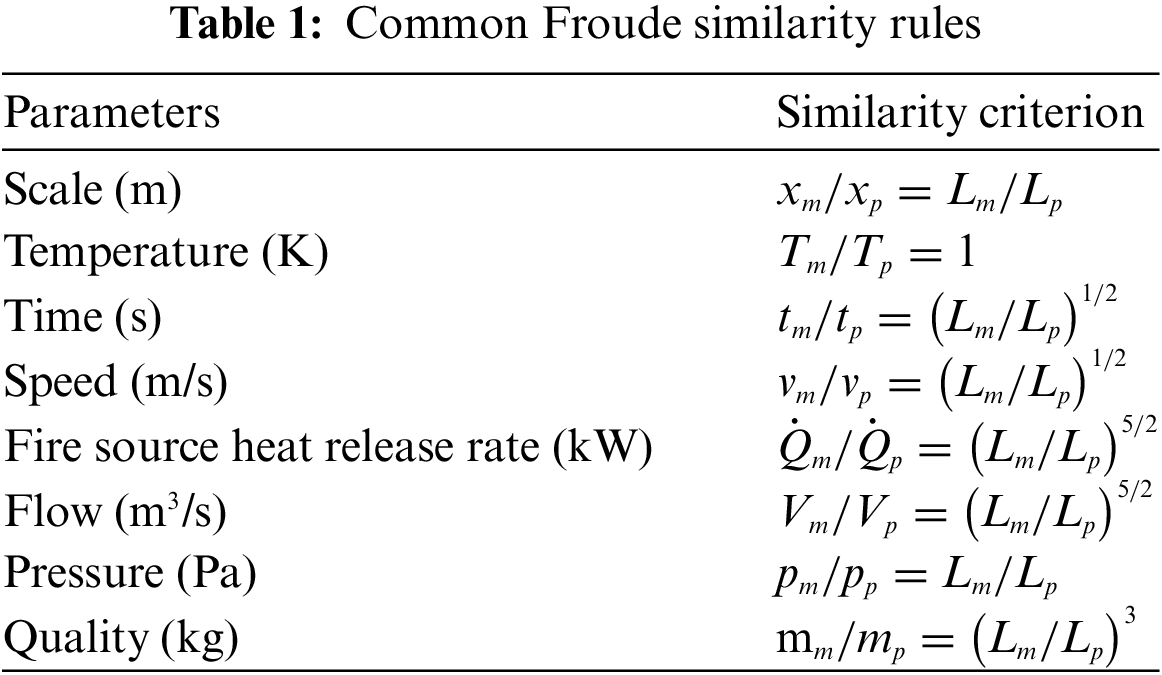
This paper investigates the phenomenon of thermally driven flow in fires. A closely related simulation method is the Froude similarity simulation, which is particularly applicable to thermally driven flow problems, especially in fire scenarios. Thus, this study adopts the Froude simulation criterion as its foundation. Referring to the common Froude similarity rule shown in Table 1.
The model ratio was ultimately chosen as 1:20 based on the froude similarity, resulting the tunnel model length of 20 m. The model built up is shown in Fig. 5. The dimensions of the actual model and test are shown in Fig. 6. Moreover, Figs. 7 and 8 depict the sectional side view and frontal view, respectively, of the test model. In the model test, ethanol was chosen as the fuel. The fuel plate, along with weighing measuring device and oil pan corresponding to a 30 MW fire, measures 20 cm × 20 cm, as shown in Fig. 9.

Figure 5: Demonstration of test platform for the unified tunnel model

Figure 6: Simplified profile (a) actual model (b) test model

Figure 7: Section side view of the test model

Figure 8: Frontal view of the test model segment

Figure 9: (a) Fuel plate along with weighing measuring device (b) 30 MW oil pan diagram
Fig. 10 illustrates the placement of 39 temperature measuring points under the vault and under the flue plate. Additionally, centrifugal fan models of the ZCF-2.5A type (manufactured by Zhaoqing Zhaofeng Electromechanical Co., Ltd., China) are installed to the left side of the tunnel, providing a flow range of 1483 to 2296 m³/h. In the tunnel, a series of longitudinal temperature detection points are set at a height of 50 mm under the roof and 20 mm under the flue, with an equal spacing of 0.5 m, using ordinary K-type thermocouples as shown in Fig. 11.

Figure 10: Schematic diagram of temperature measurement points in the model tunnel

Figure 11: Schematic diagram of temperature collection point in cross-section of shield tunnel
As observed in Fig. 12, both experimental and numerical simulation results exhibit a consistent pattern, indicating elevated temperatures near the center of the fire source with a significant temperature gradient, while temperatures decrease gradually away from the source with a smaller gradient. Moreover, the error falls within an acceptable range. These findings validate the reliability of the numerical simulation through experimental validation.

Figure 12: Comparison of the longitudinal temperature distribution test results with the simulation results
According to China’s national regulations (Guidelines for Design of Ventilation of Highway Tunnel, JTG/TD70/2-02-2014), simulating a bus fire is required for ventilation design. Following these guidelines, a heat release rate of 30 MW is chosen, as specified by the Chinese code. Therefore, the fire source settings align with these regulations, using a power of 30 MW as shown in Table 2. The top surface of the fire source is defined as a ‘Burner.’ The fire source is represented as a rapid ‘t2’ fire with an area of 50 m² and a heat release rate of 600.0 kW/m² per unit area. The fire source measures 0.5 m in height and is positioned at the midpoint of the tunnel, both longitudinally and horizontally. Table 2 lists the detailed parameter settings for the numerical simulations used in this study. The external boundaries of the entire computational domain are designated as ‘Open,’ enabling the transfer of heat and mass with the environment.
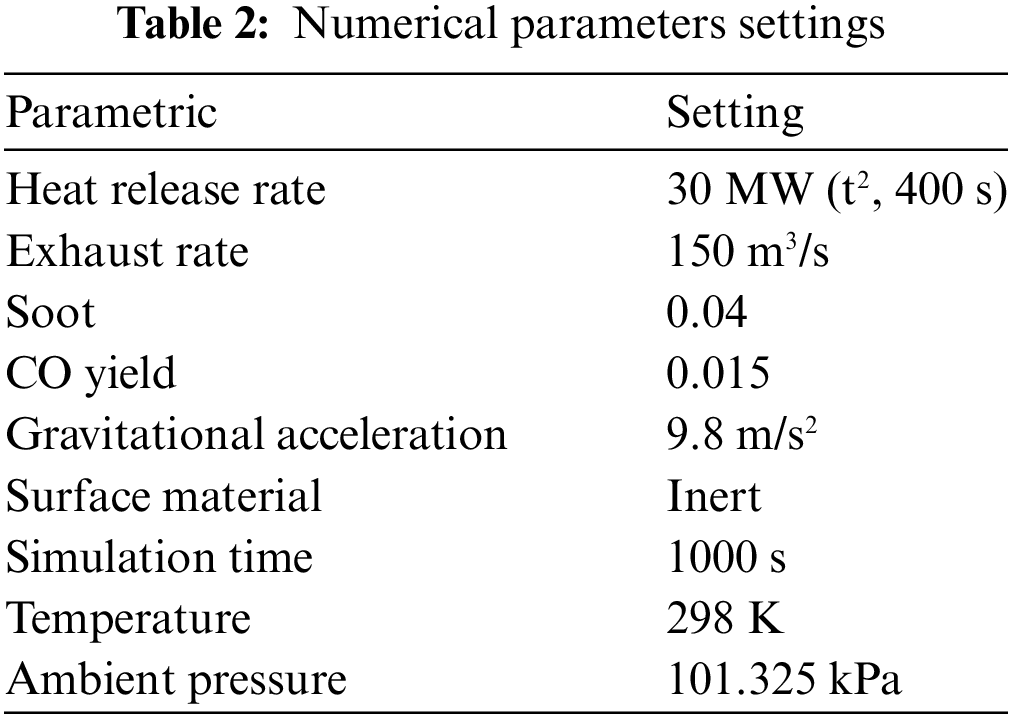
Fig. 13 illustrates different measurement points of temperature, visibility. To evaluate temperature, visibility at a 2-m height, and ceiling temperature, longitudinal devices were strategically placed. Starting from the center of the fire source, these devices were positioned at 2.5-m intervals and extended up to 15 m. Beyond this point, the intervals were extended to 5 m up to 25 m, maintaining a 10-m gap between devices on both sides of the tunnel. Assessing smoke temperature beneath the tunnel’s ceiling involved placing temperature sensors 0.75 m below the roof, with the sensors extending up to 25 m and spacing of up to 5 m on both sides from the center of the tunnel. Beyond this point, the spacing extended to 10 m, both ends of the tunnels. For the examination of smoke extraction efficiency, mass flux devices with the criteria MASSFLUX X SPEC_ID = ‘CARBONDIOXIDE’ were incorporated. These devices were situated 6.5 m in the X-direction from the center of the fire source on both sides. Vent smoke extraction was considered in the Z-direction. In the FDS software’s input file, the parameter MASSFLUXXSPEC_ID = ‘CARBONDIOXIDE’ (representing carbon dioxide levels) was introduced at the tunnel cross-sections and smoke exhaust cross-sections. This parameter facilitated the extraction of the total mass flow rate of CO2 generated by the fire source and the mass flow rate of CO2 discharged at different times from each smoke outlet, playing a crucial role in calculating smoke exhaust efficiency. This comprehensive setup ensures safety and facilitates efficient smoke extraction.

Figure 13: Schematic diagram of the tunnel model and measurement points arrangement
To customize the scenarios, several adjustments were made. These modifications included changes in the exhaust vent area, spacing between the vents, and alterations in the tunnel slopes, all of which are summarized in Table 3. Furthermore, various vent configurations with different opening schemes, such as 3 up and 3 down, 4 up and 2 down, and 2 up and 4 down, were explored, as shown in Fig. 14. Specifically, the arrangement of 2 vents positioned upwards and 4 vents positioned downwards was employed on the slope with a gradient of +4.5%, as smoke tends to spread against gravity. The 4 vents placed downwards facilitate improved smoke extraction capacity, as shown in Fig. 14b. Conversely, the arrangement of 2 vents positioned downwards and 4 vents positioned upwards was utilized on the slope with a gradient of −4.5%. Since smoke naturally ascends against gravity due to its lighter weight, 4 vents placed upwards enhance the extraction capacity of the vents, as illustrated in Fig. 14c.
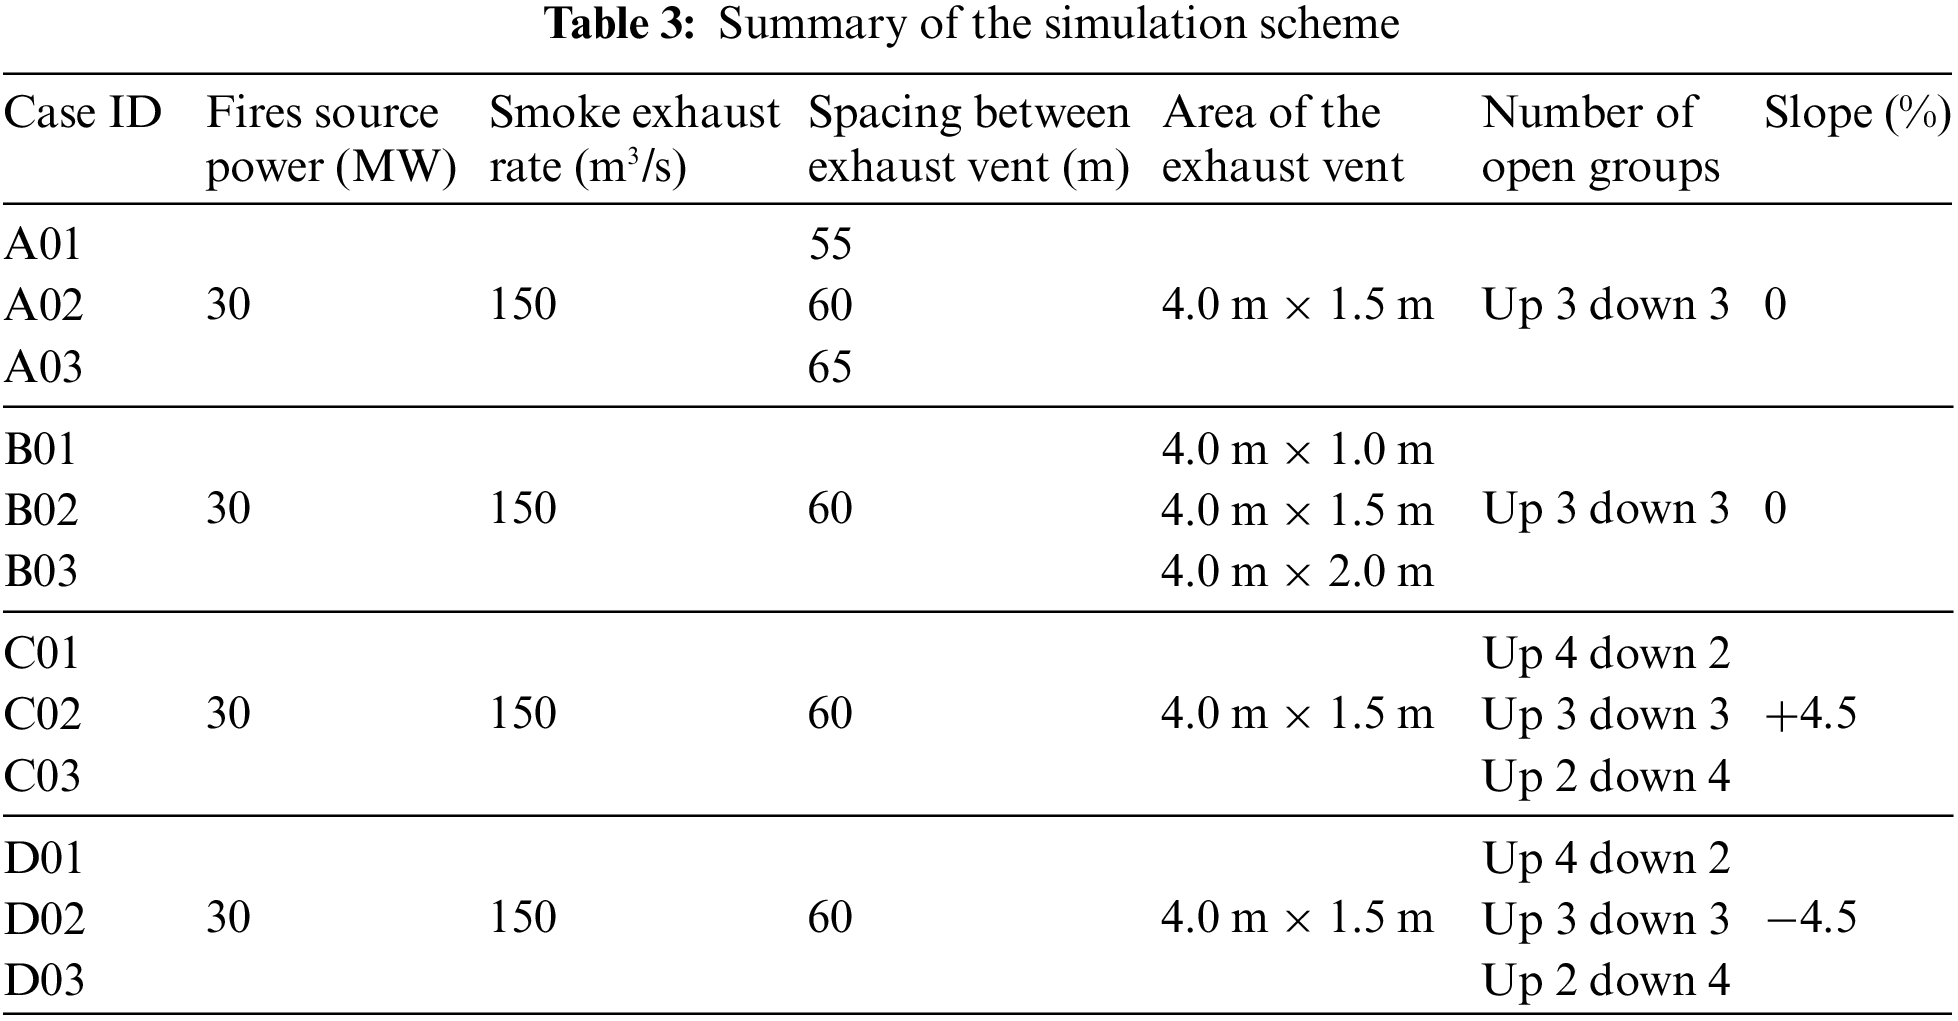
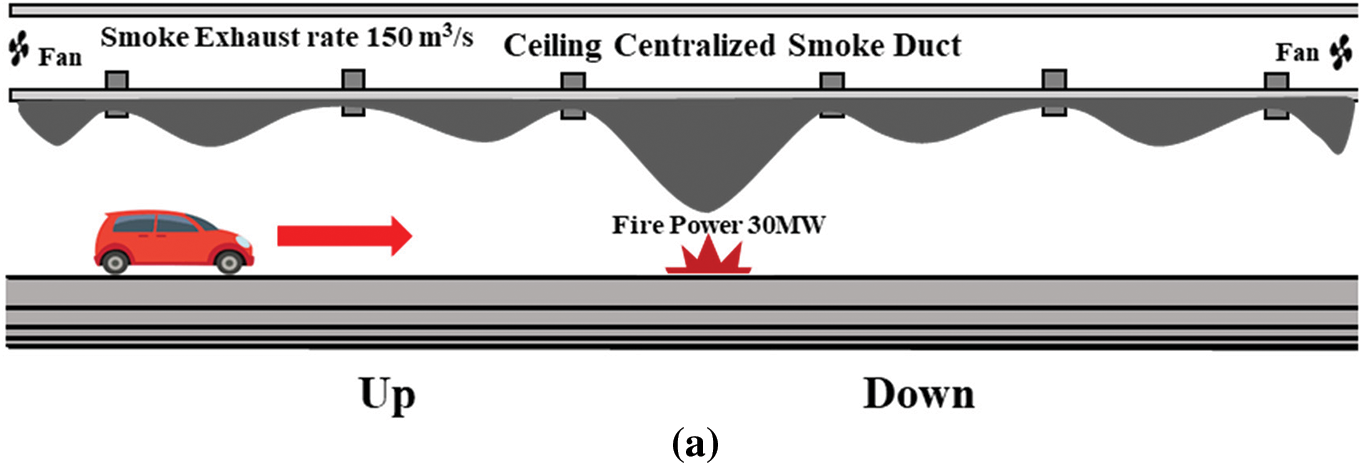
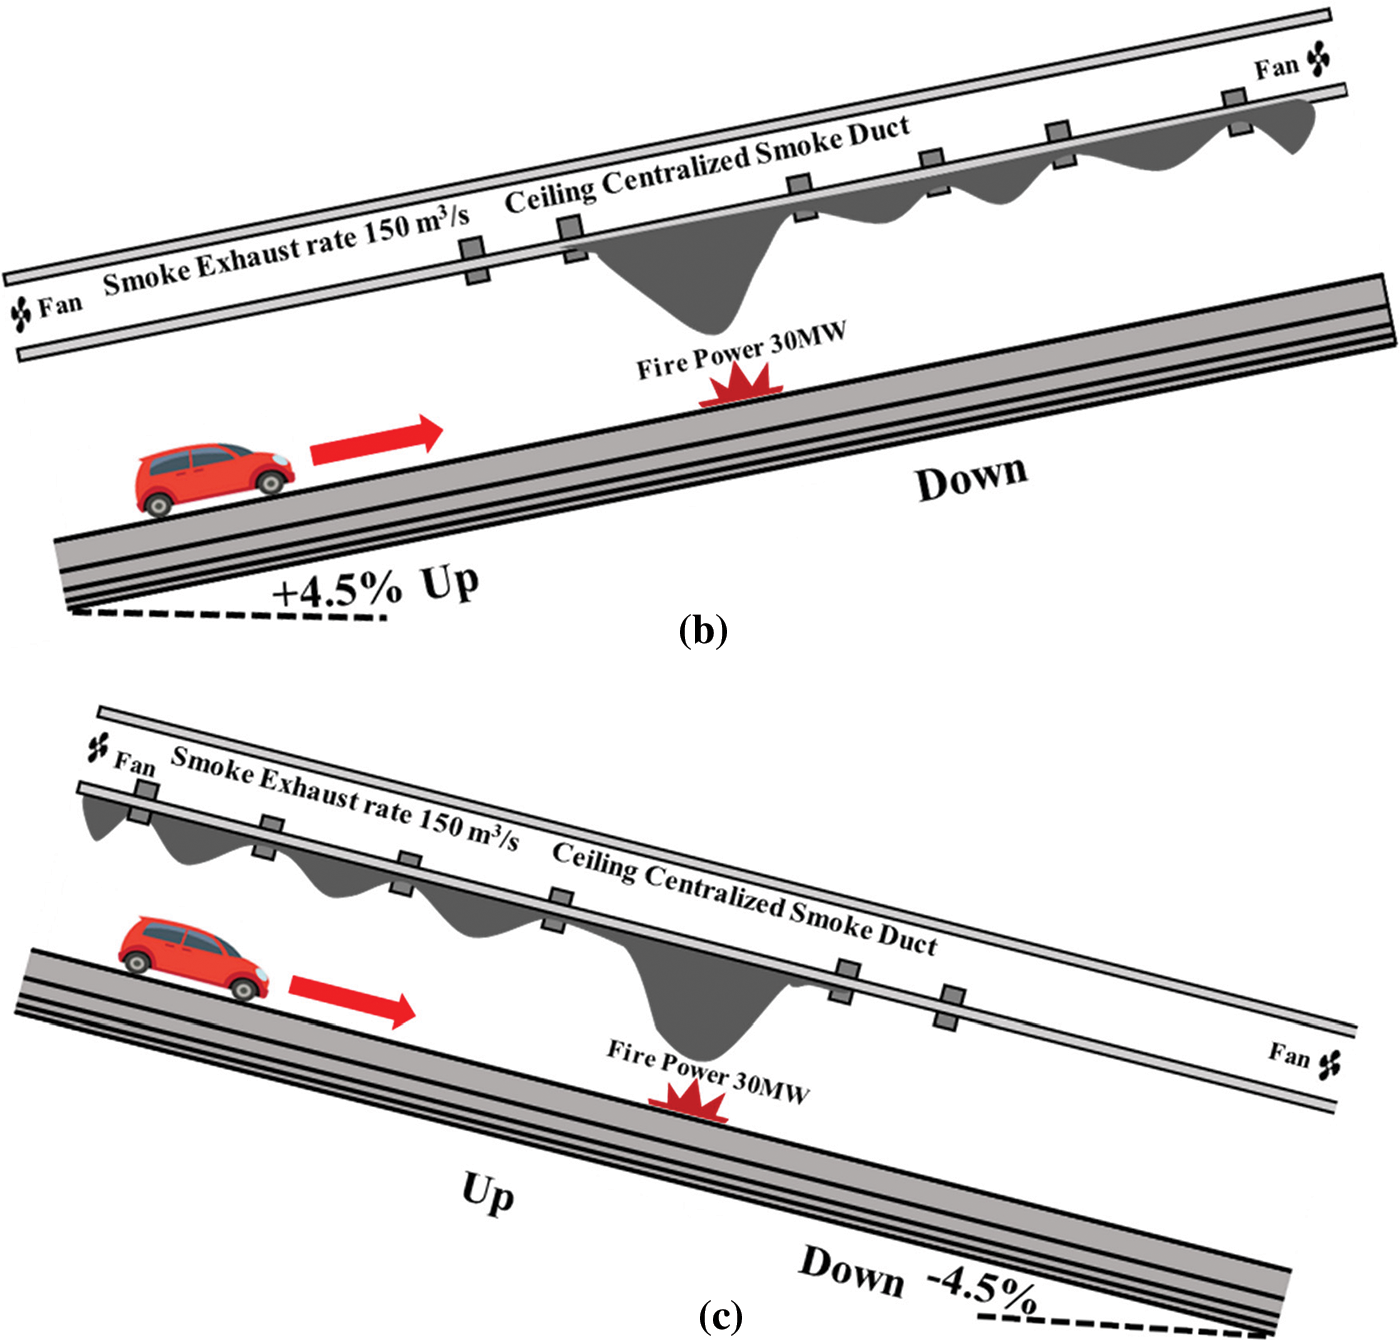
Figure 14: Various vent configurations with different opening schemes (a) 3 up 3 down, (b) 2 up 4 down, (c) 4 up 2 down
To effectively manage smoke during tunnel fires, establishing an efficient smoke exhaust system is essential, with the determination of the appropriate exhaust volume being a critical component of its design. The quantity of exhaust needed largely depends on the smoke generation rate, which is influenced by the mass flow rate of the smoke plume above the fire source. By referencing the Technical Regulations for Building Smoke Control and Exhaust (DGJ08-88-2006) and considering the specific fire scenarios outlined in this study, the theoretical calculation of tunnel smoke emission can be derived from the generation rates of both axisymmetric smoke plumes and wall smoke plumes. Understanding these two models—axisymmetric and wall plume—enables a more comprehensive assessment of the smoke exhaust requirements, including necessary safety factors. Incorporating calculations for wall plumes allows for accounting for potential variations in smoke production rates and fire dynamics more effectively, thereby enhancing the safety considerations in tunnel design and operation.
3.1 Axisymmetric Plume Model Calculation
Upon conducting calculations for a symmetrical axial plume model in a tunnel environment under a fire condition of 30 MW, the minimum smoke extraction requirement needed to manage smoke dispersion effectively has been identified. The critical outcome of these calculations indicates that, to fully evacuate the smoke produced by the fire, the smoke exhaust system must be capable of handling a smoke production rate. This rate serves as the baseline for establishing the minimum operational threshold for smoke extraction in such scenarios.
Calculations follow for the shield tunnel segment, where Z represents a height of 6.0 m, measured from the top surface of the burner to the bottom of the top partition surface of the exhaust ceiling and
Plume mass flow rate
The smoke production can be obtained:
3.2 Wall Plume Model Calculation
When
When
When
Plume mass flow rate
The smoke production can be obtained:
To account for the worst-case fire scenario and integrate a safety redundancy factor—guided by the standards set forth in the Code for Fire Protection in Building Design (GB50016-2014)—an enhanced smoke exhaust capacity is advocated. The code recommends incorporating a safety redundancy factor ranging from 10% to 20% to accommodate potential variability in smoke production rates and the complexities of real-world fire dynamics. Using the maximum value of the Axisymmetric plume theoretical model, selected due to its higher value than the wall plume model, which is 120.29 m³/s, and applying a 20 percent safety factor, aligning with these recommendations, it is proposed in this paper that the smoke exhaust volume be set to 150 m³/s. This adjustment not only adheres to the regulatory framework but also provides a margin of safety to ensure that the smoke exhaust system can handle the smoke load under the most adverse conditions.
The emission of large amounts of poisonous, high-temperature smoke during a tunnel fire poses a serious risk to public safety. Understanding smoke dispersion behavior is essential to designing smoke exhaust systems that work. Because of the concept of thermal buoyancy, the smoke rises vertically at first and diffuses laterally until it reaches the roof of the tunnel. It changes when it gathers at the tunnel’s ceiling, falling and forming a clear thermal barrier between the tunnel’s top and lower sections.
Distinct variations in smoke spread are observed among different smoke exhaust configurations. As time progresses, at intervals of 180, 300, 500, 800, and 1000 s, differences in smoke spread distances are shown in Figs. 15 and 16.
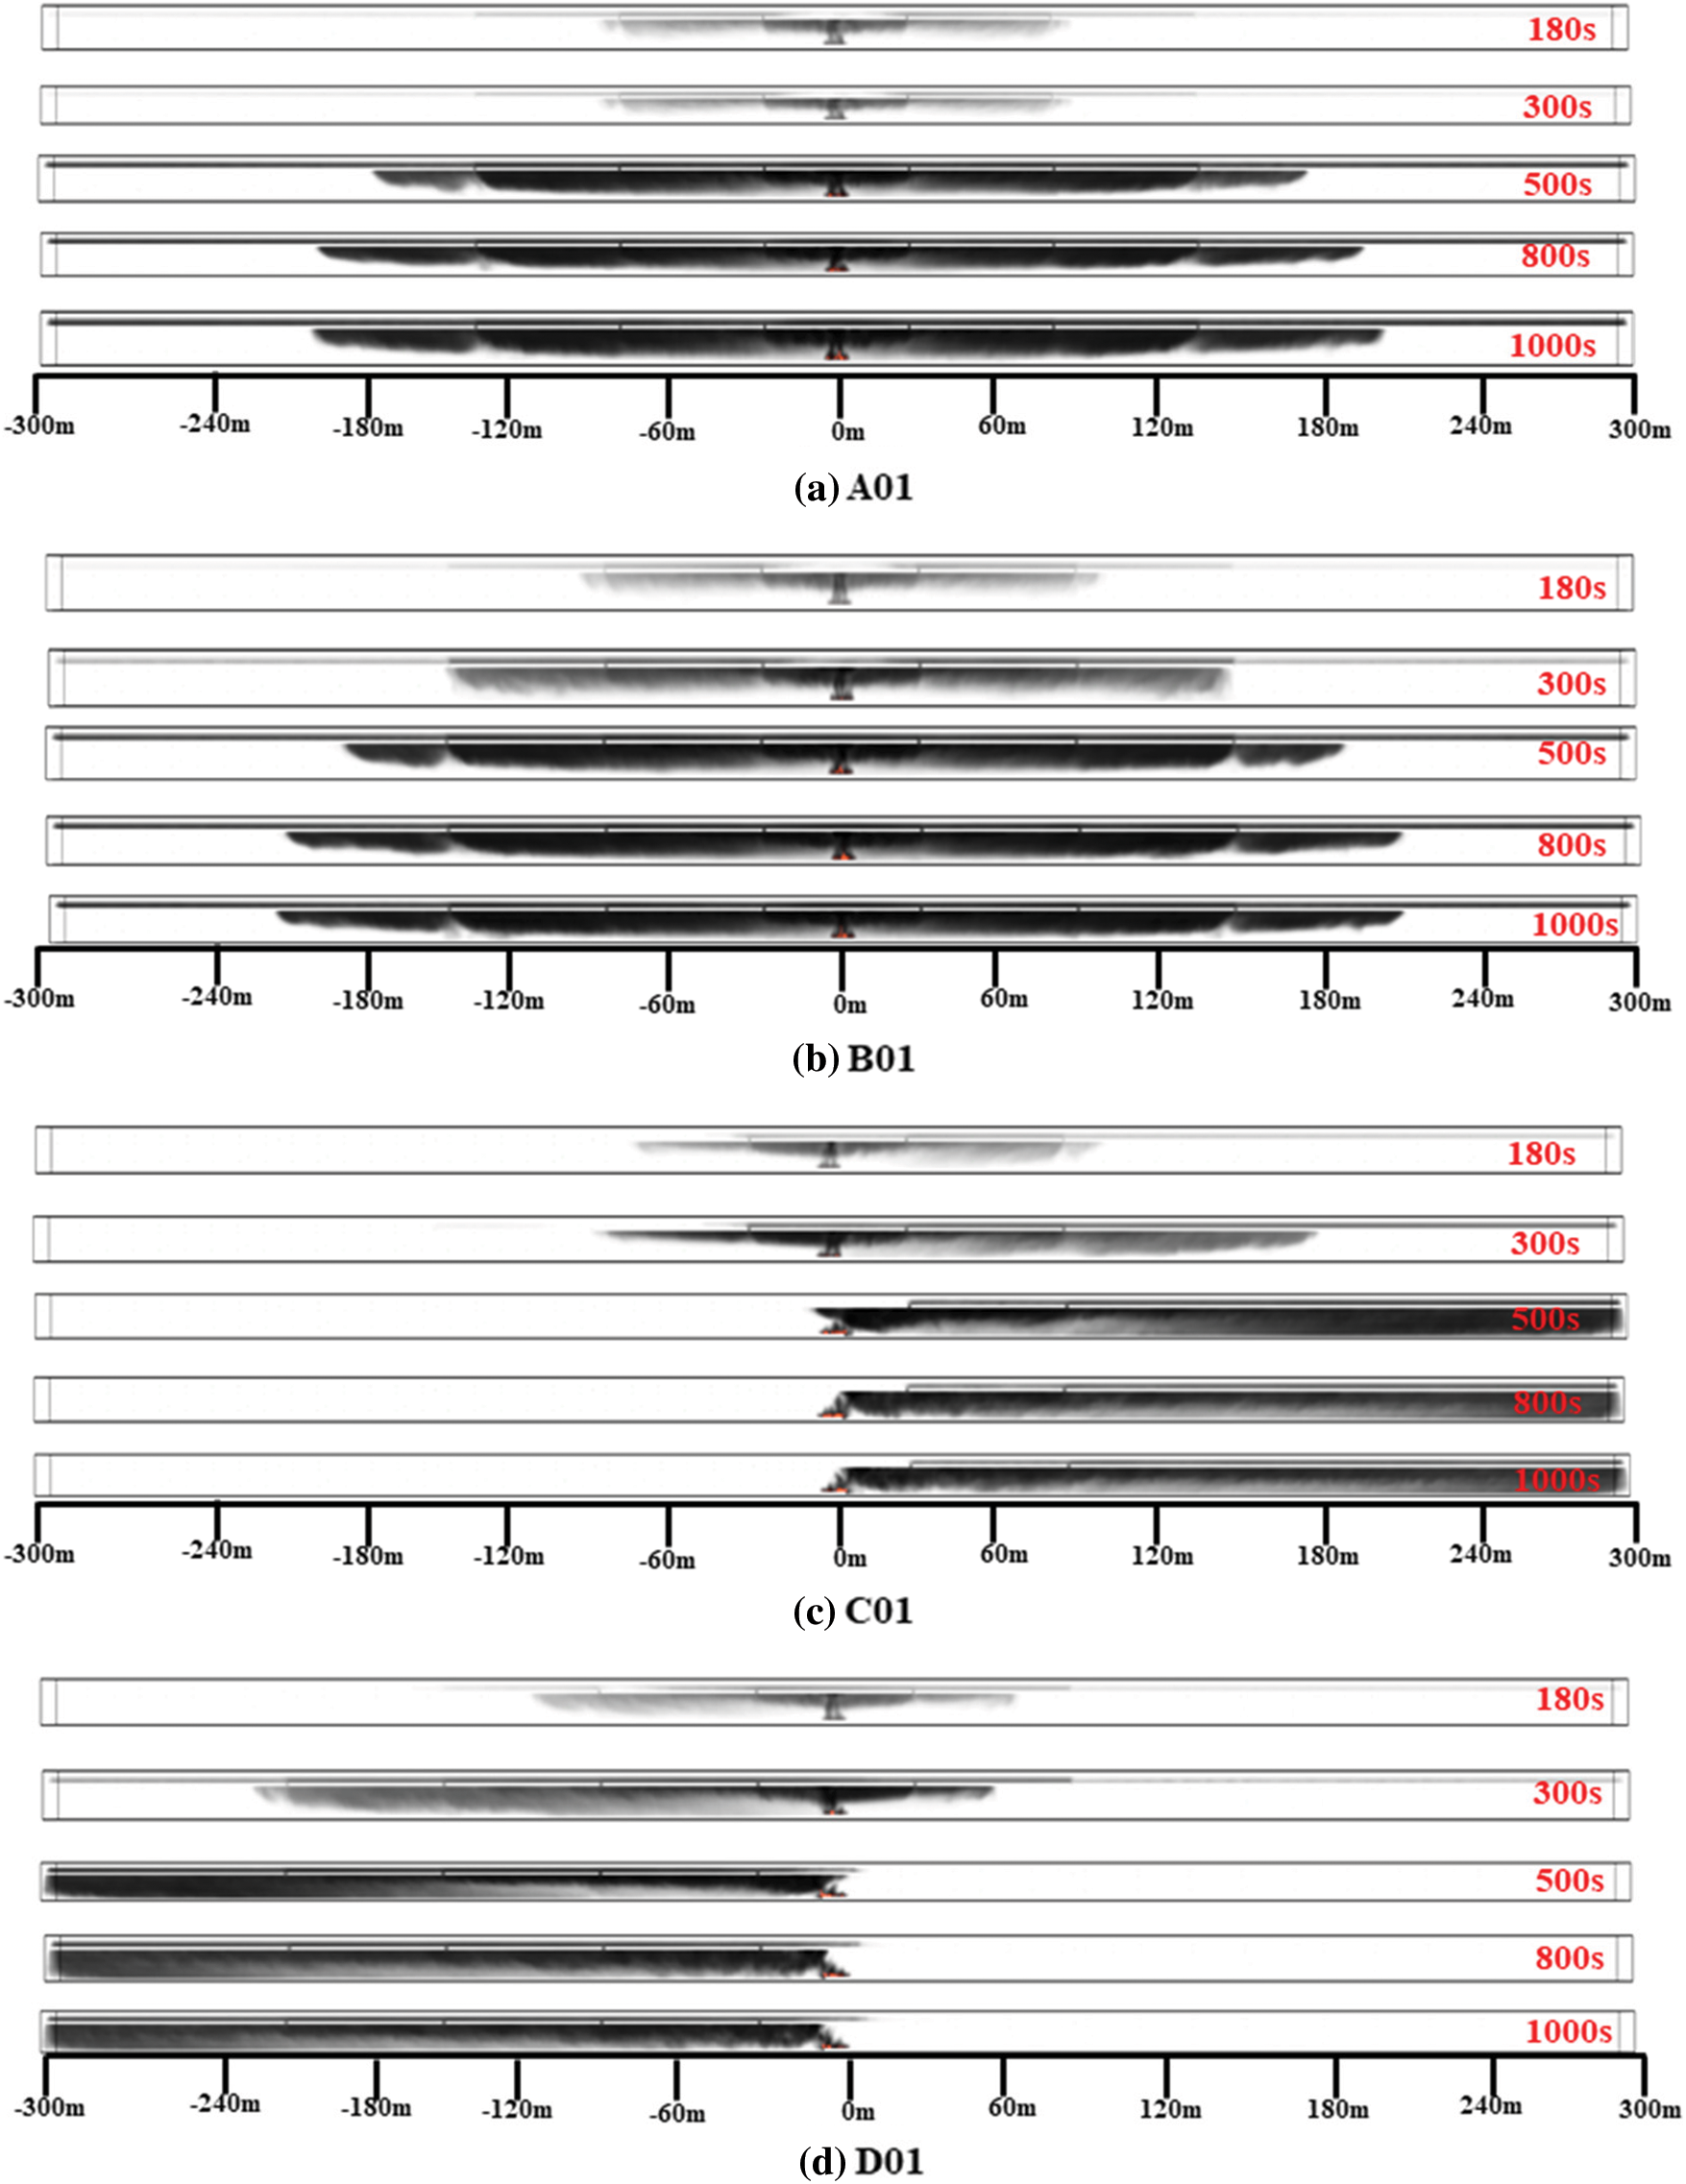
Figure 15: Variation in smoke distribution corresponding to different smoke vent spacing, area and slope
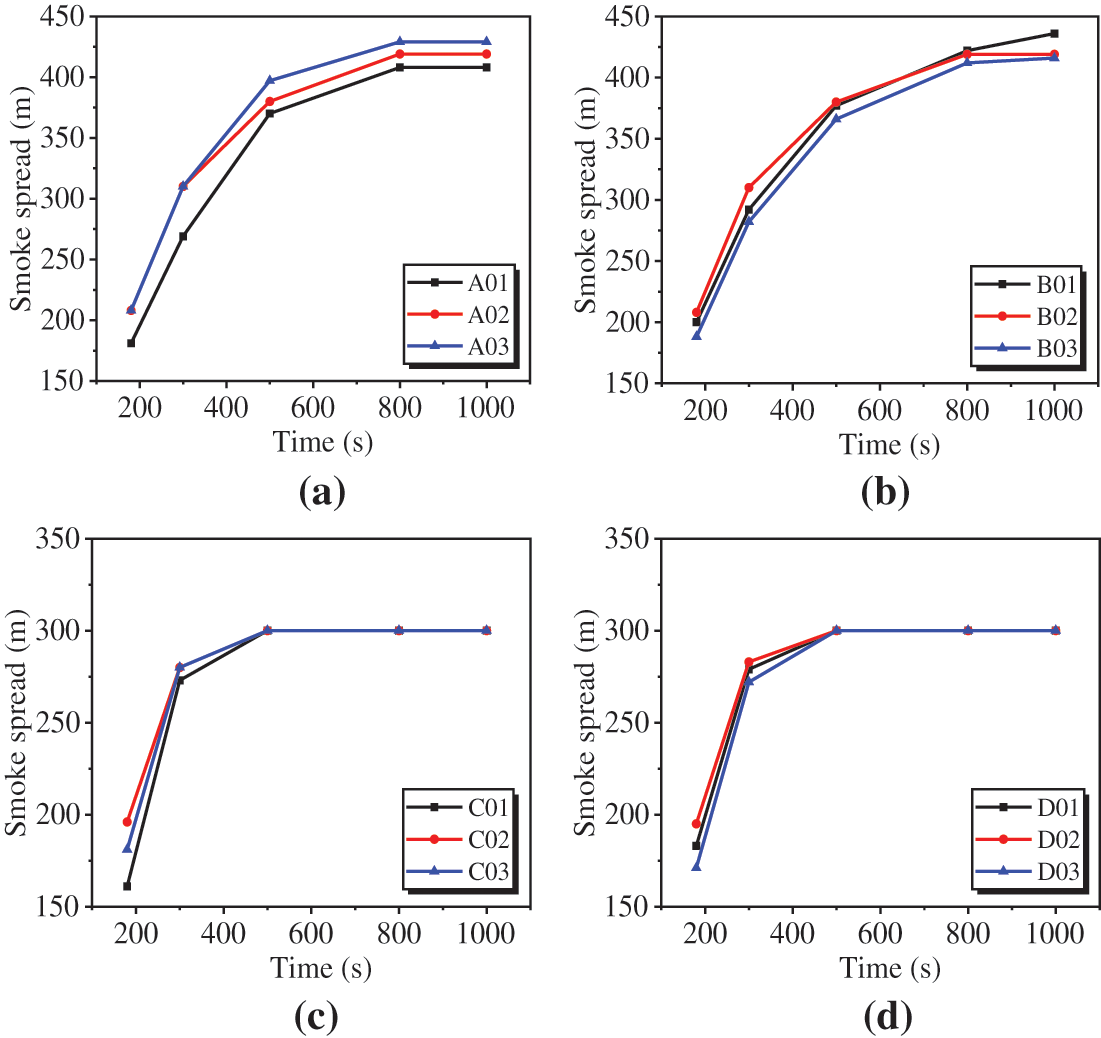
Figure 16: Comparative smoke spread analysis for various exhaust configurations at different time intervals
The configuration with 55-m spacing demonstrates effective smoke containment, as shown in Figs. 15a and 16a. In this configuration, smoke spread reached 408 m in 1000 s, as illustrated in Fig. 16a. In contrast, another configuration with 60-m vent spacing is less effective in controlling smoke, with the spread reaching 419 m in the same timeframe, as depicted in Fig. 16a. Among configurations with various spacings, the one with the greatest spacing allowed smoke to spread to 429 m, as shown in Fig. 16a. Meanwhile, exhaust vent configurations with dimensions of 4.0 m × 1.0 m showed a smoke spread of 436 m at 1000 s, as indicated in Figs. 15b and 16b. However, vent configurations measuring 4.0 m × 1.5 m and 4.0 m × 2.0 m exhibited smoke spreads of 419 and 416 m, respectively, as shown in Fig. 16b. Hence, the configuration with a 55-m spacing outperforms other vent area and spacing configurations in controlling smoke spread.
Notably, there are differences in smoke distribution between upstream and downstream areas. Some configurations exhibit faster downstream smoke filling, while others show faster upstream filling, as illustrated in Figs. 15c and 15d. This highlights the importance of the stack effect.
In slope +4.5%, the vents in the 2 up and 4 down configuration showed smoke spreads of 161 and 273 m at 180 and 300 s, respectively, as shown in Fig. 16c. This smoke spread is the least compared to the smoke spread under other smoke exhaust openings in the +4.5% slope. At simulation times of 500, 800, and 1000 s, the smoke spread reached 300 m on the downstream side due to the stack effect, as shown in Fig. 15c. A similar trend is observed in the −4.5% slope condition but smoke reached at 300 m at upstream side at the same time frame, as depicted in Fig. 15d, where the configuration with 4 vents up and 2 vents down demonstrated dominant smoke control, as shown in Fig. 16d, compared to other opening schemes. However, the distance covered in the −4.5% slope at 180 s and 300 s is 171 and 272 m, as shown in Fig. 16d. This difference in smoke distance compared to the +4.5% opening scheme is attributed to the complex behavior of smoke spread in the tunnel.
This study has established a critical temperature limit of 60°C, a threshold known to cause irreparable damage to the human body, as referenced in [24]. Derived from guidelines in the SFPE “Fire Engineering Manual” [24], this temperature limit underscores its significance in ensuring safe evacuation conditions within large structures, such as tunnels. It is essential to note that exposure to temperatures exceeding 100°C can lead to burns; thus, the 60°C temperature limit aims to minimize the risk of thermal injuries during emergencies. This study also adopts a visibility threshold of 10 m as a critical hazard value, following SFPE “Fire Engineering Manual” guidelines [24], crucial for safe evacuation in expansive areas like tunnels. This substantial visibility threshold is essential to enable personnel to discern evacuation directions in large spaces. Hence, given the extensive nature of tunnels, a visibility threshold of 10 m is established for this research, aligning with SFPE guidelines [24]. Additionally, other critical hazard values may need consideration in various scenarios, including factors such as smoke toxicity, oxygen levels, and structural integrity. Typically, temperatures inside tunnels rise sharply due to smoke movement and accumulation.
Fig. 17 illustrates visibility conditions at a 2-m height, in the presence of a 30 MW fire source and an exhaust rate of 150 m3/s.

Figure 17: Visibility distribution at 2-m height
In a setup with 55-m spacing, visibility significantly improved beyond the 5-m radius of the fire source at a 2-m height, as shown in Fig. 17a. In another setup with 60-m spacing, although visibility improved beyond the 5-m zone, as depicted in Fig. 17a, but it was less effective than the 55-m spacing scenario. Moreover, at 65-m spacing, safety thresholds were exceeded at positions −105 m up and 105 m down from the fire source, as illustrated in Fig. 17a. This was attributed to increased spacing between the vents, which reduces the smoke extraction capacity in the tunnel and increases soot particles, leading to reduced visibility.
The conditions included various vent opening areas (4.0 m × 1.0 m, 4.0 m × 1.5 m, 4.0 m × 2.0 m). The conditions with a 4.0 m × 2.0 m area sharply improved visibility at positions +155 and −155 m compared to other conditions, as shown in Fig. 17b. This improvement is attributed to the increase in the area of the smoke vent, which can enhance the smoke exhaust effect.
The tunnel’s slope induced a significant ‘chimney effect,’ impacting visibility both downstream and upstream of the fire source, as shown in Figs. 17c and 17d. This effect is a result of the exhibited asymmetrical smoke distribution patterns. In comparison to conditions with different spacings and various area configurations, the fluctuations were more pronounced in both +4.5% and −4.5% slope cases with different opening schemes. However, these fluctuations did not exceed the threshold value, as indicated in Figs. 17c and 17d. Moreover, the opening scheme of 2 up and 4 down in a slope of +4.5% showed pronounced control on visibility at 125 m downstream of the fire source, compared to other opening schemes in a +4.5% slope, as seen in Fig. 17c. In a slope of −4.5%, at −125 m upstream of the fire source, 4 up and 2 down showed more dominant control on visibility compared to other opening schemes in a −4.5% slope, as shown in Fig. 17d.
Smoke extraction efficiency serves as a key metric for assessing the effectiveness of smoke extraction during tunnel fires [28], and it is defined as the ratio of the total volume of smoke successfully removed to the total volume of smoke generation. Given the inherent difficulty in directly acquiring the exhaust volume of each exhaust vent in FDS calculations, an alternative approach for calculating exhaust efficiency involves utilizing the mass flux of CO2. Therefore, exhaust efficiency can be determined using the following formula:
The total CO2 production is approximately 1.72 kg/s. This study comprehensively quantifies the effectiveness of smoke exhaust systems across various configurations by comparing CO2 mass flow rates. The exhaust rate of 150 m3/s and a 30 MW fire source remain consistent in all scenarios.
In the scenario with a 55-m spacing, the system reaches peak efficiency at an impressive smoke extraction efficiency of 99.03%, as shown in Table 4. In contrast, the vent with a 4.0 m × 2.0 m area shows slightly lower efficiency of 97.61%, as indicated in Table 4. The 60 m spacing and a smoke exhaust area of 4 m × 1.5 m ensure smoke exhaust efficiency of 90.47%, as shown in Table 4. The smoke exhaust area of 4 m × 1.5 m avoids overly dense smoke exhaust system designs with excessively large opening areas. Therefore, opting for the 4.0 m × 1.5 m vent configuration with a 60-m spacing is reasonable as it effectively reduces smoke accumulation and construction costs compared to other configurations. Additionally, this configuration lends itself well to practical implementation in shield tunnels, ensuring both operational efficiency and safety, despite the fact that both the 55-m spacing configuration and the configuration with a vent area of 4.0 m × 2.0 m showed dominant control over smoke.
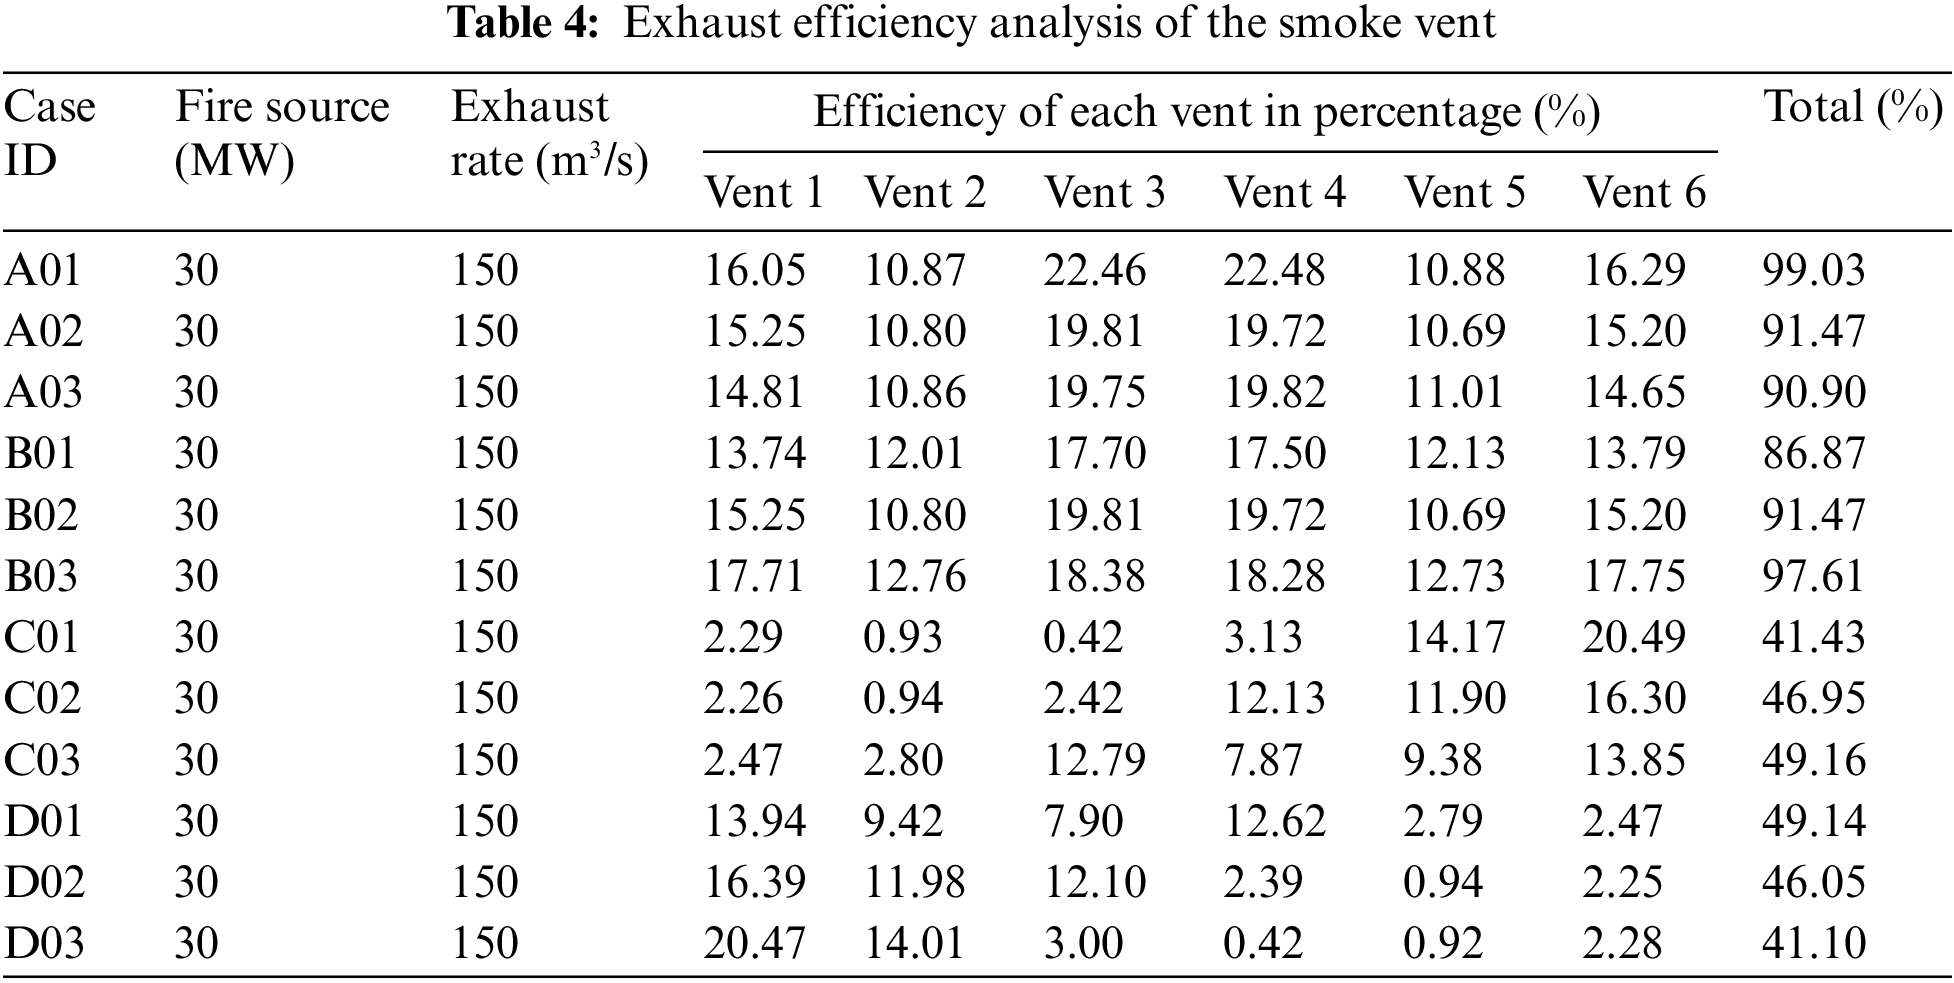
The study reveals a decreasing efficiency trend, emphasizing the crucial roles of proximity and vent placement in optimizing smoke extraction on a +4.5% and −4.5% slope. This decline in efficiency is attributed to an uncontrolled ‘chimney effect,’ which leads to significant smoke dispersion instead of efficient extraction, causing smoke to spread out at the end of the tunnel. This reduced efficiency is particularly evident in all conditions with a +4.5% slope, including both 4 up and 2 down and 3 up and 3 down. However, in the 2 up 4 down opening scheme, the highest efficiency of 49.16% is observed, as shown in Table 4. A similar trend is observed in the case of a −4.5% slope, but the 4 up 2 down scheme demonstrates high efficiency at 49.14%, as indicated in Table 4. Strategically placed vents play a predominant role in smoke extraction from the tunnel.
Fig. 18 illustrates the temperature distribution at a safe height (2 m) under various vent spacing, areas, and opening schemes for vent groups in the presence of a 30 MW fire source and an exhaust rate of 150 m³/s. This comparison assesses their impact on personnel escape. It was observed that the effect of vent spacing and area on temperature curves remained consistent across different spacing and vent areas.

Figure 18: Temperature distribution at 2 m height
Vent spacing and area impact temperature distribution, especially at the center of the fire source. The comparison of temperature distribution of different vent spacings (55, 60 and 65 m) as shown in Fig. 18a. In the scenario with a vent spacing of 55 m, the maximum temperature above the fire source observed was 664°C, as shown in Fig. 18a. However, configurations with 60 and 65 m spacing showed the maximum temperatures above the fire source of 708°C and 750°C, respectively, as depicted in Fig. 18a. Additionally, different vent areas (4.0 m × 1.0 m, 4.0 m × 1.5 m, 4.0 m × 2.0 m) influenced temperatures. The maxmium temperature observed was 665°C in the case of the vent area measuring 4.0 m × 2.0 m as shown in Fig. 18b. In contrast, temperatures reached 708°C for the 4.0 m × 1.5 m area and 764°C for the 4.0 m × 1.0 m area, as depicted in Fig. 18b. This variation in temperature across different scenarios is attributed to smoke accumulation under the ceiling and more efficient vent extraction, allowing fresh air to lower the temperature.
Beyond 5 m from the fire source, scenarios with varying vent spacing (55, 60, 65 m) and those with different vent areas (4.0 m × 1.0 m, 4.0 m × 1.5 m, 4.0 m × 2.0 m) maintained safe temperatures below 60°C, as shown in Figs. 18a and 18b. This poses no harm to individuals due to smoke movement, continuous extraction, and mixing with fresh air. Temperatures at the safe height stayed below the critical 60°C threshold, except near the fire source (−5 to 5 m), as shown in Figs. 18a and 18b. Heat dissipated as smoke spread and mixed with fresh air, gradually lowering smoke temperature.
The stack effect, amplified by the tunnel’s slope, significantly affected temperature distribution, as shown in Figs. 18c and 18d. Cases with varying vent opening schemes (up 4 down 2, up 3 down 3, up 2 down 4) showed different results at slopes of +4.5% and −4.5%. Under the slopes of −4.5% and +4.5%, different opening schemes led to varying maximum temperatures, observed at −5 and 5 m away from the fire source, as depicted in Figs. 18c and 18d. In Fig. 18c, the maximum temperature under a +4.5% tunnel slope is 593°C at 5 m, with the configuration of 2 upward and 4 downward opening schemes, representing the lowest maximum temperature among the various opening schemes as shown in Fig. 18c. A similar trend is evident in the −4.5% slope scenario, where the configuration of 2 downward and 4 upward slopes exhibits a maximum temperature of 627°C, as depicted in Fig. 18d. Notably, this temperature is observed at −5 m away from the fire source, representing the lowest value of maximum temperature among the different opening schemes.
For a +4.5% slope, temperatures rose more at downstream side, with smoke filling the space and moving along the ground, as shown in Fig. 18c. Conversely, at a −4.5% slope, temperatures increased more dramatically at upstream side, with smoke filling the space and moving along the ground, as shown in Fig. 18d.
The increased heat radiation around the fire caused the temperature to rise. In cases with different vent opening schemes (up 4 down 2, up 3 down 3, up 2 down 4) for a +4.5% slope, temperatures fluctuated, exceeding the threshold line up to 85 m away from the fire source downhill, as shown in Fig. 18c. This was due to a weak suction effect from the stack effect, resulting in inadequate fresh air and strengthening of hot air. Beyond 85 m, increased suction improved convection heat transfer, lowering the smoke front temperature and diffusion rate. A similar pattern occurred for a −4.5% slope, as shown in Fig. 18d. However, vent opening schemes were found ineffective for safe evacuation.
Ceiling temperature measurements were taken 0.75 m below the ceiling and 5.75 m above ground level. Temperatures remained below 600°C across various spacing and area configurations, as shown in Figs. 19a and 19b. There was a localized peak directly above the fire source due to the intense heat generated by the combustion process, but this did not impact the tunnel structure’s integrity. Temperatures gradually returned to ambient levels away from the fire source.

Figure 19: Temperature distribution below the tunnel ceiling
Under different opening schemes (+4.5% and −4.5% slopes), a lower ceiling temperature of 250°C is observed in Figs. 19c and 19d. Initially, the highest temperature is above the fire source, but it decreases as combustibles deplete. The slope significantly affects temperature distribution. At +20 m up and −20 m down under different opening schemes, a noticeable decline in ceiling temperature can be seen in Figs. 19c and 19d, emphasizing the substantial impact of the slope on temperature distribution.
Under different opening schemes and slopes (+4.5% and −4.5%), smoke temperature reaches the critical 60°C threshold at −295 and 295 m from the fire sources, as shown in Figs. 19c and 19d. In comparison, with various spacing and areas mentioned earlier, this threshold is crossed earlier at approximately −155 and 155 m, as depicted in Figs. 19a and 19b. However, the stack effect has a minimal impact on reducing ceiling temperature.
As the horizontal distance increases, the maximum ceiling temperature downstream of the fire source displays a noticeably distinct decline pattern.
Regarding the downstream smoke below ceilings that are distant from the fire source:
Mass equation:
Energy equation:
The expression for the entrainment velocity
The smoke entrainment velocity in tunnel fires is quite low [15]. Usually, the impact of smoke entrainment on the energy calculation is disregarded in an attempt to simplify it. The tunnel’s wet perimeter may be computed based on the design specifications, meaning that it can be thought of as a constant. It is assumed that another constant is
Because the coefficient
The temperature decay downstream for a tunnel with a rectangular section may be written as follows:
Although the coefficient
That is
This paper examines temperature decay in a shield tunnel, focusing on the location of maximum temperature as a reference point. In this study, a reference point was selected from the tunnel’s center, where maximum fuel burning occurs, covering a downstream distance of 175 m. Groups A and B demonstrated the most effective smoke control outcomes. Therefore, the relevant findings for temperature attenuation in these two groups are presented exclusively for the 175-m downstream region from the center of the fire source, where a constant heat release of 30 MW is maintained.
Temperature decay is quantified using the ratio

Figure 20: Temperature decay ratio (y-axis) vs. distance from fire source (x-axis) with consistent trends for different configurations
Numerical calculations closely align with the fitting curve, demonstrating a strong correlation with R-squared values exceeding 0.9. The coefficients, denoted as ‘a’, ‘b’, ‘c’, and ‘d’, are determined to be 0.58, −22.64, 0.42, and −0.48, respectively.
The behavior of several data points near and away from the reference point closely matches the fitting curve, exhibiting minimal underestimation in due to data fitting errors.
At the origin point, there is no temperature decay, resulting in a value of 1, with a distinct physical interpretation. Subsequently, with increasing distance from the fire source, the temperature decay experiences a sharp decline, followed by a more gradual decrease as shown in Fig. 20. The empirical formula for temperature attenuation under the tunnel ceiling for shield tunnels under varying vent spacings and areas can be derived as follows:
A series of FDS (Fire Dynamics Simulator) simulations were conducted on flat and sloped shield tunnels equipped with a multi-point centralized exhaust system. Consistent exhaust rates and fire sources were utilized to explore the influence of various parameters, such as the spacing of smoke vents, the size of vent areas, and the vent opening schemes on the effectiveness of smoke exhaust. These parameters should be taken into account in the practical design and utilization of such systems. The key conclusions are presented below:
1. Simulations revealed that smaller spacing and larger vent areas enhance the smoke exhaust effect.
2. A vent spacing of 60 m and a vent size of 4.0 m × 1.5 m are optimal for smoke control effectiveness. This configuration not only prevents smoke accumulation but is also cost-effective.
3. The application of a 60 m spacing and a vent area of 4.0 m × 1.5 m across various slopes, with different opening schemes, is affected by the “chimney effect” on visibility, temperature distribution at a 2-m height, smoke extraction efficiency, and smoke spread. Nonetheless, optimal performance is achieved with a slope of +4.5% (2 vents up and 4 vents down) and −4.5% (4 vents up and 2 vents down).
Ceiling temperatures on the downstream side remained below the threshold value, indicating no structural damage. However, temperature decay formulas derived for the shield tunnel suggest that different design parameters of the centralized smoke exhaust system have a minimal effect on temperature decay within the shield tunnel.
This paper examines smoke and temperature control in the centralized smoke exhaust system of the shield tunnel of the Nanjing project, a three-lane tunnel beneath the Yangtze River. It investigates the impact of varying numbers of smoke vents and explores fire ventilation design in shield tunnels. By optimizing vent spacing and area, it ensures temperatures stay below 60°C at a 2-m height beyond 5 m from the fire source. The study also analyzes different vent configurations, emphasizing the efficiency of upward and downward arrangements on slopes. Additionally, it finds that ceiling temperatures consistently remain below 600°C downstream in various vent spacing and area configurations. These findings provide valuable insights for tunnel fire ventilation designs, with further model tests planned to study temperature fields and maximum temperatures.
Acknowledgement: The authors would like to thank Prof. Zhisheng Xu for suggestions.
Funding Statement: The authors received no specific funding for this study.
Author Contributions: The authors confirm contribution to the paper as follows: study conception and design: Zhisheng Xu; data collection: Zhisheng Xu, Sohail Mahmood; analysis and interpretation of results: Zhisheng Xu, Sohail Mahmood, draft manuscript preparation: Sohail Mahmood, Zihan Yu. All authors reviewed the results and approved the final version of the manuscript.
Availability of Data and Materials: Data are contained within the article.
Conflicts of Interest: The authors declare that they have no conflicts of interest to report regarding the present study.
References
1. Yan, Z., Zhang, Y., Guo, Q., Zhu, H., Shen, Y. et al. (2018). Numerical study on the smoke control using point extraction strategy in a large cross-section tunnel in fire. Tunnelling and Underground Space Technology, 82, 455–467. https://doi.org/10.1016/j.tust.2018.08.019 [Google Scholar] [CrossRef]
2. Leitner, A. (2001). The fire catastrophe in the tauern tunnel: Experience and conclusions for the Austrian guidelines. Tunnelling and Underground Space Technology, 16(3), 217–223. https://doi.org/10.1016/S0886-7798(01)00042-6 [Google Scholar] [CrossRef]
3. Beard, A., Carvel, R. (2012). Handbook of tunnel fire safety. London, UK: ICE publishing. [Google Scholar]
4. Babrauskas, V., Gann, R. G., Levin, B. C., Paabo, M., Harris, R. H. et al. (1998). A methodology for obtaining and using toxic potency data for fire hazard analysis. Fire Safety Journal, 31(4), 345–3585. https://doi.org/10.1016/S0379-7112(98)00013-7 [Google Scholar] [CrossRef]
5. Vianello, C., Fabiano, B., Palazzi, E., Maschio, G. (2012). Experimental study on thermal and toxic hazards connected tofire scenarios in road tunnels. Journal of Loss Prevention inthe Process Industries, 25(4), 718–729. https://doi.org/10.1016/j.jlp.2012.04.002 [Google Scholar] [CrossRef]
6. Wang, K., Cai, W., Zhang, Y., Hao, H., Wang, Z. (2021). Numerical simulation of fire smoke control methods in subway stations and collaborative control system for emergency rescue. Process Safety and Environmental Protection, 147, 146–161. https://doi.org/10.1016/j.psep.2020.09.033 [Google Scholar] [CrossRef]
7. Wang, W., Zhu, Z., Jiao, Z., Mi, H., Wang, Q. (2021). Characteristics of fire and smoke in the natural gas cabin of urban underground utility tunnels based on CFD simulations. Tunnelling and Underground Space Technology, 109, 103748. https://doi.org/10.1016/j.tust.2020.103748 [Google Scholar] [CrossRef]
8. Chen, Z., Liu, Z., Huang, L., Niu, G., Yan, J. et al. (2023). Research on the effect of ceiling centralized smoke exhaust system with air curtains on heat confinement and plug-holing phenomenon in tunnel fires. Process Safety and Environmental Protection, 169, 646–659. https://doi.org/10.1016/j.psep.2022.11.054 [Google Scholar] [CrossRef]
9. Gong, L., Jiang, L., Li, S., Shen, N., Zhang, Y. et al. (2016). Theoretical and experimental study on longitudinal smoke temperature distribution in tunnel fires. International Journal of Thermal Sciences, 102, 319–328. https://doi.org/10.1016/j.ijthermalsci.2015.12.006 [Google Scholar] [CrossRef]
10. Li, H., Liu, J., Ge, J. (2020). Phenomenological characteristics of continuous spill fires in a tunnel with longitudinal ventilation. Process Safety and Environmental Protection, 138, 108–116. https://doi.org/10.1016/j.psep.2020.03.010 [Google Scholar] [CrossRef]
11. Liu, W. Y., Chen, C. H., Shu, Y. L., Chen, W. T., Shu, C. M. (2020). Fire suppression performance of water mist under diverse desmoking and ventilation conditions. Process Safety and Environmental Protection, 133, 230–242. https://doi.org/10.1016/j.psep.2019.10.019 [Google Scholar] [CrossRef]
12. He, L., Xu, Z., Chen, H., Liu, Q., Wang, Y. et al. (2018). Analysis of entrainment phenomenon near mechanical exhaust vent and a prediction model for smoke temperature in tunnel fire. Tunnelling and Underground Space Technology, 80, 143–150. https://doi.org/10.1016/j.tust.2018.06.011 [Google Scholar] [CrossRef]
13. Chaabat, F., Salizzoni, P., Creyssels, M., Mos, A., Wingrave, J. et al. (2020). Smoke control in tunnel with a transverse ventilation system: An experimental study. Building and Environment, 167, 106480. https://doi.org/10.1016/j.buildenv.2019.106480 [Google Scholar] [CrossRef]
14. Nordmark, A. (1998). Fire and life safety for underground facilities: Present status of fire and life safety principles related to underground facilities: ITA working group 4, “subsurface planning”. Tunnelling and Underground Space Technology, 13(3), 217–269. https://doi.org/10.1016/S0886-7798(98)00058-3 [Google Scholar] [CrossRef]
15. Ingason, H., Li, Y. Z. (2010). Model scale tunnel fire tests with longitudinal ventilation. Fire Safety Journal, 45(6–8), 371–384. [Google Scholar]
16. Gao, P. Z., Liu, S. L., Chow, W. K., Fong, N. K. (2004). Large eddy simulations for studying tunnel smoke ventilation. Tunnelling and Underground Space Technology, 19(6), 577–586. https://doi.org/10.1016/j.tust.2004.01.005 [Google Scholar] [CrossRef]
17. Li, Y. F., Li, Y. F., Feng, X., Huang, Y. B. (2018). Influence of arrangement of jet fans on smoke exhaust effect in a tunnel with longitudinal ventilation system. Procedia Engineering, 211, 421–426. https://doi.org/10.1016/j.proeng.2017.12.031 [Google Scholar] [CrossRef]
18. Wang, Q., Tang, F., Li, L. J., Zhang, X. C., Fan, C. G. (2016). Large eddy simulation on the effect of smoke exhaust openings arrangement on the smoke spread in tunnel fires. Procedia Engineering, 135, 309–315. https://doi.org/10.1016/j.proeng.2016.01.135 [Google Scholar] [CrossRef]
19. Tao, L., Zeng, Y. (2022). Effect of different smoke vent layouts on smoke and temperature distribution in single-side multi-point exhaust tunnel fires: A case study. Fire, 5(1), 28. https://doi.org/10.3390/fire5010028 [Google Scholar] [CrossRef]
20. Robot, B. (1999). Modélisation numérigue d’un système de ventilation d’un tunnel routier par trappe dedésenfumage en cas d’incendie. Université de Lyon 1: Villeurbanne, France (In French). [Google Scholar]
21. Oucherfi, M., Gay, B., Mos, A., Carlotti, P. (2009). Definition and optimisation of the efficiency of smoke extraction in a road tunnel. 13th International Symposium on Aerodynamics & Ventilation of Vehicle Tunnels, May 13–15. New Brunswick, USA, Hal Open Sciences. [Google Scholar]
22. Chow, W. K., Gao, Y., Zhao, J. H., Dang, J. F., Chow, N. C. (2016). A study on tilted tunnel fire under natural ventilation. Fire Safety Journal, 81, 44–57. https://doi.org/10.1016/j.firesaf.2016.01.014 [Google Scholar] [CrossRef]
23. Lin, P., Lo, S. M., Li, T. (2014). Numerical study on the impact of gradient on semi-transverse smoke control system in tunnel. Tunnelling and Underground Space Technology, 44, 68–79. https://doi.org/10.1016/j.tust.2014.07.011 [Google Scholar] [CrossRef]
24. Klein, R. A. (1997). SFPE handbook of fire protection engineering (1995). Fire Safety Journal, 29(1), 61–63. https://doi.org/10.1016/S0379-7112(97)00022-2 [Google Scholar] [CrossRef]
25. Zheng, Y., Ye, K., Liu, H., Peng, F., Cao, B. et al. (2020). Research on the plume shape under optimal wind environment to prevent the smoke backflow and combustion gains in utility tunnel. Fire and Materials, 44(1), 139–151. https://doi.org/10.1002/fam.v44.1 [Google Scholar] [CrossRef]
26. Yan, G., Wang, M., Yu, L., Tian, Y., Guo, X. (2020). Study of smoke movement characteristics in tunnel fires in high-altitude areas. Fire and Materials, 44(1), 65–75. https://doi.org/10.1002/fam.v44.1 [Google Scholar] [CrossRef]
27. McGrattan, K. B., Baum, H. R., Rehm, R. G., Hamins, A., Forney, G. P. et al. (2000). Fire dynamics simulator–technical reference guide. Gaithersburg: National Institute of Standards and Technology, Building and Fire Research Laboratory. [Google Scholar]
28. Cigada, A., Ruggieri, D., Zappa, E. (2005). Road and railway tunnel fire hazard: A new measurement method for risk assessment and improvement of transit safety. Proceedings of the 2005 IEEE International Workshop on Measurement Systems for Homeland Security, Contraband Detection and Personal Safety Workshop, pp. 89–94. Orlando, FL, USA, IEEE. [Google Scholar]
29. Ji, J., Guo, F., Gao, Z., Zhu, J., Sun, J. (2017). Numerical investigation on the effect of ambient pressure on smoke movement and temperature distribution in tunnel fires. Applied Thermal Engineering, 118, 663–669. https://doi.org/10.1016/j.applthermaleng.2017.03.026 [Google Scholar] [CrossRef]
30. Tao, L., Zeng, Y., Li, J., Yang, G., Fang, Y. et al. (2022). Study on the maximum temperature and temperature decay in single-side centralized smoke exhaust tunnel fires. International Journal of Thermal Sciences, 172, 107277. https://doi.org/10.1016/j.ijthermalsci.2021.107277 [Google Scholar] [CrossRef]
31. Kunsch, J. P. (1998). Critical velocity and range of a fire-gas plume in a ventilated tunnel. Atmospheric Environment, 33(1), 13–24. https://doi.org/10.1016/S1352-2310(98)00118-6 [Google Scholar] [CrossRef]
32. Guo, F., Gao, Z., Wan, H., Ji, J., Yu, L. et al. (2019). Influence of ambient pressure on critical ventilation velocity and backlayering distance of thermal driven smoke in tunnels with longitudinal ventilation. International Journal of Thermal Sciences, 145, 105989. https://doi.org/10.1016/j.ijthermalsci.2019.105989 [Google Scholar] [CrossRef]
Cite This Article
 Copyright © 2024 The Author(s). Published by Tech Science Press.
This work is licensed under a Creative Commons Attribution 4.0 International License , which permits unrestricted use, distribution, and reproduction in any medium, provided the original work is properly cited.
 Downloads
 Citation Tools