
 Submit a Paper
 Propose a Special lssue
 Open Access
ARTICLE
Optimal Design of Drying Process of the Potatoes with Multi-Agent Reinforced Deep Learning
Department of Mechanical Engineering, Chabahar Maritime University, Chabahar, Iran
* Corresponding Author: Mohammad Yaghoub Abdollahzadeh Jamalabadi. Email:
Frontiers in Heat and Mass Transfer 2024, 22(2), 511-536. https://doi.org/10.32604/fhmt.2024.051004
Received 25 February 2024; Accepted 12 April 2024; Issue published 20 May 2024
 View Full Text
 Download PDF
Abstract
Heat and mass transport through evaporation or drying processes occur in many applications such as food processing, pharmaceutical products, solar-driven vapor generation, textile design, and electronic cigarettes. In this paper, the transport of water from a fresh potato considered as a wet porous media with laminar convective dry air fluid flow governed by Darcy’s law in two-dimensional is highlighted. Governing equations of mass conservation, momentum conservation, multiphase fluid flow in porous media, heat transfer, and transport of participating fluids and gases through evaporation from liquid to gaseous phase are solved simultaneously. In this model, the variable is block locations, the object function is changing water saturation inside the porous medium and the constraint is the constant mass of porous material. It shows that there is an optimal configuration for the purpose of water removal from the specimen. The results are compared with experimental and analytical methods Benchmark. Then for the purpose of configuration optimization, multi-agent reinforcement learning (MARL) is used while multiple porous blocks are considered as agents that transfer their moisture content with the environment in a real-world scenario. MARL has been tested and validated with previous conventional effective optimization simulations and its superiority proved. Our study examines and proposes an effective method for validating and testing multiagent reinforcement learning models and methods using a multiagent simulation.Keywords
Nomenclature
| A | Surface area of the sample, m2 |
| Aspec | Specific area, m2 |
| aw | Water activity, dimensionless |
| Bit | Thermal Biot number, |
| Bim | Mass Biot number, |
| C | Molar concentration, mol/m3 |
| cp | Heat capacity, J/(kg·K) |
| Specific heat of water, J/(kg·K) | |
| Specific heat of water vapor, J/(kg·K) | |
| Specific heat of air, J/(kg·K) | |
| c | Mass concentration, kg/m3 |
| ca | Concentration of air, kg/m3 |
| cv,sat | Saturated vapor concentration, kg/m3 |
| D | Diffusion coefficient, Mass diffusivity, m2/s |
| Da | Air diffusion coefficient, m2 s−1 |
| Da,eff | Effective heat transfer coefficient of air, m2/s |
| Dcap | Capillary diffusion coefficient due to concentration gradient, m2/s |
| DT | Capillary diffusivity due to temperature gradient, m2/s |
| Dva | Vapor diffusion coefficient, m2/s |
| d | Sample thickness, m |
| F | Volume force, N/m3 |
| Fo | Dimensionless time, Fourier number, |
| hevap | Latent heat of vaporization of pure water, J/kg |
| ht | Convective heat transfer coefficient, W m−2 K−1 |
| hm | Surface mass transfer coefficient, m/s |
| H | Height, m |
| J | Mass flux, kg/(m2·s) |
| k | Thermal conductivity, W/m K |
| K | Permeability, m2 |
| Effective liquid permeability of the elemental slice, m2 | |
| Saturated liquid permeability (characteristic of the material structure), m2 | |
| Kevap | Evaporation rate constant, 1/s |
| Relative liquid permeability of the elemental slice | |
| kar | Air’s relative permeability |
| klr | Water relative permeability |
| Ko | Kossovitch number, |
| L | Length, m |
| Lu | Luikov number, Lewis number, D/α |
| M | Molecular weight, kg/mol |
| Md | Moisture content, dry basis, kg of water/kg of dry solids |
| Mv | Molecular weight of water vapor, kg/mol |
| Ma | Molecular weight of air, kg/mol |
| Mw | Moisture content, wet basis, kg of water/kg of total |
| mv | Surface evaporation rate, kg/(m3·s) |
| p | Pressure, Pa |
| Liquid pressure (related to gas phase pressure and capillary pressure), Pa | |
| Capillary pressure in the elemental slice (function of saturation), Pa | |
| Gas phase total pressure | |
| Partial pressure of vapor, Pa | |
| Partial pressure of air, Pa | |
| Pn | Posnov number, |
| Pv | Vapor pressure, Pa |
| q’ | Heat source, W/m3 |
| R | Gas constant, J/(mol·K) |
| Revap | Evaporation rate, kg/(m3·s) |
| RH | Relative humidity at any time, t |
| S | Degree of saturation of the elemental slice (related to moisture content) |
| Sw | Water saturation = Vw/ϕV, dimensionless |
| Sg | Gas saturation = Vg/ϕV, dimensionless |
| Sir | Relative liquid saturation |
| t | Time, s |
| T | Temperature of the elemental slice at any time t, K |
| T0 | Initial temperature, K |
| Ta | Drying air temperature, K |
| Tin | Inlet temperature, K |
| u | Velocity, m/s |
| uin | Inlet velocity, m/s |
| W | Width, m |
| x | Distance, m |
| X | Location of interface, m |
| V | Total volume, m3 |
| X | Dry basis moisture content, kg water/kg d.b |
| Initial dry basis moisture content, 1 | |
| Dimensionless water content, | |
| Z | Dimensionless component of coordination through the thickness, |
| Greek Symbols | |
| α | Thermal diffusion coefficient, m2 s−1 |
| δ | Thermo-gradient coefficient, kg water/kg d.b/K |
| ε | Phase change coefficient |
| Temperature difference, | |
| Dimensionless Temperature, | |
| λ | Thermal conductivity, W m−1 K−1 |
| ϕ | Porosity, dimensionless |
| ρ | Density, kg m−3 |
| ρa | Density of air, kg m−3 |
| ρw | Density of water, kg/m3 |
| τ | Dimensionless time, s |
| μa | Dynamic viscosity of air, N s m−2 |
| νa | Kinematic viscosity of air, m2 s−1 |
| I˙ | Rate of evaporation, kg/m3 s |
In recent years, there have been many studies to use artificial intelligence for optimization in engineering to address real-life problems, analyze existing diverse multiagent simulations and describe simulation optimization [1]. In an Automated guided vehicles warehouse, researchers automate the path of numerous autonomous Automated guided vehicles using centralized training with decentralized execution framework-based MARL [2]. The major benefit of MARL scheme is that it does not need any model of the system. We present a new method based on deep independent Q-learning. This modified model includes more than an observation function and a common scheme regarding its policy. It also incorporates a direct sharing of information between neighboring agents as part of the observation function [3].
To examine a cache-aided network using scalable caching under the MARL language, distributed caching is modeled using a MARL framework as a fully cooperative repeated game [4]. As shown by distributed caching, caching is more likely to occur. A supervisory network separates sub-goals for each agent to achieve a global goal. Gradually gets more complex so we can learn policy in a large-scale environment. As part of our method evaluation, Do et al. [5] do the treasure hunter experiment which proves the capability of MARL over the usual genetic algorithm [6]. An extension of single agent Actor-Critic methods is proposed in this paper for a multi-agent reinforcement learning algorithm. In the algorithm, all agents have access to one another’s actions and rewards, as well as a set of Q values and techniques. For the computation of Q values, we use linear programming. A mixed Nash equilibrium is reached with a smaller value, and the algorithm has the same convergence properties as Nash equilibrium [7].
As illustrated by researchers, the suggestion of phase-based control structures for the operation of multi-agents [8] (for the application of semi-batch reactors) and sustainability enhance HVAC optimal control [9] (for the application of heating, ventilation, and air-conditioning), and optimal coordinated method for large-scale multi-agent deep reinforcement learning [10] (for the application of proton exchange membrane fuel cell heatmanagement) increased the performance of control procedures and resource management. Some advantages exist in the use of a multi-agent deep reinforcement learning algorithm for optimizing building cooling water systems including cooling towers, pumps, and chillers [11]. Considering a multi-agent scenario where each agent controls a single sub-equipment defeats that barrier. As opposed to traditional methods that rely on equipment model parameters, MARL is model-independent. Furthermore, it is necessary to constantly update the model (model-based) to maintain accuracy, which is costly. MARL has applications in grid systems optimization [12].
Proximal Policy Optimization for localizing targets [13] with various intensities is modeled in the way that agents that can perform as humans do so by cooperating to find the target by expanding the scalability and adaptability of the models. The superiority of MARL over Bayesian, uniform survey, and single-agent, and Double Deep Q-Networks is proved [13]. MARL can generate optimal policies that outperform conventional rule-based policies. Resource management for energy application of behind-the-meter resources is optimized with MARL to provide essential community services [14]. Selimefendigil et al. [15] propose a machine-learning method for the optimal spacing between multiple porous moist objects in a combined heat and mass transport environment. As the surfaces do not have uniform heat and mass transfer coefficients, a neural network model was used.
Drying in a porous media has many applications in the food industry, pharmaceutical products being dried before packaging, and in paper and board manufacturing [16]. Some papers collectively address the research question of achieving environment coupling. Beyhaghi et al. [17,18] propose a simulation approach that combines the invasion-percolation algorithm for water redistribution inside the network with a finite-volume-based code for mass transfer outside the model. Dullien [19] investigates the invasion front and evaporation front during drying, highlighting the effectiveness of the disconnected cluster erosion mechanism.
Huinink et al. [20] focus on multi-level modeling which is faster than through the solid matrix in isothermal drying [21–25]. Metzger et al. [26] extend a network model for isothermal drying of capillary porous media to account for viscosity in the liquid phase specially for mono-modal and bimodal pore [26]. In porous capillary materials (for capillary pore diameter of less than 0.1 µm) such as used in commercial gels and some ceramics [27–32] liquid water transport includes molecular diffusion as the mean free path of molecule is higher than the pore size. Prat [33] has modeled drying of porous media based on percolation theory (a network of pores connected by narrow throats) which validated to experimental results. As well in porous with non-hygroscopic and non-shrinking materials, water could be ignored [34–38] while equilibrium moisture isotherms are important in hygroscopic and shrinking materials which bound water is significantly [39–44]. Yiotis et al. [45] study capillarity-driven flow through macroscopic liquid films during the isothermal drying of porous materials. Their study shows that film flow is a major transport mechanism in the drying of pores. The mixture multiphase model solves for each phase [46,47]. The gas phase is modeled as a multi-component because typically the gas phase includes air and the evaporated solvent (steam/water vapor in this case) [48]. Since the gas phase is modeled as a multi-component [49], the liquid phase needs to be a multi-component phase as well [50].
In some models [15,51], as a first step, the viscous resistance of liquid water and gas is assumed to be constant throughout drying and porous inertial resistance as well [52]. In the porous media region under multiphase interaction the Spalding Evaporation/Condensation model [53], wherein the Nusselt number and Sherwood are given by the Armenante-Kirwan correlation [54] to capture the heat [55] and mass transfer, respectively [56]. Although the vaporization latent heat at 100°C is a constant (2257477 J/kg), as a trick to simulation stability in some papers the treatment of heat of formation and to improve the stability of the simulation, we set the heat of formation of liquid water is another value [57], and heat of formation of vapor is zero [58]. A stability trick is to assign the whole heat of formation to one component that takes part in the evaporation [59]. By default, both gas and liquid phases have heat of formation defined and the values can be high [60].
In order to classify drying in porous media problems [61], some papers consider four cases based on pore size and capillary pressure. In samples with large pores, and driving force is applied pressure which needs the solving of the governing equations [62]. In the case of small pores of rehydration with only capillarity effects and no significant internal evaporation one should solve the Darcy equation through porous media [63–65].
The main goal of the present work is the optimal design of porous block in the drying process and the geometric location is the principal conclusion of a similar study [66]. This article describes how to set up a multiphase model to simulate the drying of wet paper by convective heat transfer with previous porous media techniques [67]. The purpose of the work presented here is to develop a new analysis of drying and simulation of heat and mass transfer. This would have significant benefits in the design and operation of large-scale industrial drying systems [68–70]. The purpose of this paper briefly includes a build-up of a comprehensive simulation of potato drying in a variety of configurations, experimental validation, and application of MARL optimization for industrial drying for the moist bluff body inside channel flow configuration.
The purpose of the model is to analyze the details of the physics of transport mechanisms involved inside and outside the material during drying. Fig. 1 shows the schematic of the problem. First, the hot surface drying of a paper and board is considered. Paper and board are complex heterogeneous porous materials consisting of cellulose fiber, inorganic pigments water, and air. An average velocity and low ambient humidity are imposed on the incoming airflow. The properties of the porous medium, as well as the relative humidity, are configurable through parameters. To build up a mathematical model of transport by the solid, liquid, and gas streams, evaporation of water from within and outside the porous media, diffusion of water vapor driven by concentration difference, convection of water vapor and air driven by gas phase pressure difference, condensation of evaporated vapor in cooler regions of the porous media, diffusion-condensation cycles, diffusion of air, flow of liquid in the capillaries driven by capillary pressure difference or total hydraulic pressure difference, and convective heat transfer due to the movement of the liquid and gas, all occurring simultaneously. In addition to the above, paper is also a hygroscopic material, i.e., it closely interacts with the surrounding environment. As a result, the surrounding moist environment can influence the equilibrium moisture content as well as the equilibrium vapor pressure in the vapor phase in the fiber mat at any temperature. The potential driving forces that may contribute to the above physical mechanisms are schematically shown in the following Fig. 1a. The schematic of the porous media with an elemental volume and possible transport mechanisms (computational model with 3 porous moist objects) which will be used for optimization purposes is shown in Fig. 1b.
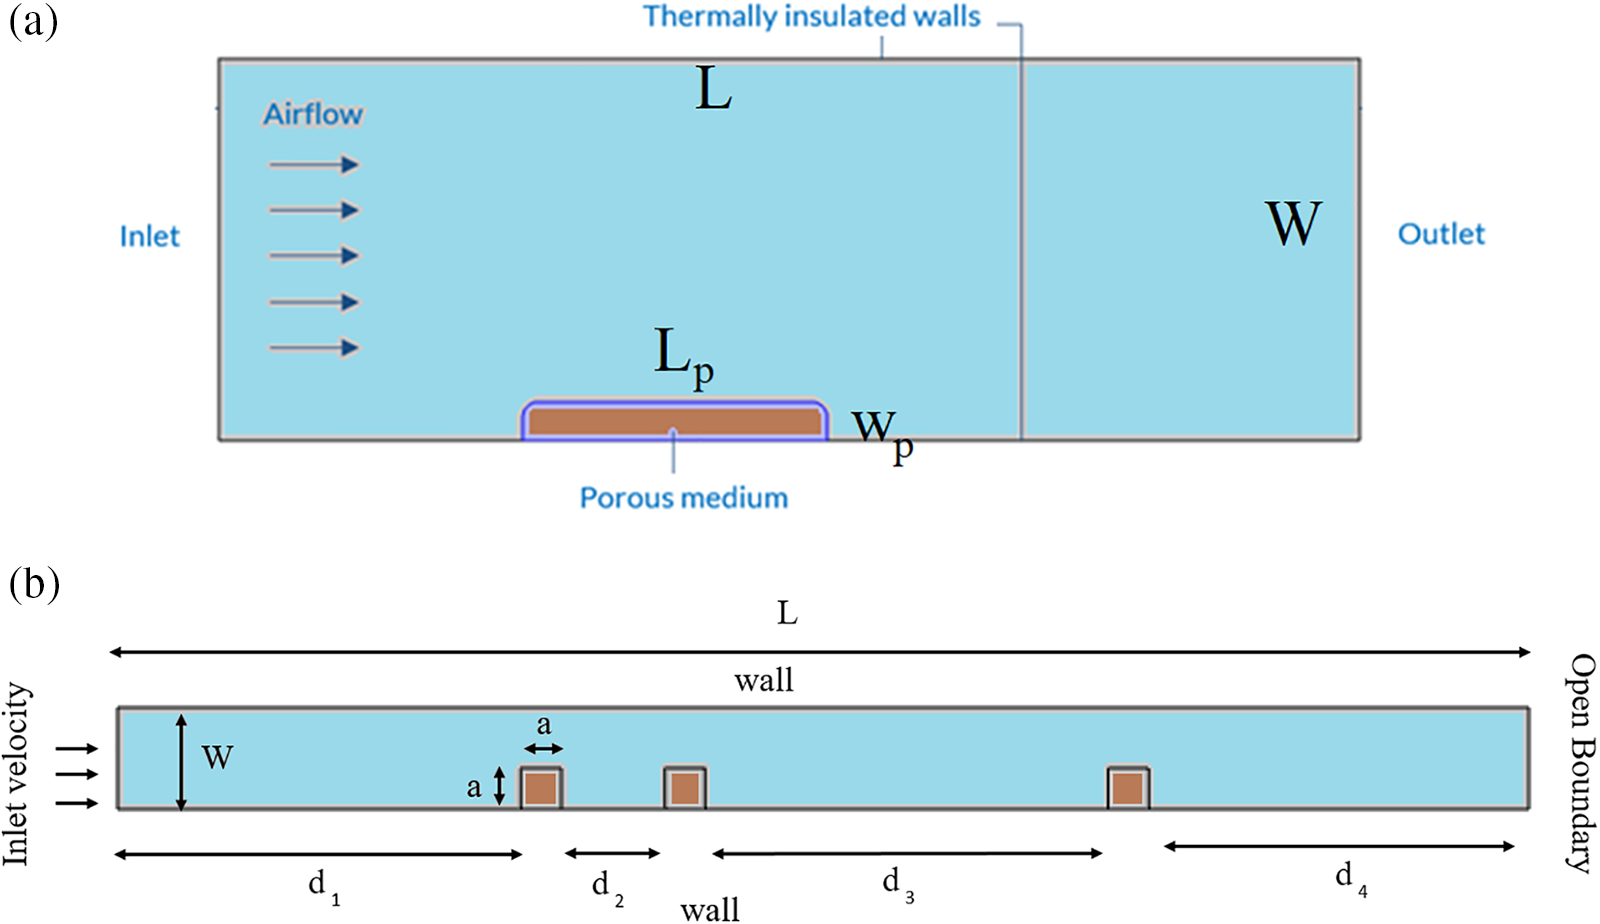
Figure 1: Schematic of the problem (a) benchmark case compared with experimental data (b) current optimization problem with geometrical parameters
The development of the model equations involves deriving the equations representing each of the transport mechanisms in an elemental volume. First, we consider only the heat and mass transfer in one dimensional (thickness dimension). In the future, this can be expanded to 2 or 3 dimensions. Considering an elemental volume at any position x (in the thickness direction) within the domain of the porous media (Fig. 1), the general conservation equation can be given as (storage (or) accumulation is equal to in – out + generation). In the following derivation, only the xy-plane is considered. The governing equations of the transient process include continuity equations in the free stream are defined by air density and the superficial velocity of the fluid as
for air, and based on the liquid flux in and out of the elemental slice can be given as follows:
for vapor where the velocity and vapor concentration are known at the inlet (uin = 1 m/s,
where the total volume is
based on the superficial velocity of gas for air,
for vapor (negative water vapor mass flow rate),
for liquid water where the vapor diffusion coefficient (
where the air temperature, the gas constant, and the density of the fluid, play a role in that definition along with the evaporation rate constant (
The transient momentum equation in the free stream is found by applying differential equations for the elemental slice, and considering the accumulation of water in the elemental volume, the continuity equation or mass balance on total moisture (liquid water + water vapor) for the elemental slice can be given as
pressure-driven bulk flow is due to pressure difference in the gas phase between elemental volumes and the air dynamic viscosity is included. The porous zone transient momentum is defined as
the pressure-driven bulk flow of gas inside porous can be given using the Darcy permeability relationship. The pressure in the elemental volume is a moisture content or saturation dependent on the elemental volume. Assuming the Darcy model with permeability correlation for each phase is defined as a function of volume fractions of water in the pore volume (water saturation, i.e.,
which is for gas flow is related to the saturated permeability when the porous media is fully wet and a relative permeability kar and was obtained from experiments.
where the density of the solid matrix, water, and air molecular weight plays a role in that definition.
The energy balance in an elemental volume can be derived using Fourier’s law of heat conduction and convective heat transfer due to the vapor and liquid movement into and out of the elemental volume as follows. The heat transfer equation in the free stream is defined as
The energy for condensation in an elemental volume is given by the net accumulation of water vapor in an elemental slice due to vapor diffusion and bulk flow. This assumes that there is no accumulation of water vapor within the gas phase in an elemental volume and if there is any net accumulation it is assumed to be condensed into liquid. The heat transfer equation in the porous zone based on effective thermophysical parameters (calculated by weighting each component) and source term with latent heat of evaporation is defined as
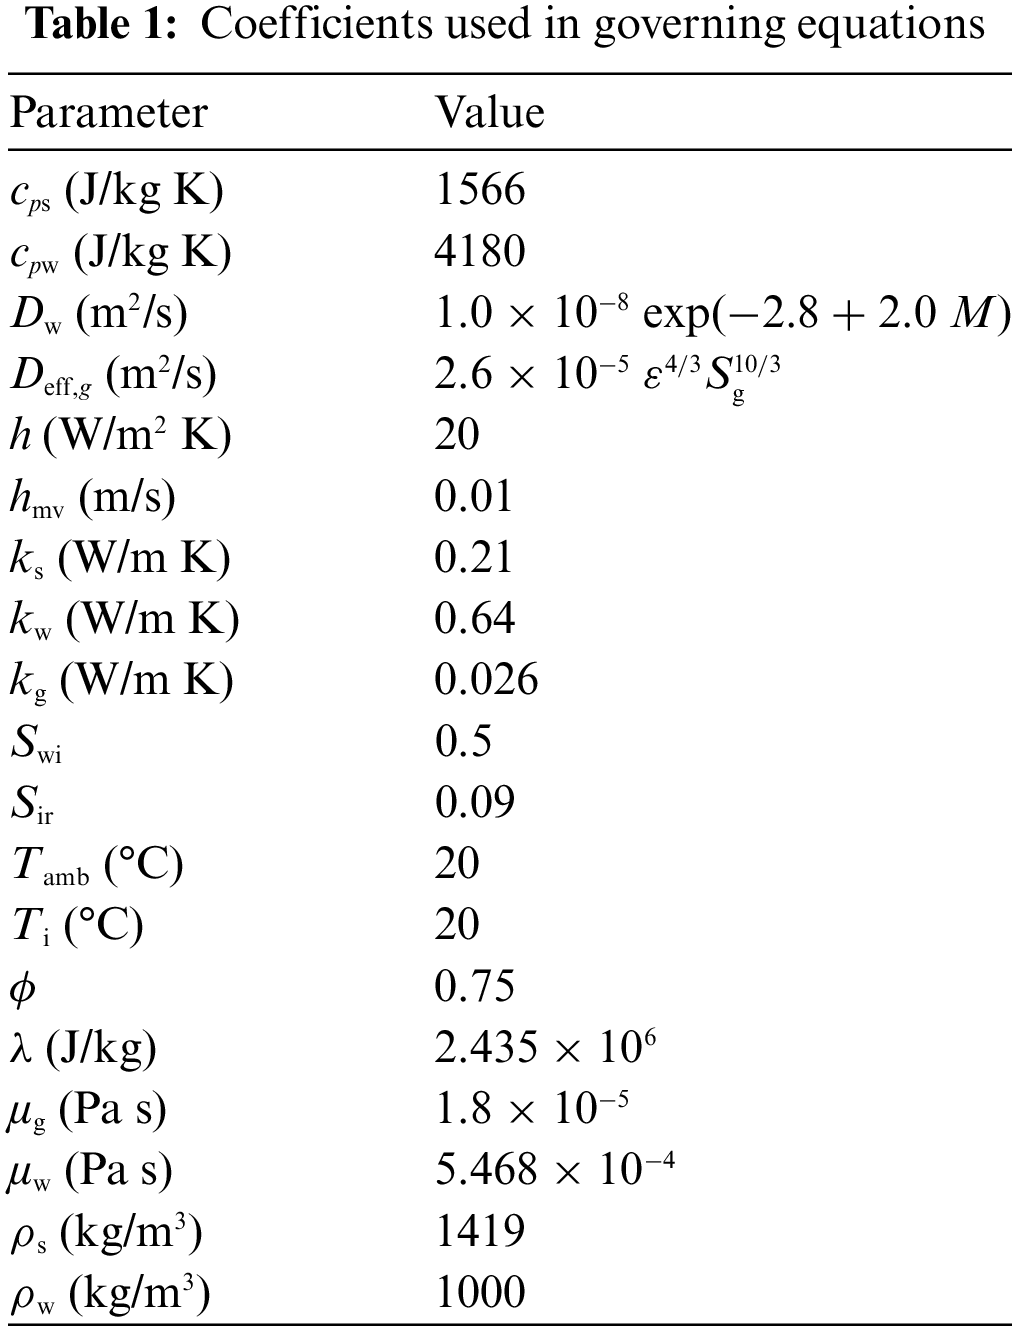
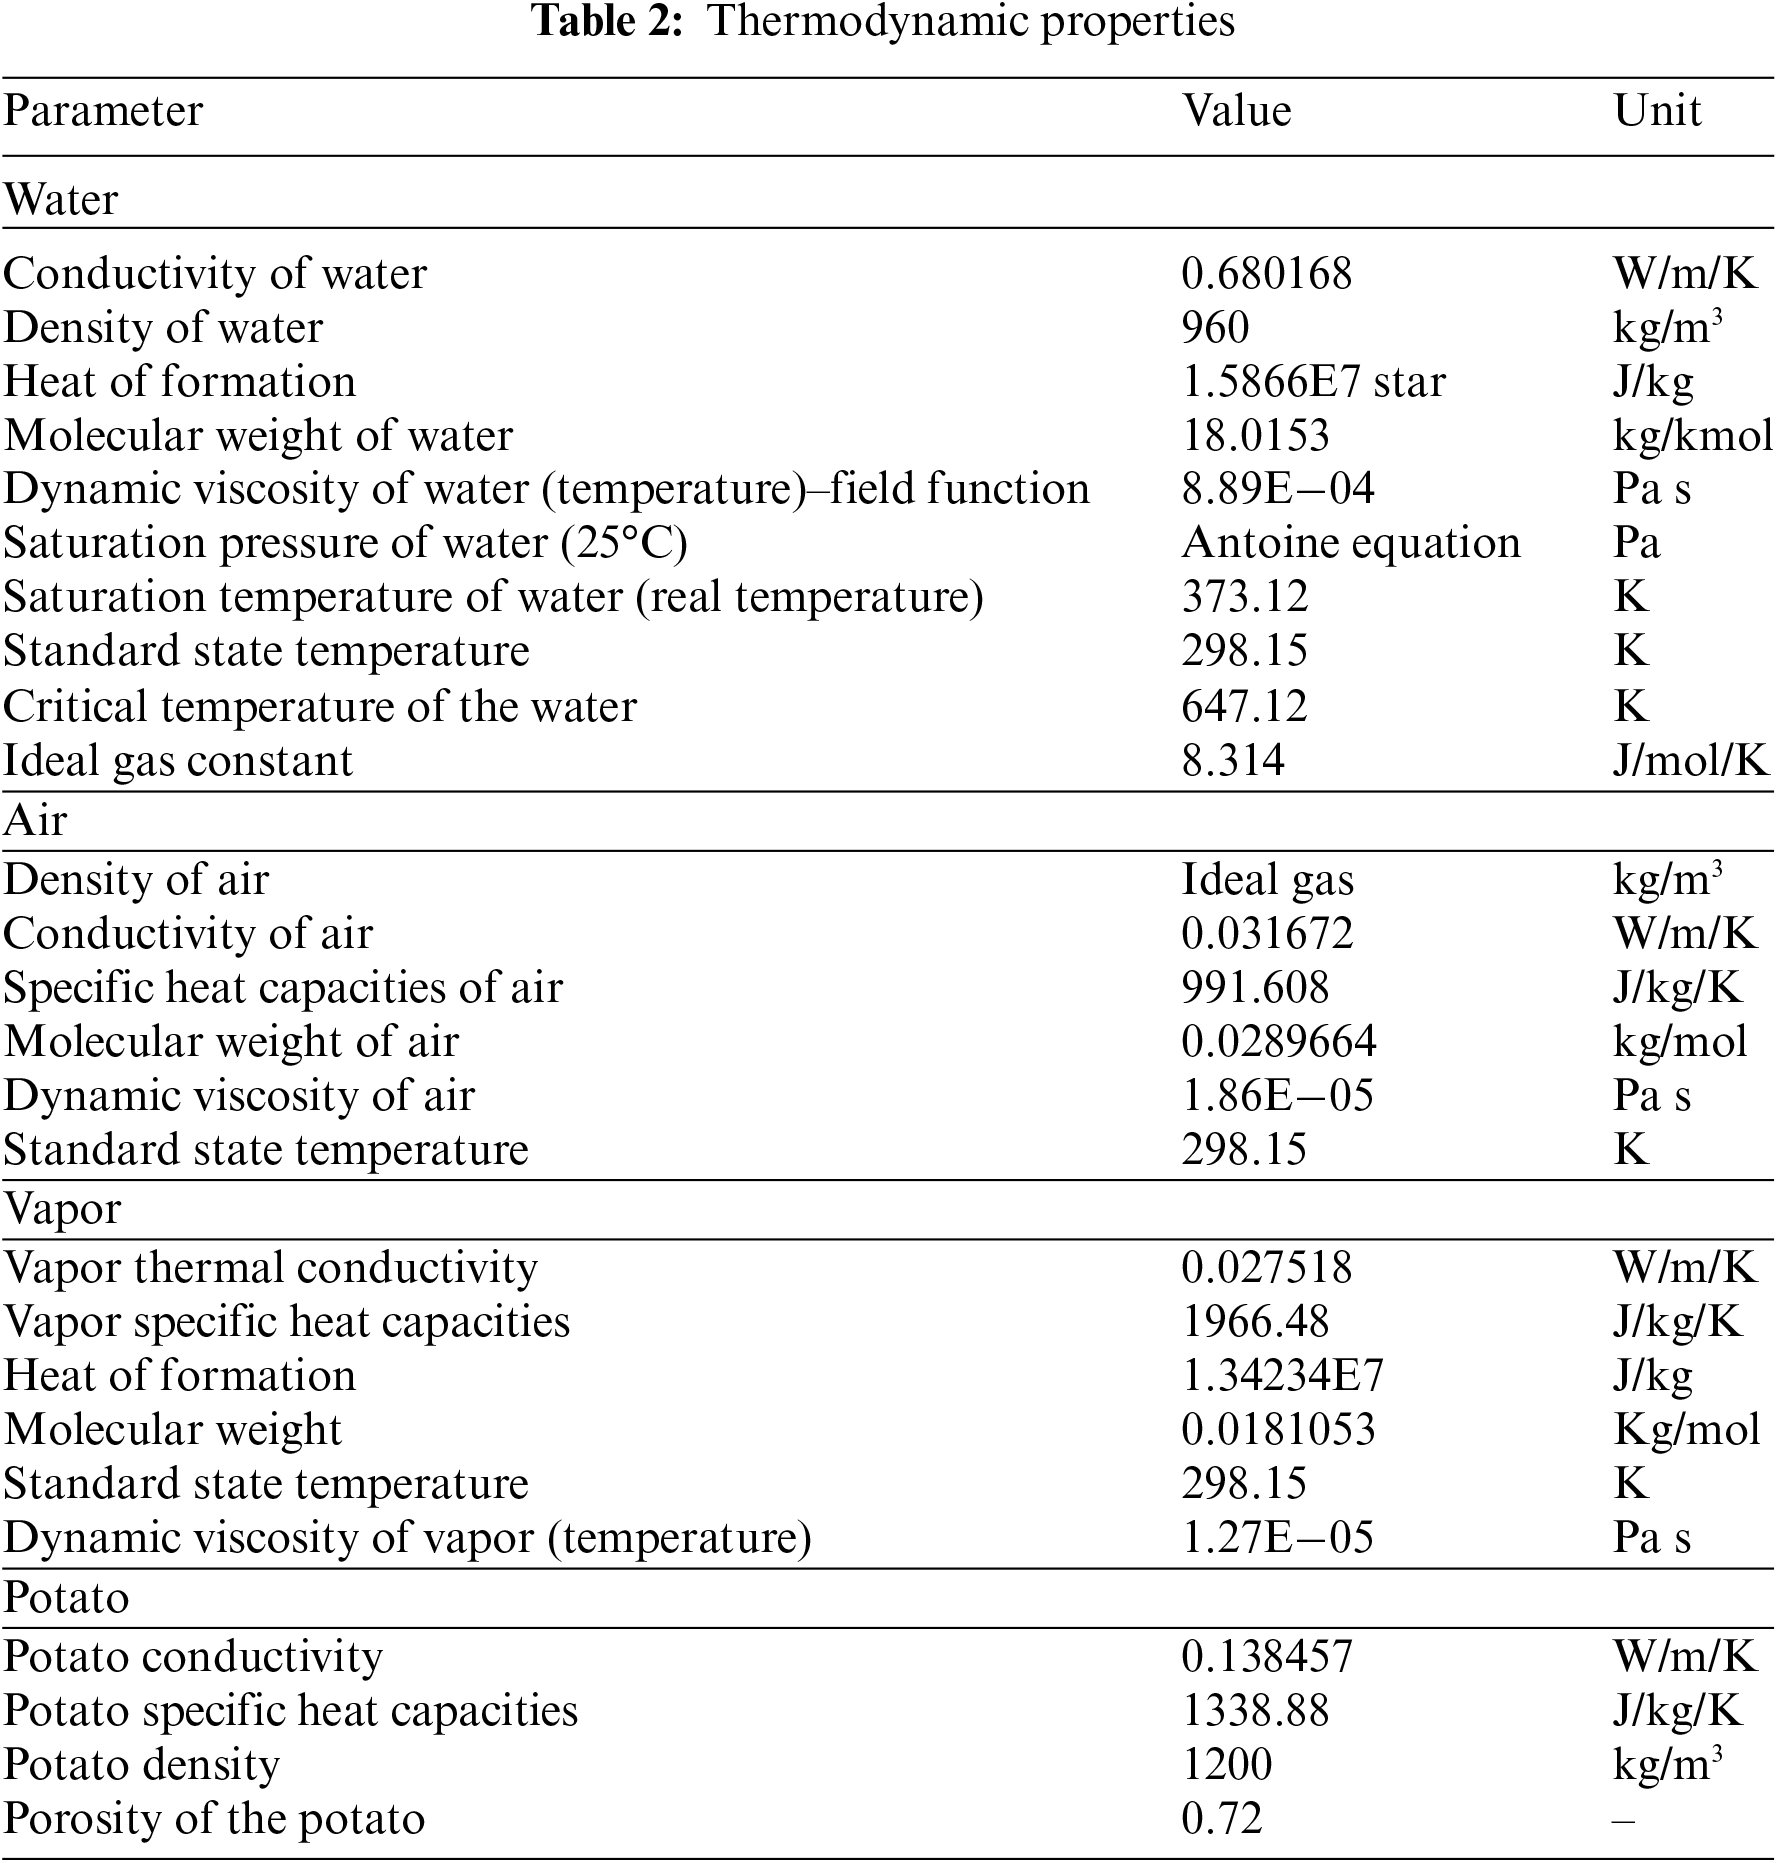
where the temperature is known at the inlet (Tin = 80°C) and other boundaries are Neuman zero flux condition. In the above equation, the liquid and vapor phases are assumed to be in thermodynamic equilibrium and hence the vapor pressure in the gas phase is given by the water-vapor saturation pressure relationship. Table 1 shows some parameters used in the simulations while Table 2 shows thermodynamically constants of the system.
Generally, in addition to the above heat and mass transfer equations, it is also important to consider the momentum balance equations for liquid and gas to solve for the velocity of the two phases. This can be considered using the Navier-Stokes equation including the viscous and inertial terms and the pressure difference and gravity. In paper drying applications, in general, at low fluid velocities, the inertial terms can be considered to be negligible. Hence, neglecting gravity, pressure terms, and viscous terms in momentum cannot make a big difference. This essentially reduces to Darcy’s for flow through porous media described earlier in equations. It should be noted again here that the liquid and gas phase permeability and capillary pressure are functions of moisture content or saturation and should be known from experimental results. The Darcy’s equation is
Darcy’s law was chosen for implementation because it is a well-established and widely used equation in fluid dynamics. It provides a simplified and practical approach to model the flow of fluids through porous media, such as the subsurface of Venus. By using Darcy’s law, researchers can simulate and analyze the movement of fluids, including the transport of heat and mass, within Venus’ atmosphere. Its application allows for a better understanding of the dynamics and behavior of the atmosphere, aiding in the study of various phenomena, such as the circulation patterns and the influence of solar radiation. In addition to the liquid and vapor phases of water, we also need to consider the mass balance for air within and outside the material. The basic assumption here, as stated earlier, is that there is counter diffusion of air and pressure-driven bulk flow of air (along with water vapor in the gas phase). Likewise, we consider local thermal equilibrium and all the solid, liquid, and gas phases are at the same temperature; the liquid water and water vapor are in thermodynamic equilibrium. Based on these assumptions, we can write the following equations. The velocity continuity at the porous interface implies that the analytical solution outside the porous media (
where
Drying can be defined as removing a solvent through evaporative mass transfer. Evaporation involves a liquid and a gas phase, so it is essentially a multiphase problem. Since evaporation can occur inside the solid (treated as porous media), the easiest approach to model this problem is using the mixture multiphase model. In order to conduct a thorough numerical simulation, first a set of simplified governing equations describing the mass conservation, momentum conservation, and energy conservation for the liquid and gas (comprising water and air). This solution later will be used to extract the Nusselt number at the boundary of the porous medium. Similar to the liquid continuity equation where we considered the water vapor flux due to diffusion (
The thermal balance (with a heat source of a mass transfer)
with symmetry boundary condition at z = 0
It can also be assumed there is no liquid accumulation at the open surface boundary and whatever liquid is able to move towards the open surface at the surface layer is being pushed out of the sheet.
which is non-dimensionalized to the
RH in the equation is the relative humidity at a given moisture content of the sheet. This gives the percent relative humidity of the surrounding atmosphere at which paper at a certain moisture content will be in equilibrium. The vapor pressure reduction is also related to the capillary pressure in unsaturated porous media and for a porous media with wettable liquid (concave meniscus). For specific types of porous media, the vapor pressure reduction relationships are also obtained from adsorption isotherms of water vapor in cellulosic paper and board materials. Then the boundary condition non-dimensionalized flux boundary condition at Z = 1.
By use of the spatial average and zero-order Hermite’s approximation analytical solution is obtained as follows:
In this part, multi-agent reinforcement learning is introduced and the other methods used (genetic algorithms, pattern search, and particle swarm optimization) are briefly explained. Genetic algorithms (GA) are a type of optimization algorithm inspired by the process of natural selection. They use a population of potential solutions and apply selection, crossover, and mutation operations to evolve and improve the solutions over generations. GAs are often used to solve complex optimization problems where traditional methods may struggle. On the other hand, multiagent reinforcement learning is a field of machine learning that focuses on training multiple agents to interact and learn from their environment. Each agent learns through trial and error, using reinforcement learning techniques such as rewards and punishments. MARL is used to study how multiple agents can collaborate or compete to achieve specific goals. Both genetic algorithms and multiagent reinforcement learning have their strengths and applications. GAs are great for optimization problems, while MARL is useful for studying complex interactions and coordination among multiple agents.
Pattern search (PS) is a local optimization method that explores the search space by iteratively moving from one point to another, searching for the best solution. It can be efficient when the search space is small or when the objective function is relatively simple. However, it may struggle with complex or high-dimensional problems, as it can get stuck in local optima. On the other hand, MARL involves multiple agents learning and interacting with their environment simultaneously. The speed of finding a solution in MARL depends on various factors, such as the complexity of the environment, the number of agents, and the learning algorithms used. In some cases, MARL can lead to faster solutions compared to pattern search, especially when dealing with complex problems that require coordination and collaboration among agents. In summary, pattern search can be faster for simple optimization problems with small search spaces, while MARL has the potential to find faster solutions for complex problems that involve multiple agents and interactions.
Particle swarm optimization (PSO) is a population-based optimization algorithm inspired by the behavior of bird flocking or fish schooling. It uses a group of particles that move through the search space, adjusting their positions based on their own best-known position and the global best-known position. PSO can be efficient in finding solutions for optimization problems, especially when the search space is large or complex. On the other hand, MARL involves multiple agents learning and interacting with their environment simultaneously. The speed of finding a solution in MARL depends on various factors, such as the complexity of the environment, the number of agents, and the learning algorithms used. In some cases, MARL can lead to faster solutions compared to PSO, especially when dealing with complex problems that require coordination and collaboration among agents. In summary, particle swarm optimization can be fast in finding solutions for optimization problems, while MARL has the potential to find faster solutions for complex problems that involve multiple agents and interactions.
As noticed in the introduction section, MARL is not trendy in the field. Therefore, a straightforward model environment (e.g., grid environment with 0.01 for the first examination is considered) is used for the study to conduct comparative experiments. In the introduction, section, a literature search of various MARL methods of the real-world situation was introduced. On the other hand, there are necessities for an intuitive interface and low computational cost optimization for communicating the environment-model and which are significant to attain the efficient method (see Fig. 2). In general, the flowchart of a MARL (Multi-Agent Reinforcement Learning) algorithm typically consists of several steps. These steps may include:
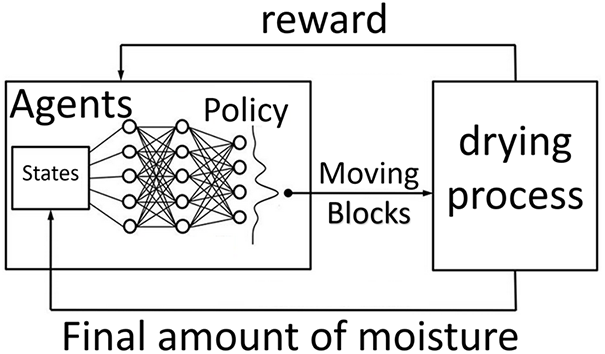
Figure 2: Flowchart of MARL used here
1. Initialization: Initializing the environment, agents, and any necessary parameters.
2. Observation: Agents observe the current state of the environment and gather relevant information.
3. Action Selection: Agents select actions based on their observations and a policy, which could be a learned policy or a predefined one.
4. Interaction: Agents interact with the environment by executing their selected actions.
5. Reward Calculation: Agents receive feedback in the form of rewards or penalties based on their actions and the state of the environment.
6. Learning: Agents update their policies based on the observed rewards and the chosen learning algorithm, such as Q-learning or Deep Q-Networks (DQN).
7. Iteration: The process of observation, action selection, interaction, reward calculation, and learning continues for multiple iterations or episodes.
The flowchart of MARL may vary depending on the specific algorithm or approach being used. It is important to refer to the specific details mentioned in the manuscript to get a more accurate understanding of the flowchart and the function of each step.
The manuscript does not explicitly mention the methodology used for computational modeling. It would be helpful to have more information or clarification from the authors regarding the specific technique employed, such as whether it utilizes the Finite Element Method or another computational approach. Understanding the methodology used is crucial for evaluating the accuracy and reliability of the computational modeling results. In this section the finite element computational tool established in a homemade code is used to solve laminar flow with mass transfer was used. Table 2 presents the geometric parameters of the problem. A convergence criterion of 10−6 is selected.
In this section, the results of the previous section are discussed and explained. For simplicity, a 2D approximation of a sheet of paper inside a tunnel is chosen as a solution domain. Dry air enters the inlet, evaporates the water present in the porous solid region, and exits through the outlet. The porous solid region is specified at 1 − ϕ volume fraction of water as an initial condition. The geometry of the problem is plotted in Fig. 1 with the parameters of Table 1. Table 2 presents the properties of water, air, and vapor respectively which are used in the current study. The preliminary data shown here indicate that the drying of porous media involves a complex balance between local heat transfer, vaporization and condensation, and liquid and vapor fluxes. This is also very much a function of the boundary conditions and the dried porous material properties.
Fig. 3 presents velocity profiles for various porous thicknesses in the tunnel. As shown thicker porous media inside the channel can change the velocity profile inside it. It can be noticed that the porous layer compresses the maximum velocity location towards the free part of the channel from the centerline. In addition, the values of velocity at the interface (relative to the maximum velocity). Besides, Fig. 3 shows the critical role of the height of the non-porous medium in the velocity profile. The above figure can be used for the calculation of boundary conditions for heat and mass transfer of any analytical solution inside the porous medium.
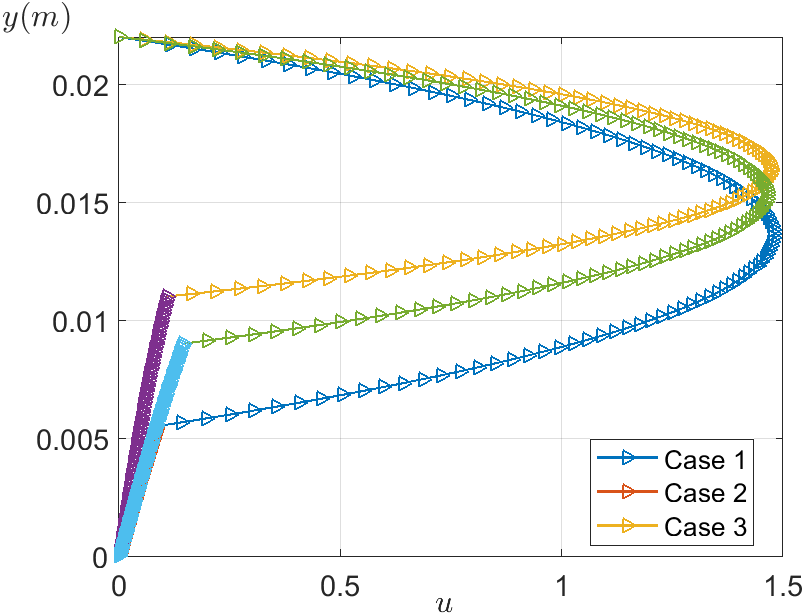
Figure 3: Velocity profiles for various porous thicknesses in the tunnel
An input relative humidity of 0% might not accurately reflect real-world conditions. Adjusting the assumed relative humidity could potentially bring the simulation results closer to the actual results. It is always important to consider environmental factors when interpreting simulation data. The convective drying of porous media modeled by the current study provides reasonable results. As revealed in Fig. 4 The number of the system increased as the velocity ratio over the porous layer increased. The velocity ratio is the velocity at the interface relative to the maximum velocity in the channel. Given the initial higher temperature of the sheet (373 K), there is no warm-up period observed. Based on those properties Schmidt Number (Molecular diffusivity) is 0.6, and Turbulent Prandtl is neglected. Given the hot surface boundary on one side there is greater conductive heat flux closer to the hot surface and then decreases along the porous layer thickness. This essentially contributes to the overall drying rate kinetics observed. The Reynolds analogy is the common model to estimate the Prandtl number when performing CFD simulations. It expresses a similarity between momentum exchange and heat transfer in a fluid. The Nusselt number, as a dimensionless word of the warmth transfer coefficient (
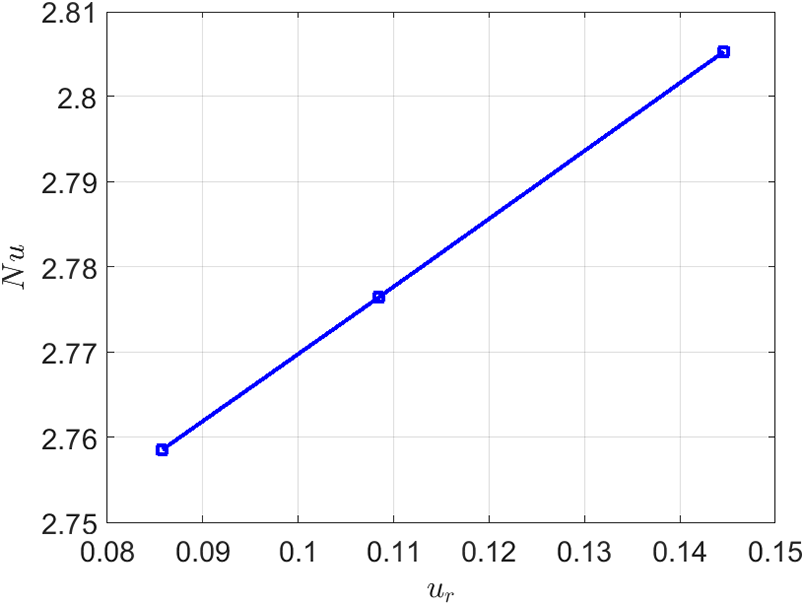
Figure 4: Nusselt number of the system as a function of velocity ratio over porous layer
It is good to mention that Fig. 1a has the same labeling of the length and height of the porous media as it is used for a benchmark of experimental setup where a slice of sample with known weight and height is used. The initial condition of the dry air in the system is RH = 0.5. Table 3 presents the geometrical parameters of the benchmark problem.
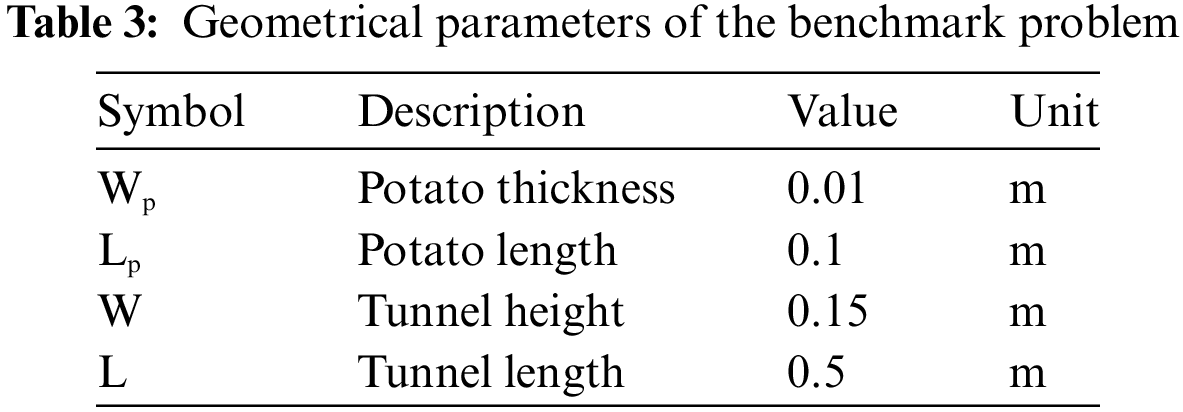
Fig. 5 provides a comparison of analytical, CFD, and experimental results. The thin layer of potato is also can be used for de-icing and defogging simulations using fluid film thin film best practices case. Results of the transient problem converged at a time fraction of 0.8 s are plotted in Fig. 5. The moisture is approximated using a forward difference technique. This shows a more gradual warming up of the porous media with the resultant constant drying rate period and a falling drying rate period. As moisture based on the solid mass is the mass of liquid water per mass of solid and the mass of liquid water equals the density of liquid water times volume of drying region times porosity times volume faction of liquid water (for the solid 1-porosity should be used) since the initial value of the moisture based on the solid mass could be higher than 1. The drying rate is also can be derived from the Fig. 5. It equals the mass loss of liquid water per drying time times surface area or moisture gradient times the mass of solid divided by surface area. The comparison shows that the current study predicts higher values of drying rate than the experimental. The plots confirm the presence of liquid flux from the hot surface side to the open surface side and the magnitude of the flux decreases as drying proceeds. After the constant rate period, the internal temperature porous medium begins to increase indicating that some of the energy transferred is being used for sensible heating. This continues until the drying rate falls to almost zero and the porous medium temperature reaches close to the air temperature.
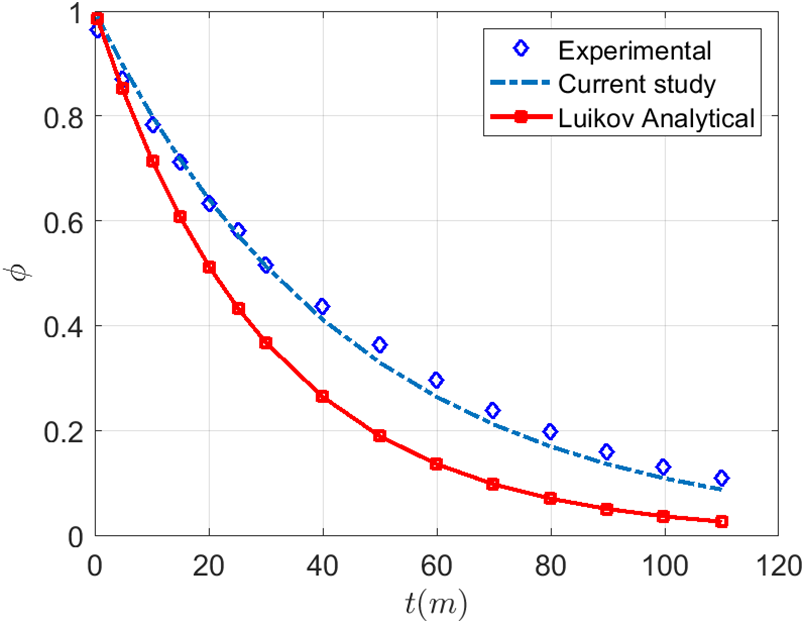
Figure 5: Comparison of analytical, CFD, and experimental results
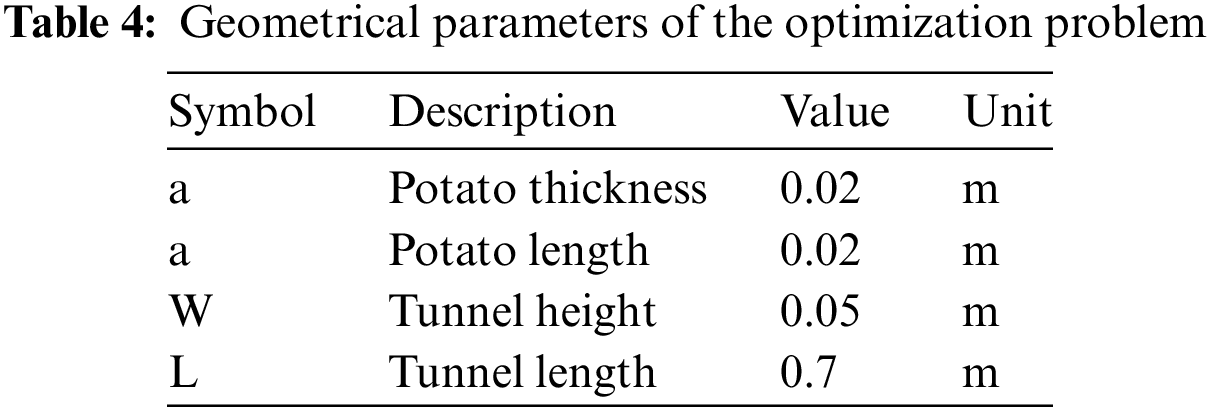
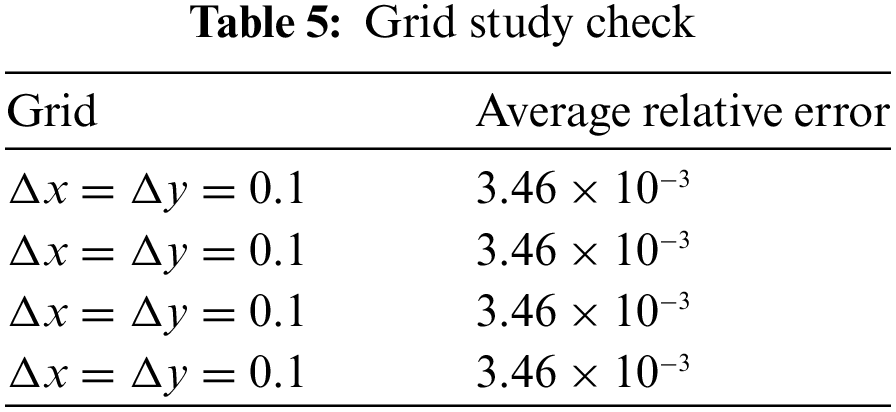
It would be helpful to have a comparison of the calculation accuracy of various algorithms in addition to the calculation speed. It would provide a more comprehensive understanding of the advantages of the MARL algorithm in a large space. Including accuracy in the comparison would give a clearer picture of how well the MARL algorithm performs compared to other algorithms. Comparing the simulation results of MARL with other algorithms for the optimal position would indeed highlight the advantages of MARL. It would provide a direct comparison to showcase how well MARL performs in finding the best position compared to other algorithms. Including this comparison would strengthen the argument for the effectiveness of MARL in optimizing positions. In Fig. 1b where different values are depicted. By considering that, we can see if it has any significant impact on the results. It is important to have accurate and consistent labeling to ensure clarity in the figures. The initial condition of the dry air in the system is RH = 0.5 and all properties same as the inlet condition while the time step is automatically controlled by software. As well the porous viscous resistance of water and gas is considered as 109. Usually, the wall treatment models (blended wall function) are used to set near-wall modeling assumptions for turbulence models but here neglected. The static temperature considered here condition (see Table 1) is the temperature of the gas if it had no ordered motion and was not flowing. The geometric parameters of the optimization problem are mentioned in Table 4. Usually, a simple grid division with 0.01 for the first examination is considered to conduct comparative experiments. Table 5 shows the grid independence test used in current computational fluid dynamics analyses to ensure that the results obtained are not dependent on the grid used for the simulation. Grid dependent solutions shown here lead to a potentially costly engineering design decisions.
PSO and GA are population-based methods that explore the search space efficiently, making them suitable for large-scale optimization problems. Pattern search, although a local optimization method, can also be effective for large problems if the search space is well-defined. MARL, on the other hand, involves multiple agents learning and interacting with their environment. The complexity of coordinating multiple agents and the increased computational requirements can make it slower compared to PSO, pattern search, and GA for large-scale problems. In summary, for large-scale problems, PSO, pattern search, and GA are generally faster than MARL due to their specific optimization approaches and computational requirements.
In terms of memory, PSO and pattern search typically require less memory compared to GA and MARL. PSO and pattern search methods usually store the positions and velocities of particles or search patterns, respectively. These methods do not require extensive memory for storing large populations or complex agent interactions. On the other hand, GA and MARL may require more memory due to their population-based or multi-agent nature. GA involves maintaining a population of individuals, which can consume more memory as the population size increases. MARL requires memory to store the state and policies of multiple agents, as well as their interactions and observations. In summary, PSO and pattern search methods generally require less memory compared to GA and MARL, which may require more memory due to their population-based or multi-agent approaches. When it comes to accuracy, let us compare the methods of particle swarm optimization (PSO), pattern search, genetic algorithms (GA), and multi-agent reinforcement learning (MARL).
In terms of accuracy, it is important to note that the performance and accuracy of these methods can vary depending on the specific problem and implementation. However, in general:
- PSO and pattern search methods are deterministic and can provide accurate results if the search space is well-defined and the objective function is smooth and continuous.
- GA is a probabilistic method that uses evolutionary principles and can provide reasonably accurate solutions, especially for optimization problems with a large search space and multiple global optima.
- MARL, being a learning-based approach, can achieve high accuracy over time as agents interact with the environment and learn optimal policies. However, achieving high accuracy in MARL can be challenging and may require a longer learning process.
In summary, PSO and pattern search methods can provide accurate results for well-defined problems, GA can achieve reasonably accurate solutions for large search spaces, and MARL can achieve high accuracy over time through learning and interaction with the environment.
The warmth and mass transfer equations for the porous moist objects are coupled with the channel movement equations by utilizing the favorable spacing to accomplish the best convective drying efficiency. The moisture reduction of the objects is higher at the optimum spacing in comparison with unsteady replication outcomes acquired from resolving the parametric variation of the unsteady coupled discipline equations. Fig. 6 presents the essays on each method used to reach the optimal point of the system. As shown in Fig. 6, the comparison of the results of various algorithms for optimizing the convective drying proves that MARL is the fastest method.
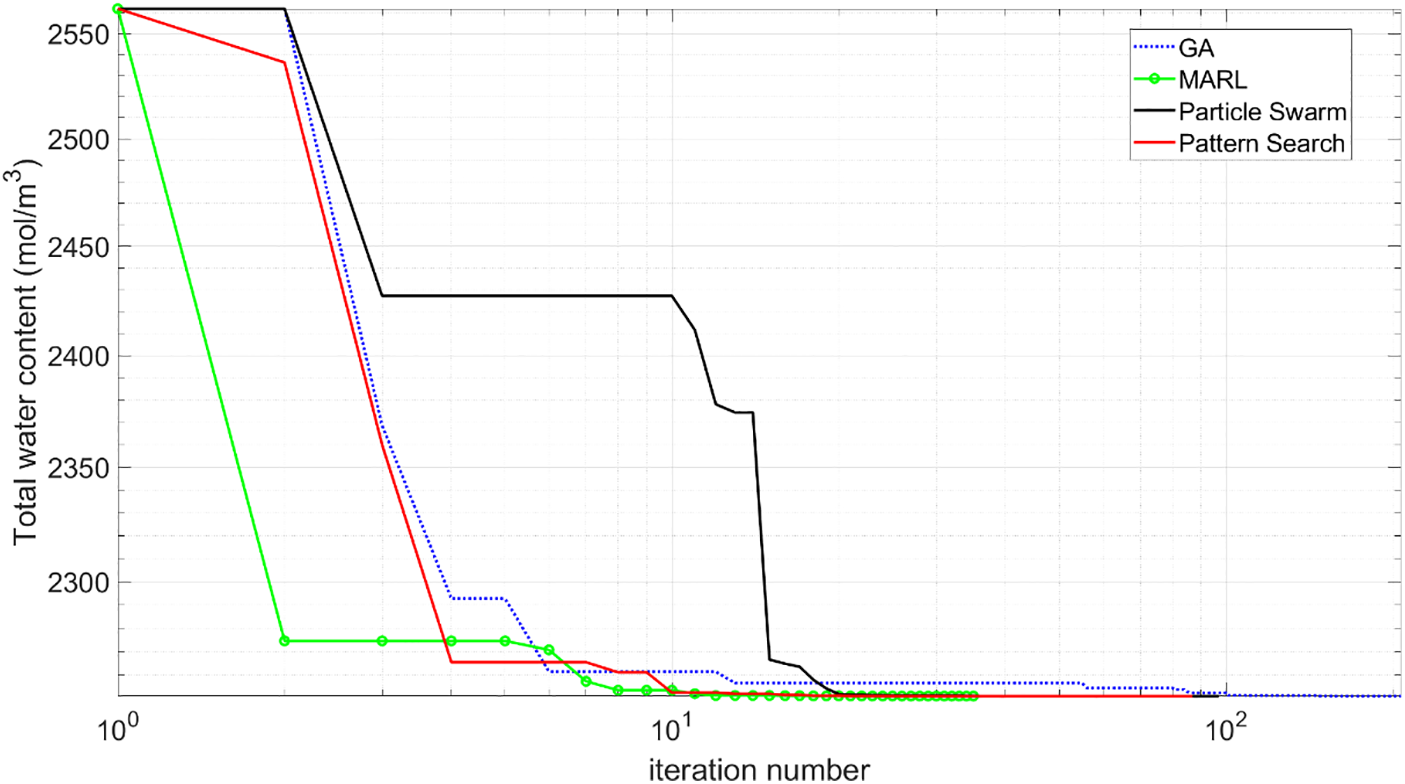
Figure 6: Comparison of the results of various algorithms on optimizing the convective drying
Even though, initially, the blocks have a uniform liquid saturation, as drying proceeds a non-uniform saturation profile develops within the blocks. This is owing to the temperature and pressure profiles within the sheet and the corresponding vaporization/condensation and liquid and vapor fluxes within the blocks. There is pressure developed within the blocks greater than the atmospheric pressure and the pressure is higher closer to the hot surface boundary and decreases towards the open surface (Fig. 6a). The temperature profile within the blocks follows a similar profile from the hot surface side to the open surface side (Fig. 7b). Fig. 7a shows the pressure contours inside the fluid and porous system. The existence of the porous domain causes the highest pressure to change in the domain. Fig. 7b shows the velocity contours in the system as a laminar confined flow. Inside the porous domain, the velocity is close to the wall (see Fig. 1b). Fig. 7c shows the temperature change in the system as a significant cooling in the whole domain. Fig. 7d illustrates the concentration (a measure of relative humidity) after 10000 s. As evaporation takes place internal to the porous media it experiences lower temperatures. The relative humidity in the porous medium goes from almost 100% at the beginning of the simulation to ambient humidity by the end. As revealed the dry air pushes the moist air out of the potato. Since moisture in the porous medium is a mix of liquid and vapor water, a measure of the drying progression is liquid saturation. As the water evaporates, it lowers the temperature of the porous medium. As shown taller porous blocks expand the moisture through the domain and have enhanced dealings with surroundings. As exposed by the augment of the distance less moisture is received at the preceding block. Additionally, the smaller distances assist the potatoes to maintain their wet content which is not most wanted in this purpose. As well the first block is affected too much by the environmental condition. Similarly, because of the moisture gradient along the horizontal (x-axis) and thickness direction (y-axis), there is also liquid and gas flow along the horizontal or x-axis, although the magnitude of these fluxes is comparatively lower.
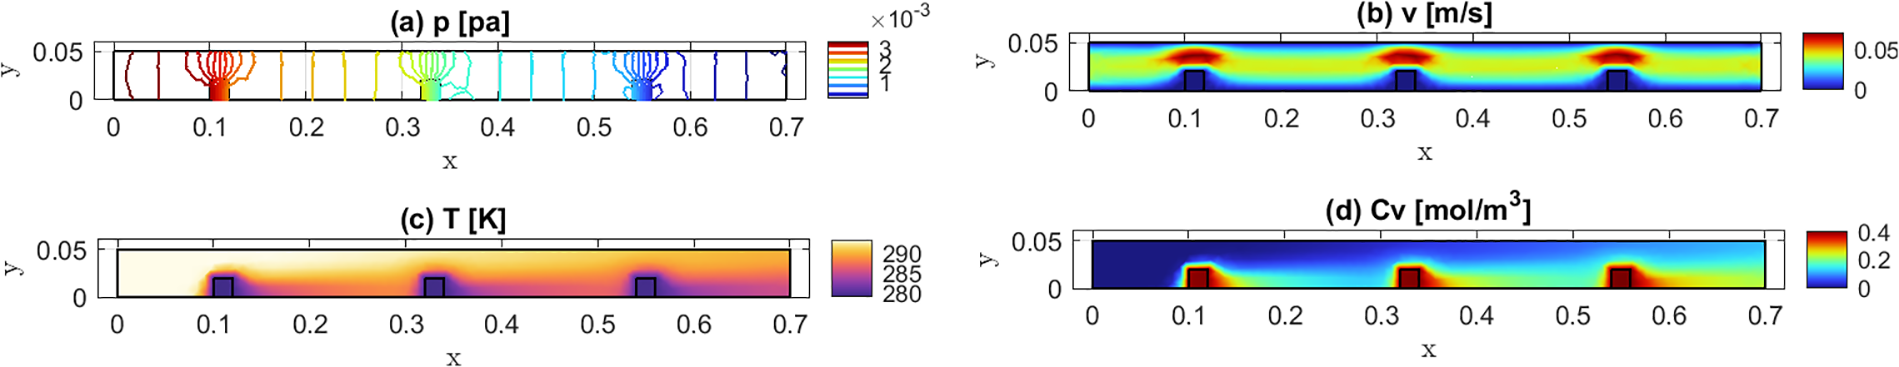
Figure 7: (a) Pressure, (b) velocity magnitude, (c) temperature, (d) vapor concentration after 10000 s for uniform arrangement
Fig. 8a shows the logarithm pressure contours inside the fluid and porous system. The existence of the porous domain at the inlet causes the highest pressure to change in the domain for optimal arrangement. Fig. 8b shows the Velocity contours in the system as a laminar confined flow. Inside the porous domain, the velocity is close to the wall (see Fig. 1b). Fig. 8c shows the temperature change in the system as a significant cooling in the whole domain after 10000 s for optimal arrangement. In comparison with Fig. 7c, the effect of arrangement can affect inlet heat to the utmost temperature variation in the system. As publicized, less inlet temperature is caused by optimal arrangement. Such dependence shows dependence on thermal balance. The internal block temperature also remains constant during the constant drying rate period indicating that all the energy transferred from the flowing air is used for evaporation of the moisture and not for sensible heating of the block. Fig. 8d illustrates the concentration (a measure of relative humidity) after 10000 s. The relative humidity in the porous medium goes from almost 100% at the beginning of the simulation to ambient humidity by the end. As shown the dry air pushes the wet air out of the potato. It is also faster near the surfaces exposed to the ambient air than inside the medium. As given away vapor concentration on the surface is decreased by increasing height. As made known, it maintains at a steady level, and following some elevation it decreases suddenly. Corresponding to the vapor saturation profile, there is also a non-uniform gas saturation profile through thickness and the horizontal axis. Corresponding to the liquid saturation profile, the next plot can show this effect (see Fig. 9).
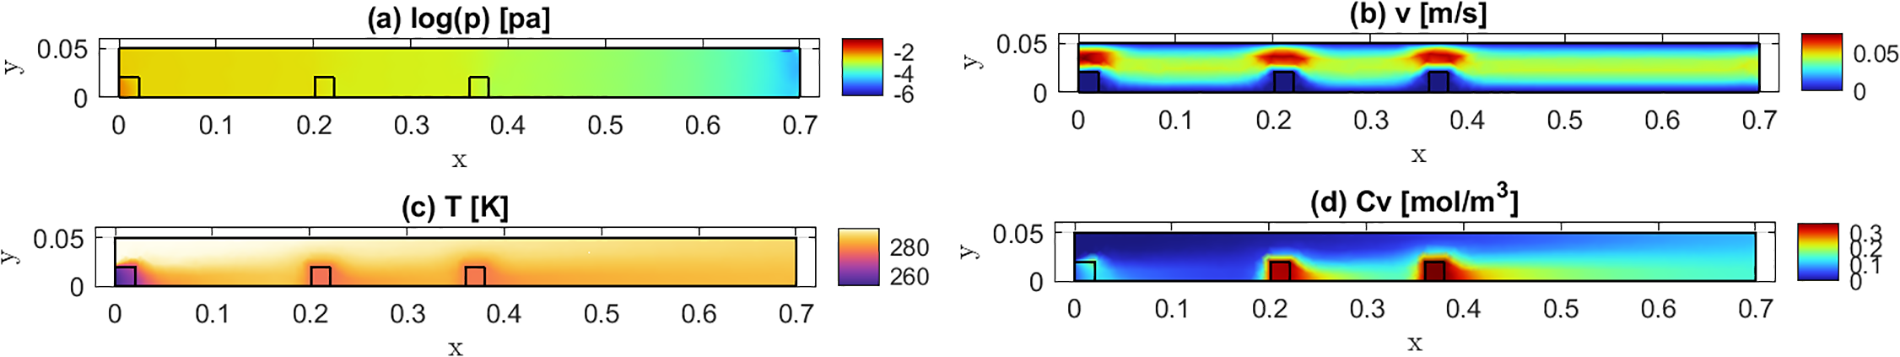
Figure 8: (a) Pressure, (b) velocity magnitude, (c) temperature, (d) vapor concentration after 10000 s for optimal arrangement
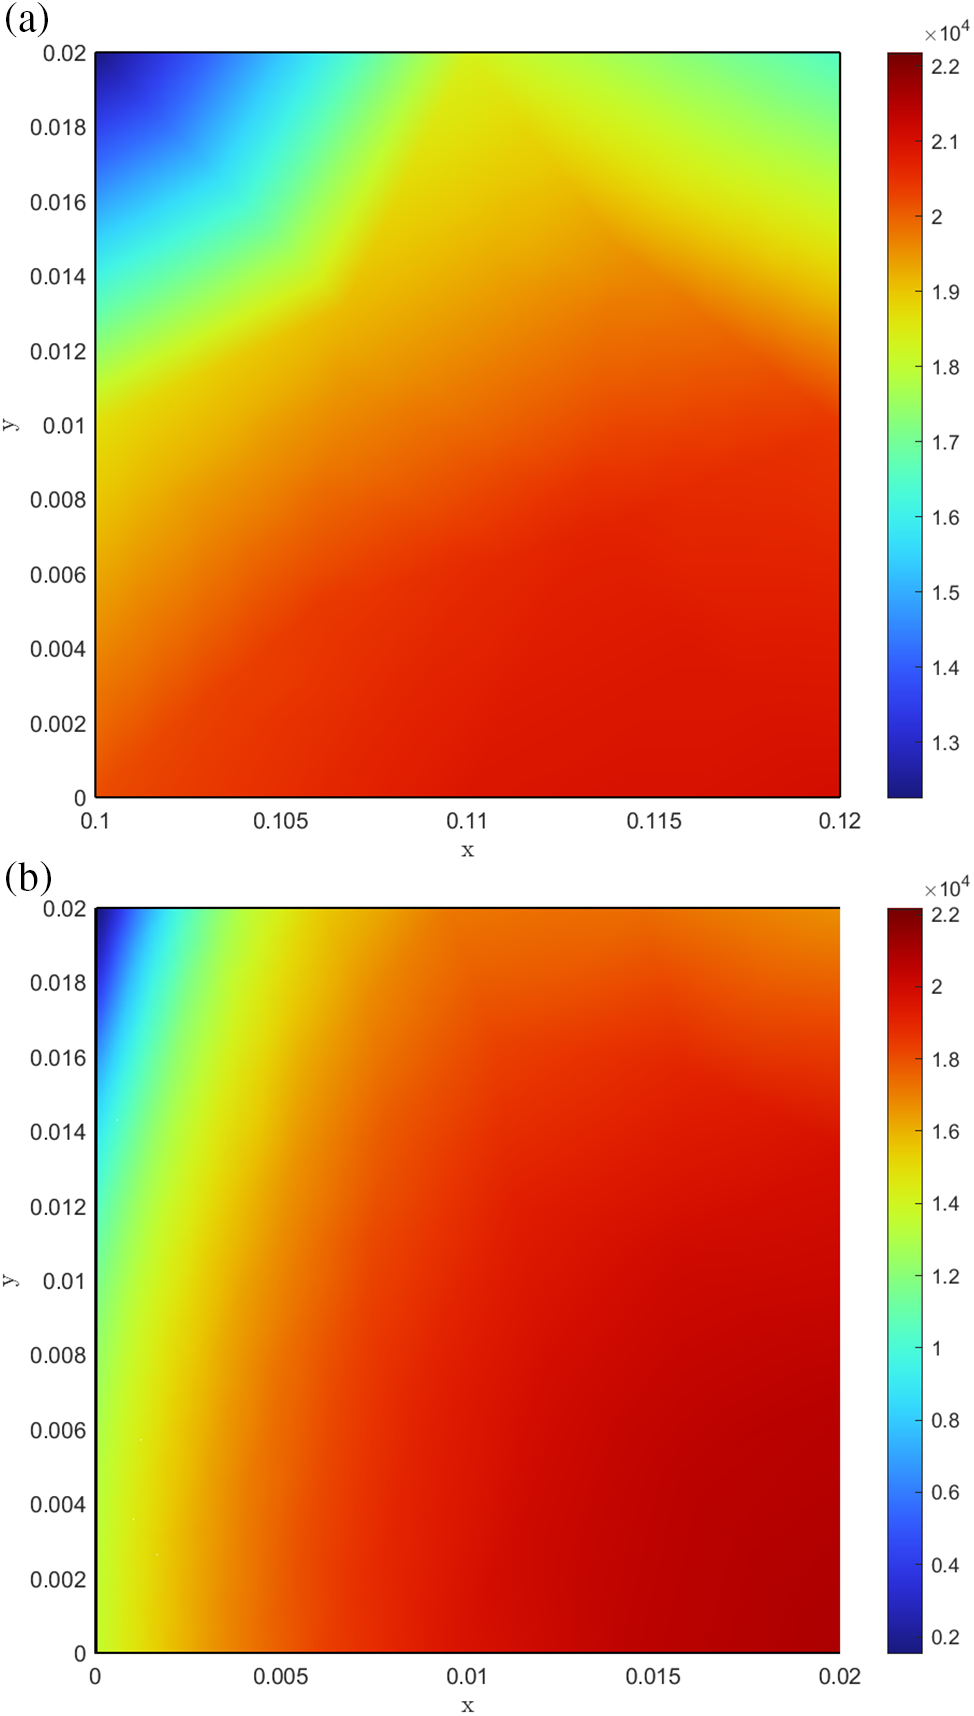
Figure 9: Liquid concentration in the first block after 10000 s for (a) uniform arrangement and (b) optimal arrangement
Velocity, volume fraction of water, evaporation rate, and mass fraction of steam are affected by each other simultaneously. Fig. 9 presents liquid concentration in the first block after 10000 s for uniform and optimal arrangement. The saturation (volume fraction of liquid water) and moisture based on the solid mass can be described as a measure of drying in the system. As shown by the increase in height from the bottom less humidity remained at the block. Liquid water and water vapor evaporated inside the porous media can be transported to the surface/outside of the porous solid region and then convected by the external air stream. Additionally, the left of the first block sooner emptied from the water while uniform arrangement helps the potato to maintain its moist.
In this study, a comprehensive model was developed for drying potatoes with the implementation of MARL to optimize slice locations. As well this research focus was on drying problems in a porous media. A multiphase model is designed to simulate the drying of potatoes by convective heat transfer with porous media techniques. To do that a set of governing equations including mass conservation, momentum conservation, and energy conservation for liquid and vapor phase in thermal equilibrium with solid matrix are solved by homemade software. The results are compared by experimental and analytical methods of drying Flow Benchmark. As demonstrated MARL has a better efficiency regarding iteration needed rather than previous methods. As well porous media increase the convective mass and heat transfer through the domain. It is renowned that this mathematical study investigated the viability, as well as the predictable shape of porous blocks, porous distribution inside the system, shrinkage, and variable diffusivity that can affect the results which are recommended for further studies. The main outcome of this research can be summarized as:
• PSO and PS methods (local and deterministic) generally require less memory compared to GA (probabilistic and population-based which uses evolutionary principles) and MARL (agent interactions).
• PSO and PS methods provide accurate results but here the objective function is not smooth even is continuous. Since GA and MARL provide reasonably accurate solutions, as current problem has a large search space and requires learning and interaction with the environment.
• PSO and PS could be faster than GA and MARL based on the initial position near the optimal solution while MARL shows its capability to understand the different flow regimes by the interaction of various agents with the environment.
To do more research here adding the slope of potatoes is recommended. If the porous medium is situated on a surface with a slight slope, it could have an impact on the calculations and modeling. The slope introduces an additional factor that needs to be considered, as it affects the flow dynamics and the distribution of fluids within the porous medium. The presence of the slope can alter the pressure gradients and flow velocities, potentially leading to variations in the transport of heat and mass. To accurately model and calculate the behavior of fluids in such a scenario, the slope of the surface would need to be incorporated into the mathematical equations and simulations. This would allow for a more precise representation of real-world conditions and improve the accuracy of the results obtained from the calculations.
Acknowledgement: Not applicable.
Funding Statement: The author received no specific funding for this study.
Author Contributions: Study conception and design; data collection; analysis and interpretation of results; draft manuscript preparation is performed by MYAJ. The author reviewed the results and approved the final version of the manuscript.
Availability of Data and Materials: All data used in the study are available upon request.
Conflicts of Interest: The author declares that he has no conflicts of interest to report regarding the present study.
References
1. Yeo, S., Lee, S., Choi, B., Oh, S. (2020). Integrate multi-agent simulation environment and multi-agent reinforcement learning (MARL) for real-world scenario. 2020 International Conference on Information and Communication Technology Convergence (ICTC), pp. 523–525. Jeju, Korea (South). https://doi.org/10.1109/ICTC49870.2020.9289369 [Google Scholar] [CrossRef]
2. Choi, H., Kim, J., Ji, C., Ihsan, U., Han, Y. et al. (2022). MARL-based optimal route control in multi-AGV warehouses. 2022 International Conference on Artificial Intelligence in Information and Communication (ICAIIC), pp. 333–338. Jeju Island, Korea. https://doi.org/10.1109/ICAIIC54071.2022.9722643 [Google Scholar] [CrossRef]
3. Jiang, B., Givigi, S., Delamer, J. (2021). A MARL approach for optimizing positions of VANET aerial base-stations on a sparse highway. IEEE Access, 9, 133989–134004. [Google Scholar]
4. Lin, X., Tang, Y., Lei, X., Xia, J., Zhou, Q. et al. (2019). MARL-based distributed cache placement for wireless networks. IEEE Access, 7, 62606–62615. [Google Scholar]
5. Do, S., Lee, C. (2021). Multi-agent reinforcement learning in a large scale environment via supervisory network and curriculum learning. 2021 21st International Conference on Control, Automation and Systems (ICCAS), pp. 207–210. Jeju, Korea. https://doi.org/10.23919/ICCAS52745.2021.9649915 [Google Scholar] [CrossRef]
6. Khatami, I., Abdollahzadeh Jamalabadi, M. Y. (2021). Optimal design of microphonearray in a planar circular configuration by genetic algorithm enhanced beamforming. Journal of Thermal Analysis and Calorimetry, 145, 18171825. [Google Scholar]
7. Li, C. G., Wang, M., Yuan, Q. N. (2008). A multi-agent reinforcement learning using actor-critic methods. 2008 International Conference on Machine Learning and Cybernetics, pp. 878–882. Kunming, China. https://doi.org/10.1109/ICMLC.2008.4620528 [Google Scholar] [CrossRef]
8. Sass, A’., Kummer, A., Abonyi, J. (2022). Multi-agent reinforcement learning-based exploration of optimal operation strategies of semi-batch reactors. Computers & Chemical Engineering, 162, 107819. [Google Scholar]
9. Bayer, D., Pruckner, M. (2022). Enhancing the performance of multi-agent reinforcement learning for controlling HVAC systems. 2022 IEEE Conference on Technologies for Sustainability (SusTech), pp. 187–194. Corona, CA, USA. https://doi.org/10.1109/SusTech53338.2022.9794179 [Google Scholar] [CrossRef]
10. Li, J., Li, Y., Yu, T. (2021). An optimal coordinated proton exchange membrane fuel cell heat management method based on large-scale multi-agent deep reinforcement learning. Energy Reports, 7, 6054–6068. [Google Scholar]
11. Fu, Q., Chen, X., Ma, S., Fang, N., Xing, B. et al. (2022). Optimal control method of HVAC based on multi-agent deep reinforcement learning. Energy and Buildings, 270, 112284. [Google Scholar]
12. Alqahtani, M., Scott, M., Hu, M. (2022). Dynamic energy scheduling and routing of a large fleet of electric vehicles using multi-agent reinforcement learning. Computers & Industrial Engineering, 169, 108180. [Google Scholar]
13. Alagha, A., Singh, S., Mizouni, R., Bentahar, J., Otrok, H. (2022). Target localization using multi-agent deep reinforcement learning with proximal policy optimization. Future Generation Computer Systems, 136, 342–357. [Google Scholar]
14. Wilk, P., Wang, N., Li, J. (2022). A multi-agent deep reinforcement learning based energy management for behind-the-meter resources. The Electricity Journal, 35, 107129. [Google Scholar]
15. Selimefendigil, F., Coban, S., Öztop, H. (2022). Optimization of convective drying performance of multiple porous moist objects in a 3D channel. International Journal of Thermal Sciences, 172, 107286. [Google Scholar]
16. Bear, J. (1988). Dynamics of fluids in porous media. USA: Dover Publications. [Google Scholar]
17. Beyhaghi, S., Xu, Z., Pillai, K. M. (2016). Achieving the inside–outside coupling during network simulation of isothermal drying of a porous medium in a turbulent flow. Transport in Porous Media, 114, 823–842. [Google Scholar]
18. Beyhaghi, S., Geoffroy, S., Prat, M., Pillai, K. M. (2014). Wicking and evaporation of liquids in porous wicks: A simple analytical approach to optimization of wick design. AIChE Journal, 60(5), 1930–1940. [Google Scholar]
19. Dullien, F. A. (1991). Porous media: Fluid transport and pore structure. UK: Academic Press. [Google Scholar]
20. Huinink, H. P., Pel, L., Michels, M., Prat, M. (2002). Drying processes in the presence of temperature gradients-pore-scale modeling. European Physical Journal E, 9, 487–498. [Google Scholar]
21. Jayas, D. S., Cenkowski, S., Pabis, S., Muir, W. E. (1991). Review of thin-layer drying and wetting equations. Drying Technology, 9(3), 551–588. [Google Scholar]
22. Laurindo, J. B., Prat, M. (1996). Numerical and experimental network study of evaporation in capillary porous media-phase distributions. Chemical Engineering Science, 51(23), 5171–5185. [Google Scholar]
23. Laurindo, J. B., Prat, M. (1998). Numerical and experimental network study of evaporation in capillary porous media-drying rates. Chemical Engineering Science, 53(12), 2257–2269. [Google Scholar]
24. Lee, T., Mateescu, D. (1998). Experimental and numerical investigation of 2-D backward-facing step flow. Journal of Fluids and Structures, 12, 703–716. [Google Scholar]
25. Mao, X., Wang, S., Shimai, S. (2008). Porous ceramics with tri-modal pores prepared by foaming and starch consolidation. Ceramics International, 34(1), 107–112. [Google Scholar]
26. Metzger, T., Irawan, A., Tsotsas, E. (2007). Isothermal drying of pore networks: Influence of friction for different pore structures. Drying Technology, 25, 49–57. [Google Scholar]
27. Metzger, T., Tsostas, E. (2008). Viscous stabilitization of drying front: Three-dimensional pore network simulations. Chemical Engineering Research and Design, 86, 739–744. [Google Scholar]
28. Muralidhar, K., Verghese, M., Pillai, K. M. (1993). Application of an operator-splitting algorithm for advection-diffusion problems. Numerical Heat Transfer, Part A: Applications, 23, 99–113. [Google Scholar]
29. Nowicki, S. C., Davis, H. T. (1992). Microscopic determination of transport parameters in drying porous media. Drying Technology, 10(4), 925–946. [Google Scholar]
30. Patankar, S. V. (1980). Numerical heat transfer and fluid flow. UK: Taylor & Francis. [Google Scholar]
31. Pillai, K. M., Prat, M., Marcoux, M. (2009). A study on slow evaporation of liquids in a dual-porosity porous medium using square network model. International Jorunal of Heat and Mass Transfer, 52, 1643–1656. [Google Scholar]
32. Prabhanjan, D. G., Ramswamy, H. S., Raghavan, G. S. V. (1995). Microwave-assisted convective air drying of thin layer carrots. Journal of Food Engineering, 25, 283–293. [Google Scholar]
33. Prat, M. (1993). Percolation model of drying under isothermal conditions in porous media. International Journal of Multiphase Flow, 19(4), 691–704. [Google Scholar]
34. Prat, M. (2007). On the influence of pore shape, contact angle and film flows on drying of capillary porous media. International Journal of Heat and Mass Transfer, 50, 1455–1468. [Google Scholar]
35. Quintard, M., Whitaker, S. (1993). Transport in ordered and disordered porous media: Volume-averaged equations, closure problems, and comparison with experiment. Chemical Engineering Science, 48(14), 2537–2564. [Google Scholar]
36. Sander, A. (2007). Thin-layer drying of porous materials: Selection of the appropriate mathematical model and relationships between thin-layer models parameters. Chemical Engineering and Processing, 46, 44–1331. [Google Scholar]
37. Shaeri, M. R. (2012). Investigating regular pore-network models to predict drying in porous media. USA: Milwaukee. [Google Scholar]
38. Shaeri, M. R., Beyhaghi, S., Pillai, K. M. (2012). Drying of a porous mediu, with multiple open 119 sides using a pore-network model simulation. International Communications in Heat and Mass Transfer, 39(9), 1320–1324. [Google Scholar]
39. Shaeri, M. R., Beyhaghi, S., Pillai, K. M. (2013). On applying an external-flow driven mass transfer boundary condition to simulate drying from a pore-network model. International Journal of Heat and Mass Transfer, 57, 331–344. [Google Scholar]
40. Suzuki, K., Ikari, K., Imai, H. (2003). Synthesis of mesoporous silica foams with hierarchical trimodal pore structures. Journal of Materials Chemistry, 13, 1812–1816. [Google Scholar]
41. Tsilingiris, P. (2008). Thermophysical and transport properties of humid air at temperature range between 0 and 100 °C. Energy Conversion and Management, 49, 1098–1110. [Google Scholar]
42. Vafai, K. (2015). Handbook of porous media, 3rd edition. USA: CRC Press. [Google Scholar]
43. Versteeg, H. K., Malalasekera, W. (2007). An introduction to computational fluid dynamics-the finite volume method, 2nd edition. UK: Pearson. Wikipedi, 2016. [Google Scholar]
44. Xu, Z., Pillai, K. M. (2016). Analyzing slow drying in a porous medium placed adjacent to laminar airflow using a pore-network model. Numerical Heat Transfer, Part A: Applications, 70(11), 1213–1231. [Google Scholar]
45. Yiotis, A. G. B. A. G., Stubos, A. K., Tsimpanogiannis, I. N., Yortsos, Y. C. (2004). Effect of 120 liquid films on the drying of porous media. AIChE Journal, 50, 2721–2737. [Google Scholar]
46. Yiotis, A. G., Boudouvis, A. G. (2003). Effect of liquid films on the isothermal drying of porous media. Physical Review E, 63(3), 037303. [Google Scholar]
47. Yiotis, A. G., Tsimpanogiannis, I. N. (2007). Coupling between external and internal mass transfer drying of a porous medium. Water Resource Research, 43(6), W06403. [Google Scholar]
48. Zenyuk, I. V., Medicib, E., Allen, J., Web, A. Z. (2015). Coupling continuum and pore-network models for polymer-electrolyte fuel cells. International Journal of Hydrogen Energy, 40(46), 16831–16845. [Google Scholar]
49. Datta, A. (2007). Porous media approaches to studying simultaneous heat and mass transfer in food processes. I: Problem formulations. Journal of Food Engineering, 80(1), 80–95. https://doi.org/10.1016/j.jfoodeng.2006.05.013 [Google Scholar] [CrossRef]
50. Datta, A. (2007). Porous media approaches to studying simultaneous heat and mass transfer in food processes. II: Property data and representative results. Journal of Food Engineering, 80(1), 96–110. https://doi.org/10.1016/j.jfoodeng.2006.05.012 [Google Scholar] [CrossRef]
51. Balhoff, M. T., Thompson, K. E., Hjortsø, M. (2007). Coupling pore-scale networks to continuum-scale models of porous media. Computers & Geosciences, 33(3), 393–410. https://doi.org/10.1016/j.cageo.2006.05.012 [Google Scholar] [CrossRef]
52. Fan, K., Chen, L., He, J., Yan, F. (2014). Characterization of thin layer hot air drying of sweet potatoes (Ipomoea batatas L.) slices. Journal of Food Processing and Preservation, 39(6), 1361–1371. https://doi.org/10.1111/jfpp.12355 [Google Scholar] [CrossRef]
53. Gasa, S., Sibanda, S., Workneh, T. S., Laing, M., Kassim, A. (2022). Thin-layer modelling of sweet potato slices drying under naturally-ventilated warm air by solar-venturi dryer. Heliyon, 8(2), e08949. https://doi.org/10.1016/j.heliyon.2022.e08949 [Google Scholar] [PubMed] [CrossRef]
54. Gawande, H., Arora, S., Singh, A., Sharma, V. (2022). Process optimization for production of spray-dried buffalo milk protein co-precipitate with enhanced solubility. Applied Food Research, 2(1), 100062. https://doi.org/10.1016/j.afres.2022.100062 [Google Scholar] [CrossRef]
55. Gomide, A. I., Monteiro, R. L., Laurindo, J. B. (2022). Impact of the power density on the physical properties, starch structure, and acceptability of oil-free potato chips dehydrated by microwave vacuum drying. LWT, 155, 112917. https://doi.org/10.1016/j.lwt.2021.112917 [Google Scholar] [CrossRef]
56. Guedes, J. S., Santos, K. C., Castanha, N., Rojas, M. L., Matta Junior, M. D. et al. (2021). Structural modification on potato tissue and starch using ethanol pre-treatment and drying process. Food Structure, 29, 100202. https://doi.org/10.1016/j.foostr.2021.100202 [Google Scholar] [CrossRef]
57. Halder, A., Dhall, A., Datta, A. K. (2010). Modeling transport in porous media with phase change: Applications to food processing. Journal of Heat Transfer, 133(3), 031010. https://doi.org/10.1115/1.4002463 [Google Scholar] [CrossRef]
58. Ishibashi, R., Numata, T., Tanigawa, H., Tsuruta, T. (2022). In-situ measurements of drying and shrinkage characteristics during microwave vacuum drying of radish and potato. Journal of Food Engineering, 323, 110988. https://doi.org/10.1016/j.jfoodeng.2022.110988 [Google Scholar] [CrossRef]
59. Li, C., Chen, Y., Zhang, X., Mozafari, G., Fang, Z. et al. (2022). Exergy analysis and optimisation of an industrial-scale circulation counter-flow paddy drying process. Energy, 251, 123901. https://doi.org/10.1016/j.energy.2022.123901 [Google Scholar] [CrossRef]
60. Liu, Q., Zhang, R., Xue, H., Bi, Y., Li, L. et al. (2022). Ozone controls potato dry rot development and diacetoxyscirpenol accumulation by targeting the cell membrane and affecting the growth of Fusarium sulphureus. Physiological and Molecular Plant Pathology, 118, 101785. https://doi.org/10.1016/j.pmpp.2021.101785 [Google Scholar] [CrossRef]
61. Luo, A., Zhang, H., Turner, K. T. (2022). Machine learning-based optimization of the design of composite pillars for dry adhesives. Extreme Mechanics Letters, 54, 101695. https://doi.org/10.1016/j.eml.2022.101695 [Google Scholar] [CrossRef]
62. Masud, M. H., Himel, H. H., Arefin, A. M., Ananno, A. A., Rashid, M. et al. (2021). Mathematical modelling and exergo-environmental analysis of drying potato samples in a waste heat-based convective dryer. Environmental Challenges, 5, 100372. https://doi.org/10.1016/j.envc.2021.100372 [Google Scholar] [CrossRef]
63. Monteiro, R. L., Oliveira de Moraes, J., Gomide, A. I., Mattar Carciofi, B. A., Laurindo, J. B. (2022). Temperature control for high-quality oil-free sweet potato CHIPS produced by microwave rotary drying under vacuum. LWT, 157, 113047. https://doi.org/10.1016/j.lwt.2021.113047 [Google Scholar] [CrossRef]
64. Nanvakenari, S., Movagharnejad, K., Latifi, A. (2022). Multi-objective optimization of hybrid microwave-fluidized bed drying conditions of rice using response surface methodology. Journal of Stored Products Research, 97, 101956. https://doi.org/10.1016/j.jspr.2022.101956 [Google Scholar] [CrossRef]
65. Porwal, O. (2022). Box behnken design based formulation optimization and characterization of spray dried rutin loaded nanosuspension: State of the art. South African Journal of Botany, 149, 807–815. https://doi.org/10.1016/j.sajb.2022.04.028 [Google Scholar] [CrossRef]
66. Rawat, K., Kumari, A., Kumar, R., Ahlawat, P., Sindhu, S. C. (2022). Spray-dried lassi powder: Process optimisation using RSM and physicochemical properties during storage at room and refrigerated temperature. International Dairy Journal, 131, 105374. https://doi.org/10.1016/j.idairyj.2022.105374 [Google Scholar] [CrossRef]
67. Shrivastava, A., Tripathi, A. D., Paul, V., Chandra Rai, D. (2021). Optimization of spray drying parameters for custard apple (Annona squamosa L.) pulp powder development using response surface methodology (RSM) with improved physicochemical attributes and phytonutrients. LWT, 151, 112091. https://doi.org/10.1016/j.lwt.2021.112091 [Google Scholar] [CrossRef]
68. Sun, L., Zhang, P., Zheng, X., Cai, J., Bai, J. (2021). Three-dimensional morphological changes of potato slices during the drying process. Current Research in Food Science, 4, 910–916. https://doi.org/10.1016/j.crfs.2021.11.009 [Google Scholar] [PubMed] [CrossRef]
69. Sun, Q., Song, X., Arun, S, M., Zhang, L., Yu, X. et al. (2022). Effects of blanching drying methods on the structure and physicochemical properties of starch in sweet potato slices. Food Hydrocolloids, 127, 107543. https://doi.org/10.1016/j.foodhyd.2022.107543 [Google Scholar] [CrossRef]
70. Xue, Q., Miao, K., Yu, Y., Li, Z. (2022). A novel method for vacuum belt drying process optimization of licorice. Journal of Food Engineering, 328, 111075. https://doi.org/10.1016/j.jfoodeng.2022.111075 [Google Scholar] [CrossRef]
Cite This Article
 Copyright © 2024 The Author(s). Published by Tech Science Press.
This work is licensed under a Creative Commons Attribution 4.0 International License , which permits unrestricted use, distribution, and reproduction in any medium, provided the original work is properly cited.
 Downloads
 Citation Tools