
 Submit a Paper
 Propose a Special lssue
 Open Access
ARTICLE
Artificial Neural Network Modeling for Predicting Thermal Conductivity of EG/Water-Based CNC Nanofluid for Engine Cooling Using Different Activation Functions
1 Faculty of Computing, Universiti Malaysia Pahang Al-Sultan Abdullah, Pekan, Pahang, 26600, Malaysia
2 Faculty of Mechanical and Automotive Engineering Technology, Universiti Malaysia Pahang Al-Sultan Abdullah, Pekan, Pahang, 26600, Malaysia
3 Department of Management and Information Technology, St. Francis College, 179 Livingston St, Brooklyn, NY, 11201, USA
4 Dell Technologies, Data Analytics, and Automation, Bukit Tengah, Bukit Mertajam, 14000, Malaysia
5 Department of Computer Science, Adrian College, Adrian, MI, USA
6 Department of Computer Science & Engineering, United International University Bangladesh, United City, Madani Avenue, Badda, Dhaka, 1212, Bangladesh
* Corresponding Author: Md Mustafizur Rahman. Email:
Frontiers in Heat and Mass Transfer 2024, 22(2), 537-556. https://doi.org/10.32604/fhmt.2024.047428
Received 05 November 2023; Accepted 19 February 2024; Issue published 20 May 2024
 View Full Text
 Download PDF
Abstract
A vehicle engine cooling system is of utmost importance to ensure that the engine operates in a safe temperature range. In most radiators that are used to cool an engine, water serves as a cooling fluid. The performance of a radiator in terms of heat transmission is significantly influenced by the incorporation of nanoparticles into the cooling water. Concentration and uniformity of nanoparticle distribution are the two major factors for the practical use of nanofluids. The shape and size of nanoparticles also have a great impact on the performance of heat transfer. Many researchers are investigating the impact of nanoparticles on heat transfer. This study aims to develop an artificial neural network (ANN) model for predicting the thermal conductivity of an ethylene glycol (EG)/water-based crystalline nanocellulose (CNC) nanofluid for cooling internal combustion engine. The implementation of an artificial neural network considering different activation functions in the hidden layer is made to find the best model for the cooling of an engine using the nanofluid. Accuracies of the model with different activation functions in artificial neural networks are analyzed for different nanofluid concentrations and temperatures. In artificial neural networks, Levenberg–Marquardt is an optimization approach used with activation functions, including Tansig and Logsig functions in the training phase. The findings of each training, testing, and validation phase are presented to demonstrate the network that provides the highest level of accuracy. The best result was obtained with Tansig, which has a correlation of 0.99903 and an error of 3.7959 ×10. It has also been noticed that the Logsig function can also be a good model due to its correlation of 0.99890 and an error of 4.9218 ×10. Thus our ANN with Tansig and Logsig functions demonstrates a high correlation between the actual output and the predicted output.Graphic Abstract
Keywords
The engine-cooling system is an essential part of a vehicle, providing the engine’s coolness and maintaining a safe temperature range for efficient operation. Engine cooling is performed through a heat transfer between the coolant running around the engine and the surrounding atmosphere through a radiator. In this process, the coefficient of thermal conductivity is critical to ensuring that the coolant can reduce the engine’s temperature to a suitable level for its operating condition [1]. Traditionally, coolants have ethylene glycol (EG) mixed with distilled water to increase heat conductivity [2,3]. However, the thermal performance of the EG-water mixture is relatively low compared to water due to the low thermal conductivity of EG. Some nanoparticles can be added to the composition of EG/water to overcome this difficulty [4–6]. The nanoparticles, which are additives to nanofluids, play a crucial role in altering the thermal properties of nanofluids. These nanoparticles could be metals, oxides of metals, graphene, or carbon nanotubes; the base fluids could be water, EG, polyalphaolefin, or other fluids [7]. As a result, using nanofluids containing nanoparticles has become increasingly important in enhancing heat transfer within vehicle engines [8]. In the past, numerous research papers have explored the impact of nanoparticles on conductivity.
Samylinggam et al. [9] developed an innovative composition featuring cellulose nanocrystals (CNC) in conjunction with a blend of EG and water (EG+W). This formulation was evaluated under a range of volume concentrations and temperatures, demonstrating a comprehensive approach to enhance the thermal properties of CNC/EG+W-based nanofluids. Their work signifies a notable advancement in thermal performance across diverse operational scenarios. In a comprehensive research endeavour documented in reference [10], a detailed investigation was conducted into the thermal properties of single nanoplatelets (GNP) and hybrid nanofluids combining CNC and GNPs, using a base fluid, especially for heat transfer enhancement. The findings of this research are noteworthy, indicating a significant increase in thermal conductivity by 27% at a temperature of 40°C and a concentration of 0.2 vol%. This advancement underscores the potential of hybrid nanofluids in thermal management applications, showing their ability to elevate heat transfer rates efficiently under specific conditions. Similarly, a comprehensive experimental analysis was conducted into the thermophysical characteristics and long-term stability of cellulose nanocrystals, MXene, and hybrid CNC-Mxene in the article [11]. This research was tailored to enhance the performance and efficiency of vehicle engines, showcasing the potential of these materials in automotive applications. At a temperature of 90°C and with a volume concentration of 0.05%, the CNC-MXene mixture exhibited a notable enhancement in thermal conductivity ratio. Simultaneously, there was an improvement in viscosity increased from 16.77% to 20.33%. An experimental investigation in [12] explored heat transfer enhancement in vehicle cooling systems using hybrid nanoparticles, specifically CNC and graphene nanoplatelets. This study revealed that the hybrid nanofluid developed significantly boosted the convective heat transfer coefficient by 51.91% and the overall heat transfer coefficient by 46.72%. Furthermore, it notably decreased the pressure drop by 34.06% compared to the baseline fluid. Applying CNC has demonstrated enhanced thermal conductivity with higher concentrations and temperatures. As an environmentally friendly and renewable resource, CNC is considered less detrimental than other metals [13,14].
Conversely, distinct research by Raddy et al. [15] conducted experimental research to evaluate how temperature and nanoparticle concentration impact the thermal conductivity of EG/water mixed with titanium oxide (TiO2). Their findings indicated that the volume concentration of nanoparticles and the temperature significantly contribute to the enhancement of thermal conductivity in TiO2 nanofluids. Christensen et al. [16] revealed increased thermal conductivity within a solvent when it contained metal oxide nanoparticles capable of forming hydrogen bonds. Furthermore, their study highlighted that the thermal conductivity of nanofluids is augmented by the hydrogen bonding between EG and water, which simultaneously helps reduce viscosity. It was established that the formation of hydrogen bonds between EG and water contributes to increased thermal conductivity in nanofluids while decreasing viscosity. At temperature 27°C, they observed that zinc oxide (ZnO)-EG nanofluids with a nanoparticle concentration of 0.4% exhibited a 33.4% improvement in thermal conductivity with a 39.2% decrease in viscosity. Sunder et al. [17] explored the thermal conductivity of a mixture comprising EG/water in combination with aluminium oxide (Al2O3) and copper oxide (CuO) across various temperatures and nanoparticle concentrations. The authors presented findings showing that the thermal conductivity enhancement of Al2O3 nanofluid at a volume concentration of 0.8% varies between 9.8% and 17.89%. This increase ranges from 15.6% to 24.56% nanofluid over an identical temperature range of 15°C to 50°C. Witharana et al. [18] conducted experiments to assess the thermal conductivity of EG/water when mixed with hybrid nanofluids made of Al2O3 and TiO2. Additional studies further explored the thermal conductivity of EG/water [19,20]. These studies focused on experimenting with different volume concentrations of nanoparticles and temperature.
Over the past two decades, artificial neural network (ANN) deployment has become prevalent, covering various applications from regression to classification tasks [21,22]. This surge in usage is notable in domains where conventional modelling techniques have proven inadequate. An ANN operates as an advanced data processing system, mirroring the functional intricacies of the human brain. An ANN can be refined with adequate training to serve as a specialized model tailored for specific applications. ANNs effectively exhibit their predictive capabilities upon training by learning from data sets. After training, the system was validated using independent data sets for testing. This approach is distinct from conventional modelling systems, as follows for acquiring system knowledge and modelling without understanding the underlying process linkages [23]. Numerous researchers have adopted ANN as a dependable approach for precisely mimicking the thermal conductivity of various nanofluids. Kurt et al. [24] explored the use of EG/water in predicting thermal conductivity through neural networks. Their study employed the binary Sigmoid transfer function and the back-propagation learning algorithm. Pare et al. [25] developed an advanced ANN model to predict the thermal conductivity of EG and metal oxide nanofluids precisely. Their innovative approach incorporated the Hyperbolic Tangent activation function in a hidden layer strategically designed with 12 neurons. ANNs have been employed to estimate the thermal conductivity of diverse nanofluids, encompassing Cu/TiO2-EG/water [26], ZnO-EG [27], ZnO-MWCNTs/EG-water [28], TiO2-water [29]. These models were developed to achieve optimal performance, adjusting the activation functions in the hidden layers and the number of neurons in each layer. The neural networks demonstrated remarkable accuracy in these research endeavours, achieving a correlation coefficient nearing the ideal value of 1.0. In the research presented in reference [30], the researchers designed an ANN model. This model was developed to predict the thermal conductivity of a hybrid nanofluid composed of water, TiO2, and calcium Carbonate (CaCO3) under varying temperature and volume concentrations. Their model demonstrated remarkable accuracy, evidenced by a correction coefficient of 0.99913 and an exceedingly mean error rate of only 0.02%. While a considerable amount of research has been conducted on ANN, there remains a gap in experimental applications, particularly in employing ANN for the composition of EG/water mixtures with cellulose nanocrystals. Hence, this research aims to develop an ANN model to predict nanofluids’ thermal conductivity based on EG/water with CNC. The ANN model utilizes nanofluid concentrations, temperature, and composition details. The Levenberg-Marquardt algorithm is employed as the training mechanism. In the design of the ANN model, the various activation functions are integrated to augment its computational efficacy. This deliberate incorporation of diverse activation functions is instrumental in generating a wide range of outcomes, significantly boosting the network’s precision and efficiency. Subsequently, the performance of the neural network is evaluated and analyzed. This process is pivotal in identifying superior activation functions and establishing a correlation between the network’s actual and anticipated output.
1.1 Artificial Neural Network Modelling
As depicted in Fig. 1, the architecture of a neural network is presented by an input, output, and a series of intermediate hidden neurons. These elements are systematically interconnected to create a network. This structure is designed to adeptly process specific inputs, demonstrating the intricate operational framework of neural networks [31]. The input data is systematically relayed to the neurons residing in the hidden layer. The output layer receives the activated values from the hidden layer. At this stage, the output layer computes to generate a result that is an approximation, effectively encapsulating the core of the learning process. The network uses weights and biases to process the incoming data during forward propagation. This data is subsequently channeled through an activation function responsible for preparing and relaying the output to the next layer in the sequence [32,33]. This is achieved by supplying the activation function with the processed output derived from the previous layer.

Figure 1: An artificial neural network architecture
The value of output
where n is the number of inputs used in the network. The returned value is sent into an activation function once the combination of inputs with the corresponding weights is calculated. The Logistic Sigmoid (Logsig), Hyperbolic Tangent Sigmoid (Tansig), and Hard Limit (Hardlim) functions are various activation functions within neural networks [35]. Among these, the Tansig activation function is most frequently employed. This function is characterized by its output range of (0,1) and is formally expressed as Eq. (2) [36].
The value of
Back-propagation is a supervised learning algorithm primarily employed in the mathematical training neural networks. Its core function is to minimize the loss function, thereby enhancing the accuracy and efficiency of the neural networks. The neural network is trained by changing the weights and biases, also known as the hyperparameters, rather than the input values. The training phase of neural networks ensures that error is minimal. In backward propagation, the calculation of hyperparameter changes is performed for the learning of the ANN. Typically, the Mean Square Error (MSE) is employed as a quadratic loss metric within the framework of an error function (C) which is expressed in Eq. (3) [38]:
where
Considering that,
where
1.3 Data Normalization Techniques
Data points are typically subjected to pre-processing steps to normalize the dataset, ensuring that the first layer receives data with a zero mean. This diminishes the disparities in data scales and establishes a correlation among various data attributes [40]. This phenomenon frequently arises when there is a notable variance in scale among the different attributes encompassed within the dataset. The data pre-processing is carried out in a two-fold procedure. The first step involves data cleaning, which includes identifying and rectifying errors or inconsistencies within the data, for example, missing values, outsiders, and duplicates. The second step is data transformation, where techniques such as normalization constrain the range of numerical data values, ensuring consistency across the dataset [41,42]. Such pre-processing reduces the mean-variance across the value ranges of disparate variables. This pre-processing enhances the neural network’s ability to converge more effectively and expedites learning [43]. Numerous normalization methods are utilized in data processing, including max-min normalization, Z-score normalization, and others.
We assume v′ as the normalized data, v as unnormalized data,
The max-min normalization technique plays a pivotal role in implementing neural networks. This method effectively scales the diverse range of numerical values in the dataset’s feature, standardizing them into a unified range of [−1, 1]. Such standardization is crucial for optimizing the performance and efficacy of neural networks by ensuring consistent data scales for all features. The Z-score normalization method is adeptly employed to standardize input data, thereby enhancing the efficiency of gradient descent. This approach retains the range extremities’ maximum and minimum values while incorporating critical statistical measures such as variance and standard deviation. This approach streamlines data processing and ensures a more robust and consistent data normalization framework. Assume we denote all data points as ‘x’ of a feature with ‘n’ representing the aggregate number of the training. In this context, we initiate the following series of operations [45]:
Step 1: Determine the mean (
At this stage, all data points have been adjusted to zero-centred, effectively achieving a zero mean.
Step 2: Implement the normalization step precisely, dividing the mean-subtracted features by the standard deviation to achieve a refined and consistent standardization across the dataset.
Maintaining consistency in the data transformation process is essential by applying the identical mean and variance in normalizing the primary dataset to subsequent datasets, including the test and validation sets. This ensures a uniform standard of normalization across all data segments.
MSE is a standard error estimation method to determine the neural network’s error rate. When the value of the MSE is high, the error value is high, and zero means the model has the correct and accurate prediction [46]. The correlation coefficient (R) serves as an additional metric for evaluating the accuracy of a model across various data sets. An R-value nearing one indicates a strong correlation between the data obtained from the experiment and data generated by the ANN model. The precision of the developed ANN model can be evaluated through the Margin of Deviation (MOD). The relevant formulas are defined as follows [47,48]:
where, m,
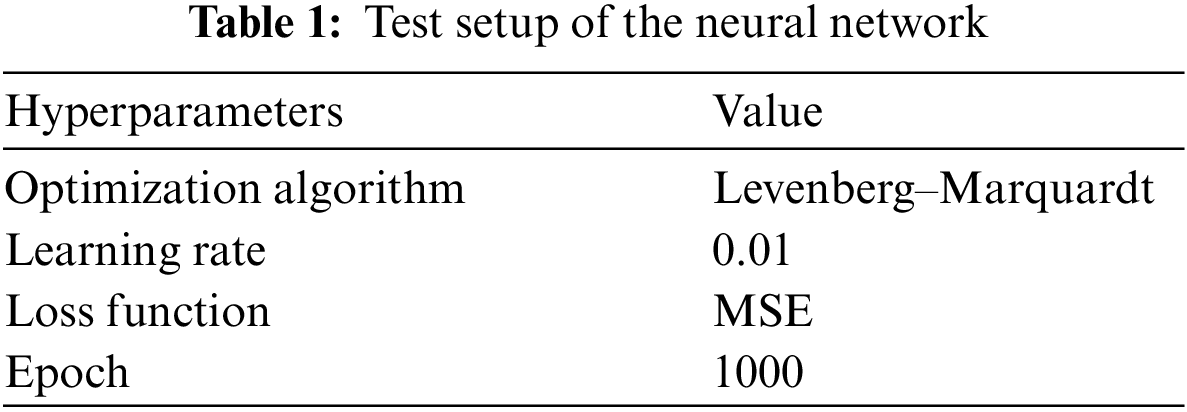
An adjustable hyperparameter’s learning rate plays a pivotal role in defining the speed at which a neural network model adepts and learns from a specific task. It is crucial to fine-tune this learning rate to an optimal level, significantly reducing error and enhancing the model’s efficiency. Nevertheless, there are specific challenges associated with setting learning rates. It may lead to a phenomenon known as gradient explosion in the model if the learning rate is set excessively high. Conversely, setting the learning rate too low can result in excessively prolonged training durations, leading to a scenario where the model takes an extended time to converge to a minimum or may fail to reach the minimum. Typically, learning rates are set within a spectrum ranging from 10−6 to 1.0. We have initiated our learning rate at 0.01, aligning it with the specific requirements and goals.
2.1 Data Acquisition and Splitting
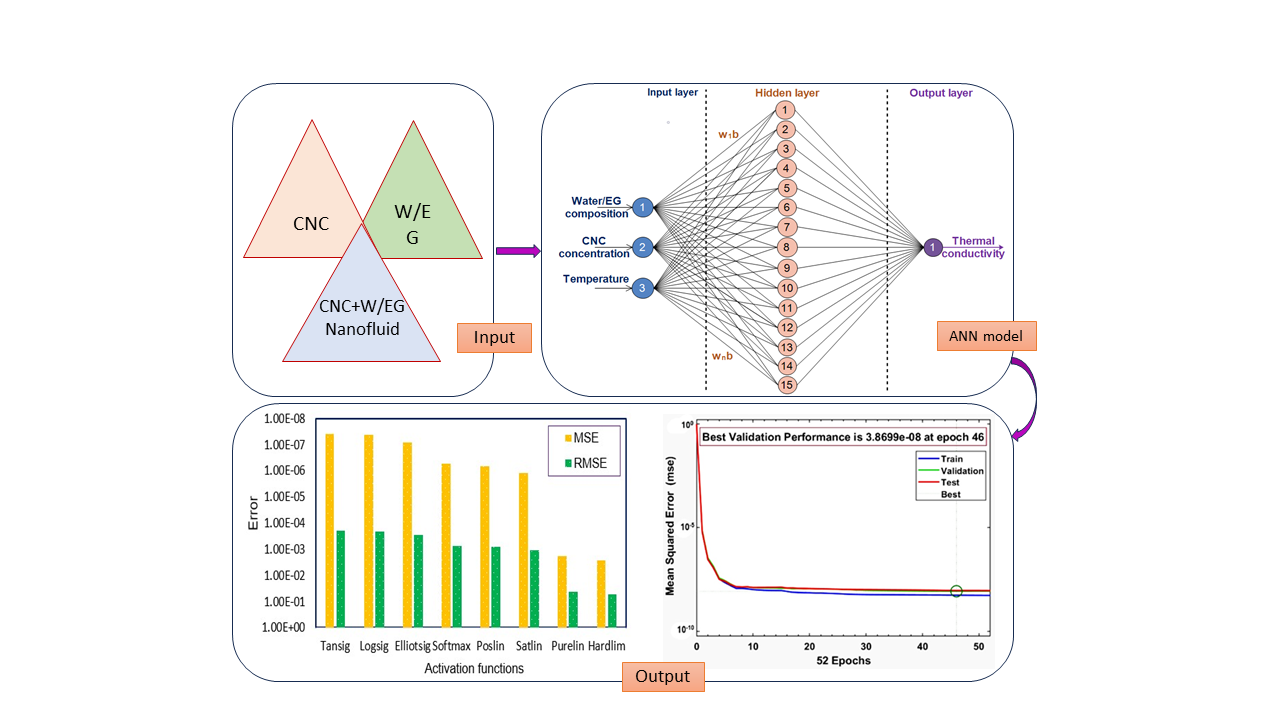
The training phase of the neural network is initiated with an assembled dataset engineered to predict the thermal conductivity of EG/water-based CNC precisely. This dataset comprises three pivotal input variables, including the proportion of EG to water, the concentration of CNC, and the elevated temperature. Additionally, it includes the output variable, which is the thermal conductivity. The utilization of these data points in training the neural network is illustrated in Fig. 2, demonstrating how each input parameter contributes to the accurate prediction of thermal conductivity. The neural network model was developed using a supervised learning paradigm to predict thermal conductivity accurately. The dataset comprises 1632 data points instrumental in the model’s training, testing, and validation stages. It is demonstrated by a p-value that relates to the significance level of the dataset (p-value = 0.001 < 0.05). This dataset ensures that the neural network is comprehensively trained on a wide range of data, thoroughly validated for accuracy, and tested to evaluate its predictive performance. The dataset is derived from a comprehensive research study on thermal conductivity, with experiments involving EG/water-CNC systems conducted within the state-of-the-art Automotive Engineering Centre at the University Malaysia Pahang Al-Sultan Abdullah, Pekan, Malaysia.

Figure 2: Neural network architecture where inputs are EG concentration, water concentration, nanoparticle concentration, and temperature
The subsequent phase involves data splitting, which is performed utilizing a sophisticated technique known as data partitioning. Three distinct features enrich this dataset, comprising 1632 data points segmented into smaller subsets. These subsets play a pivotal role in the efficient training of the neural network. They are categorized into distinct phases, including training, testing, and validation, each allocated in specific, calculated ratios to optimize the learning and validation process. For this study, the distribution ratio has been set at 6:2:2. This deliberate calibration ensures that substantial data is allocated for training while sufficient data are allocated for testing and validation. Such a balanced approach is pivotal in mitigating risks associated with underfitting and overfitting, thereby fostering the development of a more accurate model. The data is randomly slit during training using the “dividerand” function as the neural network dividing mechanism. In this setup, the 6:2:2 ratio translates to 980 data points for training, 326 for testing, and 326 for validation.
As depicted in Fig. 2, the neural network is constructed using a multilayer perceptron (MLP) network model. The network comprises an input layer, a hidden layer, and an output layer. It features three neurons in the input layer, fifteen neurons in the hidden layer, and a single neuron in the output layer, along with biases incorporated within the hidden layer. The quality of hidden neurons is determined by the number of input and output neurons employed in the network. Upon completing the neural network design, it embarks on the training phase for each activation function. This phase employed the Levenberg-Marquardt optimization algorithm in conjunction with the Gauss-Newton method. This mechanism illustrates the sequential flow of data and the transformative computations occurring within the neural network’s layered structure. The neural network training incorporates the back-propagation learning algorithm, aiming to minimize errors by adjusting the network’s weights and biases through gradient descent. In this process, the inter-neuronal connections, weights, and biases are initially set to random values by MATLAB. This initialization is a standard step in neural network training, allowing the network to learn and refine these parameters through its iterative training process. During the training phase, the weights and biases within the model are systematically refined and optimized. This process continues until a point is reached where it meets predefined criteria, such as reaching the maximum number of epochs.
In the context of model training, generalization is characterized by an increase in validation error, indicating that the model has exceeded its optimal capacity for accurate predictions. This phenomenon is a critical component of regularization techniques to enhance the model’s performance and reliability during training. An extensive array of activation functions was rigorously tested within the hidden layers of the neural networks. This diverse set includes the Logsig, Tansig, Softmax, Satlin, Elliotsig, Poslin, Purelin, and Hardlim. The objective was to assess their impact on the network’s efficacy and overall performance. The neural network’s performance is recorded and reiterated using various activation functions. The Mean Square Error is employed as the loss function, a standard approach in regression lasks, providing a reliable measure of model accuracy. The design of neural networks encompasses a wide array of critical hyperparameters, the specific learning rate, and the selected optimization algorithm, which are integral to fine-tuning the network’s functionality and optimizing its overall performance. The network’s training hyperparameters have been established based on the specifications outlined in Table 1.
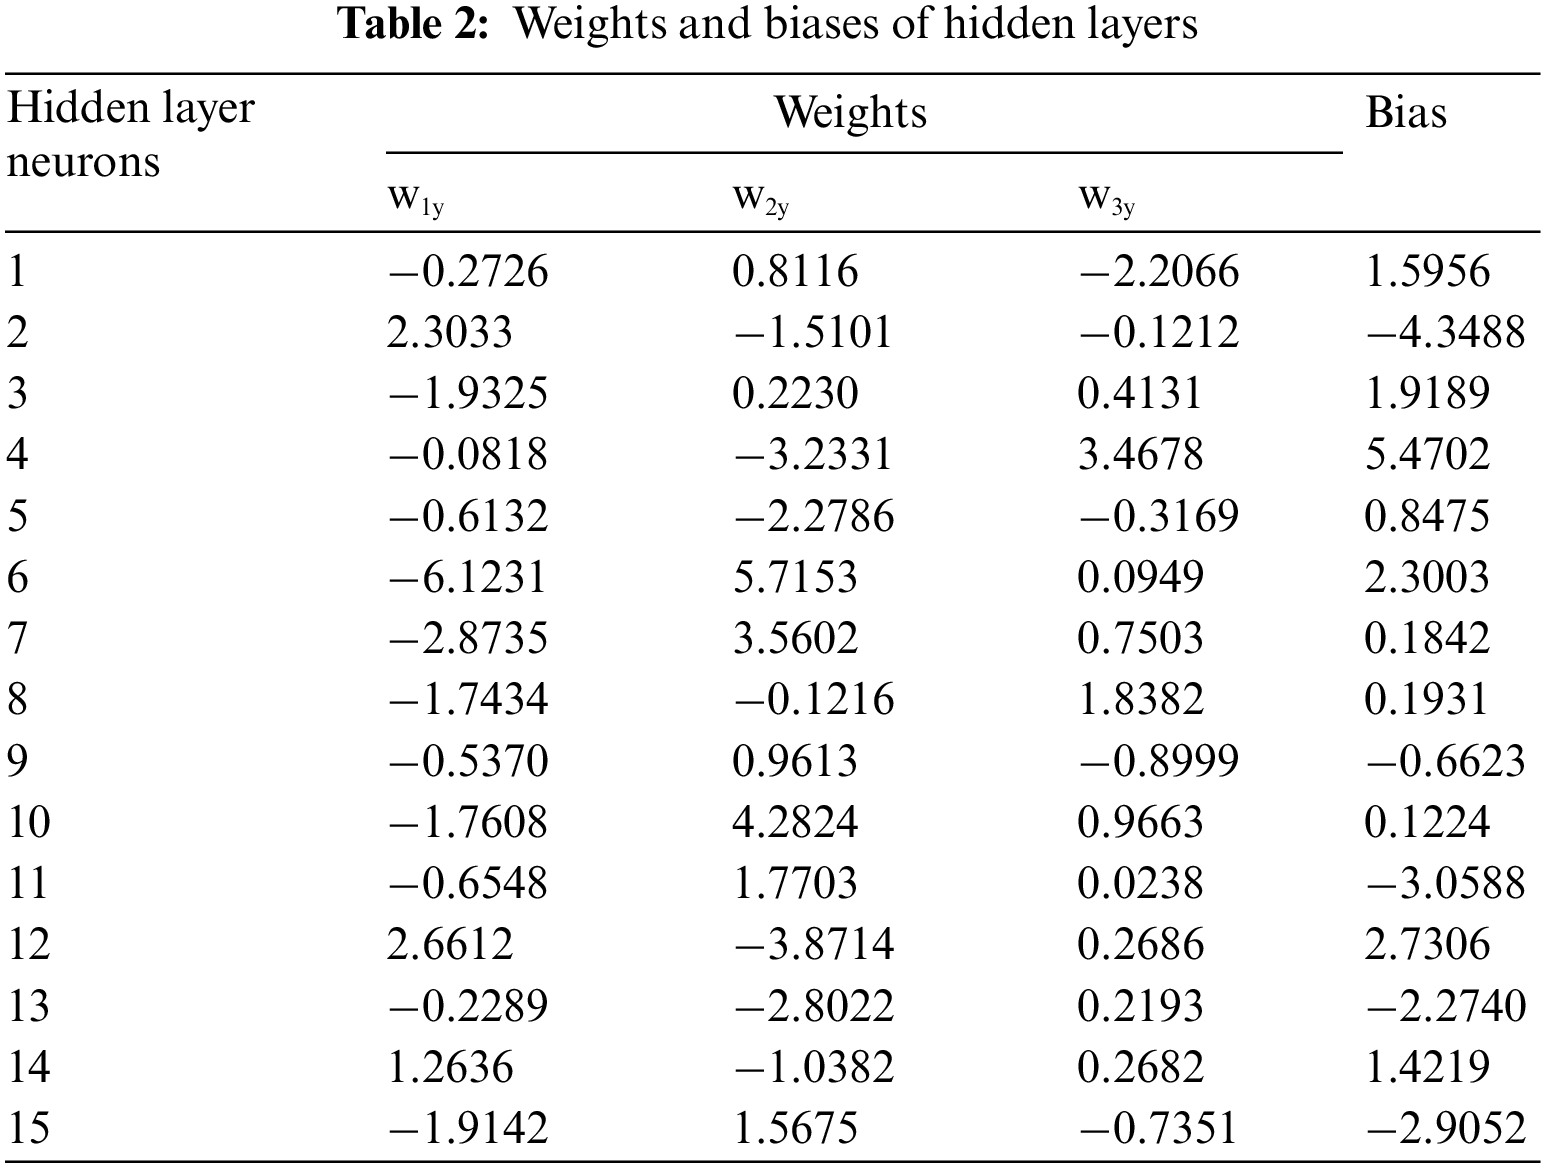
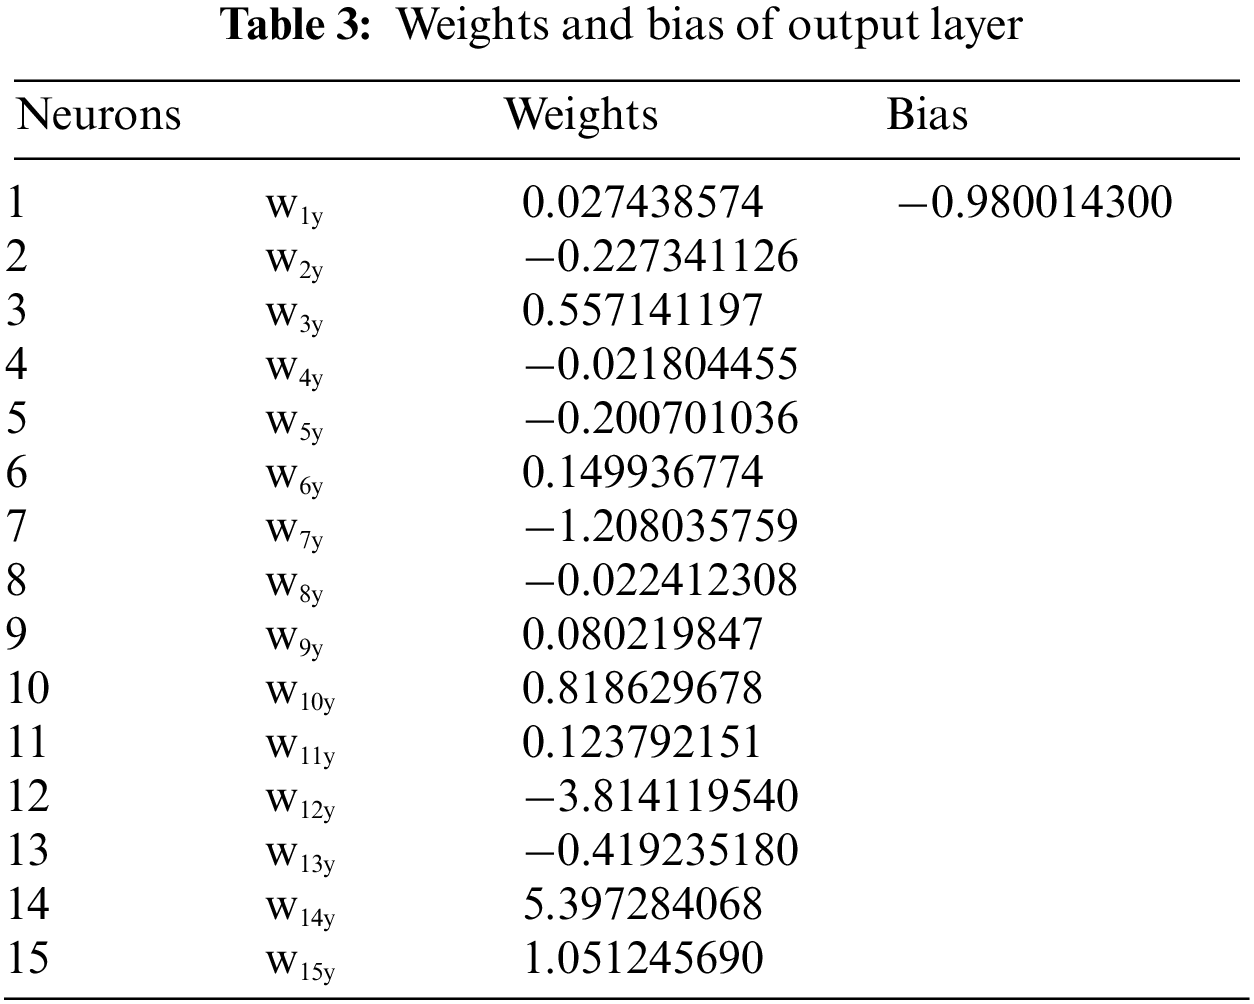
This research uses ANN to predict thermal conductivity in EG/water mixtures with incorporated CNC. The study examines various activation functions in the hidden layers of the ANN, aiming to evaluate and enhance the accuracy and reliability of the network’s predictive capabilities. Several activation functions, including Tansig, Logsig, Hardlim, Poslin, Elliotsig, Softmax, Satlin, and Purlin, are used in the neural network’s model. Fig. 3 depicts a noticeable convergence of the MSE with the increase in epochs, particularly for training data employing diverse activation functions. This trend indicates significant learning, as evidenced by the steep decline in the curves during the initial phases of learning. Most of these curves exhibit a remarkable improvement in the early stages, reflecting the effectiveness of the learning process. From the analysis of Fig. 3a, it becomes evident that the network achieves its peak performance in error reduction when employing the Tansig activation function. As the learning process progresses, a distinct plateau emerges around the epochs threshold, indicating a transition to a phase that extends to the 46th epoch, marking the conclusion of the training period. At this juncture, the model achieves a notably refined level of precision, evidenced by an MSE of 3.7959 × 10⁻⁸, reflecting the culmination of optimized learning. In addition, the intricate details of the network’s architecture are elucidated in Tables 2 and 3, which outline the weights and biases associated with the Tansig activation functions in both the hidden and output layers of the ANN model. These results provide a deeper understanding of the network’s operational dynamics.

Figure 3: Convergence of MSE across epochs for different transfer functions
The training data plays a pivotal role in attaining the optimal configuration of the network. In this study, the data sets allocated for training substantially exceed those designated for testing and validation purposes. In particular, 60% of the data set is dedicated to network training. This training data is derived from a strategically randomized selection spanning the full spectrum of the ANN experimental results.
Fig. 4 presents a scatter plot that illustrates the accuracy metrics for training, testing, validation, and the overall performance of the ANN model. The findings distinctly reveal a strong alignment between the output and target data, with the training dataset exhibiting an exceptionally high correlation coefficient of 0.99904. This trend of high correlation also extends to the other data sets, with the test, validation, and overall datasets achieving correlation coefficients of 0.99885, 0.99918, and 0.99903, underscoring the model’s remarkable consistency and precision across different evaluation phases. These results indicate a strong convergence between the predicted values and the experimental data produced by the developed ANN model utilizing the Tansig activation function. Moreover, these findings substantiate the ANN’s proficiency in accurately predicting results, highlighting its predictive reliability and effectiveness.

Figure 4: Tansig scatter plot of the target and output values of the ANN model
Table 4 provides an exhaustive comparative evaluation of performance metrics for various activation functions applied in thermal conductivity prediction. This comprehensive intricately tables the diverse accuracies and correlation values in neural network training, testing, and validation stages. It is curated to showcase the accuracies in a precise, descending sequence, starting with the most effective (denoted by the lowest MSE) and progressing to the least efficient, thereby presenting a nuanced and detailed perspective on the efficiency of each activation function. Deployment of Logsig and Tansig as activation functions significantly enhanced the neural network’s generalization abilities, resulting in markedly lower training and testing errors when compared to other activation functions. This superior performance is primarily due to the intrinsic characteristics of these functions, which are optimally designed to promote outstanding generalization and efficient convergence during the training phase, thereby optimizing the network’s overall learning efficiency [49]. Following the documentation of the initial results, the training process is repeated, employing a variety of activation functions within the hidden layer. This phase includes testing activation functions. The results in Table 4 quantitatively demonstrate that the Tansig and Logsig functions achieve a correlation coefficient of 0.99903 and 0.99890, respectively. However, a notable distinction arises in their error values, with the Tansig function exhibiting a lower error rate (3.7959 × 10⁻⁸) than the Logsig (4.9218 × 10⁻⁸). This discrepancy can be attributed to the intrinsic properties of the Tansig activation functions, particularly its centering around zero and its superior facilitation of the neural network’s learning capabilities, as detailed [50].
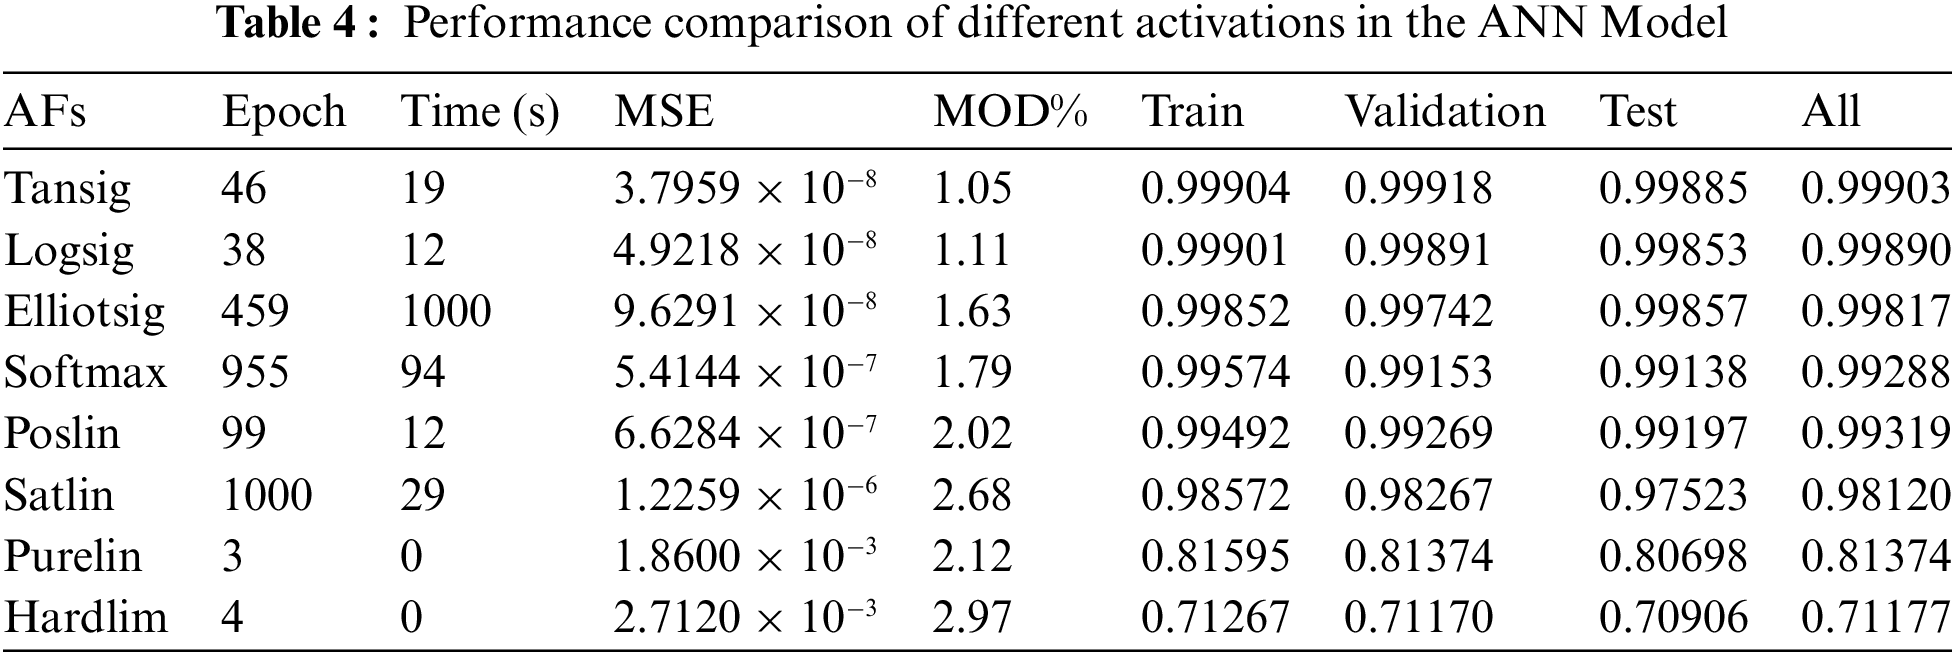
Additionally, several other activation functions have been identified as highly effective for this specific task, demonstrating notable accuracy. Functions such as Elliotsig, Softmax, and Poslin have all achieved a high correlation coefficient of 0.99, underscoring their suitability and effectiveness in this context. Upon comparing all activation functions that have been experimented with, it is observed that the Hardlim function exhibits the lowest accuracy, as evidenced by its correlation coefficient of 0.71177. Additionally, it presents an MSE of 0.002712, further indicating its relative underperformance compared to the other activation functions tested.
Fig. 5 compares MSE and RMSE values across various activation functions utilizing a logarithmic scale for enhanced clarity. The activation functions such as Purelin and Hardlim exhibit notably higher MSE and RMSE values. In contrast, Tansig and Logsig functions demonstrate significantly lower values, indicating enhanced efficiency in training tasks. This graphical representation provides a clear and comprehensive overview of the performance difference between activation functions in the context of neural network training. The evaluation reveals that other activation functions display only moderate error levels. A comprehensive analysis of these functions indicates that the Tansig function consistently exhibits the lowest values in MSE and RMSE, distinguishing it as the most efficient among the compared activation functions in error minimization. Fig. 6 presents the error histogram for the Tansig-based ANN model, where it is observed that a significant proportion of the errors are concentrated near zero, indicating minimal deviation. This error distribution pattern indicates an approximate zero error, highlighting the model’s exceptional level of generalization. It suggests that the ANN model is well-calibrated and can be generalized effectively.

Figure 5: Error values comparison among the different activation functions

Figure 6: Error histogram
Table 4 also comprehensively presents the margin of deviation ranges associated with each activation function employed in accurately predicting thermal conductivity, offering a detailed comparison. The values delineated in Table 4 reveal that among the activation functions, Tansig stands out with the lowest margin of deviation value. Closely paralleling this, the Tansig and Logsig functions demonstrate a comparable performance, exhibiting MOD values at 1.05% and 1.11%, indicating high precision in the predictive analysis. Tansig and Logsig functions can smooth gradient transitions, leading to more efficient learning during the model training phase. This efficient learning translates into a lower MOD, indicating that the predicted values are closer to the experimental values. These functions are potentially more suitable for predicting thermal conductivity within the given dataset, owning to their non-linear nature, effective handling of the data range, and efficient error minimization capabilities. The results further reveal that the Satlin and Hardlim functions stand out with notably higher values in Table 4, in contrast to the other activation functions, which display comparatively average performance metrics.
Fig. 7 provides a detailed representation of the margin of deviation range, encompassing the training, testing, validation, and overall datasets, especially utilizing the Tansig activation functions within the framework of the ANN model. This visualization proposes insight into the function’s efficacy across different data segments. These results set the MOD value within a notably narrow range of −0.1% to 0.1%, underscoring a significantly low error rate. This minimal margin of error strongly indicates that the Tansig function performed robustly in the developed model and demonstrated outstanding quality and reliability in its application.

Figure 7: MOD values with the number of data at different training stages
The scholarly literature extensively investigates the role of activation functions in ANNs for predicting thermal properties. This study’s focus has significantly contributed to the field, enhancing the precision and efficacy of thermal property predictions by strategically selecting and applying various activation functions in ANN models. The study in reference [51] examines the impacts of employing diverse activation functions within neural networks’ hidden and outer layers. This study aimed to enhance the overall performance of the networks. The author’s research achieved correlation coefficients of 0.998, 0.998, 0.998, and 0.999 across various models utilizing different activation functions. Applying an ANN model in [52] to predict the thermal conductivity of MWCNT-CuO/water hybrid nanofluid yielded a notably high correlation coefficient of 0.9964. This precision, achieved through the adept use of Tansig and Purlin activation functions, was further validated by a low MSE of 2.4451 × 10⁻⁵, exemplifying the model’s exceptional accuracy in the field of nanofluid thermal mechanism. Another ANN model with Tanh and linear activations functions accurately predicted the thermal conductivity of WO3-CuO-Ag/water hybrid nanofluids, yielding a correlation coefficient of 0.997 and MSE of 7.0 × 10⁻⁶, showing the model’s high precision in thermal analysis [53]. The study in [54] critically reviews various neural network activation functions, noting Tansig and Logsig’s suitability for recurrent networks but advising against their use in convolutional networks due to poor convergence. In ANN model research documented in [55], the authors experimented with six different activation functions: Tanh, Sigmoid, ReLu, Softplus, Swish, and Exponential. While most of these functions yielded impressive results, Relu was an exception. Consequently, the authors specifically recommended the Sigmoid activation function for the developed ANN model, highlighting its effectiveness in achieving the desired predicted outcomes. The authors in [56] also developed an ANN model for thermal conductivity prediction using five different activation functions and achieved an R = 0.96 and MSE = 0.0004 with the Tansig activation function. A recently proposed ANN model in [57] predicts thermal conductivity with R of 0.994 MSE of 0.00057 using Logsig and Purlin activation functions. The research in this paper used eight activation functions in an ANN model with a configuration of 3-15-1. The performance of these activation functions was compared with others, where Tansig and Logsig showed better performance. In addition, our ANN model gained the highest exactness of R = 0.99903 and MSE = 3.7959 × 10⁻⁸ with the Tansig activation function compared to the other models.
In this research, the innovation lies in developing a new ANN model to predict the precision of thermal conductivity in a CNC nanofluid that uses a mixture of EG and water for cooling internal combustion engines. The database of the ANN model was established using our experimental data. The effects of network parameters, mainly activation functions, were investigated in the ANN modelling, and optimal ANN architecture was determined. The conclusion could be summarized as follows:
• Different activation functions are used and analyzed in the hidden of the developed ANN model. The optimized network, consisting of 3 input nodes, 15 neurons in the hidden layer, and one output neuron, performed well in modeling the relationship between input and output parameters. This simulation shows that the Tansig activation function produces the best result with a correlation of 0.99903 and an error of 3.7959 × 10⁻⁸.
• It is observed that the characteristics of the Logsig activation function are almost similar to the Tansig activation function and attain a correlation of 0.99890 and an error of 4.9218 × 10⁻⁸. Therefore, Logsig is a good alternative due to its good features.
• The results of this model indicate a strong correlation between the thermal conductivity from experiments and the predicted value. As different vehicle types require different cooling parameters for the vehicle to run in various operating conditions, carmakers can use the neural network to test the thermal conductivity from the different parameters using simulation with ANN instead of live experiments, which is costly and time-consuming.
• We intend to enhance the model generalization efficiency, optimize ANN industrial achievement, and improve cooling benefits. Therefore, future work is needed to develop a prediction model with enormous applicability and further enlarge the dataset to include a wide range of performance and control parameters.
Acknowledgement: The authors would like to thank Universiti Malaysia Pahang Al Sultan Abdullah (UMPSA), Malaysia, for their support in providing the laboratory facilities and financial assistance.
Funding Statement: This work is supported by the International Publication Research Grant No. RDU223301.
Author Contributions:: Md. Munirul Hasan: Methodology, software, original draft preparation and editing; Mohammad Saiful Islam: Software; Wong Hung Chan: Data curation, methodology, software, original draft preparation; Md. Mustafizur Rahman: Supervision, idea generation, and conceptualization; Yasser M Alginahi: Reviewing and editing; Suraya Abu Bakar: Reviewing and editing; Muhammad Nomani Kabir: Supervision, conceptualization, reviewing, and editing; Devarajan Ramasamy: Experimental study.
Availability of Data and Materials: Data can be provided on request.
Conflicts of Interest: The authors declare no conflicts of interest to report regarding the present study.
References
1. Xian, H. W., Sidik, N. A. C., Najafi, G. (2019). Recent state of nanofluid in automobile cooling systems. Journal of Thermal Analysis and Calorimetry, 135, 981–1008. https://doi.org/10.1007/s10973-018-7477-3 [Google Scholar] [CrossRef]
2. Aldosry, M., Zulkifli, R., Ghopa, W. A. W. (2021). Heat transfer enhancement of liquid-cooled copper plate with oblique fins for electric vehicles battery thermal management. World Electrical Vehicle Journal, 12(2), 55. https://doi.org/10.3390/wevj12020055 [Google Scholar] [CrossRef]
3. Arora, N., Gupta, M. (2020). An updated review on the application of nanofluids in flat tubes radiators for improving cooling performance. Renewable and Sustainable Energy Reviews, 134, 110242. https://doi.org/10.1016/j.rser.2020.110242 [Google Scholar] [CrossRef]
4. Porgar, S., Oztop, H. F., Salehfekr, S. (2023). A comprehensive review on thermal conductivity and viscosity of nanofluids and their application in heat exchangers. Journal of Molecular Liquids, 386, 122213. https://doi.org/10.1016/j.molliq.2023.122213 [Google Scholar] [CrossRef]
5. Ahmadi, M. H., Mirlohi, A., Nazari, M. A., Ghasempour, R. (2018). A review of thermal conductivity of various nanofluids. Journal of Molecular Liquids, 265, 181–188. https://doi.org/10.1016/j.molliq.2018.05.124 [Google Scholar] [CrossRef]
6. Dezfulizadeh, A., Aghaei, A., Joshaghani, A. H., Najafizadeh, M. M. (2021). An experimental study on dynamic viscosity and thermal conductivity of water-Cu-SiO2-MWCNT ternary hybrid nanofluid and the development of practical correlations. Powder Technology, 389, 215–234. https://doi.org/10.1016/j.powtec.2021.05.029 [Google Scholar] [CrossRef]
7. Younes, H., Mao, M., Murshed, S. M. S., Lou, D., Hong, H. et al. (2022). Key parameters to enhance thermal conductivity and its applications. Applied of Thermal Engineering, 207, 118202. https://doi.org/10.1016/j.applthermaleng.2022.118202 [Google Scholar] [CrossRef]
8. Arshad, A., Jabbal, M., Yan, Y., Reay, D. (2019). A review on graphene-based nanofluids: Preparation, characterization and applications. Journal of Molecular Liquids, 279, 444–484. https://doi.org/10.1016/j.molliq.2019.01.153 [Google Scholar] [CrossRef]
9. Samylingam, L., Anamalai, K., Kadirgama, K., Samykano, M., Ramasamy, D. et al. (2018). Thermal analysis of cellulose nanocrystal-ethylene glycol nanofluid coolant. International Journal of Heat and Mass Transfer, 127, 173–181. https://doi.org/10.1016/j.ijheatmasstransfer.2018.07.080 [Google Scholar] [CrossRef]
10. Sandhya, M., Ramasamy, D., Kadirgama, K., Harun, W. S. W., Saidur, R. (2023). Assessment of thermophysical properties of hybrid nanoparticles [Graphene Nanoplatelets (GNPs) and cellulose nanocrystal (CNC)] in a base fluid for heat transfer applications. International Journal of Thermophysics, 44(4), 55. https://doi.org/10.1007/s10765-023-03162-w [Google Scholar] [CrossRef]
11. Kamarulzaman, M. K., Hisham, S., Kadirgama, K., Ramasamy, D., Samykano, M. et al. (2023). Improvement in stability and thermophysical properties of CNC-MXene nanolubricant for tribology application. Journal of Molecular Liquids, 381, 121695. https://doi.org/10.1016/j.molliq.2023.121695 [Google Scholar] [CrossRef]
12. Yaw, C. T., Koh, S. P., Sandhya, M., Kadirgama, K., Tiong, S. K. et al. (2023). Heat transfer enhancement by hybrid nano additives—graphene nanoplatelets/cellulose nanocrystal for the automobile cooling system (Radiator). Nanomaterials, 13(5), 808. https://doi.org/10.3390/nano13050808 [Google Scholar] [PubMed] [CrossRef]
13. Shankaran, D. R. (2018). Cellulose nanocrystals for health care applications. In: Applications of nanomaterials, pp. 415–459. UK: Elsevier, Woodhead Publishing. [Google Scholar]
14. Kim, J. H., Shim, B. S., Kim, H. S., Lee, Y. J., Min, S. K. (2015). Review of nanocellulose for sustainable future materials. International Journal of Precision Engineering and Manufacturing-Green Technology, 2(2), 197–213. https://doi.org/10.1007/s40684-015-0024-9 [Google Scholar] [CrossRef]
15. Reddy, M. C. S., Rao, V. V. (2023). Experimental studies on thermal conductivity of blends of ethylene glycol-water-based TiO2 nanofluids. International Communications in Heat and Mass Transfer, 46, 31–36. [Google Scholar]
16. Christensen, G., Younes, H., Hong, H., Smith, P. (2015). Effects of solvent hydrogen bonding, viscosity, and polarity on the dispersion and alignment of nanofluids containing Fe2O3 nanoparticles. Journal of Applied Physics, 118(21), 214302. https://doi.org/10.1063/1.4936171 [Google Scholar] [CrossRef]
17. Sundar, L. S., Farooky, M. H., Sarada, S. N., Singh, M. K. (2013). Experimental thermal conductivity of ethylene glycol and water mixture based low volume concentration of Al2O3 and CuO nanofluids. International Communications in Heat and Mass Transfer, 41, 41–46. https://doi.org/10.1016/j.icheatmasstransfer.2012.11.004 [Google Scholar] [CrossRef]
18. Witharana, S., Weliwita, J. A. (2012). Suspended nanoparticles as a way to improve thermal energy transfer efficiency. Proceedings: 2012 IEEE 6th International Conference on Information and Automation for Sustainability, pp. 308–311. Beijing, China. [Google Scholar]
19. Jiang, G., Liu, Y., Liu, C. (2023). Investigating liquid thermal conductivity of ethylene glycol (EG)/water mixtures: A comparative experimental and molecular dynamics simulation study. Journal of Molecular Liquids, 384, 122268. https://doi.org/10.1016/j.molliq.2023.122268 [Google Scholar] [CrossRef]
20. Said, Z., Jamei, M., Sundar, L. S., Pandey, A. K., Allouhi, A. et al. (2022). Thermophysical properties of water, water and ethylene glycol mixture-based nanodiamond + Fe3O4 hybrid nanofluids: An experimental assessment and application of data-driven approaches. Journal of Molecular Liquids, 347, 117944. https://doi.org/10.1016/j.molliq.2021.117944 [Google Scholar] [CrossRef]
21. Neapolitan, R. E., Jiang, X. (2018). Neural networks and deep learning. In: Artificial intelligence,pp. 389–411. USA: Determination Press. [Google Scholar]
22. Sahin, F., Genc, O., Gökcek, M., Çolak, A. B. (2023). An experimental and new study on thermal conductivity and zeta potential of Fe3O4/water nanofluid: Machine learning modeling and proposing a new correlation. Powder Technology, 420, 118388. https://doi.org/10.1016/j.powtec.2023.118388 [Google Scholar] [CrossRef]
23. Hosseini, S. H., Taghizadeh-Alisaraei, A., Ghobadian, B., Abbaszadeh, M. A. (2020). Artificial neural network modeling of performance, emission, and vibration of a CI engine using alumina nano-catalyst added to diesel-biodiesel blends. Renewable Energy, 149, 951–961. https://doi.org/10.1016/j.renene.2019.10.080 [Google Scholar] [CrossRef]
24. Kurt, H., Kayfeci, M. (2009). Prediction of thermal conductivity of ethylene glycol-water solutions by using artificial neural networks. Applied Energy, 86(10), 2244–2248. https://doi.org/10.1016/j.apenergy.2008.12.020 [Google Scholar] [CrossRef]
25. Pare, A., Ghosh, S. K. (2021). A unique thermal conductivity model (ANN) for nanofluid based on experimental study. Powder Technology, 377, 429–438. https://doi.org/10.1016/j.powtec.2020.09.011 [Google Scholar] [CrossRef]
26. Esfe, M. H., Wongwises, S., Naderi, A., Asadi, A., Safaei, M. R. et al. (2015). Thermal conductivity of Cu/TiO2-water/EG hybrid nanofluid: Experimental data and modeling using artificial neural network and correlation. International Communications in Heat and Mass Transfer, 66, 100–104. https://doi.org/10.1016/j.icheatmasstransfer.2015.05.014 [Google Scholar] [CrossRef]
27. Esfe, M. H., Saedodin, S., Naderi, A., Alirezaie, A., Karimipour, A. et al. (2015). Modeling of thermal conductivity of ZnO-EG using experimental data and ANN methods. International Communications in Heat and Mass Transfer, 63, 35–40. https://doi.org/10.1016/j.icheatmasstransfer.2015.01.001 [Google Scholar] [CrossRef]
28. Esfe, M. H., Esfandeh, S., Saedodin, S., Rostamian, H. (2017). Experimental evaluation, sensitivity analysis and ANN modeling of ZnO-MWCNT/EG-water hybrid nanofluid thermal conductivity for engineering applications. Applied Thermal Engineering, 125, 673–685. https://doi.org/10.1016/j.applthermaleng.2017.06.077 [Google Scholar] [CrossRef]
29. Esfe, M., Esfandeh, S., Toghraie, D. (2022). Investigation of different training function efficiency in modeling thermal conductivity of TiO2/Water nanofluid using artificial neural network. Colloids and Surfaces A: Physicochemical and Engineering Aspects, 653, 129811. https://doi.org/10.1016/j.colsurfa.2022.129811 [Google Scholar] [CrossRef]
30. Öcal, S., Gökçek, M., Çolak, A. B., Korkanç, M. (2021). A comprehensive and comparative experimental analysis on thermal conductivity of TiO2-CaCO3/Water hybrid nanofluid: Proposing new correlation and artificial neural network optimization. Heat Transfer Research, 52(17), 55–79. https://doi.org/10.1615/HeatTransRes.v52.i17 [Google Scholar] [CrossRef]
31. Ding, S., Li, H., Su, C., Yu, J., Jin, F. (2013). Evolutionary artificial neural networks: A review. Artificial Intelligence Review, 39, 251–260. https://doi.org/10.1007/s10462-011-9270-6 [Google Scholar] [CrossRef]
32. Chen, D., Li, X., Li, S. (2023). A novel convolutional neural network model based on beetle antennae search optimization algorithm for computerized tomography diagnosis. IEEE Transactions on Neural Networks and Learning Systems, 34(3), 1418–1429. https://doi.org/10.1109/TNNLS.2021.3105384 [Google Scholar] [PubMed] [CrossRef]
33. Hasan, M. M., Islam, M. S., Bakar, S. A., Rahman, M. M., Kabir, M. N. (2021). Applications of artificial neural networks in engine cooling systems. Proceedings in 2021 International Conference on Software Engineering and Computer Systems and 4th International Conference on Computational Science and Information Management, pp. 471–476. Pekan, Malaysia. [Google Scholar]
34. Shi, L., Zhang, S., Arshad, A., Hu, Y., He, Y. et al. (2021). Thermo-physical properties prediction of carbon-based magnetic nanofluids based on an artificial neural network. Renewable and Sustainable Energy Reviews, 149, 111341. https://doi.org/10.1016/j.rser.2021.111341 [Google Scholar] [CrossRef]
35. Apicella, A., Donnarumma, F., Isgrò, F., Prevete, R. (2021). A survey on modern trainable activation functions. Neural Networks, 138, 14–32. https://doi.org/10.1016/j.neunet.2021.01.026 [Google Scholar] [PubMed] [CrossRef]
36. Pratiwi, H., Windarto, A. P., Susliansyah, S., Aria, R. R., Susilowati, S. et al. (2020). Sigmoid activation function in selecting the best model of artificial neural networks. Journal of Physics: Conference Series, 1471(1), 012010. [Google Scholar]
37. Amari, S. I. (1993). Backpropagation and stochastic gradient descent method. Neurocomputing, 5(4), 185–196. [Google Scholar]
38. Krestinskaya, O., Salama, K. N., James, A. P. (2019). Learning in memristive neural network architectures using analog back-propagation circuits. IEEE Transactions on Circuits and Systems I: Regular Papers, 66(2), 719–732. https://doi.org/10.1109/TCSI.2018.2866510 [Google Scholar] [CrossRef]
39. Riedmiller, M., Braun, H. (1993). Direct adaptive method for faster back-propagation learning: The RPROP algorithm. Proceeding in IEEE International Conference on Neural Networks, pp. 586–591. San Francisco, USA. [Google Scholar]
40. Alasadi, S. A., Wesam, S. B. (2017). Review of data preprocessing techniques in data mining. Journal of Engineering and Applied Sciences, 12(6), 4102–4107. [Google Scholar]
41. Son, N. H. (2006). Data cleaning and data preprocessing. Poland: University of Warsaw. [Google Scholar]
42. Esmeel, T. K., Hasan, M. M., Kabir, M. N., Firdaus, A. (2020). Balancing data utility versus information loss in data-privacy protection using k-anonymity. Proceeding in 2020 IEEE 8th Conference on Systems, Process and Control, pp. 158–161. Melaka, Malaysia. [Google Scholar]
43. Khandokar, I., Hasan, M., Ernawan, F., Islam, S., Kabir, M. N. (2021). Handwritten character recognition using convolutional neural network. Journal of Physics: Conference Series, 1918(4), 042152. [Google Scholar]
44. Li, W., Liu, Z. (2011). A method of SVM with normalization in intrusion detection. Procedia Environmental Sciences, 11, 256–262. https://doi.org/10.1016/j.proenv.2011.12.040 [Google Scholar] [CrossRef]
45. Singh, D., Singh, B. (2020). Investigating the impact of data normalization on classification performance. Applied Soft Computing, 97, 105524. https://doi.org/10.1016/j.asoc.2019.105524 [Google Scholar] [CrossRef]
46. Benyekhlef, A., Mohammedi, B., Hassani, D., Hanini, S. (2021). Application of artificial neural network (ANN-MLP) for the prediction of fouling resistance in heat exchanger to MgO-water and CuO-water nanofluids. Water Science and Technology, 84(3), 538–551. https://doi.org/10.2166/wst.2021.253 [Google Scholar] [PubMed] [CrossRef]
47. Rostami, S., Kalbasi, R., Sina, N., Goldanlou, A. S. (2021). Forecasting the thermal conductivity of a nanofluid using artificial neural networks. Journal of Thermal Analysis and Calorimetry, 145, 2095–2104. https://doi.org/10.1007/s10973-020-10183-2 [Google Scholar] [CrossRef]
48. Sindhu, T. N., Çolak, A. B., Lone, S. A., Shafiq, A., Abushal, T. A. (2023). A decreasing failure rate model with a novel approach to enhance the artificial neural network’s structure for engineering and disease data analysis. Tribology International, 192, 109231. [Google Scholar]
49. Szandala, T. (2021). Review and comparison of commonly used activation functions for deep neural networks. Bio-Inspired Neurocomputing, 903, 202–224. [Google Scholar]
50. Fidan, S., Oktay, H., Polat, S., Ozturk, S. (2019). An artificial neural network model to predict the thermal properties of concrete using different neurons and activation functions. Advances in Materials Science and Engineering, 2019, 1–13. [Google Scholar]
51. Ayodele, O. F., Ayodele, B. V., Mustapa, S. I., Fernando, Y. (2021). Effect of activation function in modeling the nexus between carbon tax, CO2 emissions, and gas-fired power plant parameters. Energy Conversion and Management X, 12, 100111. https://doi.org/10.1016/j.ecmx.2021.100111 [Google Scholar] [CrossRef]
52. Rostam, S., Toghraie, D., Shabani, B., Sina, N., Barnoon, P. (2021). Measurement of the thermal conductivity of MWCNT-CuO/water hybrid nanofluid using artificial neural networks (ANNs). Journal of Thermal Analysis and Calorimetry, 143(2), 1097–1105. https://doi.org/10.1007/s10973-020-09458-5 [Google Scholar] [CrossRef]
53. Lin, C., Zhou, J., Lu, Q., Khabaz, M. K., Andani, A. K. et al. (2023). Thermal conductivity prediction of WO3-CuO-Ag (35:40:25)/water hybrid ternary nanofluid with artificial neural network and back-propagation algorithm. Materials Today Communications, 36, 106807. https://doi.org/10.1016/j.mtcomm.2023.106807 [Google Scholar] [CrossRef]
54. Dubey, S. R., Singh, S. K., Chaudhuri, B. B. (2022). Activation functions in deep learning: A comprehensive survey and benchmark. Neurocomputing, 503, 92–108. https://doi.org/10.1016/j.neucom.2022.06.111 [Google Scholar] [CrossRef]
55. Pantalé, O. (2023). Comparing activation functions in machine learning for finite element simulations in thermomechanical forming. Algorithms, 16(12), 537. https://doi.org/10.3390/a16120537 [Google Scholar] [CrossRef]
56. Jaliliantabar, F. (2022). Thermal conductivity prediction of nano-enhanced phase change materials: A comparative machine learning approach. Journal of Energy Storage, 46, 103633. https://doi.org/10.1016/j.est.2021.103633 [Google Scholar] [CrossRef]
57. PVR, N. K., Venkatachalapathy, S., Kalidoss, P., Chaupal, P. (2023). Experimental investigation with ANN modeling of thermal conductivity and viscosity of a ternary nanofluid at different mixing ratios and volume concentrations. Journal of Molecular Liquids, 383, 122006. https://doi.org/10.1016/j.molliq.2023.122006 [Google Scholar] [CrossRef]
Cite This Article
 Copyright © 2024 The Author(s). Published by Tech Science Press.
This work is licensed under a Creative Commons Attribution 4.0 International License , which permits unrestricted use, distribution, and reproduction in any medium, provided the original work is properly cited.
 Downloads
 Citation Tools