
 Submit a Paper
 Propose a Special lssue
 Open Access
ARTICLE

Water Huff-n-Puff Optimization in High Saturation Tight Oil Reservoirs
1 School of Petroleum Engineering, Yangtze University, Wuhan, 430100, China
2 Cooperative Innovation Center of Unconventional Oil and Gas (Ministry of Education & Hubei Province), Yangtze University, Wuhan, 430100, China
3 Engineering Cost Department of PetroChina Changqing Oilfield Company, Xi’an, 71000, China
* Corresponding Author: Jing Sun. Email:
Fluid Dynamics & Materials Processing 2025, 21(3), 509-527. https://doi.org/10.32604/fdmp.2025.060393
Received 31 October 2024; Accepted 15 January 2025; Issue published 01 April 2025
 View Full Text
 Download PDF
Abstract
High saturation pressure reservoirs experience rapid pressure decline during exploitation, leading to significant changes in crude oil phase behavior and a continuous increase in viscosity after degassing, which adversely affects oil recovery. This challenge is particularly acute in tight sandstone reservoirs. To optimize the development strategy for such reservoirs, a series of experiments were conducted using core samples from a high saturation tight sandstone reservoir in the JS oilfield. Gas-dissolved crude oil was prepared by mixing wellhead oil and gas samples, enabling the identification of the critical point where viscosity changes as pressure decreases. Oil-water relative permeability experiments under varying viscosities revealed crude oil mobility trends with declining production pressure. Additionally, physical and numerical simulations of water huff-n-puff processes were performed, while nuclear magnetic resonance methods explored the effects of soaking time on oil-water imbibition. Key findings include the following optimal parameters for water huff-n-puff: (1) initiating the process when formation pressure is 75% of its original level, (2) a soaking time of 48 h, (3) an injection volume of 0.6 pore volumes per cycle, and (4) a 5 MPa pressure reduction per production stage. Numerical simulations further recommend initiating water injection after one year of depletion, with an optimal cumulative injection volume of 18,000 cubic meters, a soaking time of 10 days, and a producing pressure difference of 5 MPa.Keywords
The main characteristic of the development of high saturation pressure reservoirs is the small difference in formation pressure. Under the condition of natural energy depletion development, when the pressure in the vicinity of the wellbore drops below the bubble point pressure, the dissolved gas in the crude oil begins to expand and separate, leading to an increase in crude oil viscosity and a continuous increase in the gas-oil ratio [1,2]. Early water injection and controlled oil production can achieve a higher recovery rate. Tight oil reservoirs usually require volume fracturing technology for economic development [3]. After fracturing, a complex fracture network is formed within the reservoir, and it is necessary to recognize the fluid flow characteristics and take timely measures such as gas or water injection to empower development and achieve efficient reservoir development. Water injection huff-n-puff, by supplementing formation energy through early water injection, relies on the spontaneous imbibition action of capillary forces within the pores of water-wet rocks, allowing the crude oil in the pores to be imbibed and replaced by the water in the fractures and finally, the replaced crude oil and residual water are produced together, which is one of the effective ways to improve the recovery rate of tight oil reservoirs [4–6].
The application of water injection huff-n-puff in tight oil reservoirs has achieved positive results. Li et al. [7] summarized the key factors affecting the effectiveness of water flooding huff-n-puff, such as the timing, volume and rate of water injection, along with geological factors. The majority of scholars utilize experimental methods or numerical simulation techniques to optimize the parameters for water injection huff-n-puff parameters optimization. Ma et al. [8] employed Taguchi L9 orthogonal array to optimize the water injection huff-n-puff parameters. They suggested that the influences of the factors on the well oil production were ranked by water injection volume
2 Characteristics of Fluid Flow in High Saturation Tight Oil Reservoirs
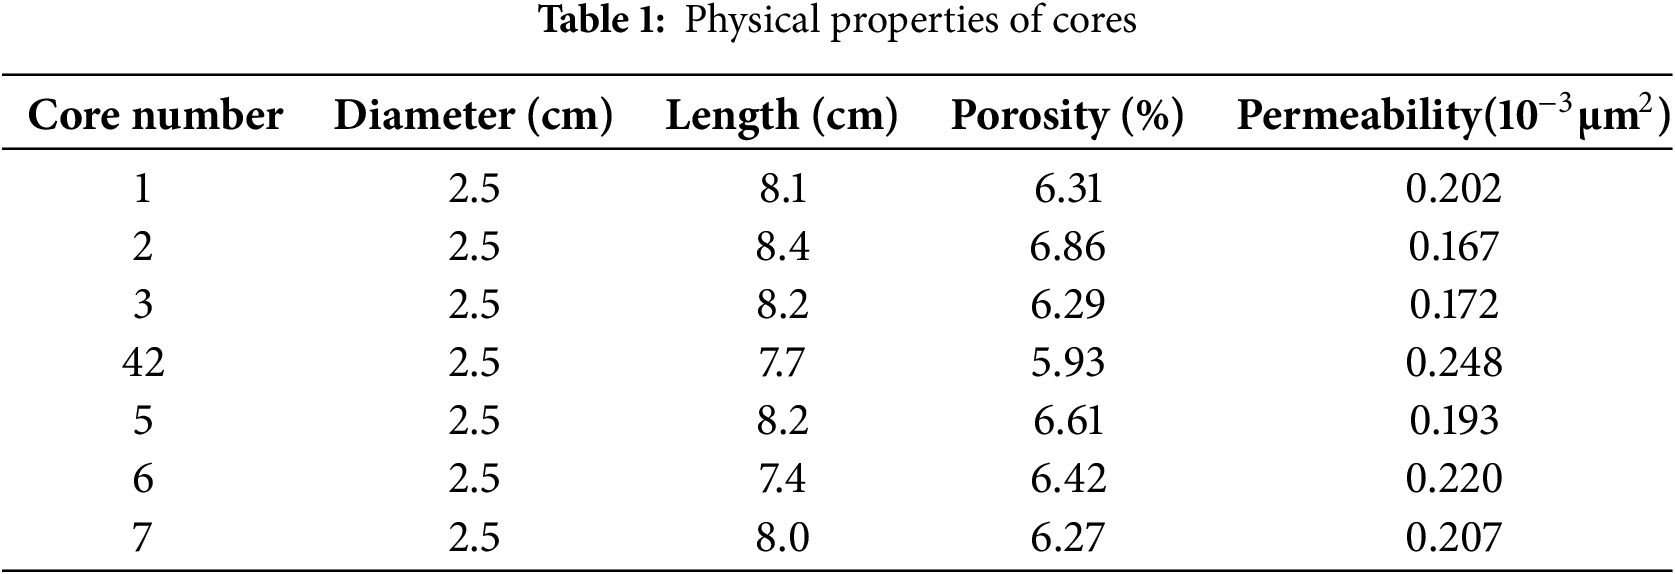
The experimental core samples were obtained from a high saturation pressure tight oil reservoir in the JS oilfield. The reservoir rock types mainly consist of siltstone and fine-grained sandstone, with rock compositions primarily being quartz and feldspar. Most of the cementation types are porosity and regenerated porosity, and the interstitial fillings are primarily argillaceous and calcite. The clay content in the target formation reaches 5.3% [14]. The physical properties of the core are presented in Table 1, with an average porosity of 6.4% and an average permeability of 0.2 × 10⁻³ μm2. The original reservoir pressure of the formation was 30.3 MPa, the saturation pressure was 23 MPa, and the reservoir temperature was 118°C. The formation water salinity is 7955 mg/L, and we prepared a saltwater solution with the same salinity as the experimental water sample. The experimental oil was prepared by mixing wellhead crude oil and kerosene.
2.2 Crude Oil Viscosity Change Characteristics
During the depletion production process of high saturation oil reservoirs, when the formation pressure drops below the saturation pressure, the dissolved gas in the crude oil begins to gradually separate, causing changes in oil viscosity. Gas bubbles expand as the pressure decreases, and once a continuous gas phase is formed, the reservoir starts to exhibit two-phase flow of gas and oil. The relative mobility of crude oil is reduced, and at the same time, gas expansion drives the production of some crude oil [16]. To explore the optimal timing for water injection, it is necessary to consider making full use of the formation’s elastic energy as well as utilizing some of the gas expansion energy. After the dissolved gas separates from the crude oil, the viscosity of the crude oil increases. Therefore, the optimal timing for water injection is when the viscosity of the crude oil begins to change significantly during the decrease in formation pressure. At this time, the formation pressure is near the saturation pressure, and some dissolved gas has separated from the crude oil. To find the best timing for water injection in high saturation oil reservoirs, this paper conducts experiments on the change of degassing viscosity during the depletion production process of crude oil. The experimental steps are as follows: ① Mixing wellhead oil samples with wellhead gas samples to create gas-dissolved crude oil with a gas-oil ratio of 165 m3/m3 under reservoir conditions; ② Perform single degassing to obtain the degassed oil sample at reduced pressure; ③ Transfer the degassed oil sample to the viscometer, maintaining consistent temperature and pressure, and measure the viscosity of the oil sample; ④ Repeat the steps of transferring, degassing, transferring, and measuring viscosity to obtain the viscosity change curve of crude oil as the pressure decreases. The experimental setup is shown in Figs. 1 and 2.
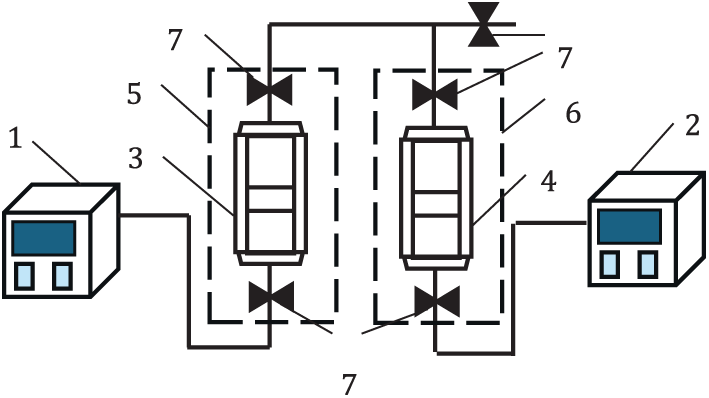
Figure 1: Installation diagram of high temperature and high pressure sampler (1, 2: Constant flow pumps; 3: Separator gas storage bottle; 4: Sample preparation container; 5, 6: Constant temperature baths; 7: Valves)
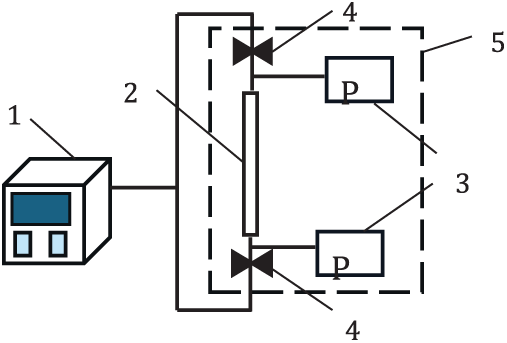
Figure 2: Installation diagram of kinematic viscosity tester (1: Constant flow pump; 2: High-temperature high-pressure capillary; 3: Pressure gauge; 4: Valves; 5: Constant temperature bath)
Following the experimental procedures, the gas-dissolved crude oil was first mixed, and then its viscosities under different pressure conditions were tested. The test results are shown in Fig. 3. When the pressure decreased from 30.3 to 23 MPa, the viscosity of the crude oil slightly decreased, primarily due to the reduction in pressure causing the crude oil to expand in volume, which led to a reduction in viscosity. When the pressure dropped below the saturation pressure, the dissolved gas in the crude oil began to separate, the light components decreased, and the viscosity of the crude oil began to increase. When the pressure was within the range of 16.2 to 30.3 MPa, the viscosity change of the degassed crude oil was relatively small. The optimal timing for water injection should be before the viscosity of the crude oil changes significantly as the formation pressure decreases. In this way, crude oil, with a relatively low viscosity, can be driven by both the expansion of dissolved gas and the elastic energy of the formation.
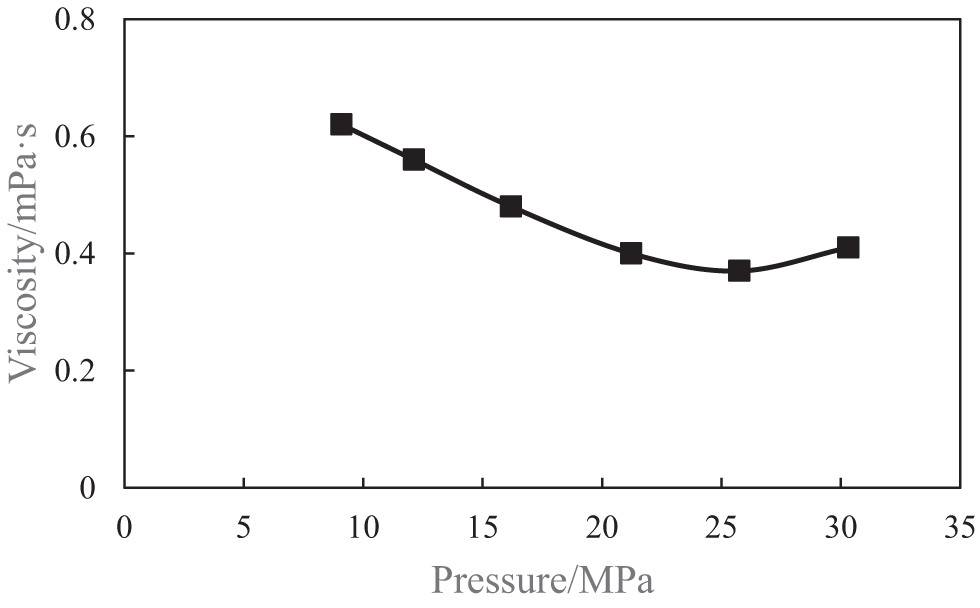
Figure 3: Viscosity change curve of crude oil after degassing
2.3 Reservoir Oil-Water Flow Characteristics
In high saturation tight oil reservoirs, the viscosity of crude oil changes as formation pressure decreases during production, and this viscosity change directly affects the flow of crude oil in the reservoir, especially in tight sandstone reservoirs with well-developed micropores and nanopores. To understand the impact of crude oil viscosity changes on the flow capacity of oil in tight sandstone, we conducted oil-water relative permeability experiments under different crude oil viscosities. Based on the experimental results, we have identified the crude oil viscosity corresponding to the maximum oil phase relative permeability under reservoir conditions.
The experimental steps are as follows:
1. Prepare three types of experimental oil under specific temperature conditions.
2. Saturate the core samples with salt solution, establish the irreducible water saturation by oil displacement, and measure the oil phase permeability under irreducible water conditions.
3. Conduct water flooding to displace oil, recording the time of water breakthrough, cumulative water production, cumulative oil production, and displacement pressure difference.
4. Repeat the above steps with two additional sets of core samples and experimental oils.
5. Process the data and plot the curves.
The viscosity parameters for the experimental oils are shown in Table 2, and the results of the oil-water relative permeability experiments are shown in Fig. 4. When the water saturation is greater than 45%, the oil phase relative permeability increases as the viscosity of the simulated oil decreases. In Fig. 4, at a water saturation of 50%, the oil phase relative permeabilities for oil with viscosity of 0.38, 0.41, and 0.53 mPa·s are 0.14, 0.12, and 0.09, respectively.
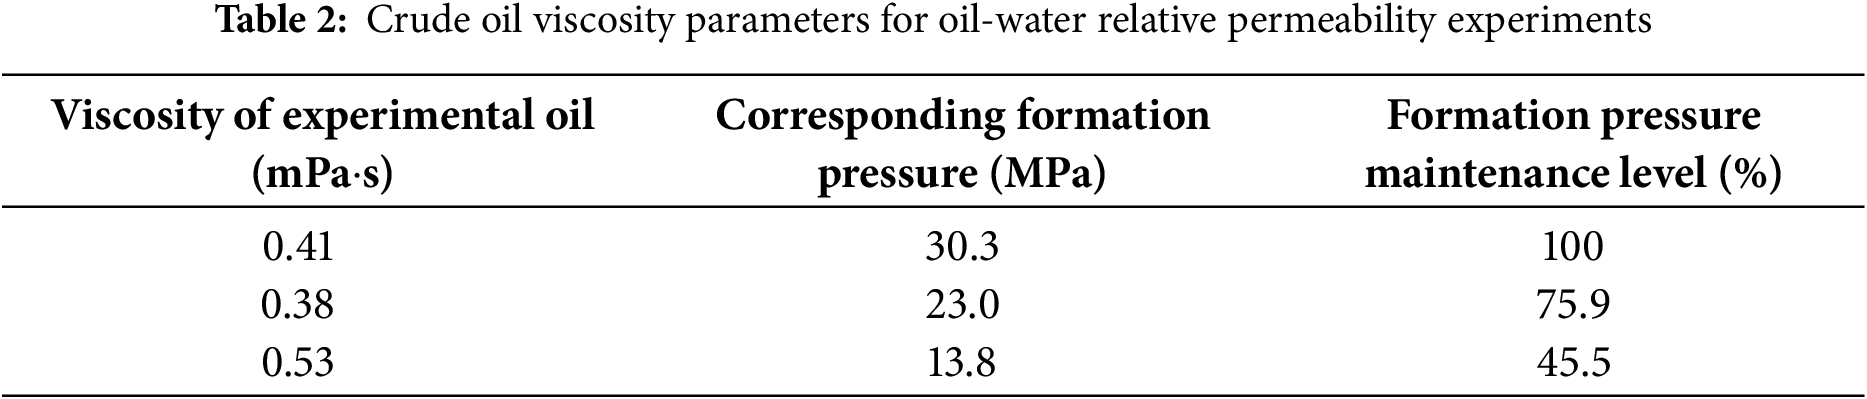
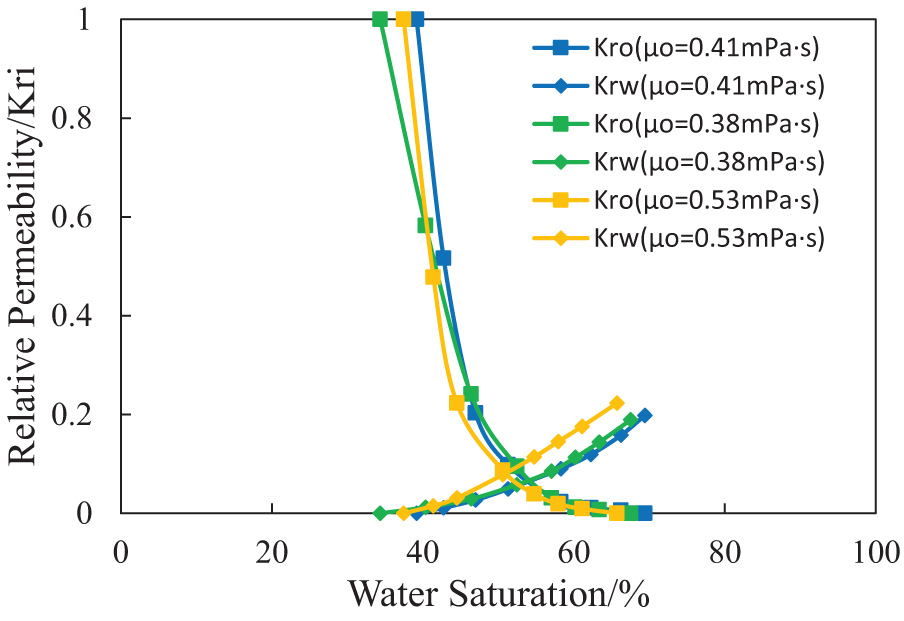
Figure 4: Oil-water relative permeability curves of tight sandstone reservoirs under different crude oil viscosities
When the water saturation is 50%, if the formation pressure decreases by 54.5%, the oil phase relative permeability, affected by the viscosity change due to pressure, will decrease from 0.12 to 0.09, and the relative mobility of the oil phase will be reduced by 25% compared to the original state. Under reservoir conditions, the variation in the relative mobility of oil during two-phase oil-water flow is primarily caused by changes in the viscosity of the crude oil since the viscosity of formation water remains almost constant. While the oil viscosity is mainly related to the formation pressure. Experimental results indicate that as the reservoir is developed and the formation pressure gradually decreases, the oil viscosity initially decreases and then increases (Fig. 3), leading to an initial enhancement followed by a weakening of the oil mobility due to changes in its viscosity (Fig. 4).
3 Water Injection Huff and Puff Experiment for High Saturation Tight Oil Reservoirs
The oil recovery mechanism of water injection huff-n-puff in tight oil reservoirs primarily relies on the imbibition displacement action driven by the capillary forces in the oil layer, and water injection can effectively complement producing energy, playing a role in oil-water displacement [17,18]. The wettability of the reservoir, the degree of fracture development, and permeability are the main controlling factors affecting the recovery factor of water huff-n-puff [19], while some process parameters, such as the injection volume and soaking time, are also crucial to the final recovery factor of water huff-n-puff [7]. This paper focuses on the study of tight sandstone reservoirs, optimizing the parameters of water huff-n-puff through physical simulation experiments, providing a reference for the efficient development of the study area and similar high saturation pressure tight sandstone oil reservoirs.
The experimental steps are as follows:
1. Measure the physical properties of the core samples and prepare experimental oil with a viscosity of 0.38 mPa·s at the specific temperature using degassed crude oil and kerosene.
2. Saturate the core samples with oil under high pressure and measure the amount of oil used for saturation.
3. After saturation, maintain a constant pressure of 30.3 MPa in an oven at 80°C to drive the oil until the pressure at the outlet end rises to 30.3 MPa.
4. First, reduce the pressure for development to a certain level of formation pressure maintenance, and then proceed with water huff-n-puff.
5. Conduct the water huff-n-puff simulation according to the optimized process parameters in sequence.
6. Record the cumulative amount of oil produced and calculate the degree of cumulative recovery. The physical simulation experimental process of water huff-n-puff is shown in Fig. 5.
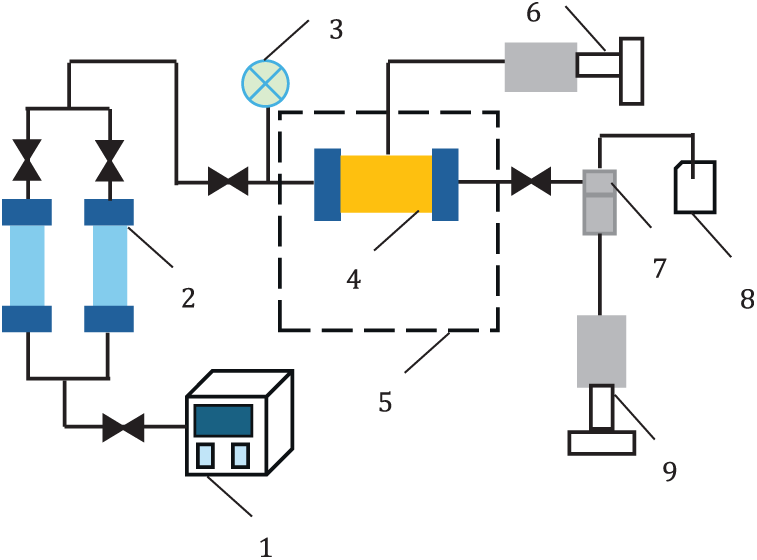
Figure 5: Schematic diagram of high-temperature high-pressure water injection huff-n-puff experimental setup (1: Peristaltic pump; 2: Piston cylinder; 3: Pressure gauge; 4: Core holder; 5: Constant temperature oven; 6: Confining pressure pump; 7: Back pressure vessel; 8: Beaker; 9: Back pressure pump)
3.2 Optimization of Water Huff-n-Puff Parameters
The optimization process for water huff-n-puff involves sequentially optimizing injection timing, soaking time, injection volume, and producing pressure difference. The results of the previous parameter optimizations are applied to subsequent optimization plans.
3.2.1 Optimization of Injection Timing
Injection timing optimization plan is described as following step. Select formation pressure levels of 85%, 75%, 65%, and 55%, corresponding to pressure of 25.8, 22.7, 19.7, and 16.7 MPa, respectively. Taking the case of maintaining formation pressure at 85% as an example, when the system pressure drops to 25.8 MPa, water injection is started from the inlet to restore the pressure to 30.3 MPa. After soaking for 48 h, reduce the pressure by 2 MPa at the outlet during production each time. When the system pressure drops back to 25.8 MPa, perform a second round of water huff-n-puff. A total of three rounds of water huff-n-puff are carried out, with the third round ending when no more oil is produced. The experimental results are shown in Fig. 6.
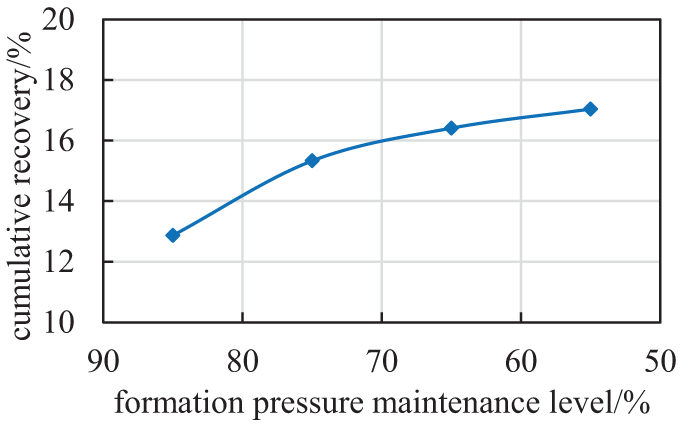
Figure 6: Cumulative recovery factor at various huff-n-puff timing
Different water injection timings have a certain impact on cumulative oil recovery. When water is injected at lower formation pressure levels, the water can access a larger fracture matrix space, leading to a broader imbibition effect.
In practical production, injecting water too early may lead to inadequate use of natural elastic energy, while injecting water too late can result in severe degassing of high-saturation crude oil, with significant crude oil viscosity changes that are detrimental to stable production. For high saturation pressure tight oil reservoirs, to ensure higher recovery, water should be injected when the formation pressure is close to the saturation pressure. This approach maintains formation energy, mitigates severe degassing of crude oil, and maximizes the use of elastic energy, allowing the injected water to have a certain imbibition effect. From Fig. 6, it can be observed that the cumulative recovery rate shows an increasing trend as the formation pressure maintenance level decreases. This indicates that within a certain range, the reduction of the formation pressure maintenance level contributes to enhancing the oil recovery factor. However, this relationship is not linear. When the pressure maintenance level is less than 70%, the rate of increase in recovery begins to slow down, suggesting that within this range, the marginal benefit of decreasing formation pressure on improving recovery rates starts to diminish. Comparing the formation pressure maintenance levels at 75% and 65%, it is found that at a pressure maintenance level of 75%, the viscosity of the crude oil changes less around this pressure (Fig. 3) and stronger oil phase flow capacity at this viscosity (Fig. 4). Therefore, we conclude that a water injection timing at a 75% pressure maintenance level represents the optimal point.
3.2.2 Optimization of Soaking Time
Soaking time optimization plan is shown as below. Apply the results from the injection timing optimization to the soaking time optimization plan. The soaking times selected are 36, 48, 60, and 72 h. Taking 36 h as an example, when the formation pressure maintenance level is 75%, corresponding to pressure of 22.7 MPa, 0.4 PV of water is injected from the inlet. Before and after the soaking period, NMR methods are used to scan the distribution of oil within the core samples’ pores (with deuterium oxide replacing mineralized water). Production at the outlet is carried out by reducing the pressure by 2 MPa each time, and when the system pressure drops back to 22.7 MPa, the second round of water huff-n-puff is conducted. Totally, there are three rounds in whole experiment. Especially, the ending target of the third round is that no oil is produced from the outlet. The NMR curves of the core samples before and after the soaking period are shown in Figs. 7 to 9. During the soaking stage, the static imbibition under high pressure is key to the oil recovery by water huff-n-puff. The optimal soaking time is the duration that allows complete imbibition within the range of area affected by the injected water.
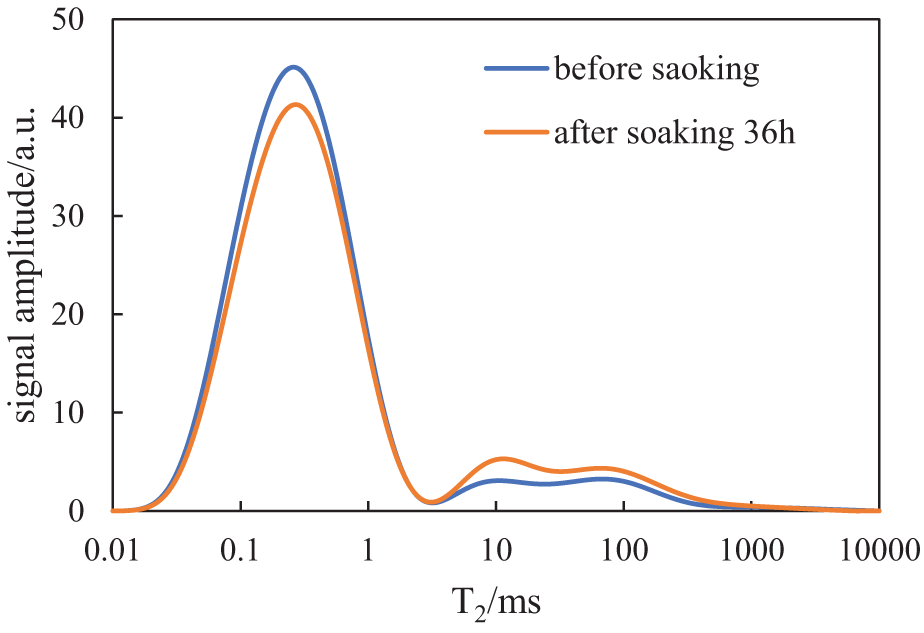
Figure 7: Core NMR T2 spectrum before and after the first round of soaking (36 h)
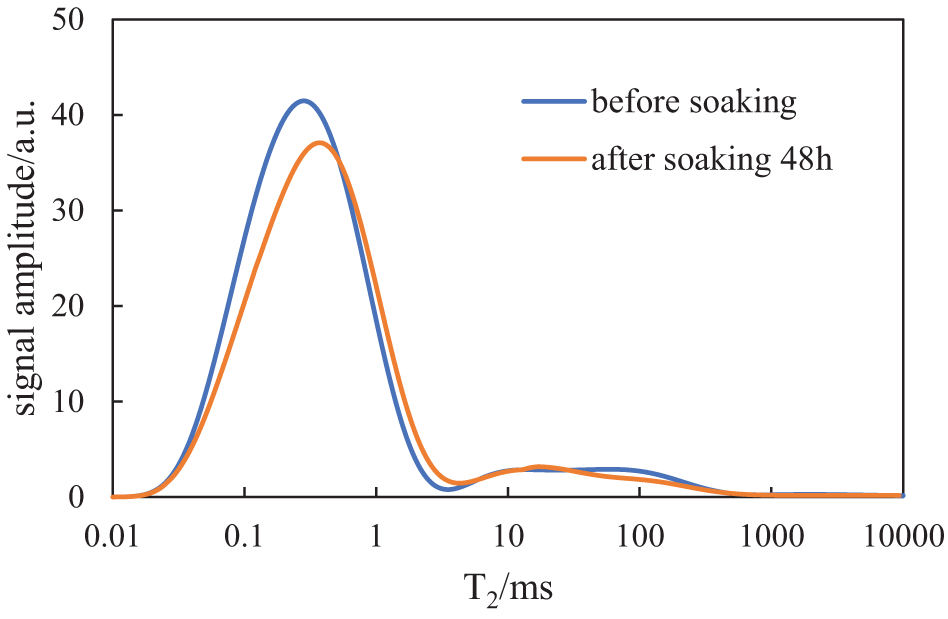
Figure 8: Core NMR T2 spectrum before and after the first round of soaking (48 h)
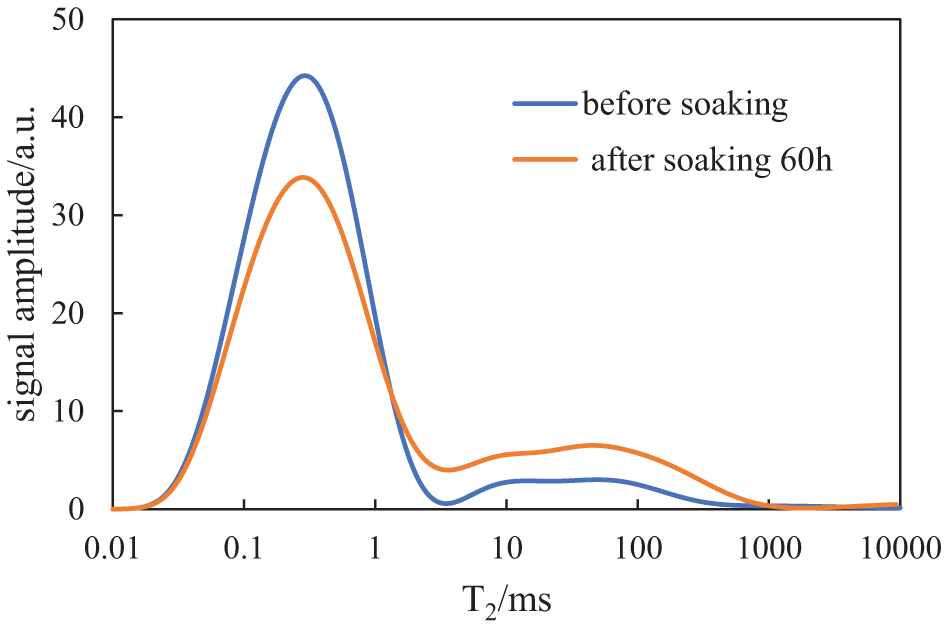
Figure 9: Core NMR T2 spectrum before and after the first round of soaking (60 h)
In low-field NMR, the relationship between transverse relaxation time and pore radius is generally simplified as follows [20]:
Eq. (1) indicates that the larger the
The optimization results of the soaking time are shown in Fig. 10, where the cumulative recovery factor increases with the increase in soaking time. When the soaking time exceeds 48 h, the growth rate of the cumulative recovery factor slows down. This is because the fracture surfaces are covered by the oil displaced by imbibition after a long period of imbibition, which suppresses further imbibition effects. Therefore, the cumulative recovery factor gradually slows down and tends to stabilize with the increase in soaking time. Since the amount of oil in the core throat decreases after each round of water huff-n-puff, the soaking time for each round can be appropriately reduced as the number of huff-n-puff rounds increases. In conjunction with the NMR curves, it is observed that after soaking 48 h, there is a trend of crude oil “migrating” from micropores to small pores. After soaking 60 h, the oil-water imbibition displacement is complete, and the core reaches a new state of oil-water distribution balance. From Fig. 10, it can be observed that the cumulative recovery rate shows an increasing trend as the soaking time increases. However, this relationship is not linear. When the soaking time is more than 48 h, the rate of increase in recovery begins to slow down. Meanwhile, the NMR result indicates that the oil-water imbibition displacement is incomplete (Fig. 8), it is easier for two fluids to flow since they mixed. Therefore, it is considered that 48 h is the optimal soaking time for laboratory core experiments.
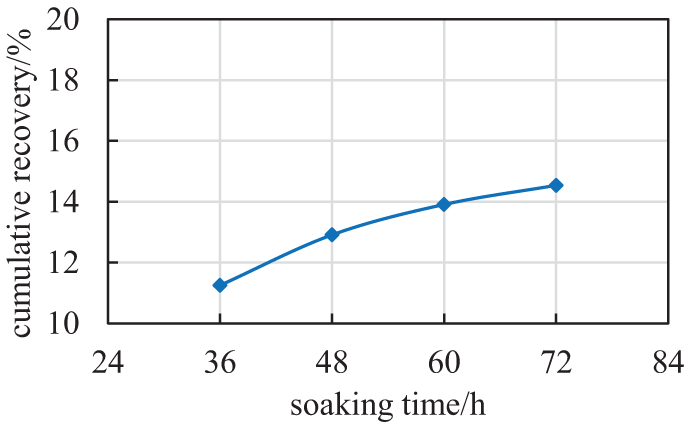
Figure 10: Cumulative recovery factor at various soaking time
3.2.3 Optimization of Injection Volume
Incorporating the optimized results of injection timing and soaking time, injection volumes were selected as 0.2, 0.4, 0.6, and 0.8 PV, respectively. Taking an injection volume of 0.2 PV as an example, when the formation pressure maintenance level is 75%, corresponding to pressure of 22.7 MPa, 0.2 PV of water is injected from the inlet, followed by a 48-h soaking period. Production is carried out at the outlet with a pressure difference of 2 MPa each time. When the system pressure drops back to 22.7 MPa, the second round of water huff-n-puff is conducted. Totally, there are three rounds in whole experiment. Especially, the ending target of the third round is that no oil is produced from the outlet. The experimental results, as shown in Fig. 11, indicate that the cumulative recovery of oil increases rapidly with the increase of injection volume, but the rate of increase slows down when the injection volume exceeds 0.6 PV.
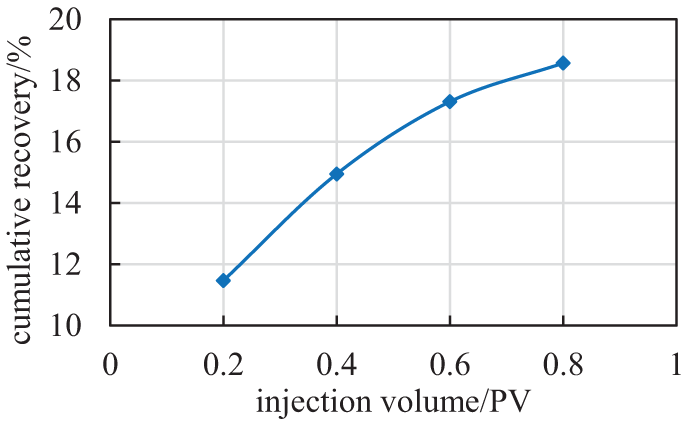
Figure 11: Cumulative recovery factor at various injection volume
The injection volume affects the degree of formation pressure restore. An insufficient injection volume fails to effectively complement producing energy and does not fully utilize the capillary effect for imbibition displacement. While an excessive injection volume results in a portion of the water only performing an unstable displacement in the fractures, not participating in the imbibition process, which affects oil recovery efficiency. At the initial stage of water injection, the oil-water imbibition displacement gradually strengthens under the pressure difference. When the imbibition displacement is complete, it is difficult for the following injection water to reach the further of the formation, furtherly, the exchange rate between oil and water is reduced. Since the amount of oil in the core throat decreases after each round of water huff-n-puff, the injection volume for each round can be appropriately increased. From Fig. 11, it can be observed that the cumulative recovery rate shows an increasing trend as the injection volumes increase. However, this relationship is not linear. When the injection volumes are more than 0.6 PV, the rate of increase in recovery begins to slow down. This means that when the injection volume exceeds 0.6 PV, the effect of increasing the recovery rate by adding more injection volume will decrease. Considering that construction costs are directly proportional to the injection volume, we have chosen 0.6 PV, which also ensures the imbibition displacement of each round of water injection.
3.2.4 Optimization of Production Pressure Difference
Incorporating the optimization results of the previous various parameters, producing pressure difference of 2, 3, 4, and 5 MPa were selected for each stage. Taking the production with a pressure reduction of 2 MPa per round as an example, when the formation pressure level is 75%, corresponding to pressure of 22.7 MPa, 0.6 PV water was injected into core from the inlet, followed by a 48-h soaking. Production is carried out at the outlet end with a pressure difference of 2 MPa each time. When the system pressure drops back to 22.7 MPa, the second round of water huff-n-puff is conducted. Totally, there are three rounds in whole experiment. Especially, the ending target of the third round is that no oil is produced from the outlet. The experimental results, as shown in Fig. 12, indicate that the cumulative recovery degree shows a linearly increasing trend with the increase in production pressure difference. Due to the development of micro-nano pores in tight oil reservoirs, the larger the producing pressure difference, the more sufficient the elastic expansion energy released by the rock framework and fluids, which is more conducive to the oil production from tiny pores along with the injected water. On the other hand, an excessively large producing pressure difference can lead to a rapid decline in formation pressure, severe degassing of crude oil, and stress sensibility, which further compress small throats and affect crude oil production. Therefore, it is recommended to produce with a pressure difference of 5 MPa each time.
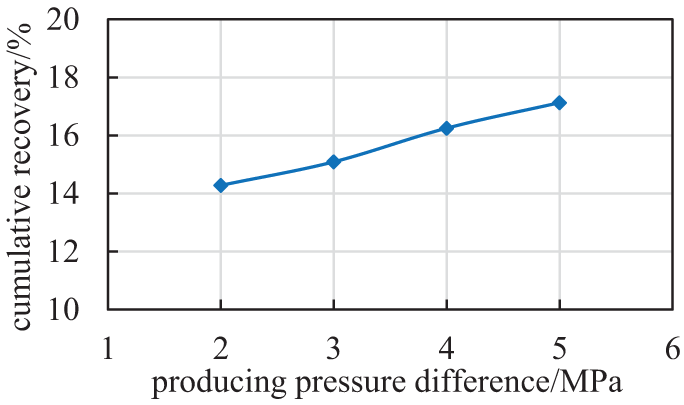
Figure 12: Cumulative recovery factor at various producing pressure difference
3.3 Experimental Results and Insights
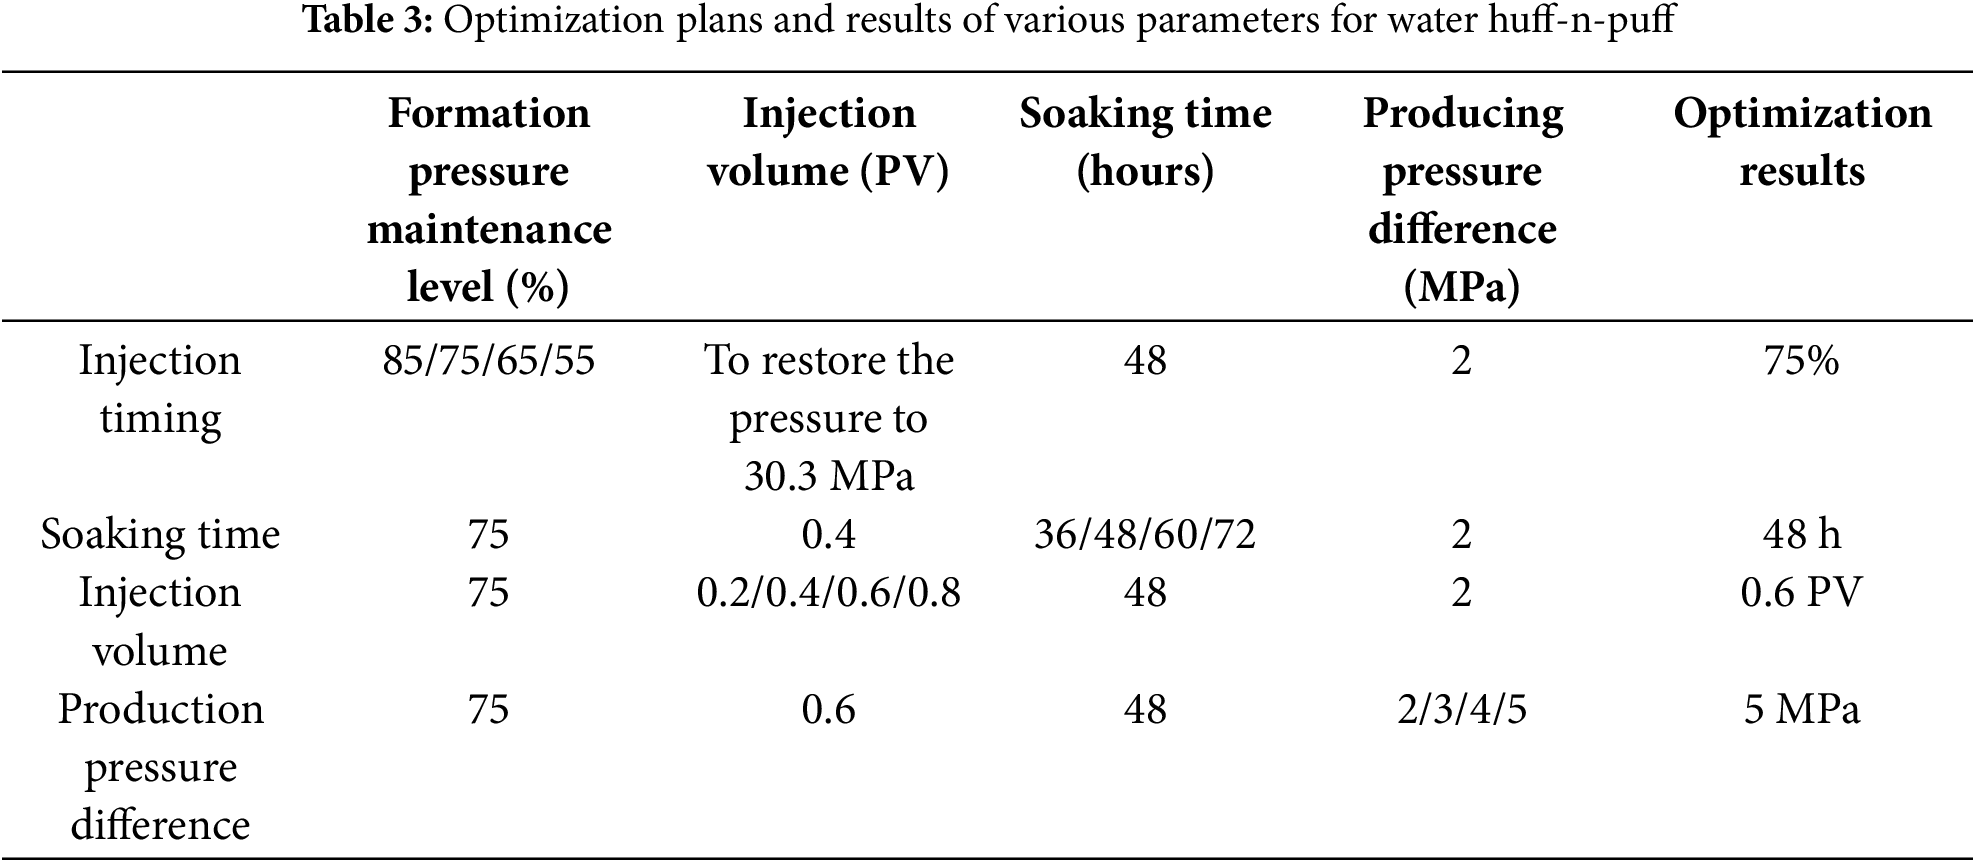
The optimization plans for various parameters of water injection huff-n-puff in high saturation tight oil reservoirs and their experimental results are shown in Table 3. The optimization of the injection and soak timing primarily considers the crude oil viscosity changes at the reservoir pressure and its mobility in the tight reservoir. The soaking time is mainly related to the range of area affected by the injected water and the oil saturation within that area. Through NMR methods, 48 h was determined as the optimal soaking time for indoor core experiments. For the optimization of the injection volume, there are two things that has to be considered. One is that the volume of oil recovered from the reservoir, which means that the injection volume could cover this reduction volume. Second point is that imbibition agents could be added into water at the initial stage injection, which could help improve the efficiency of the displacement. The optimization of the producing pressure difference requires balancing between the amount of formation elastic energy released by each pressure reduction and the stress sensibility caused by the decrease in formation pressure. Summarily, the optimization of water huff-n-puff parameters starts from the changes of crude oil properties during the development of high saturation pressure reservoirs and the mobility of crude oil in tight reservoirs. And in the foundation of them, the optimal parameter combination is obtained by conducting laboratory core water huff-n-puff simulation experiments.
4 Numerical Model Optimization Study
Based on black-oil model in Eclipse software, a numerical simulation study of the optimized water injection and soak process after volume fracturing was conducted using the HY5 horizontal well parameter model as a foundation. The governing equations are shown as Eqs. (2)–(4) [22]. The reservoir area is 1900 m long and 600 m wide. Model parameters are as follows: initial oil saturation: 0.62, formation pressure: 47.8 MPa, reservoir matrix permeability: 0.0025 mD and fracture permeability: 10 mD. The grid step sizes are DX = 5 m, DY = 5 m, and DZ = 40 m, resulting in a total of 45,600 grid cells (380 × 120 × 1). The simulated horizontal section length is 1600 m, with 27 fracturing stages and a half-length of 250 m for each fracture. The model fracture parameters are set according to the actual fracturing operation, and the model accuracy meets the expectation. The model construction is shown in Figs. 13 and 14.
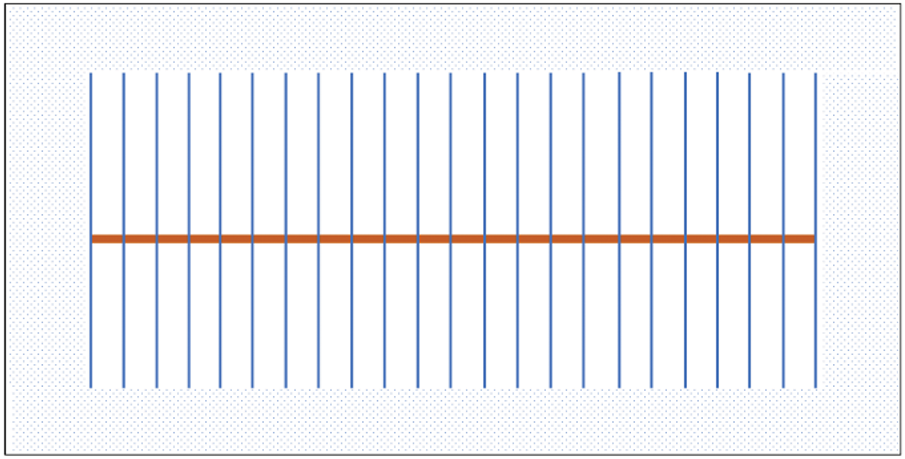
Figure 13: Grid partitioning in simulation area
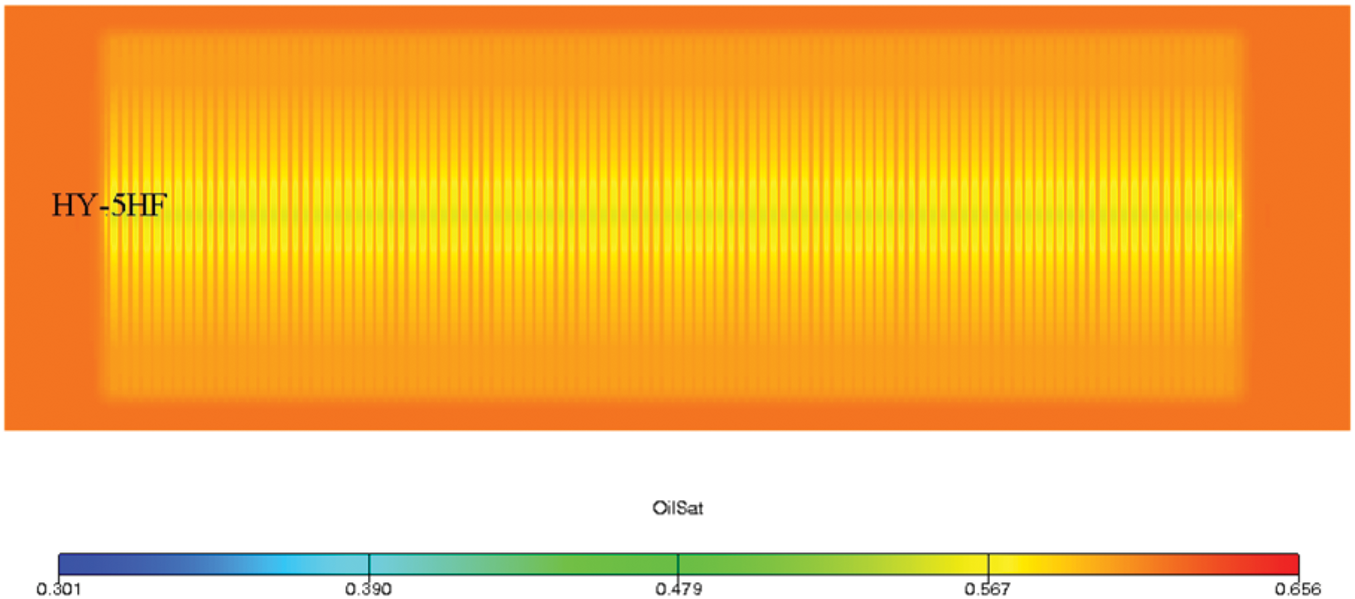
Figure 14: HY5 horizontal well numerical model
4.2 Water Huff-n-Puff Parameters Optimization
The water injection huff-n-puff oil recovery method can be divided into three stages: water injection pressure enhancement, well soaking replacement, and oil production. The specific process is as follows:
1. Water Injection Pressure Enhancement Stage: In this stage, water is injected to increase the formation pressure and replenish the reservoir energy.
2. Well Soaking Replacement Stage: During the well soaking stage, oil and water undergo imbibition replacement under the action of capillary forces. Since the imbibition replacement process is quite slow, the soaking time must not be too short; otherwise, the capillary force imbibition effect will be weak and not fully utilized. Therefore, an adequate soaking time helps to improve the recovery rate.
3. Oil Production Stage: Oil production is the process of energy release from rock and fluids. The formation pressure declines over time during production. Initially, the water cut is high, and it gradually decreases and stabilizes over the production period. Daily oil production first increases and then gradually decreases.
To optimize the imbibition oil recovery process, it is intended to start from these three stages, optimizing the injection and soak timing, injection volume, soaking time, and production pressure difference respectively.
4.2.1 Optimization of Injection Timing
Water injection and soak were initiated after the oil wells had been in production for 1, 2, 3, 4, and 5 years, respectively. The injection rate was set at 300 m3/d, with a cumulative injection volume of 1.8 × 10⁴ m3, only one injection cycle. The wells were then soaked for 10 days before resuming production, which continued for 15 years. The cumulative oil production from the horizontal wells under different injection and soak timings is shown in Fig. 15.
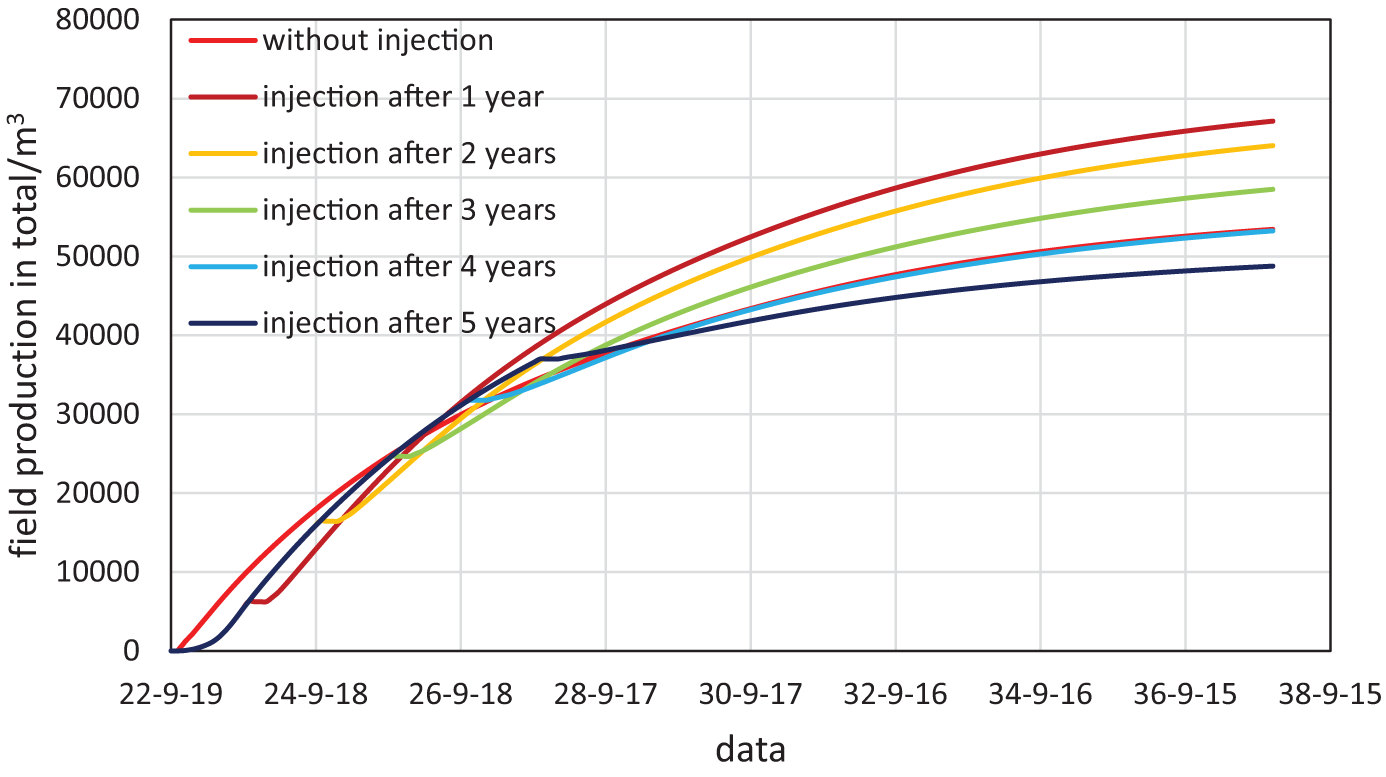
Figure 15: Cumulative oil production at various Huff-n-Puff timing
4.2.2 Optimization of Injection Volume
The primary function of water injection is to rapidly replenish and restore reservoir energy by injecting water. The degree of energy recovery is directly related to the amount of water injected into the reservoir. While more injected volume generally leads to better energy recovery, it is not always the case that more is better. If the injected volume exceeds the effective displacement volume, the water cut in the early production stage will be high, leading to resource waste and increased water injection costs. Additionally, with a constant injection rate, a larger injection volume means a longer injection time, extending the development cycle of each water injection and soak operation, which affects the economic benefits of the development period. Therefore, it is necessary to optimize the optimal injection volume. Numerical simulation was used to optimize the injection volume, with cumulative injection volumes set at 6000, 12,000, 18,000, 24,000, and 30,000 m3, an injection rate of 300 m3/d, water injection after 1 year of production, a 10-day soaking period, only one injection cycle, and 15 years of oil well production. The simulation results showed that the cumulative oil production increased with the increase in cumulative injection volume (Fig. 16). It can be seen from Fig. 17 that the curve has an obvious inflection point at 18,000 m3. When it exceeds 18,000 m3, the slope of the straight-line decreases. Considering that more injection volumes are injected, the time and cost increase accordingly, but the benefits generated by the increase are limited. Therefore, we chose the optimal water injection volume at the inflection point of the line, which is 18,000 m3.
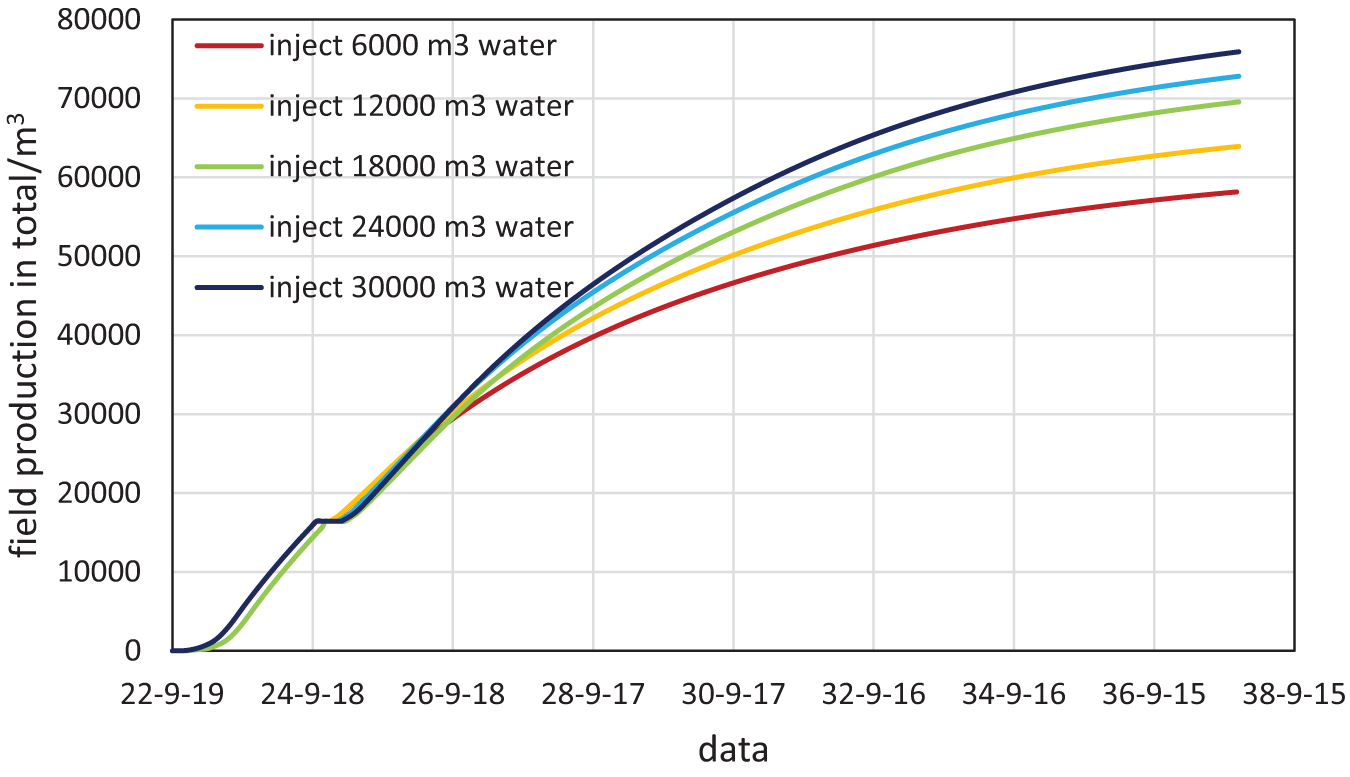
Figure 16: Cumulative oil production at various injection volume
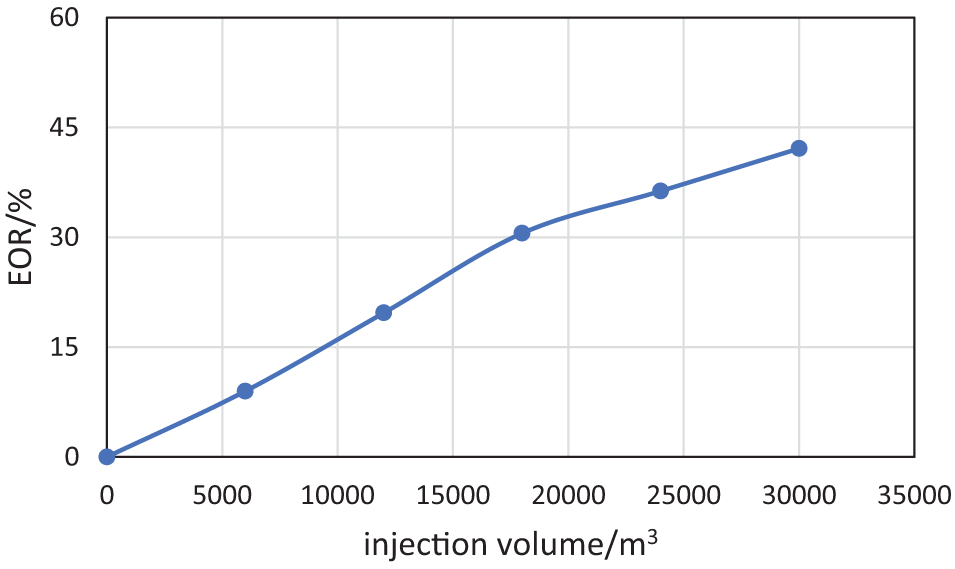
Figure 17: Enhancement oil recovery corresponding to different injection volumes
4.2.3 Optimization of Soaking Time
The soaking time refers to the period following the competition of the water injection phase, during which the well is shut in to allow for static imbibition displacement of oil and water in the reservoir. It is the second critical phase of water injection huff-n-puff in horizontal wells that is essential for the displacement of crude oil from the matrix to the fracture region through oil-water displacement. If the soaking time is too short, the capillary force imbibition effect will be weak, and the enhancement in recovery rate will be insignificant. Conversely, if the soaking time is too long, the time cost increases, affecting the economic benefits. In the numerical simulation optimization plan, the soaking times were set to 0, 5, 10, 15, and 20 days, with water injection after 1 year of production, an injection rate of 300 m3/d, a cumulative injection volume of 1.8 × 10⁴ m3, and oil well production for 15 years. The simulation results of the cumulative oil production for horizontal wells under different soaking times are shown in Fig. 18. As the soaking time increases, the cumulative oil production first increases and then decreases, reaching a maximum when the soaking time is 10 days. Considering the time cost, a soaking time of 10 days is optimal.
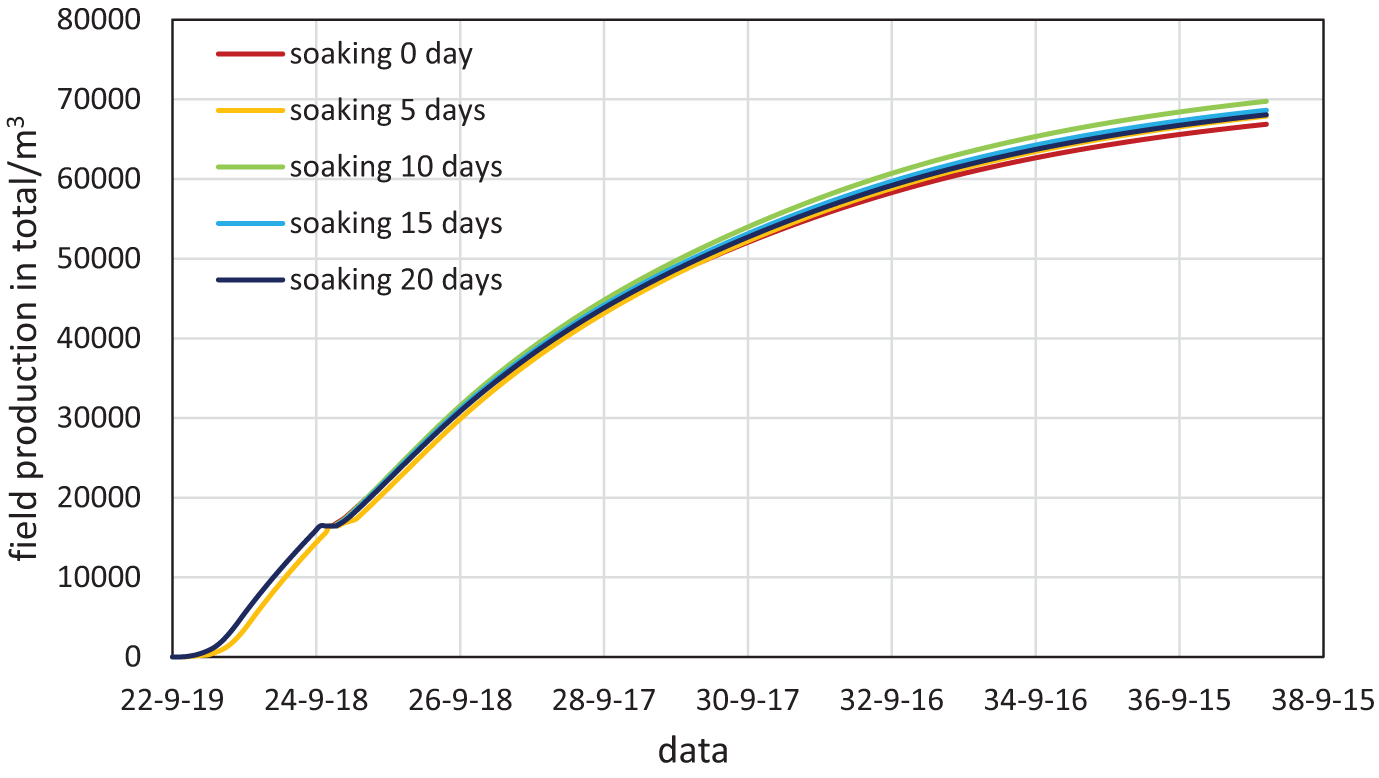
Figure 18: Cumulative oil production at various soaking time
4.2.4 Optimization of Production Pressure Difference
For oil wells, the production pressure difference is defined as the difference between the formation pressure and the bottom-hole flowing pressure. A reasonable production pressure difference can help maintain stable production of the oil well and prevent formation damage. In the numerical simulation optimization plan, the production pressure difference is controlled by setting a constant bottom-hole flowing pressure. After one year of production, the formation pressure is 21.2 MPa. During the production stage of water injection and soak, the bottom-hole flowing pressures are set to 19.2, 18.2, 17.2, 16.2, and 15.2 MPa, respectively. Water injection is initiated after one year of production, with an injection rate of 300 m³/d, a cumulative injection volume of 3.0 × 10⁴ m3, a soaking period of 10 days, and the oil well is produced for 15 years. The simulation results of the cumulative oil production from horizontal wells under different production pressure differences are shown in Fig. 19, indicating that the cumulative oil production continues to increase with the increase in production pressure difference, and the maximum cumulative oil production is achieved when the production pressure difference is 5 MPa. During the development process of tight oil reservoirs, a larger pressure difference production is beneficial for the production of oil from small pores. Considering that a rapid decrease in formation pressure can lead to severe degassing of crude oil and also cause stress-sensitive effects that compress small throats, affecting oil production, it is recommended to maintain a production pressure difference of 5 MPa for horizontal wells.
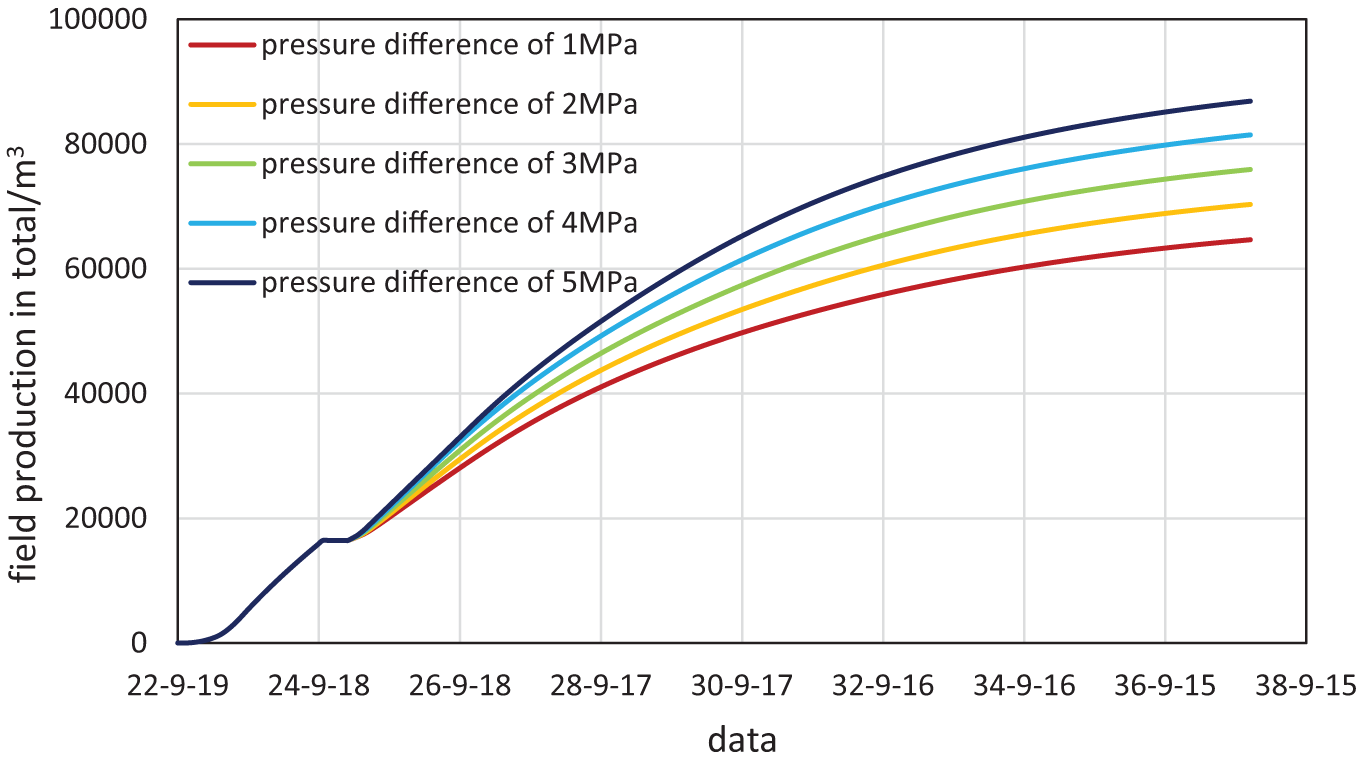
Figure 19: Cumulative oil production at various pressure difference
4.3 Numerical Model Optimization Results
Based on the HY5 horizontal well parameter model, a numerical model of the water injection huff-n-puff mechanism for tight reservoirs with characteristics of high saturation pressure was established, and a fracture network formed after volume fracturing was added. This model was used to optimize the parameters of the water injection and soak process. The optimization results show that: ① The earlier the injection and soak timing, the higher the cumulative oil production; injecting water after one year of depletion production is the optimal timing; ② The larger the injection volume, the higher the cumulative oil production; considering the economic benefits of the development cycle, an optimal cumulative injection volume of 18,000 cubic meters is preferred; ③ Soaking for 10 days is most favorable for crude oil recovery, the reason is that the soaking time is short and the corresponding oil production in total is high, as the green line shown in Fig. 18; ④ The producing pressure difference in horizontal wells should be maintained at 5 MPa. In terms of injection and soak timing, soaking time, and production pressure difference, the numerical simulation optimization results are consistent with the experimental simulation optimization results.
(1) The experiment revealed that the critical point at which the viscosity properties of crude oil in a high saturation pressure tight oil reservoir in the JS oilfield undergo significant changes is 21.2 MPa, which can provide a reference for the selection of water injection timing.
(2) NMR results indicate that after soaking 36 h, the imbibition displacement effect within the core sample is not significant. After soaking 48 h, there is a trend of crude oil gathering from micropores to small pores within the core. After soaking 60 h, the amount of oil in the micropores significantly decreases, while the amount of oil in small and medium pores increases, indicating that the oil-water imbibition displacement is complete and the oil-water distribution has reached a new state of equilibrium.
(3) The results of indoor core experiments and numerical model simulations show a certain degree of similarity. The optimized water injection and soak parameters from the numerical model are: ① Water injection after one year of depletion production is the optimal timing for huff-n-puff; ② Considering economic benefits, an optimal cumulative injection volume of 18,000 cubic meters is preferred; ③ Soaking for 10 days is most favorable for crude oil recovery; ④ The producing pressure difference in horizontal wells should be maintained at 5 MPa.
Acknowledgement: Thanks for the assistance from Cooperative Innovation Center of Unconventional Oil and Gas (Ministry Education & Hubei Province).
Funding Statement: This work was supported by the Innovation Fund of China National Petroleum Corporation (2020D-5007-0209).
Author Contributions: The authors confirm contribution to the paper as follows: study conception and design: Jing Sun, Dehua Liu; data collection: Zhengyang Zhang, Xin Shi; analysis and interpretation of results: Zhengyang Zhang, Jing Sun, Dehua Liu; draft manuscript preparation: Zhengyang Zhang. All authors reviewed the results and approved the final version of the manuscript.
Availability of Data and Materials: The data that support the findings of this study are available on request from the corresponding author, Jing Sun, upon reasonable request.
Ethics Approval: Not applicable.
Conflicts of Interest: The authors declare no conflicts of interest to report regarding the present study.
Nomenclature
| PV | Pore volumes NMR nuclear magnetic resonance |
| Total transverse relaxation time of the fluid | |
| Pore radius | |
| Porosity of the porous medium | |
| The oil phase formation volume factor, the water phase formation volume factor | |
| The oil phase volumetric velocity, the water phase volumetric velocity | |
| The oil production, the water production | |
| Intrinsic permeability tensor of the porous medium | |
| Oil density, water density | |
| Oil recovery enhancement | |
| Cumulative oil production during the depletion production phase |
References
1. Wang Z, Ma M, Sun Y. Effects of oil viscosity and the solution gas-oil ratio on foamy oil flow in solution gas drive. ACS Omega. 2022;7(23):20044–52. doi:10.1021/acsomega.2c01879. [Google Scholar] [PubMed] [CrossRef]
2. Bauget F, Langevin D, Lenormand R. Effects of asphaltenes and resins on foamability of heavy oil. In: SPE Annual Technical Conference and Exhibition; 2001 Sep 30–Oct 03; New Orleans, LA, USA; 2001. doi:10.2118/71504-ms. [Google Scholar] [CrossRef]
3. Liu S. Review of the development status and technology of tight oil: advances and outlook. Ener Fuels. 2023;37(19):14645–65. doi:10.1021/acs.energyfuels.3c02726. [Google Scholar] [CrossRef]
4. Li S, Yang S, Gao X, Wang M, Yu J. Experimental study on liquid production law, oil recovery mechanism, and influencing factors of water huff-n-puff in the tight sedimentary tuff oil reservoir. J Pet Sci Eng. 2022;208(5):109721. doi:10.1016/j.petrol.2021.109721. [Google Scholar] [CrossRef]
5. Harimi B, Masihi M, Mirzaei-Paiaman A, Hamidpour E. Experimental study of dynamic imbibition during water flooding of naturally fractured reservoirs. J Pet Sci Eng. 2018;174(3–4):1–13. doi:10.1016/j.petrol.2018.11.008. [Google Scholar] [CrossRef]
6. Haugen Å, Fernø MA, Mason G, Morrow NR. Capillary pressure and relative permeability estimated from a single spontaneous imbibition test. J Pet Sci Eng. 2014;115(2):66–77. doi:10.1016/j.petrol.2014.02.001. [Google Scholar] [CrossRef]
7. Li Z, Liu J. Research progress and application prospects of water flooding huff and puff technology in tight oil reservoir development. Adv Resour Res. 2024;4(3):318–37. [Google Scholar]
8. Ma X, Wang Y, Zhan J, Wang D, Liu Z. Optimization of water huff-n-puff injection in Chang 8 tight oil reservoir by Taguchi method. Pet Sci Technol. 2024;42(20):2914–31. doi:10.1080/10916466.2023.2179637. [Google Scholar] [CrossRef]
9. Mohamedy T, Yang F, Mbarak SS, Gu J. Investigation on the performance between water alternating gas and water huff n puff techniques in the tight oil reservoir by three dimensional model simulation: a case study of Jilin tight oil field. J King Saud Univ-Eng Sci. 2022;34(7):359–67. doi:10.1016/j.jksues.2022.02.002. [Google Scholar] [CrossRef]
10. Chen T, Yang Z, Ding Y, Luo Y, Qi D, Lin W, et al. Waterflooding Huff-n-puff in tight oil cores using online nuclear magnetic resonance. Energies. 2018;11(6):1524–4. doi:10.3390/en11061524. [Google Scholar] [CrossRef]
11. Li S, Sun J, Gao Y, Liu D, Zhang Z, Ma P. Flow characterization in fractured shale oil matrices using advanced nuclear magnetic resonance techniques. Processes. 2024;12(5):879. doi:10.3390/pr12050879. [Google Scholar] [CrossRef]
12. Janiga D, Czarnota R, Stopa J, Wojnarowski P. Huff and puff process optimization in micro scale by coupling laboratory experiment and numerical simulation. Fuel. 2018;224:289–301. doi:10.1016/j.fuel.2018.03.085. [Google Scholar] [CrossRef]
13. Zhuang X, Wang W, Su Y, Yan B, Li Y, Li L, et al. Multi-objective optimization of reservoir development strategy with hybrid artificial intelligence method. Expert Syst Appl. 2023;241(3):122707. doi:10.1016/j.eswa.2023.122707. [Google Scholar] [CrossRef]
14. Zhang Q. Study on reasonable development strategy of JS extra low permeability and high saturation reservoir [M.S. thesis]. Beijing, China: China University of Petroleum; 2020 (In Chinese). [Google Scholar]
15. Muggeridge A, Cockin A, Webb K, Frampton H, Collins I, Moulds T, et al. Recovery rates, enhanced oil recovery and technological limits. Philos Trans A Math Phys Eng Sci. 2013;372(2006):20120320. doi:10.1098/rsta.2012.0320. [Google Scholar] [PubMed] [CrossRef]
16. Pooladi-Darvish M, Firoozabadi A. Solution-gas drive in heavy oil reservoirs. J Can Pet Technol. 1999;38(4):PETSOC-99-04-06. doi:10.2118/99-04-06. [Google Scholar] [CrossRef]
17. Firoozabadi A. Mechanisms of solution gas drive in heavy oil reservoirs. J Can Pet Technol. 2001;40(3):15–20. doi:10.2118/01-03-DAS. [Google Scholar] [CrossRef]
18. Karimov D, Toktarbay Z. Enhanced oil recovery: techniques, strategies, and advances. ES Mat Manufact. 2023;23:1005. doi:10.30919/esmm1005. [Google Scholar] [CrossRef]
19. Han B, Gao H, Zhai Z, You Y, Zhang N, Wang C, et al. Production characteristics and importance of uncertain parameters of water Huff-n-Puff for volume stimulation horizontal wells in tight oil reservoirs. J Energy Eng. 2024;150(3):103. doi:10.1061/JLEED9.EYENG-5202. [Google Scholar] [CrossRef]
20. Dunn KJ, Bergman DJ, Latorraca GA. Nuclear magnetic resonance petrophysical and logging applications. In: Handbook of geophysical exploration: seismic exploration. Amsterdam: Elsevier; 2002. Vol. 32, p. 1–293. [Google Scholar]
21. Liu T. Multi-field coupling mechanism and engineering response in gas extraction process of deep fissure coal body [Ph.D. thesis]. Xuzhou, China: China University of Mining and Technology; 2019 (In Chinese). [Google Scholar]
22. Lee SH, Wolfsteiner C, Tchelepi HA. Multiscale finite-volume formulation for multiphase flow in porous media: black oil formulation of compressible, three-phase flow with gravity. Comput Geosci. 2008;12(3):351–66. doi:10.1007/s10596-007-9069-3. [Google Scholar] [CrossRef]
Cite This Article
 Copyright © 2025 The Author(s). Published by Tech Science Press.
This work is licensed under a Creative Commons Attribution 4.0 International License , which permits unrestricted use, distribution, and reproduction in any medium, provided the original work is properly cited.
 Downloads
 Citation Tools