
 Submit a Paper
 Propose a Special lssue
 Open Access
ARTICLE

Characterization of Pore Structure and Simulation of Pore-Scale Flow in Tight Sandstone Reservoirs
Petroleum Exploration and Production Research Institute, PetroChina Changqing Oilfield Company, Xi’an, 710016, China
* Corresponding Author: Min Feng. Email:
Fluid Dynamics & Materials Processing 2025, 21(3), 573-587. https://doi.org/10.32604/fdmp.2024.056421
Received 22 July 2024; Accepted 07 November 2024; Issue published 01 April 2025
 View Full Text
 Download PDF
Abstract
This study sheds light on how pore structure characteristics and varying dynamic pressure conditions influence the permeability of tight sandstone reservoirs, with a particular focus on the Paleozoic reservoirs in the Qingshimao Gas Field. Using CT scans of natural core samples, a three-dimensional digital core was constructed. The maximum ball method was applied to extract a related pore network model, and the pore structure characteristics of the core samples, such as pore radius, throat radius, pore volume, and coordination number, were quantitatively evaluated. The analysis revealed a normally distributed pore radius, suggesting a high degree of reservoir homogeneity and favorable conditions for a connected pore system. However, it was found that the majority of throat radii measured less than 1 μm, which severely restricted fluid flow and diminished permeability. Over 50% of the pores measured under 100 μm3, further constraining fluid movement. Additionally, 30%–50% of the pore network was composed of isolated and blind-end pores, which significantly impaired formation connectivity and reduced permeability. Based on this, the lattice Boltzmann method (LBM) was used for pore-scale flow simulation to investigate the influence mechanism of pore structure characteristics and dynamic-static parameters such as displacement pressure difference on the permeability performance of the considered tight sandstone reservoirs for various pressure gradients (0.1, 1, and 10 MPa). The simulations revealed a strong relationship between pressure differential and both the number of streamlines and flow path tortuosity. When the pressure differential increased to 1 MPa, 30 streamlines were observed, with a tortuosity factor of 1.5, indicating the opening of additional seepage channels and the creation of increasingly winding flow paths.Keywords
Nomenclature
| Absorption Information | The energy data of X-rays attenuated by a material as they traverse through it. |
| Projected Data | The two-dimensional projection image data generated on the detector following the passage of X-rays through the object during a CT scan. |
| Reconstruction Algorithm | A computational method that transforms two-dimensional projection data into three-dimensional images, utilizing techniques such as filtered back projection and iterative reconstruction algorithms. |
| Filter Back Projection Algorithm | A widely adopted CT image reconstruction technique that generates a three-dimensional representation of an object by filtering and back-projecting the acquired projection data. |
| Iterative Reconstruction Algorithm | A CT image reconstruction technique that progressively refines the image through iterative optimization processes, aiming to closely approximate the actual scanned object. |
| Pixel Noise | Random interference in an image, unrelated to the actual signal, which diminishes image quality and clarity. |
| Image Edge Discontinuity | The abrupt or indistinct boundaries of objects within a digital image. |
| Gaussian Filter | An image denoising algorithm that employs a Gaussian function to smooth the image and mitigate noise. |
| Gaussian Kernel Function | The mathematical function employed in the Gaussian filter algorithm to regulate the spatial extent and intensity of the filtering process. |
| Incised Sphere | A sphere entirely enclosed within a geometric shape. |
| Throat | A constricted passageway linking adjacent pores. |
| Pore Network Model | A computational representation that simulates the porous structure of rocks using interconnected spheres and rods to analyze fluid flow dynamics within the pore spaces. |
| Coordination Number | The quantity of pores directly connected to a specific pore, indicating the extent of interconnectivity within the porous network. |
| Pore Sorting | The extent of homogeneity in pore size distribution within a rock. A well-sorted rock exhibits predominantly uniform pore dimensions. |
| Homogeneity | The extent to which rock properties exhibit uniformity across spatial dimensions. A homogeneous rock demonstrates consistent characteristics irrespective of directional orientation. |
| Isolated Pore | A pore that is not connected to any other pore within the rock structure. |
| Blind Pore | A pore that is connected to only one other pore within the rock structure. |
In recent years, unconventional oil and gas resources, such as tight oil, shale oil and shale gas, have garnered significant attention from researchers due to their substantial recoverable reserves [1–3]. The Qingshimao Gas Field, situated in the northern region of the Tianhuan Depression and thrust belt on the western margin of the Ordos Basin, is characterized as a deep-buried, ultra-low permeability tight sandstone gas field with distinct geological features and reservoir properties. Consequently, when investigating this field, particular emphasis should be placed on its pore structure and permeability, as studies in these areas for such gas fields are relatively limited. Tight sandstone reservoirs pose considerable challenges for pore structure characterization due to their micro- and nano-sized pore throats and highly heterogeneous nature [4]. The micropore structure of reservoir rocks is intricately linked to the differential distribution of reservoir productivity and is a critical factor influencing the macro-reservoir quality and fluid flow dynamics. Therefore, quantitative evaluation and characterization of the reservoir micropore structure are crucial for maintaining and enhancing oil recovery, as well as for better understanding and assessing the seepage capacity and hydrocarbon utilization potential of the reservoir [5]. To comprehensively and intuitively reveal the complex microstructure of sandstone reservoirs, researchers have conducted extensive studies. The experimental methods primarily include high pressure mercury intrusion method (HPMI) [6], constant velocity mercury intrusion method (CRMI) [7], gas adsorption method [8], nuclear magnetic resonance method (NMR) [9], small Angle neutron scattering method (SANS) and ultra-small Angle neutron scattering method (USANS) [10]. However, conventional techniques often encounter difficulties in accurately characterizing the smallest pore sizes typical of tight sandstone reservoirs, underscoring the necessity for continued methodological advancements in this field.
Numerous studies have utilized high-resolution scanning equipment to collect core profile images and obtain pore morphology characteristics for qualitative analysis of rock mineral morphology, pore throat size distribution, and connectivity. This approach provides intuitive, convenient, and rapid results. Common methods include scanning electron microscopy (SEM) [11], computed tomography (CT) [12], Fourier infrared spectroscopy (FTIR) [13], and X-ray diffraction (XRD) [14]. Among these, the high-pressure mercury method (MIP) offers advantages in sensitivity, reliability, and speed for characterizing porosity and pore size distribution. However, it is limited to nanometer-to-micron pores. Low pressure gas adsorption methods (CO2 adsorption, N2 adsorption) are significant techniques for characterizing rock reservoir pore structures. CT scanning has emerged as a particularly beneficial technique for characterizing tight sandstone pore structures. Unlike methods restricted to surface analysis or requiring assumptions about pore geometry, CT scanning generates high-resolution 3D images of the entire core sample. This enables direct visualization and quantification of pore morphology, connectivity, and spatial distribution across multiple length scales, including the critical micro- and nano-pore sizes often inadequately characterized by other techniques [15]. This non-destructive approach preserves the natural pore structure and provides essential data for understanding pore-scale fluid flow behavior, ultimately leading to more accurate assessments of reservoir quality and the development of more effective strategies for hydrocarbon extraction.
Following the establishment of the 3D digital core model, further analysis of the core’s pore structure characteristics and stratigraphic properties is essential to obtain crucial geological information for oil and gas development. This necessitates the creation of a pore network model to accurately and comprehensively characterize the core’s pore structure. The pore network model, extracted or reconstructed from the digital core model, effectively reflects the actual core pore space [16]. Methods for establishing pore network models include multi-direction scanning, center axis method, and maximum sphere algorithm [17]. The multi-direction scanning method constructs the core pore network model by assessing pores and throats by scanning the core sample in all directions. The center axis method establishes a realistic pore network model by identifying the central axis of the pore space in the digital core model, where the axis represents the throat and the intersection of two or more axes represents the pores. The maximum ball algorithm constructs pore networks by identifying the largest sphere that can fit within the pore space at each voxel. These maximum inscribed spheres represent pores, while the smaller spheres connecting them model the throats [18]. This approach effectively captures the complex geometry of pore spaces, enabling accurate analysis.
This study aims to provide a comprehensive understanding of the relationship between pore structure and permeability in the Upper Paleozoic natural core of the Qingshimao Gas Field, ultimately contributing to optimized formation development and enhanced gas recovery. Through an integrated approach combining micro-CT scanning, digital core technology, pore network modeling, and lattice Boltzmann method flow simulations, this research quantifies the 3D micro-pore network, establishes quantitative links between pore characteristics and permeability, and analyzes the impact of pressure differentials on flow behavior. This multifaceted analysis offers valuable insights for optimizing well placement, hydraulic fracturing, and production strategies, facilitating efficient and sustainable gas extraction in the Qingshimao Gas Field and similar tight gas reservoirs.
2 Digital Core Model Construction and Pore Characterization Analysis
To enhance comprehension of the intricate pore structures within the Upper Paleozoic natural cores from the Qingshimao Gas Field, the development of a digital core model is essential. Analysis of this digital core model enables a thorough investigation of pore geometry, connectivity, and spatial distribution, thus facilitating the examination of how microscopic pore characteristics affect permeability and other fluid flow properties.
CT scanning leverages the differential attenuation of X-rays passing through a sample to reconstruct its three-dimensional structure. The process involves irradiating the sample from multiple angles and measuring the transmitted X-ray intensity, resulting in a series of two-dimensional projections. These projections encode the spatial distribution of X-ray attenuation coefficients within the sample. Advanced tomographic reconstruction algorithms, typically utilizing filtered back-projection or iterative methods, are then applied to mathematically reconstruct a volumetric representation of the sample from the acquired projection data. The resulting reconstructed volume maps the spatially varying linear attenuation coefficient, offering a detailed visualization of the sample’s internal structure.
Initially, authentic core samples from Wells Li 15, Li 23, Li 24, Li 85, and Li 93 were extracted and positioned in a CT scanner holder. By rotating the sample and the X-ray source, the sample is exposed to radiation at various angles, generating a series of projected images. These projected images are then transformed into a 3D core model using a reconstruction algorithm [19]. The reconstruction process can employ different algorithms, such as the filter back projection algorithm [20] and the iterative reconstruction algorithm [21]. However, during the conversion from 2D image to 3D analog image, pixel noise and image edge discontinuity may arise due to internal and external factors. Consequently, it is essential to preprocess the scanned image, including denoising, enhancing, and filtering, to obtain three-dimensional volume data of the pore structure that meets the analysis requirements. The Gaussian filter substitutes the value of the current pixel by calculating the weighted average value of the surrounding neighborhood. The formula is as follows:
where
Fig. 1 depicts the three-dimensional digital core image of the natural core from Section 8 of the Li 57 well box, showcasing both the original and processed images following enhancement and filtering procedures.
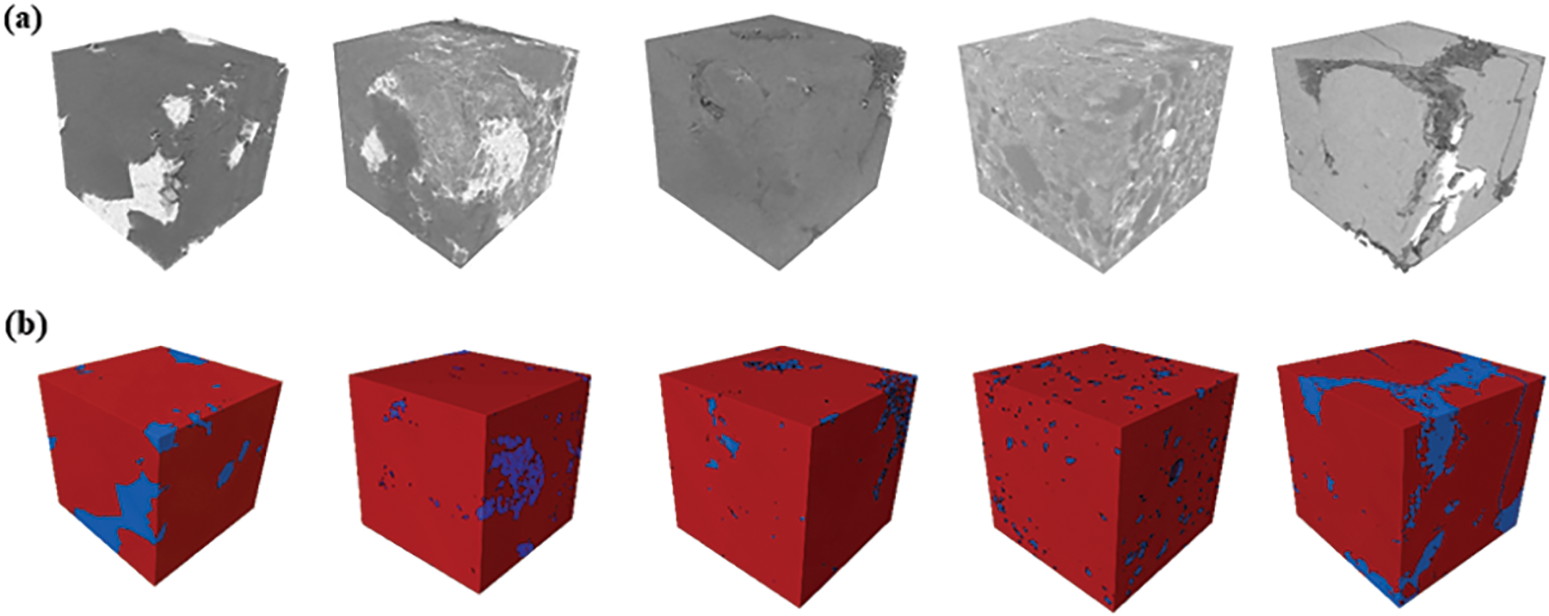
Figure 1: 3D Digital core images of the ‘He 8’ section of the Li 57 well. (a) Original image; (b) Processed image
Accurate differentiation between rock matrix and pore space is crucial for the fidelity of digital rock models derived from CT scans. This segmentation process directly influences the accuracy of subsequent pore network extraction and petrophysical property predictions. This study examines the effectiveness of two distinct methods for pore network extraction from 3D digital cores: the watershed algorithm and the maximum sphere method. The watershed algorithm, a widely utilized image segmentation technique, divides the image into distinct regions based on grayscale gradients, simulating the topographic flow of water. By treating pixel intensity as analogous to elevation, the algorithm identifies catchment basins that delineate pore spaces. Pixels with high gray values are considered high areas, while pixels with low gray values are regarded as low areas. Consequently, a series of basins form at the junction of elevated and low-lying areas. The calculation formula of the gradient image
where
The segmentation boundaries are subsequently constructed by filling these basins during the flow simulation process. Ultimately, each low-lying area in the image represents a distinct region or object. The image segmentation results are achieved by assigning adjacent pixels to the same low-lying area, as illustrated in Fig. 2.
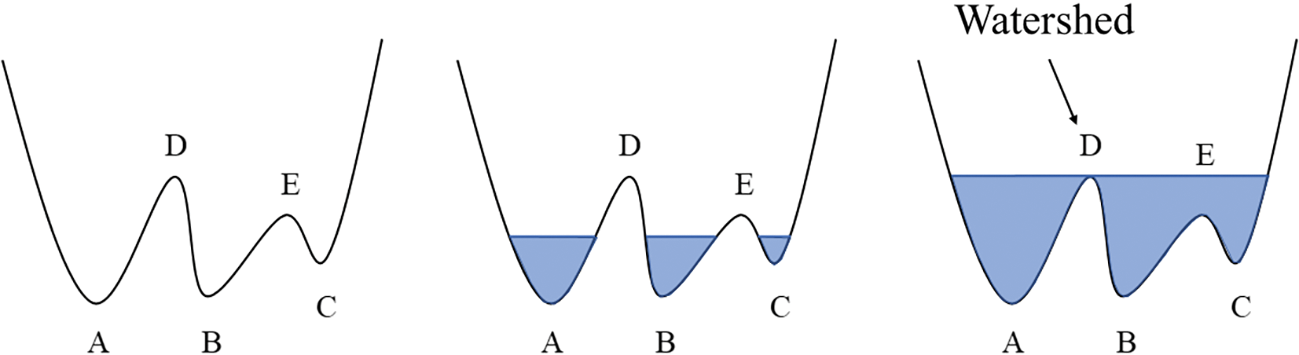
Figure 2: Schematic diagram of image segmentation principle of watershed method
The segmentation boundaries are constructed by filling these basins during the flow simulation. Ultimately, each low-lying area in the image represents a distinct region or object. Image segmentation results are achieved by assigning adjacent pixels to the same low-lying area, as illustrated in Fig. 2. Subsequently, the pore network model is extracted using the maximum sphere method. This method characterizes the size and location of pores by identifying the largest inscribed sphere, based on the geometry and distribution of the pores. The process involves scanning each pixel in three-dimensional space and calculating the spherical space around it to determine the maximum inscribed sphere for each pixel. The radius of this sphere represents the pore size at the pixel point, while its position indicates the pore location. The maximum sphere method distinguishes between the rock skeleton and the pore to separate the pore from the solid phase. For each pixel in the pore phase, the radius and position of its maximum inscribed sphere are calculated and incorporated into the pore network model. In this model, spheres represent pores, and rods represent throats, as depicted in Fig. 3.
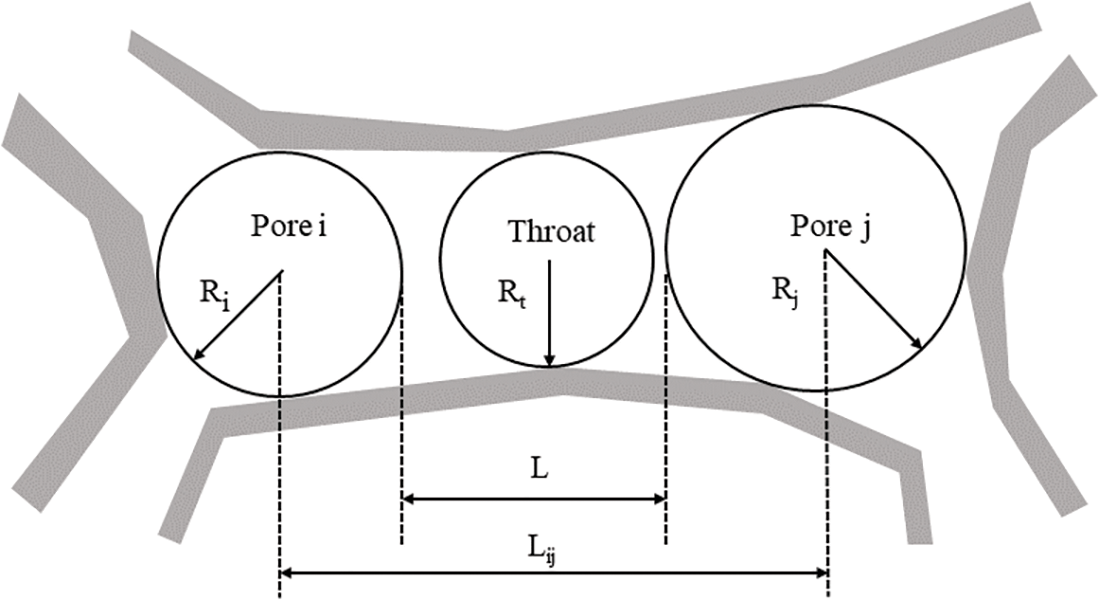
Figure 3: Schematic diagram of pore network model extracted by maximum sphere method
In the pore network model extracted in this study (Fig. 4), the dimensions of the spherical elements range from approximately 1.5 to 2 × 10⁻⁴ m, while the cylindrical components measure between 2.6 and 5 × 10⁻⁵ m.
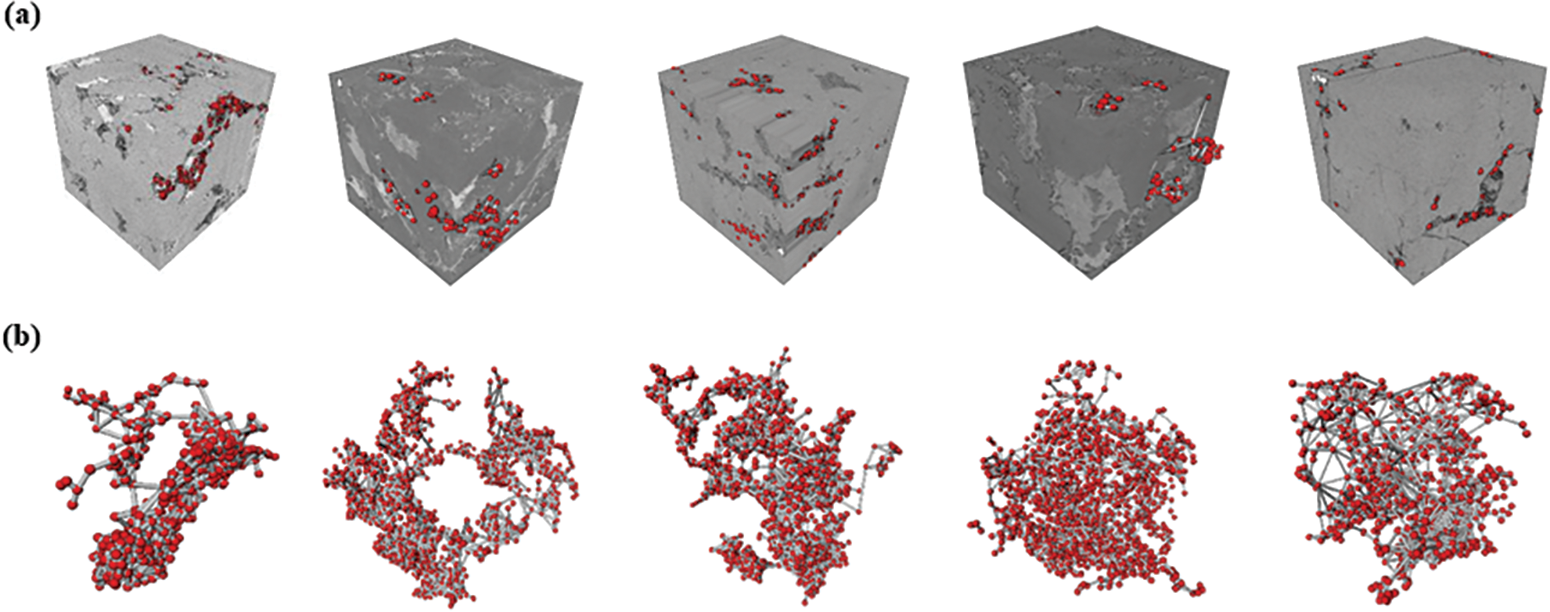
Figure 4: Schematic diagram of pore network models of Li 57 well. (a) Digital cores and pore network models combined. (b) Pore network models
2.3 Pore Structure Characteristic Analysis
The analysis of pore structure characteristics significantly influences our understanding of a reservoir’s capacity to store and transmit fluids. By examining key parameters such as pore-throat radii, pore volume, and coordination number, we can gain deeper insights into the factors that control permeability and fluid flow within the formation. Through detailed analysis of pore characteristics of core samples, a series of experimental results on pore radius, throat radius, pore volume, and pore coordination number were obtained, and their effects on formation permeability were evaluated, as illustrated in Fig. 5. The pores of the core sample are predominantly small, with their radius distribution ranging from 0.05 to 0.15 μm. This indicates that the formation’s pore structure exhibits a certain degree of fineness, with good pore sorting. A fine-grained pore structure enhances reservoir performance as small pores better retain fluids and increase the formation’s effective pore volume. The pore radius of the core sample follows a normal distribution, suggesting good homogeneity in the reservoir segment. This homogeneity significantly influences formation permeability, as formations with good homogeneity are more likely to form connected pore systems, thereby increasing permeability. However, the throat radius distribution is wide and generally small (<1 μm), resulting in lower formation permeability. The throat, being the passage between connecting pores, restricts fluid flow when smaller, thereby reducing permeability. This demonstrates that the size and distribution of throats significantly affect formation permeability, with larger throats generally corresponding to higher permeability. Additionally, the pore volume of core samples is generally small, with pores less than 100 μm3 accounting for more than 50%. This also impacts formation permeability, as smaller pore volumes restrict fluid flow, thus reducing permeability. However, due to the wide distribution of pore volume, a certain proportion of large pores remain, which provides the formation with some connectivity, thus ensuring a degree of permeability. As a crucial parameter of pore structure, pore coordination number has a significant effect on formation permeability. It is observed that isolated pores and blind pores are primary factors affecting formation connectivity, accounting for approximately 30%–50%. Isolated pores are those unconnected to other pores, while blind end pores are connected to only one pore. The presence of these pores reduces formation permeability as they do not provide efficient channels for fluid conduction.
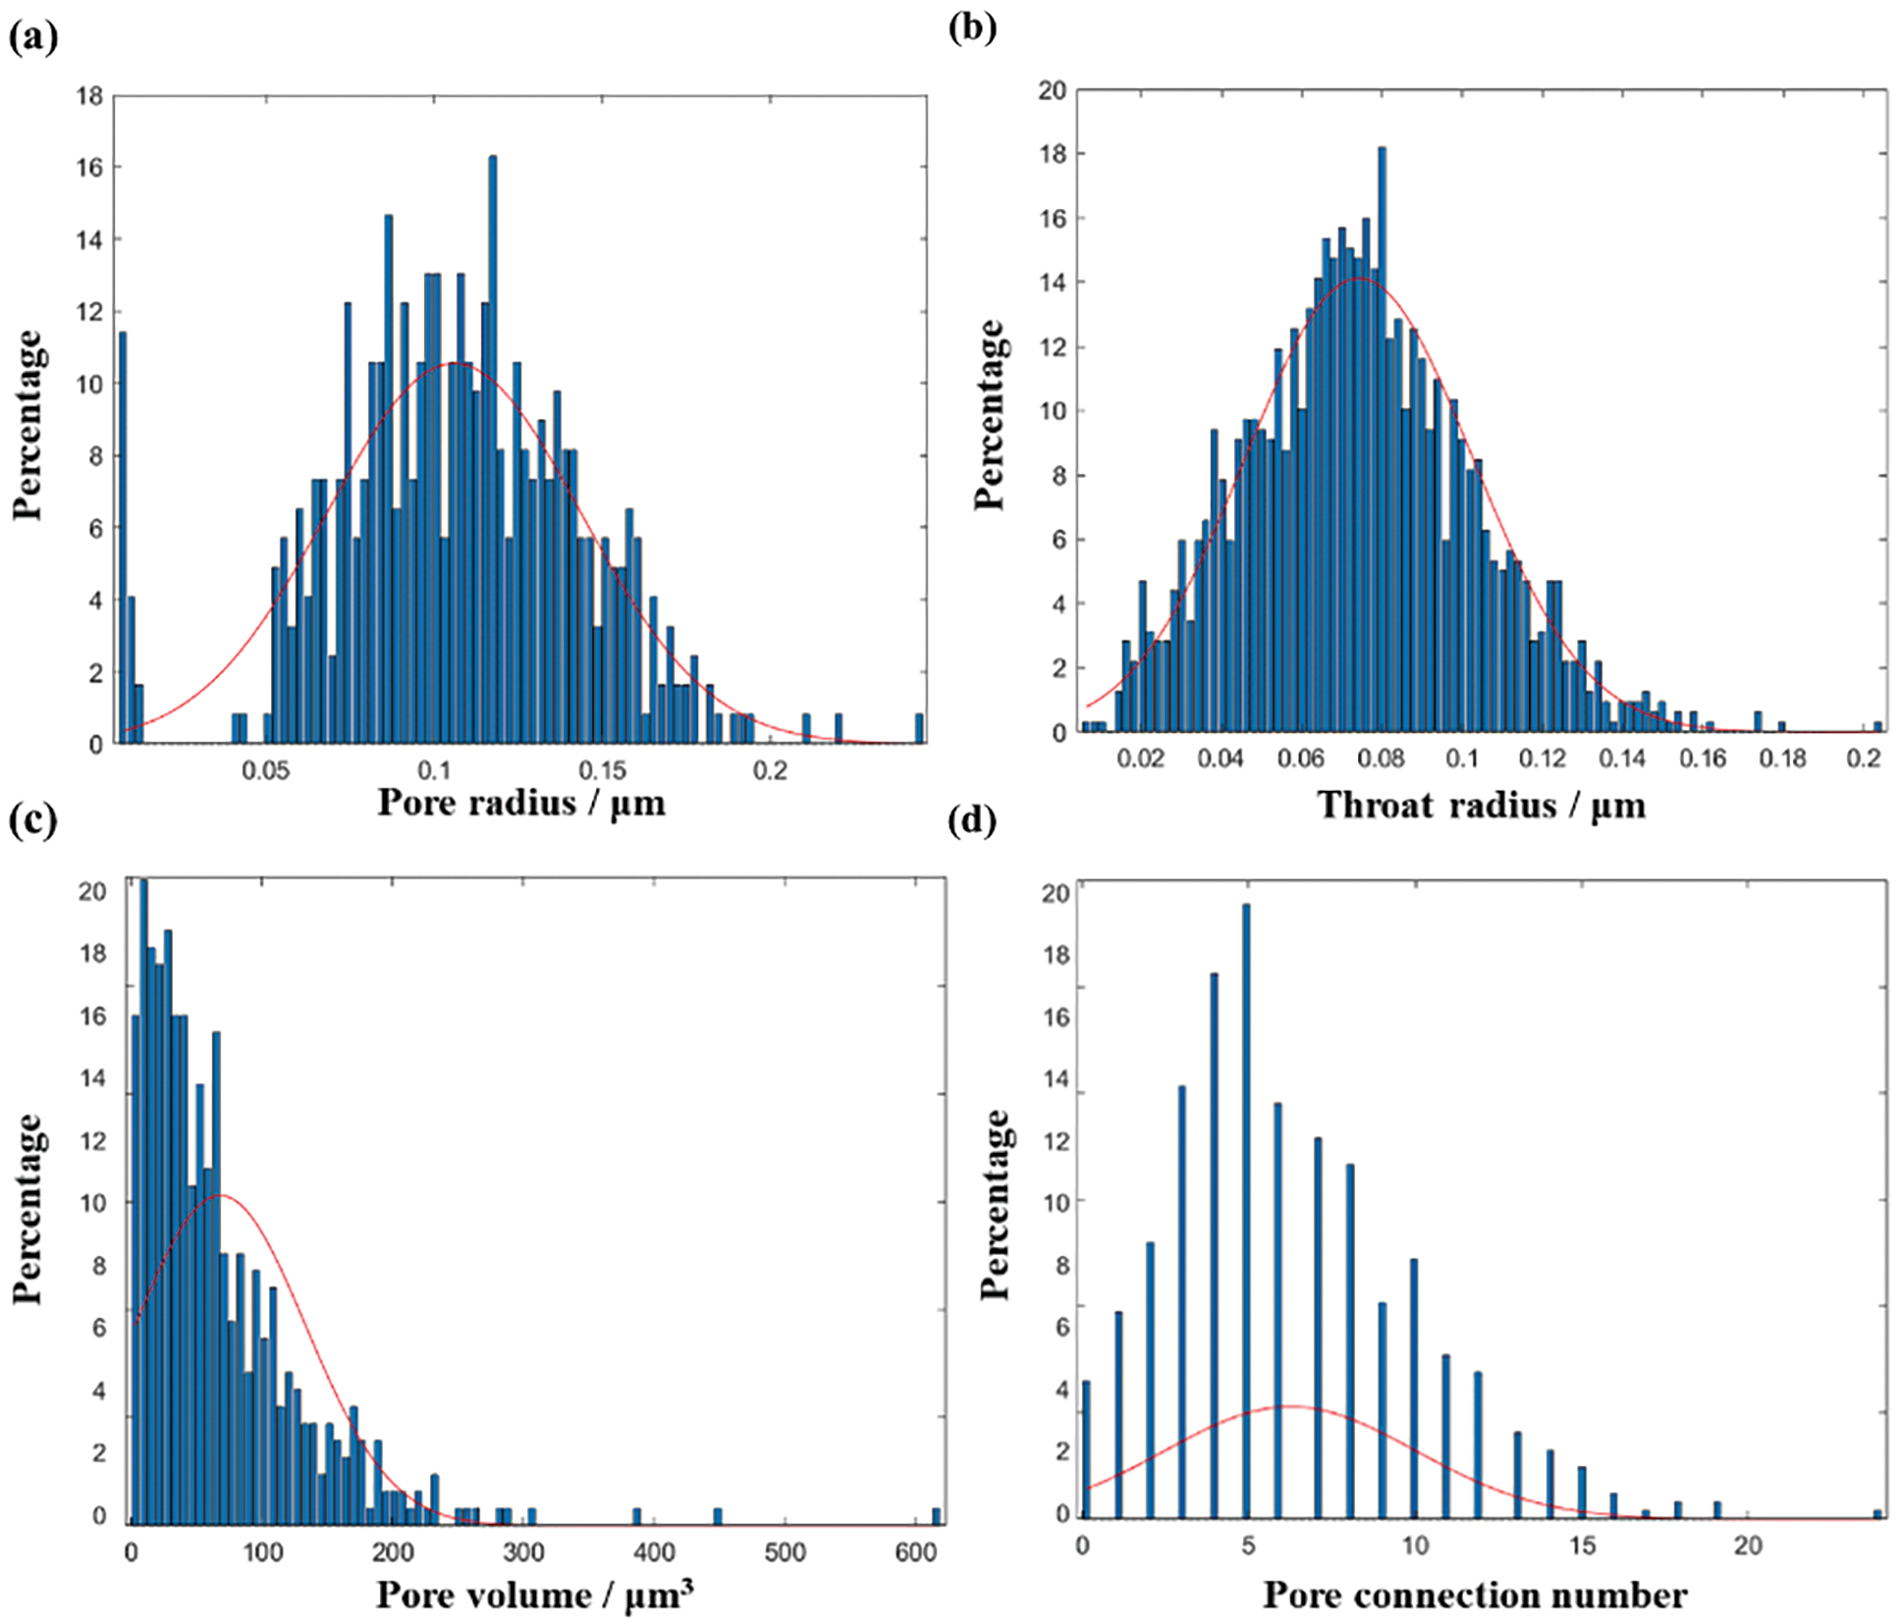
Figure 5: Pore and throat geometric parameters analysis results. (a) Pore radius; (b) Throat radius; (c) Pore volume; (d) Pore connection number
3 Pore Structure Characteristic Analysis
This section utilizes the LBM for pore-scale flow simulation. This technique effectively manages complex boundary conditions and heterogeneous pore structures with enhanced accuracy. The findings derived from this approach augment our comprehension of fluid dynamics in porous media, ultimately contributing to improved recovery efficiency.
3.1 Model Construction and Simulation Parameter Settings
In this study, the volume-LBM based on a 3D digital core model was employed for simulation [22]. For this single-phase flow simulation, the solid matrix was considered an impermeable, stationary phase. A constant pressure gradient, applied across the inlet and outlet boundaries, acted as the primary driving force for fluid flow. Utilizing GPU parallel computation, the simulation implemented a streamlined data structure that solely stored information related to the simulation domain and its immediate boundary conditions. This optimization approach minimized memory requirements and improved computational efficiency.
This study employs the D3Q19 discrete velocity model [16] to simulate the permeability of 3D digital rocks, as Fig. 6 shows. The Lattice Bhatnagar-Gros-Krook (LBGK) collision approximation [17], widely adopted due to its simplicity, is utilized. The fundamental evolution equation [18] can be expressed as:
where
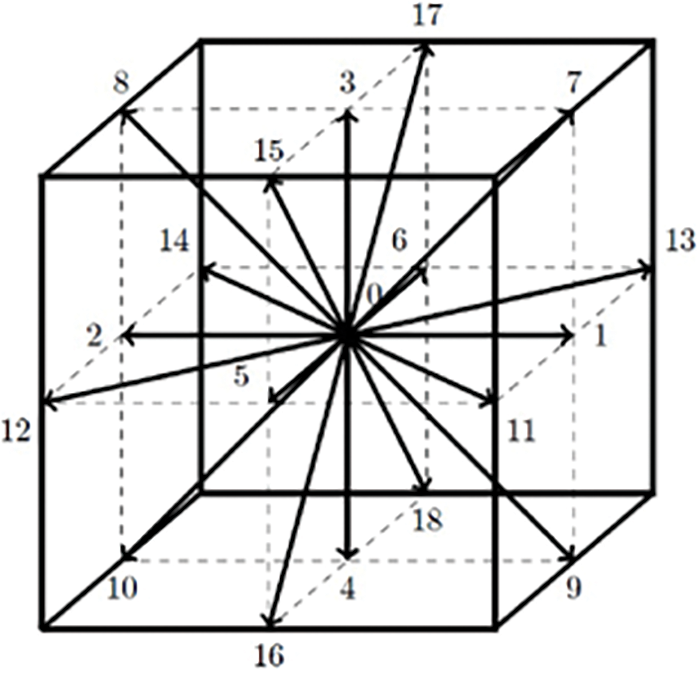
Figure 6: D3Q19 discrete velocity model diagram
The equilibrium distribution function represents the distribution of fluid particles when the system attains equilibrium. For the D3Q19 model, this equilibrium distribution function can be expressed as:
where ρ represents the macroscopic fluid density, u denotes the macroscopic velocity,
In LBM simulations of fluid dynamics, the iteration process concludes when either the number of iterations surpasses 10,000 or the relative difference in average velocity between consecutive iterations falls below 10–10 m/s. This criterion ensures the simulation’s finite execution and terminates the computation upon reaching a steady-state flow condition.
Subsequently, we extend the single-phase LBM, as outlined earlier, to model two-phase flow in porous media. Two-phase flow simulations using LBM necessitate the integration of interface tracking and inter-phase interactions, which are crucial for accurately representing the dynamics between gas and water phases within the porous structure. To simulate gas-water flow, we employ the Shan-Chen model, which was selected for its ability to simulate phase separation using a pseudopotential-based approach. This model introduces a short-range interaction potential between fluid particles, facilitating the simulation of distinct gas and water phases and the interface between them.
This model posits a non-local interaction between distinct fluid particles, characterized by a potential function expressed as:
where
Based on the interaction potential, the formula for calculating the interaction force between class
At the fluid-solid interface, taking into account the wettability of the wall surface, the interaction force between the fluid and the solid wall can be calculated using the following formula:
Among these parameters,
In the analysis of fluid flow through porous media, two critical parameters are employed to characterize permeability and flow behavior: the number of streamlines and tortuosity. The number of streamlines quantifies the average density of flow paths within a unit area, reflecting the connectivity and permeability of the pore structure. A higher number of streamlines typically indicates a more interconnected and permeable medium. To determine this parameter, a set of starting points is selected on the fluid inlet boundary. Numerical integration is then utilized to trace the flow lines in the direction of the fluid, with the flow rate being updated at each step.
Tortuosity, in contrast, evaluates the extent of meandering or elongation of flow paths in comparison to a direct trajectory. It quantifies the additional distance fluid particles must traverse due to the intricate and convoluted structure of the pores. Tortuosity can be numerically expressed as the ratio of the actual path length of the fluid through the porous medium to the straight-line distance between the entry and exit points of the flow. Mathematically, tortuosity (τ) is defined as:
In the equation, L represents the length of the actual flow path traversed by the fluid between two points, while D denotes the straight-line distance between these points.
Utilizing the LBM, this study quantifies the number of streamlines and tortuosity under various pressure differentials, with the results presented in Fig. 7. The findings demonstrate a progressive increase in flow line quantity as the pressure difference between the inlet and outlet rises. A greater pressure differential activates more seepage channels, consequently elevating the number of flow lines. This observation suggests that an increased pressure difference enhances the fluid’s propulsion through the porous medium, facilitating the formation of additional flow pathways.
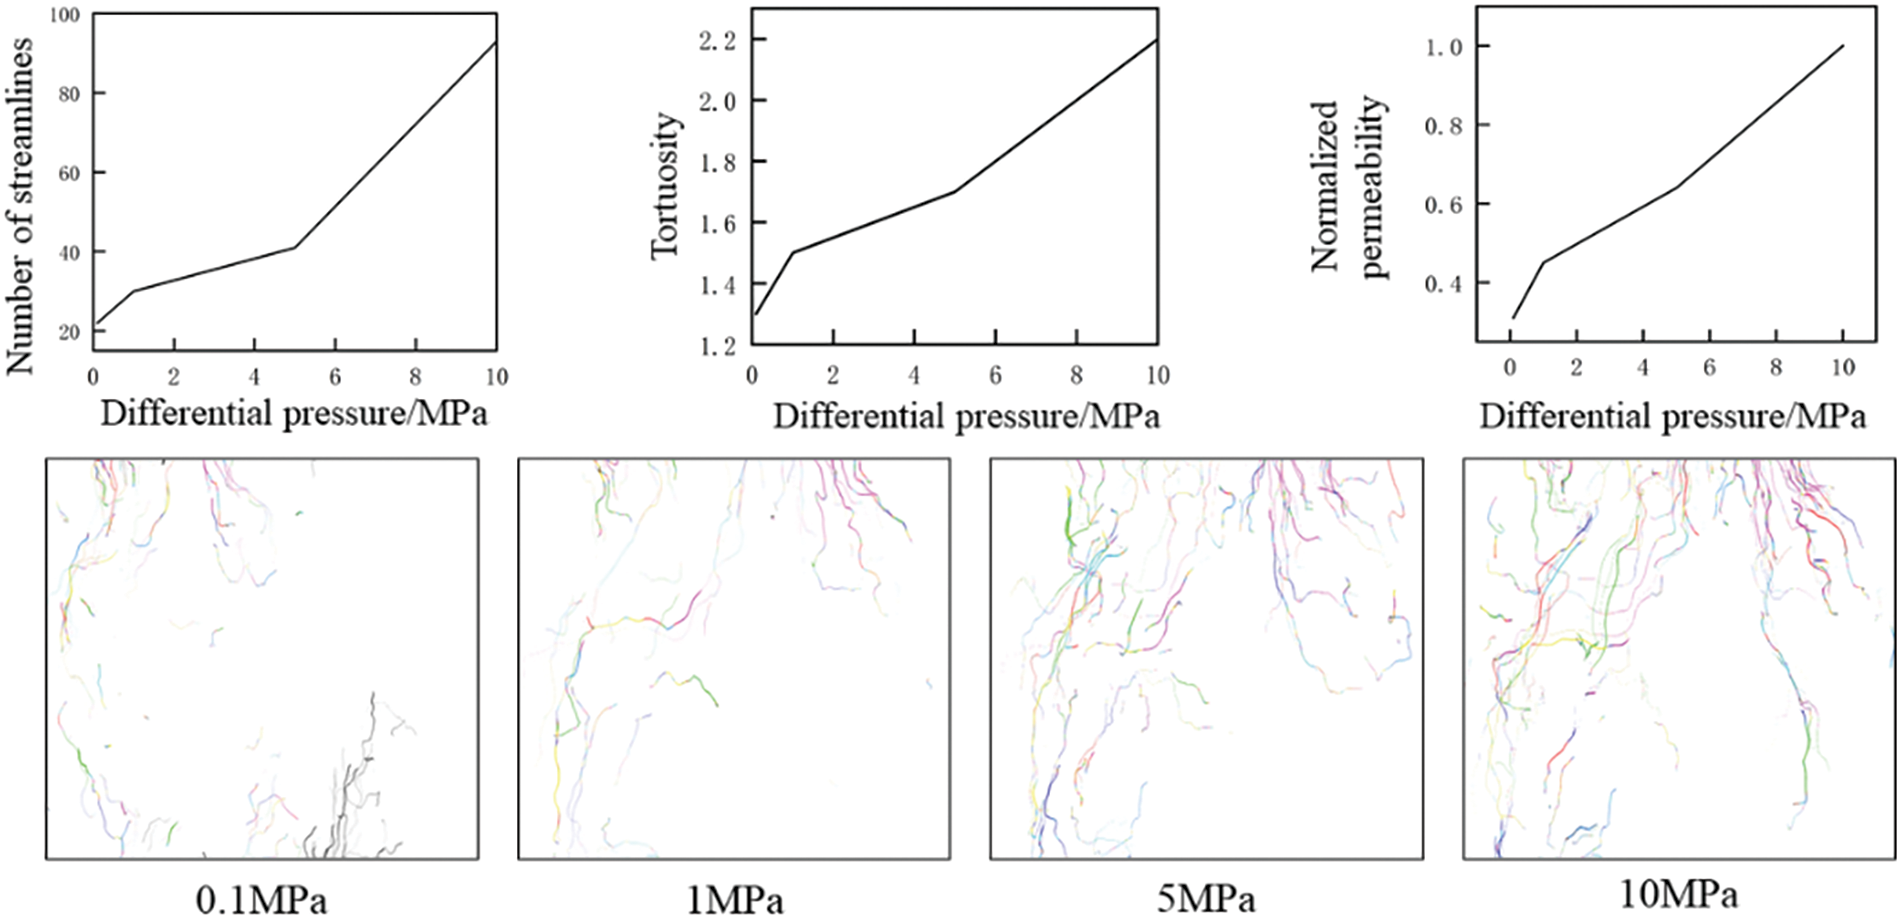
Figure 7: Flow simulation results under different pressure differences
The increase in pressure difference corresponds to an elevation in tortuosity, a measure quantifying the curvature of the fluid’s flow path within the core. At lower pressure differentials, the flow path remains relatively linear, resulting in reduced tortuosity. As the pressure difference escalates, the flow path becomes increasingly convoluted, manifesting in higher tortuosity values. For example, at a pressure difference of 0.1 MPa, the number of streamlines is 22 and the tortuosity is 1.3, indicating a relatively straightforward fluid flow. When the pressure difference rises to 1 MPa, the number of streamlines increases to 30 and tortuosity to 1.5, suggesting the activation of additional seepage channels and a more tortuous flow path.
Moreover, the normalized permeability exhibits an upward trend with increasing pressure difference. At 0.1 MPa, the normalized permeability is 0.31, rising to 0.45 at 1 MPa, and reaching 1.0 at 10 MPa. This pattern indicates that as the pressure difference escalates, there is not only an increase in the number of flow lines and tortuosity but also an enhancement in the medium’s permeability. The normalized permeability values suggest that at higher pressure differences, the medium becomes more permeable, facilitating easier fluid passage despite the increased complexity of flow paths. This increase in normalized permeability highlights the improved fluid transport efficiency as pressure differences become more pronounced.
Utilizing the pore-scale gas-water two-phase microsimulation method, this study quantitatively investigated the micro-gas-water occurrence state and its influence mechanism, with the results presented in Fig. 8. During natural gas charging, gas initially enters larger pores due to their higher permeability compared to smaller pores. However, at positions where the throat radius decreases, gas forms a flow around the throat, unable to penetrate smaller pores and displace the primary water. This process results in the formation of capillary water, a phenomenon where gas and water coexist within pores. At the macroscopic level, this manifests as the presence of gas and water within the same layer.
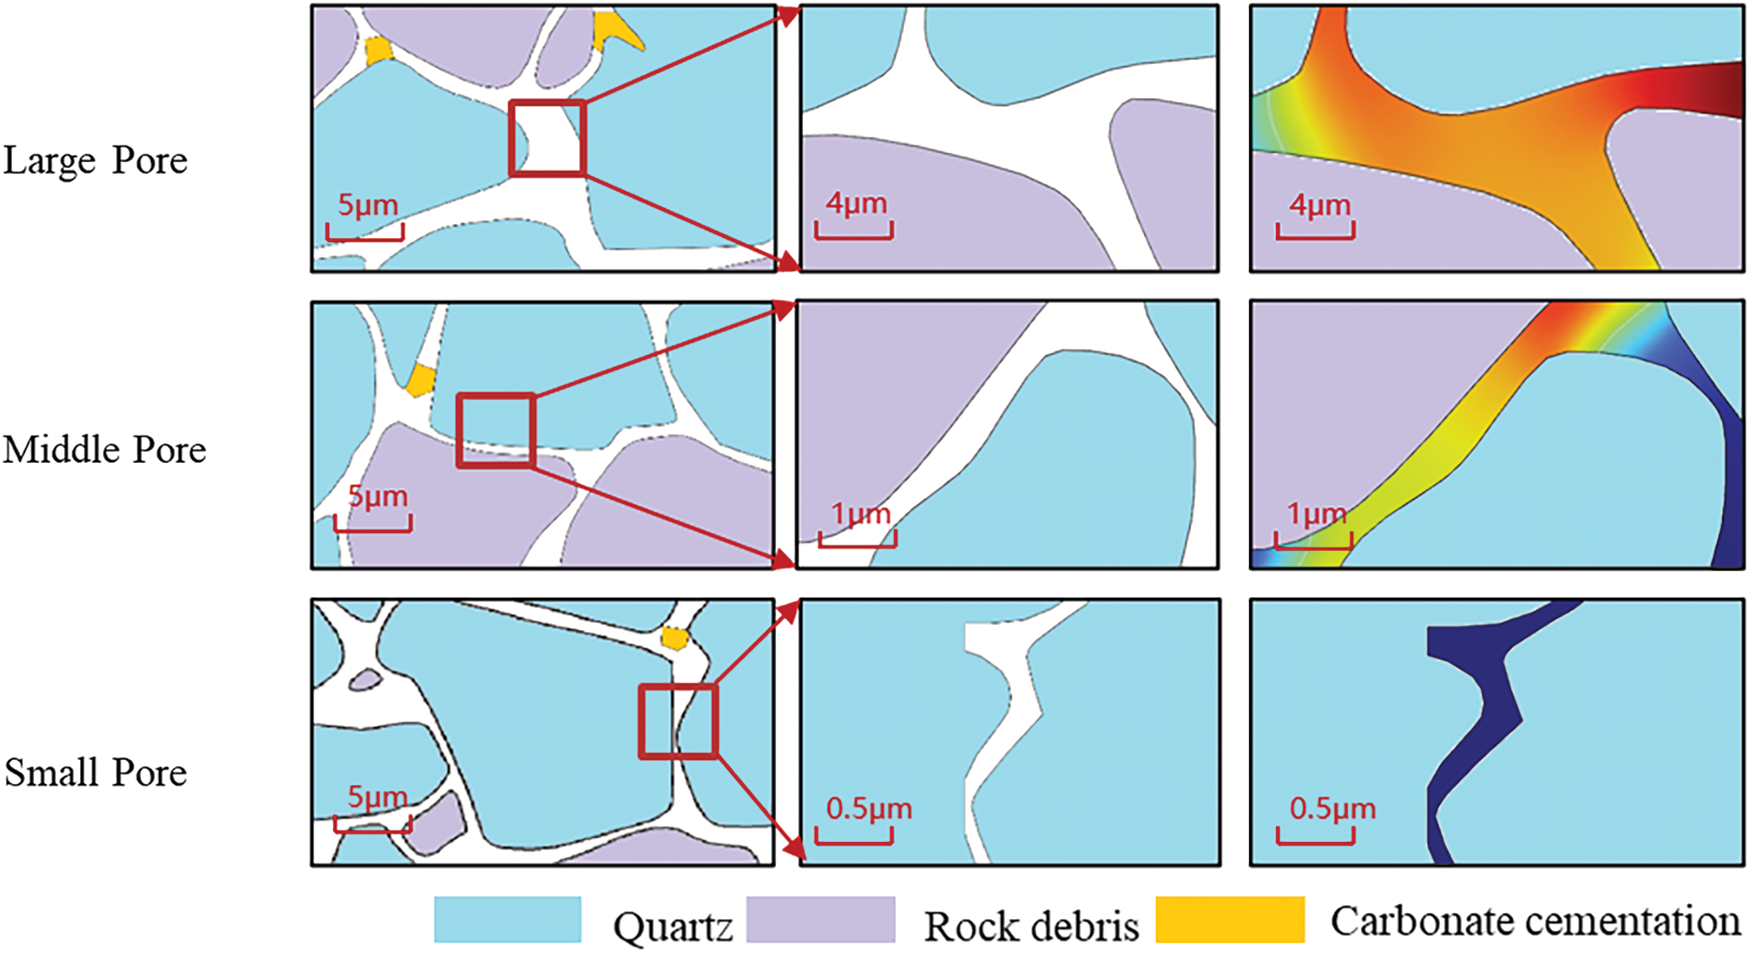
Figure 8: Evolution of gas-water microscopic distribution during the transition from water saturation to gas-driven displacement
Furthermore, the intensity of hydrocarbon generation significantly influences the microscopic distribution of gas and water in the test production area. The hydrocarbon generation process produces substantial quantities of natural gas, which subsequently enters the pore system. Typically, these hydrocarbon generation reactions occur in or around mineral particles between rock pores, with larger pores often situated in the central part of the rock’s pore network. Consequently, an increase in hydrocarbon generation intensity results in a greater influx of gas into the macropores, thereby altering the microscopic distribution of gas and water.
Increased charging pressure may enhance the permeability and diffusion rate of the fluid. When gas is injected into the rock at elevated pressures, its fluidity and penetrative capacity are augmented, facilitating its entry into small pores and cemented regions, as Fig. 9 shows. This process results in greater water displacement by gas, consequently increasing gas saturation. Higher pressure enables more profound contact between gas and water, intensifying the gas’s displacement effect on water, thereby further enhancing gas saturation.
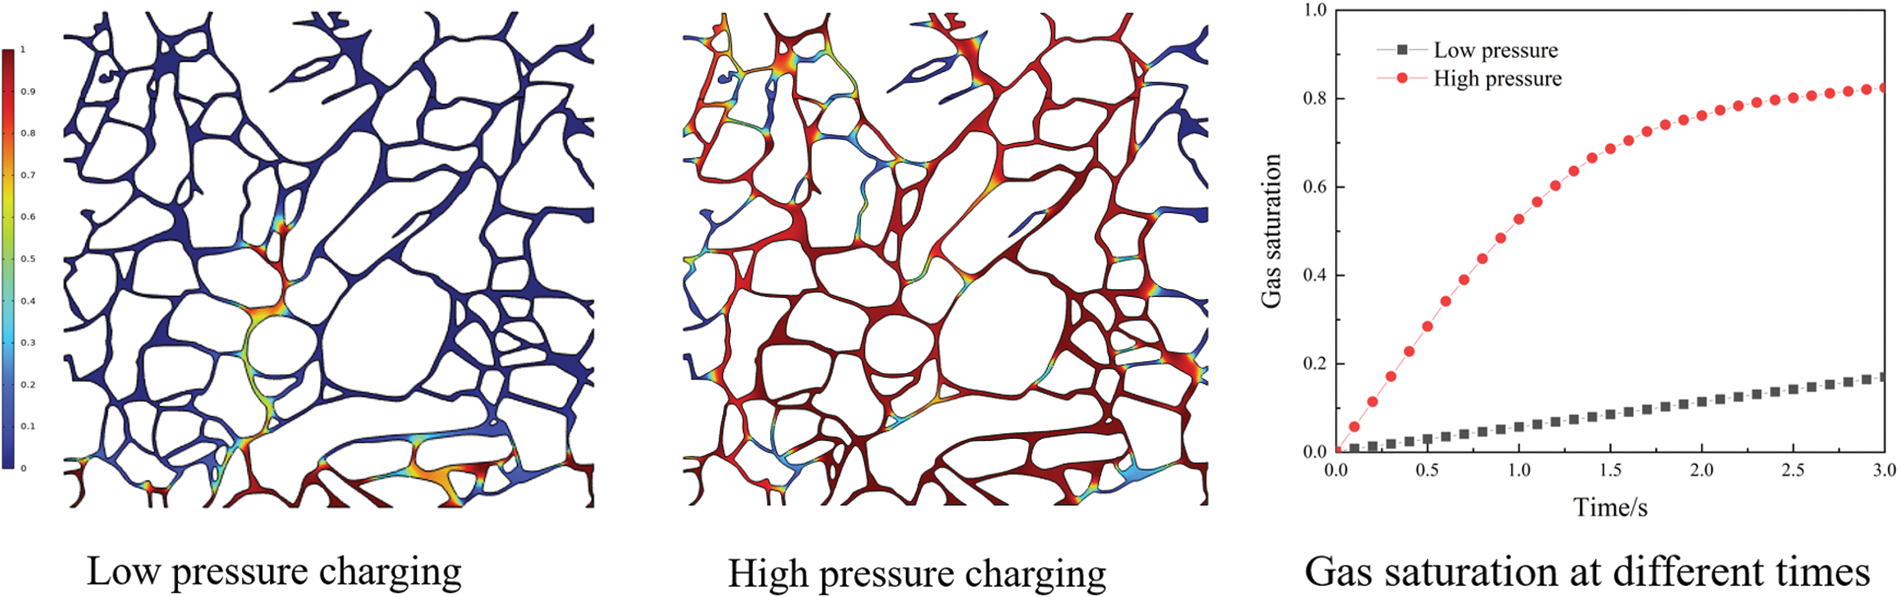
Figure 9: Changes in gas-water microscopic distribution and gas saturation under different charging pressures
This research presents a comprehensive examination of pore structure characteristics and flow simulation outcomes, which can be effectively applied to practical reservoir engineering applications for optimizing natural gas extraction strategies.
(1) Reservoir Evaluation and Zonation Based on Pore Structure
The study demonstrates that the core samples are predominantly composed of small pores, with the pore radius distribution concentrated within the 0.05–0.15 μm range, displaying an unimodal distribution. This observation indicates favorable pore selectivity and suggests that the reservoir exhibits good homogeneity, as evidenced by the normal distribution of pore radii. In practical applications, analogous pore structure analyses can be utilized for the zonation and management of various reservoir sections. Reservoirs characterized by homogeneity and advantageous pore selectivity may be prioritized for development, as they are likely to exhibit enhanced permeability and more uniform fluid flow.
(2) Optimization of Fracturing Techniques to Enhance Permeability
The research indicates that the throat radii are predominantly small (<1 μm), resulting in low permeability. In practical production scenarios, fracturing techniques can be optimized, such as through the implementation of multi-stage fracturing or micro-pore fracturing, to enhance throat connectivity. This strategy can effectively increase the reservoir’s permeability, improve fluid mobility, and consequently enhance natural gas recovery.
(3) Increasing Injection-Production Pressure Differential to Enhance Flow Channels
The LBM simulation results indicate that an increase in the injection-production pressure differential markedly amplifies the impact of reservoir pore structure on flow channels. A higher pressure differential facilitates the opening of additional flow channels, augments the quantity of streamlines, and enhances the tortuosity of flow paths. In practical applications, elevating the injection-production pressure differential, especially in reservoirs characterized by intricate pore structures and low permeability, can potentially enhance natural gas flow efficiency and expedite extraction rates.
(4) Optimization of Gas Injection Processes to Increase Gas Saturation
The simulation results further demonstrate that increased injection pressures during natural gas charging enhance fluid permeability and diffusion velocity, leading to greater water displacement by gas and consequently higher gas saturation. This insight suggests that gas injection processes in reservoir engineering can be optimized by modulating injection pressures to achieve elevated gas saturation and more efficient water displacement. Such an approach has the potential to contribute to improved ultimate gas recovery rates.
(5) Utilizing Pore Coordination Number to Optimize Reservoir Management
The pore coordination number emerges as a crucial factor influencing reservoir permeability, particularly given that isolated and blind-end pores adversely affect reservoir connectivity. Drawing from experimental analysis, reservoir management strategies can be optimized by integrating pore coordination number assessments, with emphasis on regions exhibiting lower pore coordination numbers. These areas may necessitate more intensive enhancement techniques, such as the introduction of supplementary displacement agents or heightened fracturing density, to augment connectivity and permeability.
(1) This study conducted an experimental analysis of the pore characteristics in core samples, examining the influence of pore radius, throat radius, pore volume, and pore coordination number on reservoir formation permeability. The research employed micro-CT to obtain two-dimensional images, which were subsequently reconstructed into three-dimensional models using digital rock technology. The maximum ball method was applied to extract the pore network model, enabling quantification of micropores and three-dimensional visualization of shale interlayers. Flow simulations were performed using the LBM to analyze the effects of pressure differentials and pore structure on the permeability and flow channels within geological reservoirs.
(2) The experimental findings reveal that the core samples predominantly comprise small pores, with pore radii distributed between 0.05–0.15 μm. This unimodal distribution within a narrow radius range indicates favorable pore selectivity. The normal distribution of pore radii in the core samples suggests good reservoir homogeneity. However, the throat radii exhibit a broad distribution and are generally small (<1 μm), resulting in low permeability. Pore volumes are typically small (<300 μm3), with over 50% of pores having volumes less than 100 μm3. The pore coordination number, a crucial parameter of pore structure, significantly influences the permeability of geological formations. Isolated and blind-end pores, which constitute approximately 30%–50% of the total, are primary factors affecting the connectivity of reservoir formations.
(3) The experimental analysis and numerical simulation results using the LBM method revealed that an increase in inlet-outlet pressure differential significantly enhances the influence of the reservoir pore structure on flow channels. Higher pressure differentials result in the opening of additional flow channels, leading to an increase in the number of streamlines and the tortuosity of flow paths. Furthermore, during the natural gas charging process, elevated charging pressures enhance fluid permeability and diffusion speed, resulting in more extensive water displacement by gas, consequently increasing gas saturation.
This study conducted experimental and numerical analyses to examine the influence of reservoir pore structure on permeability, highlighting the crucial roles of pore radius, throat radius, and pore coordination number in fluid flow dynamics. Future research directions could explore the modulation of pressure differentials during injection and production processes, as well as the refinement of fracturing techniques to substantially enhance flow efficiency in reservoirs with intricate pore structures. Subsequently, these methodologies could be applied to various reservoir types, including tight gas, shale gas, and unconventional reservoirs, with the aim of improving recovery rates in low-permeability formations.
Acknowledgement: None.
Funding Statement: Authors received no specific funding for this study.
Author Contributions: Study conception and design: Min Feng, Lei Sun; Data collection: Long Wang; Analysis and interpretation of results: Min Feng, Bo Yang, Wei Wang, Jianning Luo; Draft manuscript preparation: Yan Wang, Ping Liu. All authors reviewed the results and approved the final version of the manuscript.
Availability of Data and Materials: The datasets generated and/or analyzed during the current study are available from the corresponding author on reasonable request.
Ethics Approval: Not applicable.
Conflicts of Interest: The authors declare no conflicts of interest to report regarding the present study.
References
1. Klasic M, Schomburg M, Arnold G, York A, Baum M, Cherin M, et al. A review of community impacts of boom-bust cycles in unconventional oil and gas development. Energy Res Soc Sci. 2022;93:102843. doi:10.1016/j.erss.2022.102843. [Google Scholar] [CrossRef]
2. Bonetti P, Leuz C, Michelon G. Large-sample evidence on the impact of unconventional oil and gas development on surface waters. Science. 2021;373(6557):896–902. doi:10.1126/science.aaz2185. [Google Scholar] [PubMed] [CrossRef]
3. Walsh KB, Haggerty JH, Jacquet JB, Theodori GL, Kroepsch A. Uneven impacts and uncoordinated studies: a systematic review of research on unconventional oil and gas development in the United States. Energy Res Soc Sci. 2020;66:101465. doi:10.1016/j.erss.2020.101465. [Google Scholar] [CrossRef]
4. Arab D, Bryant SL, Torsæter O, Kantzas A. Water flooding of sandstone oil reservoirs: underlying mechanisms in imbibition vs. drainage displacement. J Pet Sci Eng. 2022;213:110379. doi:10.1016/j.petrol.2022.110379. [Google Scholar] [CrossRef]
5. Saidian M, Jain V, Milad I. Pore-structure characterization of a complex carbonate reservoir in South Iraq using advanced interpretation of NMR logs. Petrophysics. 2021;62(2):138–55. [Google Scholar]
6. Mohan MK, Rahul AV, Van Stappen JF, Cnudde V, De Schutter G, Van Tittelboom K. Assessment of pore structure characteristics and tortuosity of 3D printed concrete using mercury intrusion porosimetry and X-ray tomography. Cem Concr Compos. 2023;140:105104. doi:10.1016/j.cemconcomp.2023.105104. [Google Scholar] [CrossRef]
7. Turturro AC, Caputo MC, Gerke HH. Mercury intrusion porosimetry and centrifuge methods for extended-range retention curves of soil and porous rock samples. Vadose Zone J. 2022;21(1):e20176. doi:10.1002/vzj2.v21.1. [Google Scholar] [CrossRef]
8. Memon A, Li A, Memon BS, Muther T, Han W, Kashif M, et al. Gas adsorption and controlling factors of shale: review, application, comparison and challenges. Nat Resour Res. 2021;30(1):827–48. doi:10.1007/s11053-020-09738-9. [Google Scholar] [CrossRef]
9. Liu Z, Liu D, Cai Y, Yao Y, Pan Z, Zhou Y. Application of nuclear magnetic resonance (NMR) in coalbed methane and shale reservoirs: a review. Int J Coal Geol. 2020;218:103261. doi:10.1016/j.coal.2019.103261. [Google Scholar] [CrossRef]
10. Rezaeyan A, Kampman N, Pipich V, Barnsley LC, Rother G, Magill C, et al. Evolution of pore structure in organic-lean and organic-rich mudrocks. Energy Fuels. 2023;37(21):16446–60. doi:10.1021/acs.energyfuels.3c02180. [Google Scholar] [CrossRef]
11. Liu B, Mastalerz M, Schieber J. SEM petrography of dispersed organic matter in black shales: a review. Earth-Sci Rev. 2022;224:103874. doi:10.1016/j.earscirev.2021.103874. [Google Scholar] [CrossRef]
12. Yu K, Zhao K, Ju Y. A comparative study of the permeability enhancement in coal and clay-rich shale by hydraulic fracturing using nano-CT and SEM image analysis. Appl Clay Sci. 2022;218:106430. doi:10.1016/j.clay.2022.106430. [Google Scholar] [CrossRef]
13. Lee H, Oncel N, Liu B, Kukay A, Altincicek F, Varma RS, et al. Structural evolution of organic matter in deep shales by spectroscopy (1H and 13C nuclear magnetic resonance, X-ray photoelectron spectroscopy, and Fourier transform infrared) analysis. Energy Fuels. 2020;34(3):2807–15. doi:10.1021/acs.energyfuels.9b03851. [Google Scholar] [CrossRef]
14. Liu G, Liu K, Zhai G, Zhao J, Guo Z. Crystallinity and formation of silica in Palaeozoic shales: a new quantification calculation method based on X-ray diffraction. Mar Pet Geol. 2023;150:106124. doi:10.1016/j.marpetgeo.2023.106124. [Google Scholar] [CrossRef]
15. Yin Y, Sun Z, Song W, Sun Z, Ren Z. Investigation of natural gas hydrate microscopic occurrence types and pore-scale flow simulation based on digital cores. Energy Fuels. 2023;37(21):16434–45. doi:10.1021/acs.energyfuels.3c01500. [Google Scholar] [CrossRef]
16. Cui R, Hassanizadeh SM, Sun S. Pore-network modeling of flow in shale nanopores: network structure, flow principles, and computational algorithms. Earth-Sci Rev. 2022;234:104203. doi:10.1016/j.earscirev.2022.104203. [Google Scholar] [CrossRef]
17. Liu Q, Sun M, Sun X, Liu B, Ostadhassan M, Huang W, et al. Pore network characterization of shale reservoirs through state-of-the-art X-ray computed tomography: a review. Gas Sci Eng. 2023;113:204967. doi:10.1016/j.jgsce.2023.204967. [Google Scholar] [CrossRef]
18. Yin Y, Sun Z. A multiscale approach for assessing shale oil availability: digital core, molecular simulation, and machine learning analysis. SPE J. 2024;29(6):3033–42. doi:10.2118/219475-PA. [Google Scholar] [CrossRef]
19. Tan M, Su M, Liu W, Song X, Wang S. Digital core construction of fractured carbonate rocks and pore-scale analysis of acoustic properties. J Pet Sci Eng. 2021;196:107771. doi:10.1016/j.petrol.2020.107771. [Google Scholar] [CrossRef]
20. Schofield R, King L, Tayal U, Castellano I, Stirrup J, Pontana F, et al. Image reconstruction: part 1—understanding filtered back projection, noise and image acquisition. J Cardiovasc Comput Tomogr. 2020;14(3):219–25. doi:10.1016/j.jcct.2019.04.008. [Google Scholar] [PubMed] [CrossRef]
21. Mohammadinejad P, Mileto A, Yu L, Leng S, Guimaraes LS, Missert AD, et al. CT noise-reduction methods for lower-dose scanning: strengths and weaknesses of iterative reconstruction algorithms and new techniques. RadioGraphics. 2021;41(5):1493–508. doi:10.1148/rg.2021200196. [Google Scholar] [PubMed] [CrossRef]
22. Sun Z, Yin Y, Wu Y, Sun Z, Zhu L, Zhan Y, et al. Morphological and hydrodynamic properties of hydrates during dissociation in sediment. Fuel. 2023;353:129032. doi:10.1016/j.fuel.2023.129032. [Google Scholar] [CrossRef]
Cite This Article
 Copyright © 2025 The Author(s). Published by Tech Science Press.
This work is licensed under a Creative Commons Attribution 4.0 International License , which permits unrestricted use, distribution, and reproduction in any medium, provided the original work is properly cited.
 Downloads
 Citation Tools