
 Submit a Paper
 Propose a Special lssue
 Open Access
ARTICLE

Experimental Study of Forced Convective Heat Transfer in a Copper Tube Using Three Types of Nanofluids
1 Department of Chemical Engineering, University of Technology-Iraq, Baghdad, 10066, Iraq
2 Department of Chemical Engineering and Petroleum Industries, Al-Mustaqbal University, Babylon, 51001, Iraq
3 Chemical Engineering Department, College of Engineering, Tikrit University, Tikrit, 34001, Iraq
* Corresponding Authors: Zahraa N. Hussain. Email: ; Jamal M. Ali. Email:
Fluid Dynamics & Materials Processing 2025, 21(2), 351-370. https://doi.org/10.32604/fdmp.2024.056292
Received 19 July 2024; Accepted 15 October 2024; Issue published 06 March 2025
 View Full Text
 Download PDF
Abstract
The use of nanofluids as heat transfer media represents an innovative strategy to enhance heat transfer performances. This study investigates experimentally the turbulent convective heat transfer characteristics of water-based nanofluids containing TiO2, CuO, and graphene nanoplatelet (GNP) nanoparticles as they flow through a copper tube. Both the dynamic viscosity and thermal conductivity of these nanofluids were modeled and experimentally measured across varying nanoparticle concentrations (0.01, 0.02, and 0.03 vol.%) and temperatures (25°C, 35°C, and 45°C). The findings indicate that the behavior of nanofluids depends on the parameter used for comparison with the base fluid. Notably, both the friction factor and heat transfer coefficient increase with higher nanoparticle volume concentrations at a constant Reynolds number. The results further reveal that the GNP/water nanofluid, with a volume concentration of 0.03% at 45°C, exhibit the highest Nusselt number, followed by the CuO/water and TiO2/water nanofluids, with respective increases of 17.8%, 11.09%, and 8.11%.Graphic Abstract
Keywords
Nomenclature
| DW | Distilled Water |
| TiO2 | Titanium Oxide |
| NFs | Nano Fluids |
| Re | Reynolds Number |
| CuO | Copper Oxide |
| GNP | Graphene Nanoplate |
| Nu | Nusslt Number |
| SEM | Scanning Electron Microscope |
| e.g., | |
| | Volum Consentration |
| | Density |
| | Specefic Heat Capacity |
| | Dynamic Viscosity |
| u | Velosity |
One of the most important topics for engineering study and research is heat transfer. It plays an important role in power production, air conditioning, electronic components, transportation and many other applications, using the basic heat transfer methods of radiation, conduction and convection. Therefore, enhancing heat transfer is a crucial aspect that must always be considered in numerous heat-related applications. Compared to conduction, convection is a more effective means of transferring heat, while radiation is the slower and less efficient method of heat transfer. Liquids are widely used as a common medium for heat transfer. Many researchers have studied the ideal types of fluids that can be used as a working medium to improve heat transfer performance. Alternatively, some researchers have proposed incorporating nanoparticles into the base fluid to increase its performance, taking advantage of advances in nanotechnology [1,2].
Air-cooled heat exchangers have limited ability to dissipate heat from electronic components, primarily due to their significantly lower thermal conductivity and heat capacity. Liquids, with their significantly higher thermal conductivity than air, have the potential to make electronic cooling systems significantly more efficient and compact. Improving the thermal properties of conventional heat transfer fluids can enhance the efficiency of a heat exchanger system while simultaneously reducing its overall size [3].
Nanofluids (NFs) are a novel class of synthetic heat transfer fluids proposed in 1995 by Choi et al. [4]. Nanofluids are complex fluids consisting of base fluids containing nanometer-sized dispersed particles. These nanoparticles exhibit high thermal conductivity, which enhances the overall heat transfer capabilities of the nanofluid. By dispersing these nanoparticles within the core fluid, the thermal properties of the fluid are dramatically changed, resulting in improved heat transfer performance. These nanoparticles are metallic or non-metallic polymeric particles that can form suspension when suspended in a base fluid. The addition of nanoparticles to the base fluid has increased the mixture’s thermal conductivity [5]. Nanofluids consist of dispersing particles of a size of 100 nm or smaller in the base fluid. These particles may be metallic or non-metallic polymers that have physical properties superior to those found in the base fluids (water, oil, ethylene glycol, etc.), in addition to improving, the thermal conductivity of fluids also improves some other properties, such as viscosity, heat transfer coefficient, and thermal diffusivity [6–8].
Additionally, according to studies by Choi and colleagues [4,9], the thermal conductivity of nanofluids is influenced by various factors such as the shape and size of nanoparticles, operating temperature, the thermal conductivity of the base fluid, and the volume fraction of nanoparticles in the base fluid, and flow regime. Together, these factors determine the improvement of the overall thermal conductivity of nanofluids. As a result, due to the enhanced thermal conductivity, the heat transfer coefficients are improved through convective heat transfer. This improvement can be attributed to the increased active surface area caused by the suspended nanoscale particles and the interactions and collisions between these particles [10]. While nanofluids offer numerous benefits, their primary concern lies in their stability [11].
Studies of the thermophysical and heat transport properties are essential for the use of nanofluids in engineering applications. In order to examine the convective heat transfer coefficient in flat pipes with different lengths and interior diameters, numerous experimental investigations have been carried out. Various kinds of nanofluids, such as metal oxide, metal, and carbon-based nanoparticles, have been the subject of these studies [12]. Gherasim et al. [13] investigated the impact of employing Al2O3/water nanofluid on a radial flow heat sink. Their experimental findings demonstrated that the Nusselt number rises with both an escalation in the Reynolds number and the volume concentration of the nanomaterials.
The thermophysical properties of titanium dioxide (TiO2) nanoparticles have received great attention among researchers [8,14]. Qi et al. [15] examined how TiO2/water nanofluids performed in a heat exchanger using double tubes. The study demonstrated that at volume concentrations of 0.1%, 0.3%, and 0.5% nanofluids increased the rate of heat transfer by 10.8%, 13.4%, and 14.8%, respectively. The majority of experimental studies investigating the heat transfer properties of coiled flow inverter systems have employed water as their operating fluid [16]. Mahmoudi et al. [17] reported in their study conducted in spirally wound tubes to evaluate heat transfer using titanium oxide particles as a nanofluid that the addition of these nanoparticles led to an increase in the Nusselt number by 30% compared to the base fluid used.
Sivakumar [18] used a heat exchanger to examine the effects of two distinct nanofluid compositions Al2O3/water and CuO/ethylene glycol separately at different temperatures and concentrations. The outcomes demonstrated that, in comparison to Al2O3/water, the CuO/ethylene glycol nanofluid increased the heat transfer coefficient. Furthermore, the outcomes demonstrated that as particle concentration rose, the heat transfer coefficient rose as well. Godson et al. [19] investigated experimentally with heat transfer properties of silver/water nanofluids were studied within a turbulent system using concentrations varying from 0.01% to 0.04% in a shell and tube heat exchanger. Researchers noted a 12.4% enhancement in the convective heat transfer coefficient, leading to a 6.14% increase in efficiency. This boost in heat transfer efficiency was attributed to the enhanced thermal characteristics of the nanofluids.
Compared to metals, carbon materials have high thermal conductivity and low density. One of the best carbon materials used in preparing nanofluids is graphene. Graphene is a two-dimensional, hexagonal structure consisting of one-atom thick layers of carbon atoms organized differently in one plane. Due to its structure, graphene exhibits exceptional mechanical, electrical properties and thermal and has become the focus of attention of several researchers [20]. Using a graphene oxide/distilled water as nanofluid at a concentration of 0.02 vol.% and a turbulent flow regime (R = 5032) and a flow rate of 1.5 L/min, Karabulut et al. [12] investigated how to increase heat transmission in a circular copper tube. They found that the heat transfer coefficient increased by about 45% in comparison to the basic fluid.
Akhavan-Zanjani et al. [21] investigated the convective heat transfer coefficient of G-DW nanofluids in a circular conduit with a 4.2 mm inner diameter under steady heat flux conditions. With a Reynold number of 1850 and a volume concentration of 0.02 vol.%, the heat transfer coefficient rose by 14.2%. Agglomeration, however, was not observed in the G-DW nanofluid that was being studied. Ranjbarzadeh et al. [22] created an isothermal heat transfer system to examine how the flow of GO-DW nanofluid affected the heat transfer and friction coefficient in an 8.5 mm inner diameter circular pipe. The Reynold number was chosen between 5250 and 36,500, and the volumetric nanofluid concentration ranges employed were 0%–0.1%. When compared to the base fluid, it was discovered that the nanofluid had a maximum increase in the convection heat transfer coefficient of 40.3%. In addition, a pressure loss maximum increase of 16% was found.
Based on the earlier review, although a lot of research has been conducted on enhancing heat transfer using nanofluids as operating fluids. There is still much that needs to be looked at and researched, especially GNP particles, as few researchers have focused on these particles. In addition, the vast majority of researchers have focused in their studies on the laminar flow regime in heat transfer through pipes and paid less attention to turbulent flow. The current study aims to achieve additional insights into the effect of each (TiO2, CuO, and GNP) particle on heat transfer in a copper pipe under the influence of turbulent flow. As well as studying the physical properties of these particles and the extent of the impact of these properties on enhancing heat transfer. Three types of particles with different thermal conductivities were selected to compare the effect of high thermal conductivity on improving heat transfer.
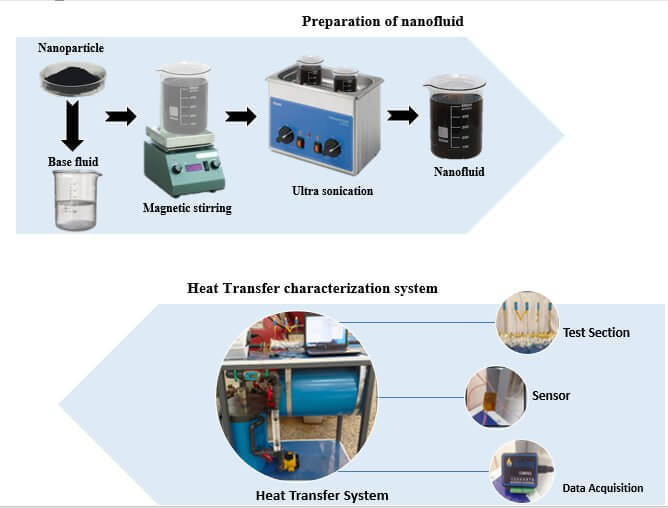
The two-step procedure is considered the most efficient mechanism for preparing nanofluids on a large scale and is more economical [23,24]. Preparing nanofluids with good properties is essential in nanofluid research to obtain stable nanofluids that do not agglomerate at high temperatures or after a certain period. In this research, we used distilled water as the base fluid and dispersed three different types of nanoparticles (TiO2, CuO, and GNP) purchased from (sky spring nanomaterials). Table 1 shows the physical properties of the nanoparticles and the basic liquid used in the preparation. Fig. 1 shows the method for preparing nanofluid.

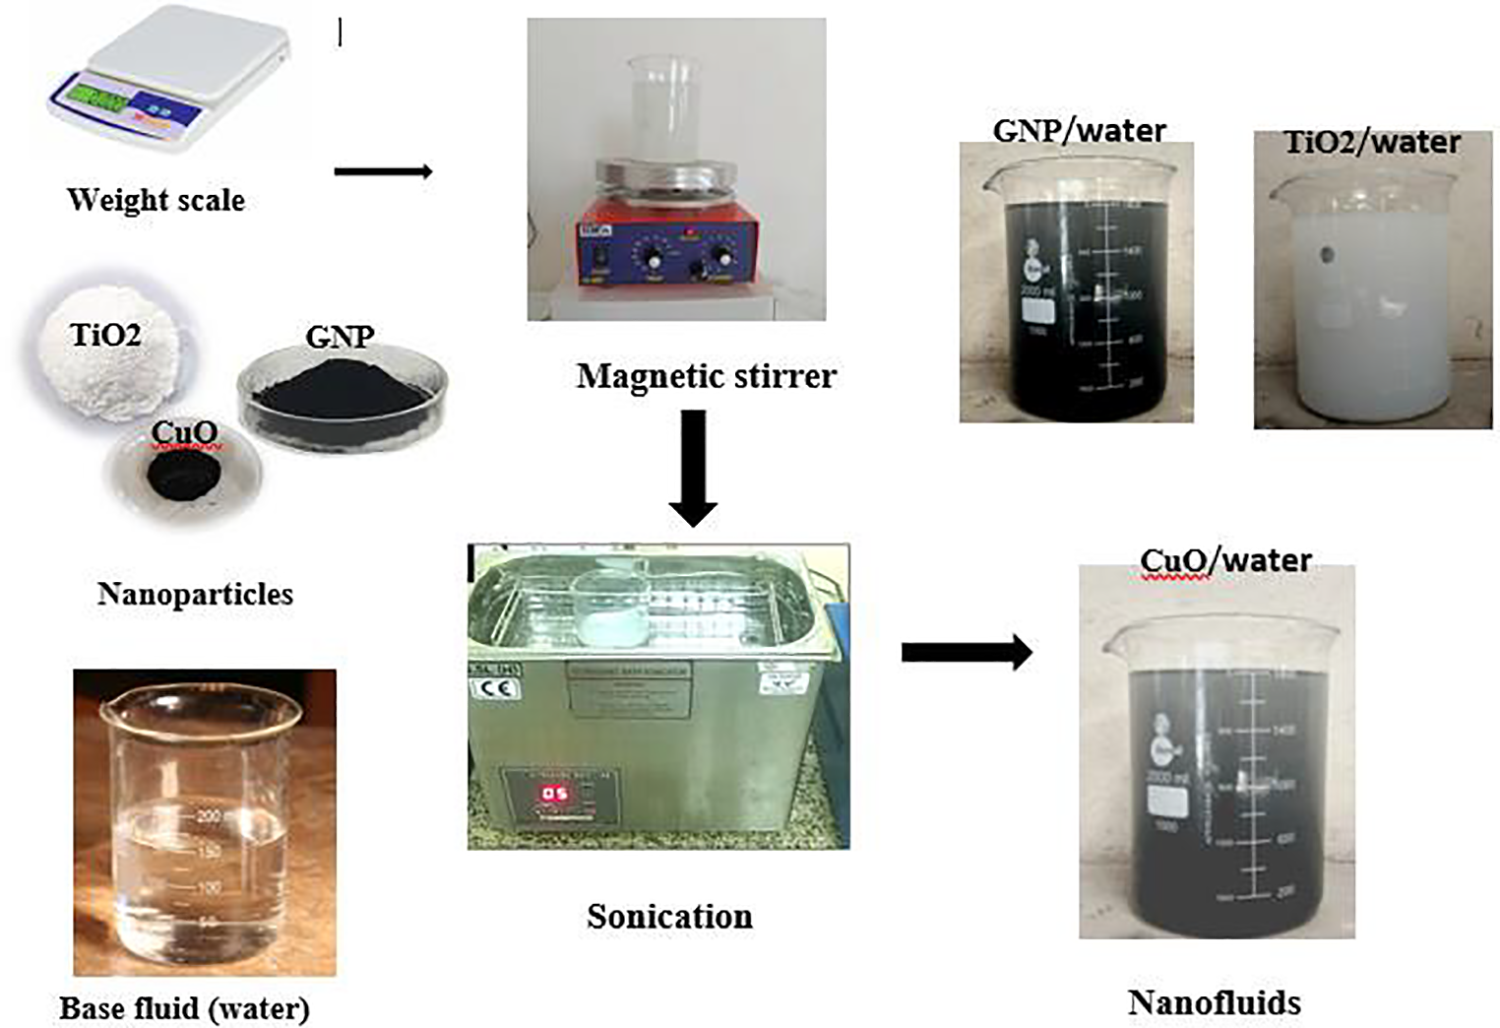
Figure 1: Flow diagram of preparation steps of the nanofluids samples
First we disperse the three nanoparticles (TiO2, CuO, and GNP) in separate processes (0.1%, 0.2%, and 0.3%) in distilled water without surfactants by using a magnetic stirrer and a hot plate (Model: HS-860, Temperature: 30°C–300°C) to stir the mixture during the first hour to ensure good dispersion and dissolution of the particles in the liquid. Then, magnetic stirring was performed for four hours to ensure that the nanoparticles spread correctly and steadily throughout the liquid. Afterward, an ultrasonic bath is employed (Model El-5LH, Frequency 20 KH, Temperature 40°C, Capacity 3.5L) for an hour to guarantee mixture homogeneity and achieve the necessary volume fraction of nanoparticles.
These samples demonstrated excellent suitability for long-term stability and uniform dispersion. See Eq. (1), Reference [26] was used to determine the nanofluids’ volume concentrations.
where (
2.1.1 Characterization of Nanofluid
The scanning electron microscope (SEM) test was used for characterization analysis at the Department of Materials Research, Ministry of Science and Technology in Baghdad. With the SEM, a concentrated stream of high-energy electrons is utilised to generate various signals at the surface of solid objects. With the SEM, analysis of certain sample point locations is also possible. The SEM was utilized to assess the (TiO2, CuO, and GNP) nanoparticles’ morphological characteristics.
2.1.2 Thermophysical Parameters of Nanofluid
Thermophysical characteristics of the nanofluid are important in heat transfer. The viscosity, specific heat capacity, density, and thermal conductivity were determined as suggested by Pak et al. [27].
2.2 Heat Transfer Experimental Setup
The experimental setup’s schematic diagram is shown in Fig. 2, while Fig. 3 illustrates the setup apparatus used in the experiment. The setup includes a test section, wherein the test tube is made of copper due to its desirable properties such as high hardness, thermal conductivity, and smooth surface. To minimize heat losses to the surrounding environment, a ceramic fiber cover envelops the test section with a thickness of 60 mm and a thermal conductivity of 0.075 W/mk.
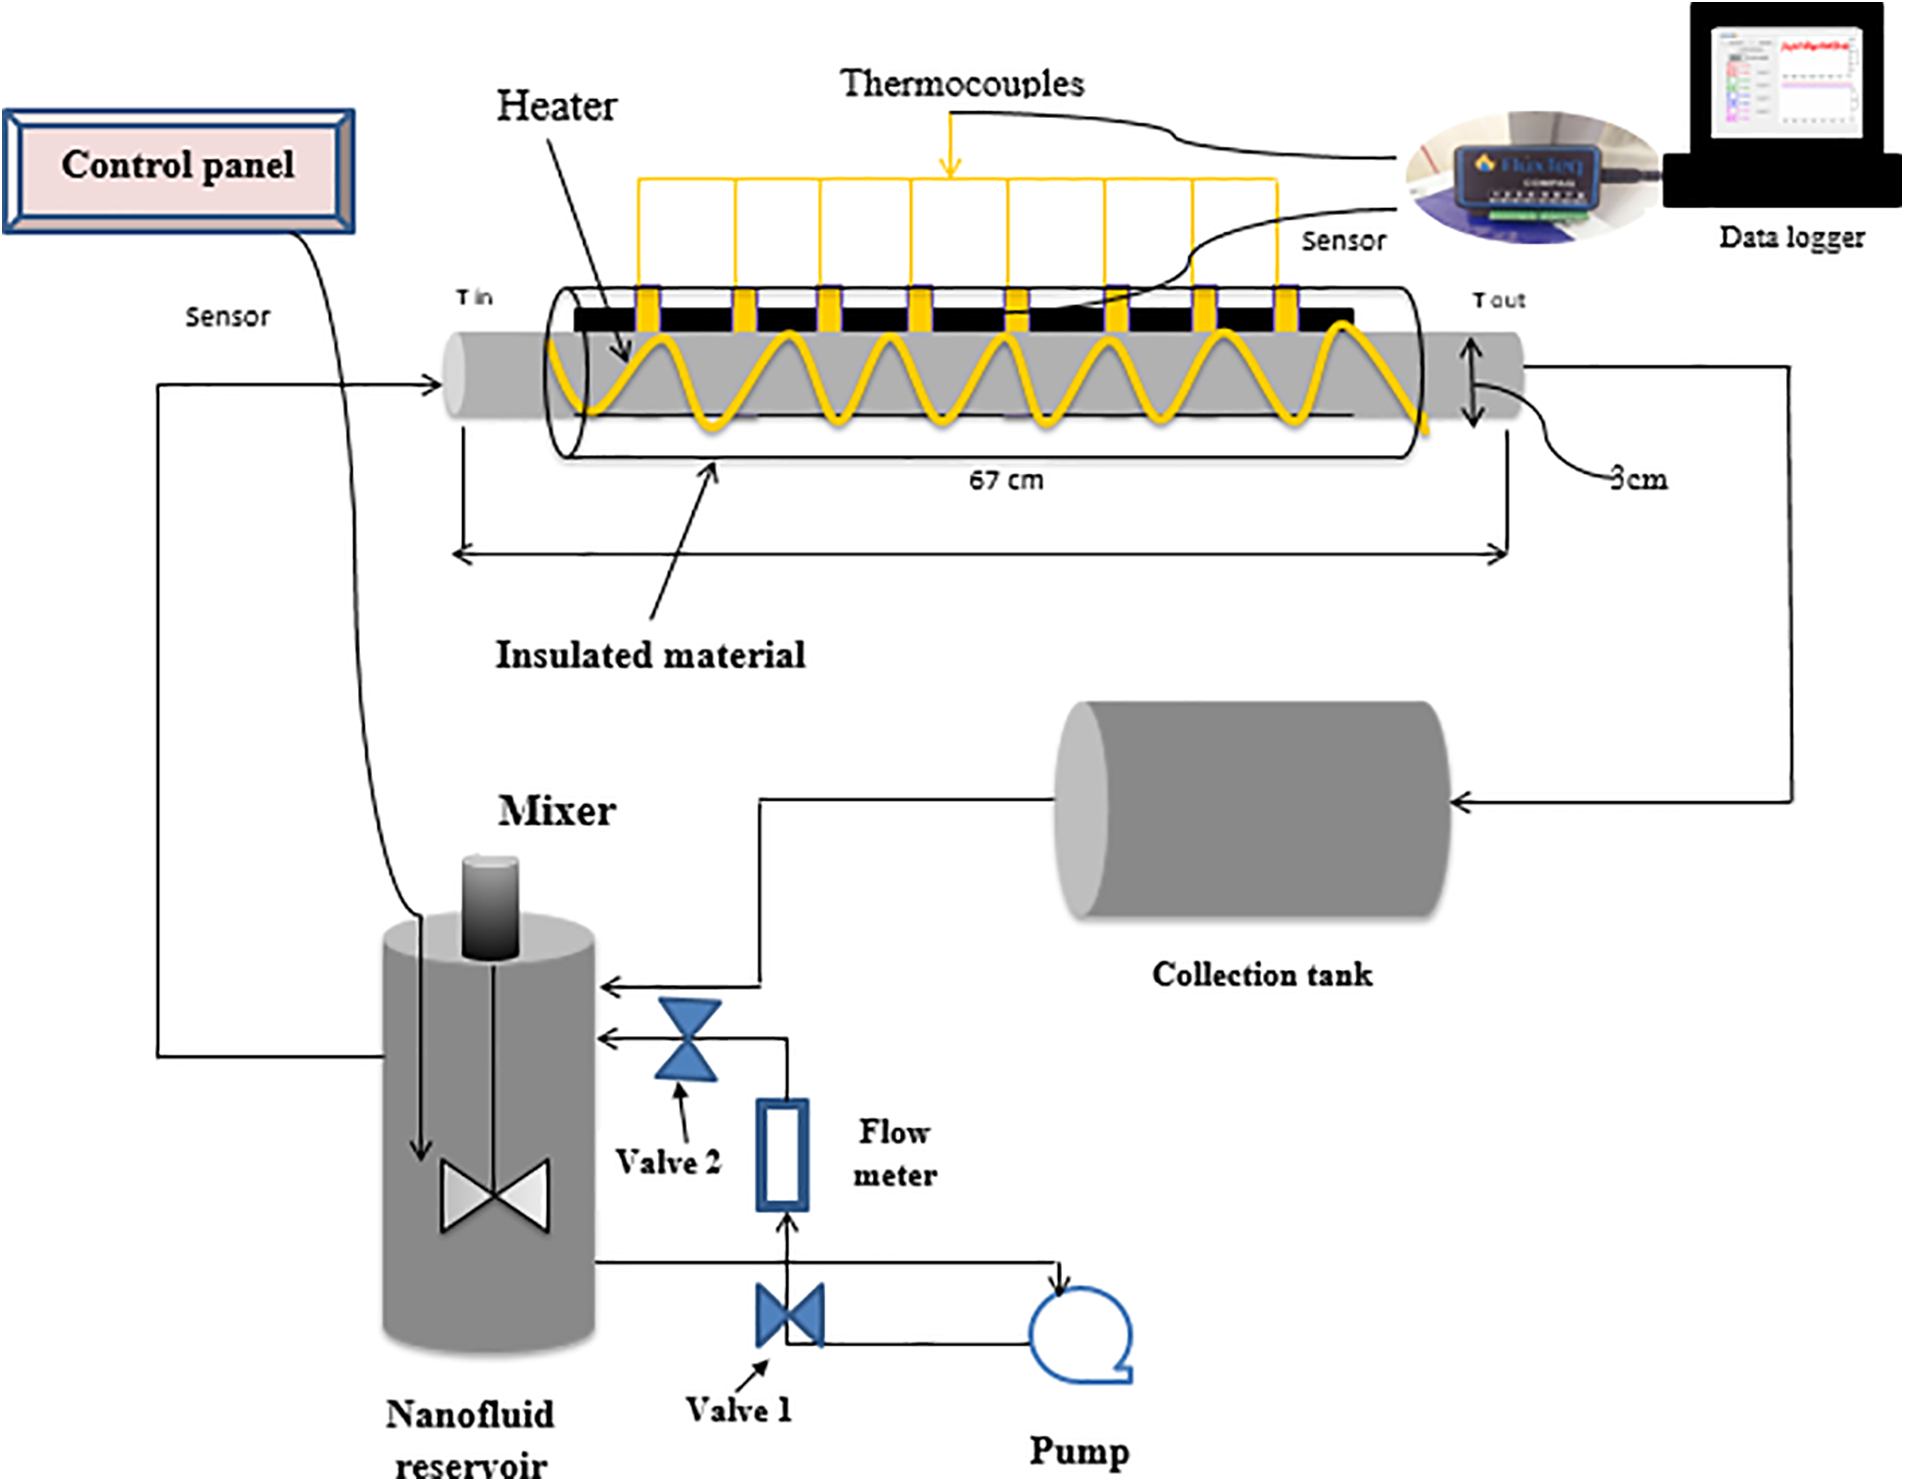
Figure 2: Schematic diagram of the forced convection heat transfer
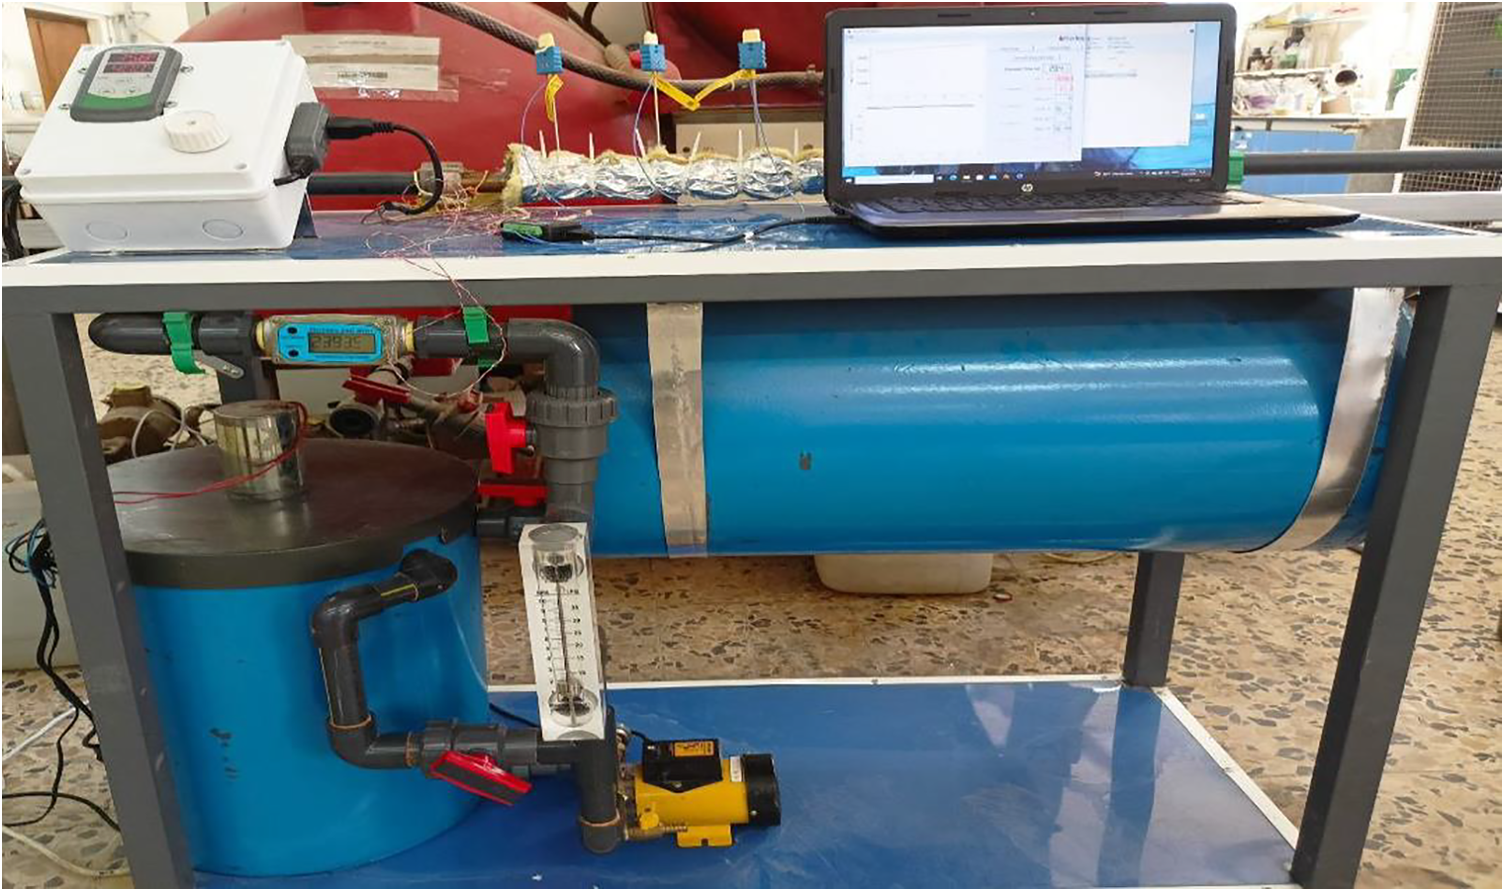
Figure 3: Experimental set-up apparatus
The experimental apparatus is constructed from a closed flow loop consisting of a 200 cm long pipe with an inner and outer diameter 3 and 3.5 cm, respectively. It incorporates storage tank and a mixer. A bypass regulator is used to regulate the working fluids’ fluctuating flow rate. The flow rate in liters per minute, which ranges from 1 to 35 L/min, is measured by a digital flow meter that is positioned before to the test section’s input. Two movable valves control the flow rate: one in the bypass line and one in the main flow loop. Pressure measuring devices are positioned at the test section inlet and exit to determine the pressure drop. A chiller is used to lower the working fluids’ temperature following the test section’s heating procedure. The heater, controller, and DC power supply make up the heating unit.
Fig. 4 illustrates the test section, which consists of copper tube with an inner diameter of 3 and 3.5 cm outer diameter with 67 cm of length. In this section, five T-type thermocouples with a diameter of 5 mm are placed at different locations along the test section. These thermocouples are placed at distances of 7, 17, 27, 37, and 47 cm from the inlet of the test section in the area through which the hot fluid passes. Their purpose is to measure the bulk temperature of the fluid at these specific locations. In addition, a heat flux sensor from FluxTeq LLC (model VA24060-6370, Blacksburg, VA, United States (USA), Blacksburg) [28] is mounted on the inner wall surface of the test section to measure both the surface temperature and the local heat flux per unit area between the sensor and the adjacent fluid. A heater (produced by HTS/Amptek Company, Stafford, TX, USA) is used to heat the test section surface through the sensor.
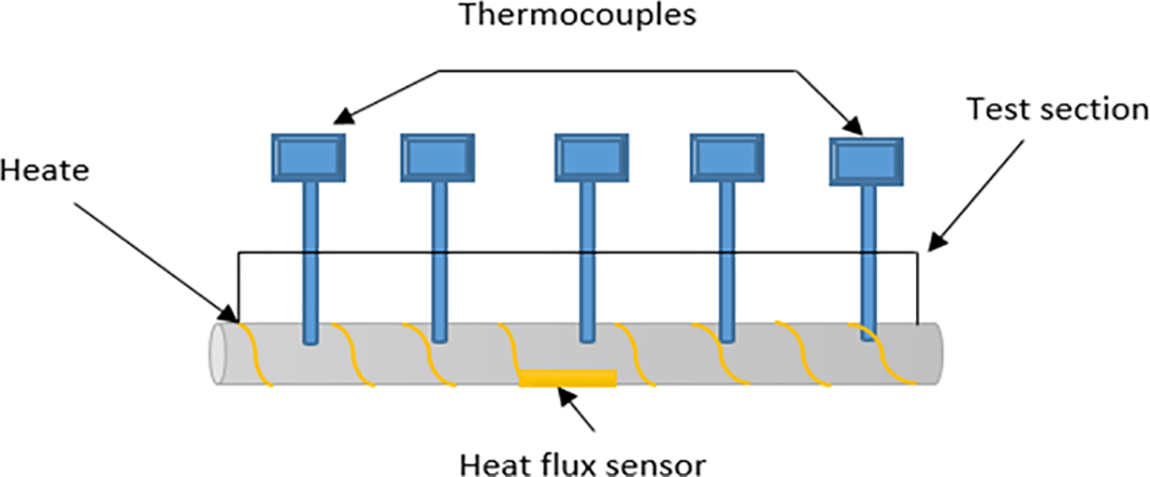
Figure 4: Sectional view of the experimental test section
As depicted in Fig. 5, the experimental setup using FluxTeq’s PHFS heat flux and integrated temperature sensors. These sensors were linked to the ComPAQ Heat Flux and Thermocouple Data Acquisition Instrument (FluxTeq LLC, COMPAQ DAQ, VA24060-6370, Blacksburg, VA, USA). This data acquisition system, based on Arduino, is equipped with eight differential channels that can accommodate up to four complete sensors. The connections for both the heat flux and thermocouple sensors were consistently upheld throughout the experiment.
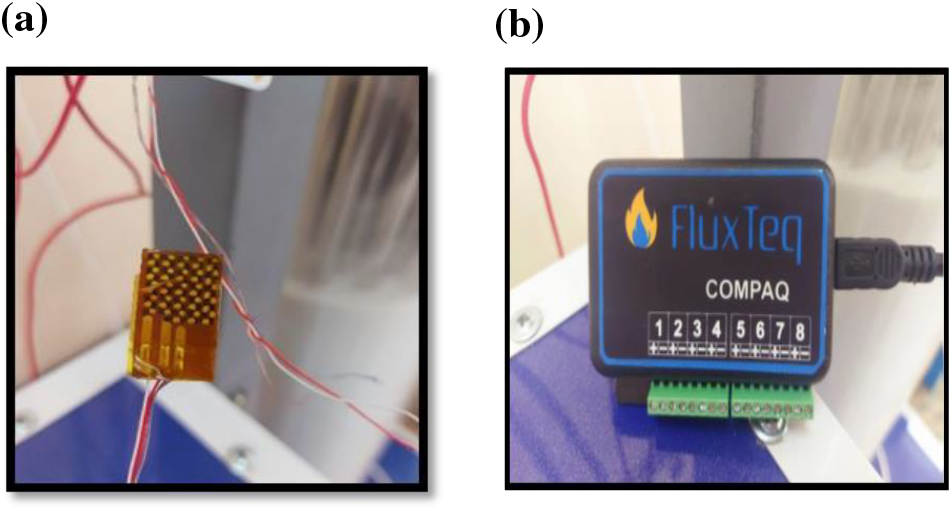
Figure 5: (a) Heat flux sensor, (b) ComPAQ Heat Flux and Thermocouple Data Acquisition device
From Eq. (6), the total heat transfer coefficient is determined [29].
where h: convective heat transfer coefficient
The Reynolds number is defined as Eq. (8).
The velocity is determined by dividing the flow rate by the cross-sectional area of the channel. The Nuslet number can be calculated from Eq. (9).
The Darcy friction factor can be determined by using Eq. (10) [30].
3.1 Scanning Electron Microscope (SEM)
The morphology of (TiO2, CuO, and GNT) nanoparticles was analyzed using the high resolution of the FE-SEM device. Fig. 6 shows the nanoparticles’ size distribution and surface shape because of their high surface energy—a consequence of their high surface-to-volume ratio—CuO and TiO2 nanoparticles aggregate. It is evident from this image that the morphologies of the CuO and TiO2 particles are entirely different from one another. CuO nanoparticles are asymmetrical and non-circular, whilst TiO2 nanoparticles are circular in shape. The particle sizes of these two samples also varied from one another.
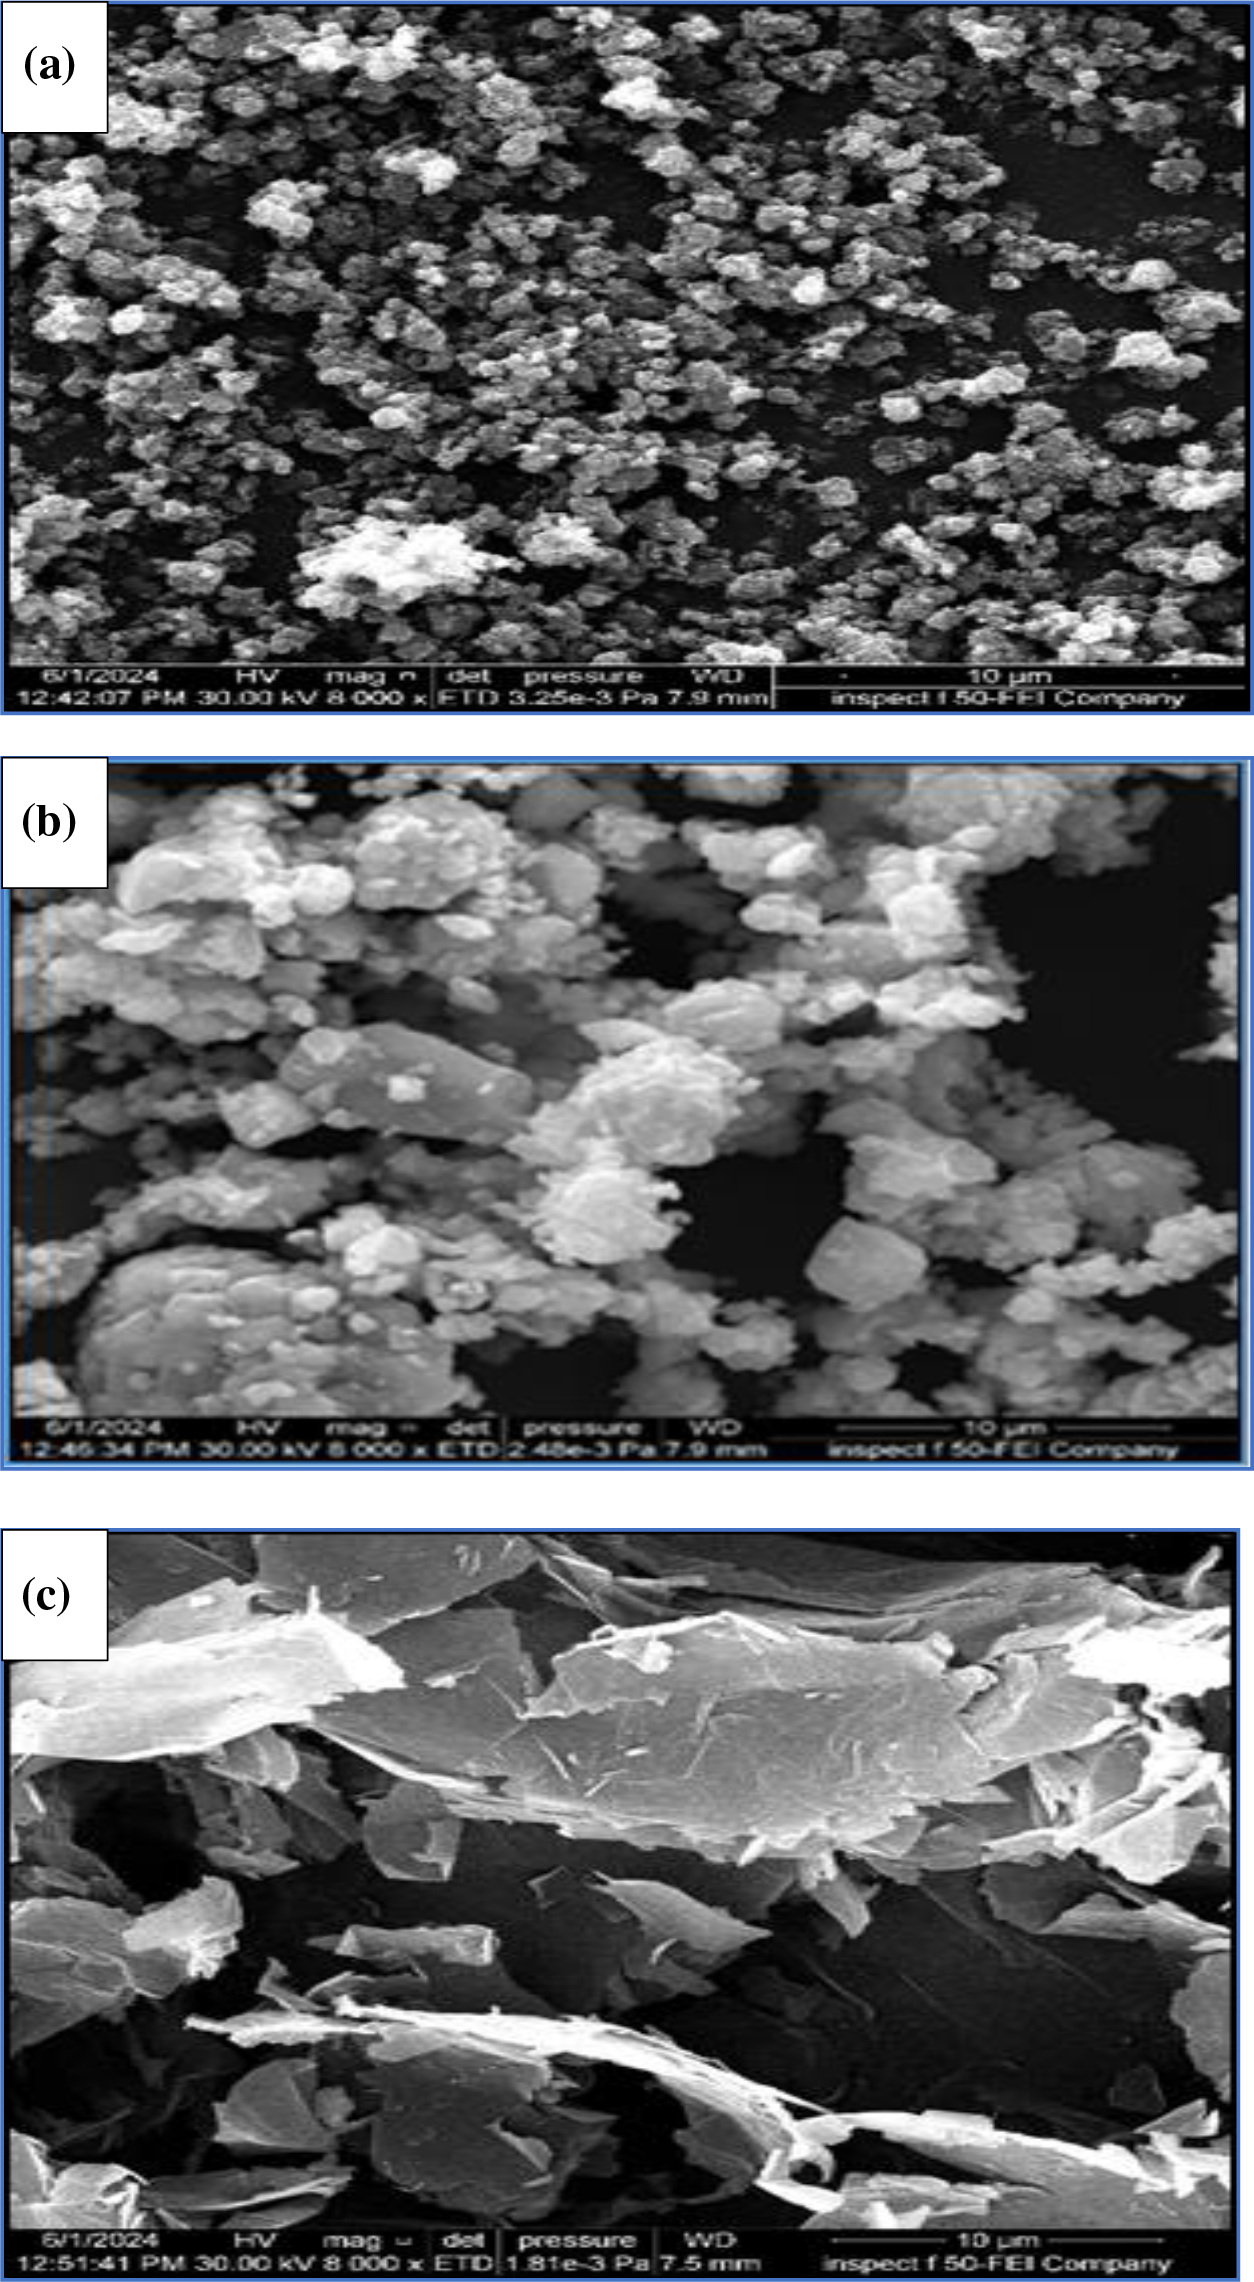
Figure 6: SEM images of the nanoparticles (a) TiO2, (b) CuO, and (c) GNP
Fig. 6 indicates that the CuO and TiO2 samples had particle sizes of about 30 and 50 nm, respectively. Demonstrates that the size distribution of the TiO2 nanoparticle sample is more reasonable than that of the CuO sample. These results are similar to those obtained by [8,31]. The structure and morphology of GNPs were demonstrated in Fig. 6c (SEM image), which shows that they have a flaky sheet structure with a width of at least 10 μm.
3.2 Thermophysical Properties of Nanofluid
Density, specific heat capacity, dynamic viscosity, and thermal conductivity are thermophysical properties that affect the convective heat transfer coefficient in nanofluids. Assuming that the nanoparticles give a uniform dispersion in the base fluid, the nanoparticle concentration can be regarded as consistent across the tube. While this assumption may not hold in real-world systems due to factors like particle migration, it remains a valuable method for assessing the physical characteristics of a nanofluid [32].
Fig. 7 illustrates the measured density of the base fluid and the different concentrations of nanofluid at test temperatures 25°C to 45°C, nanofluids with nanoparticle volume concentrations of 0.03% see an increase in density of 9%, 16% and 3% for TiO2, CuO, and GNP compared to the distilled water, respectively. The increase varies according to the type of added particles. This is due to the density of each type of these particles, as the highest density obtained was for (CuO/water) the nanofluid due to its high density, and the lowest density was (GNP/water) nanofluid due to its low density. In addition, shows that when temperature increases the density of nanofluids decreases.
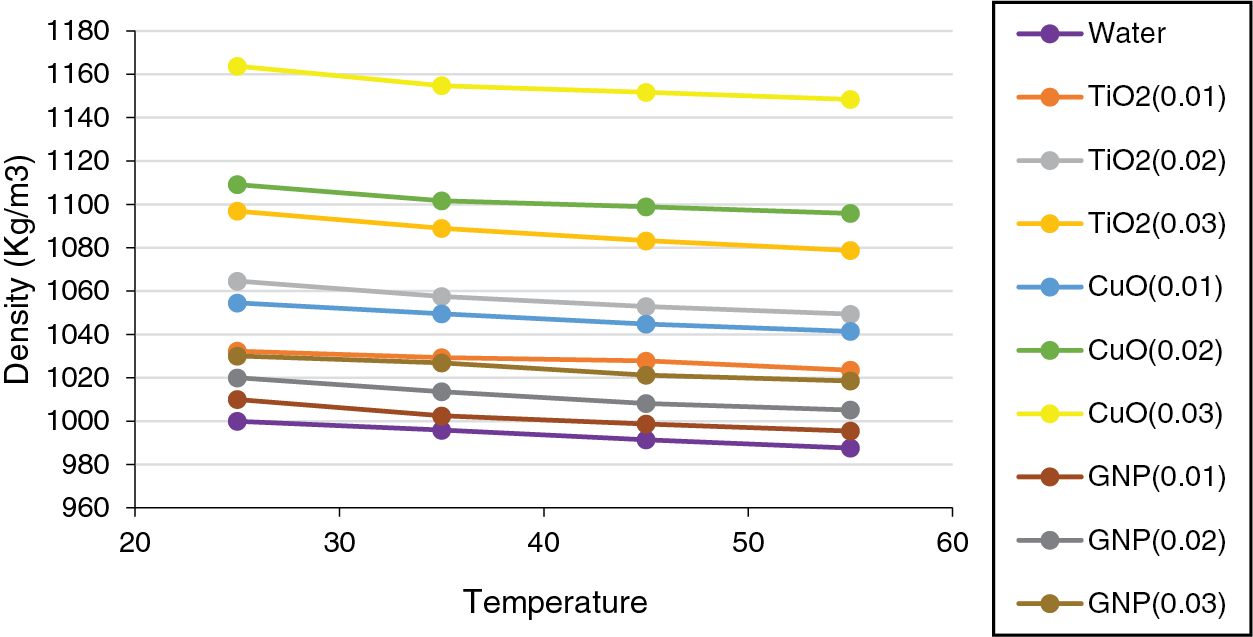
Figure 7: Density of nanofluids vs. temperature at different concentration
Fig. 8 illustrates the specific heat capacity measurement for nanofluids as a function of temperature and nanoparticle volume concentration. It is apparent from the figure that the specific heat capacity of nanofluids decreases with an increase in the volume fraction of nanoparticles in the nanofluids. The results show that the reduction in specific heat of nanofluids at 0.01, 0.02, and 0.03 volume concentrations are 3.5%, 7%, and 10%, respectively, for TiO2, compared to the base fluid. For CuO are 5%, 11%, and 17%, respectively,and for GNP it was 1.6%, 3%, and 5%, respectively. This proves that as the nanoparticle concentration increment, the specific heat capacity value decreases. Furthermore, as temperatures rise, specific heat has been seen to tend to increase These results are similar to the conclusions obtained by Ha et al. [33].
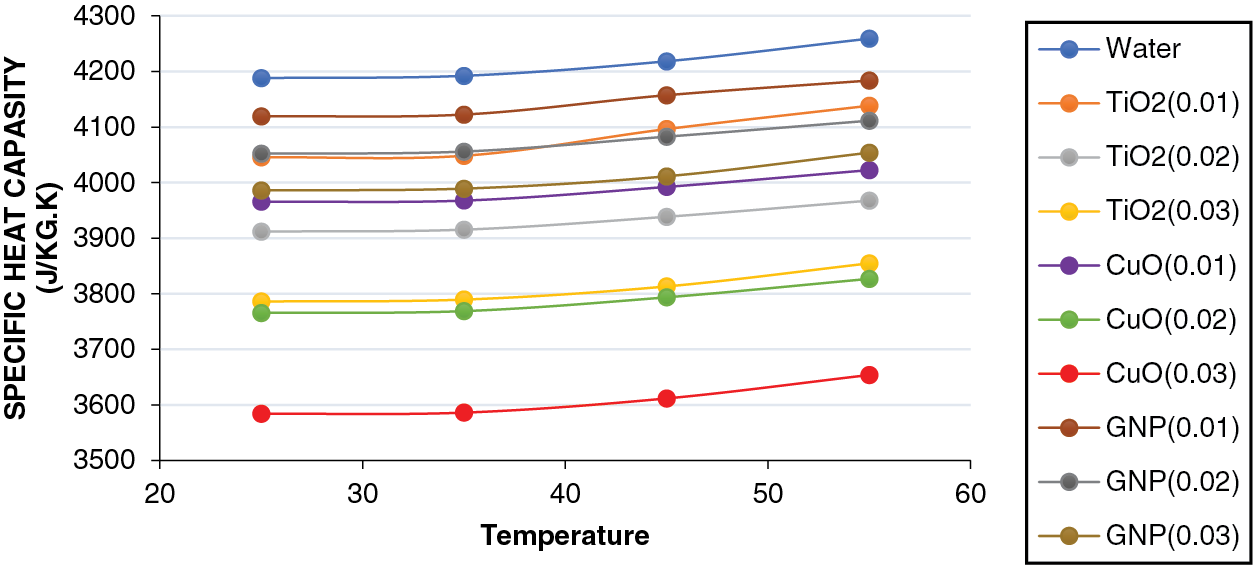
Figure 8: Specific heat capacity of various fraction of nanofluids samples
Fig. 9 demonstrates how the temperature and volume concentration of the nanoparticles affect the viscosity of the nanofluids. It is evident that as the volume concentration of nanoparticles increases, the dynamic viscosity of the nanofluid increases noticeably in comparison to the base fluid. At 45°C, for nanofluids containing 0.01%, 0.02%, and 0.03% volume concentration of nanoparticles the increase in the dynamic viscosity is 2.5%, 5%, and 7.5%, for (TiO2/water), respectively, in contrast to the base fluid. Moreover, for (CuO/water) is 3.12%, 6.8%, and 8.7%, additionally, the increase in the dynamic viscosity for (GNP/water) is 3.7%, 8.1% and 13%. The increase varies according to the type of added particles. The results also indicate that the nanofluid viscosity decreases as the temperature increases. These results are similar to the conclusions obtained by both Ebrahimnia-Bajestan et al. [34]. They showed that the viscosity of the nanofluid increases as the concentration of particles increases and reduces as the temperature rises.
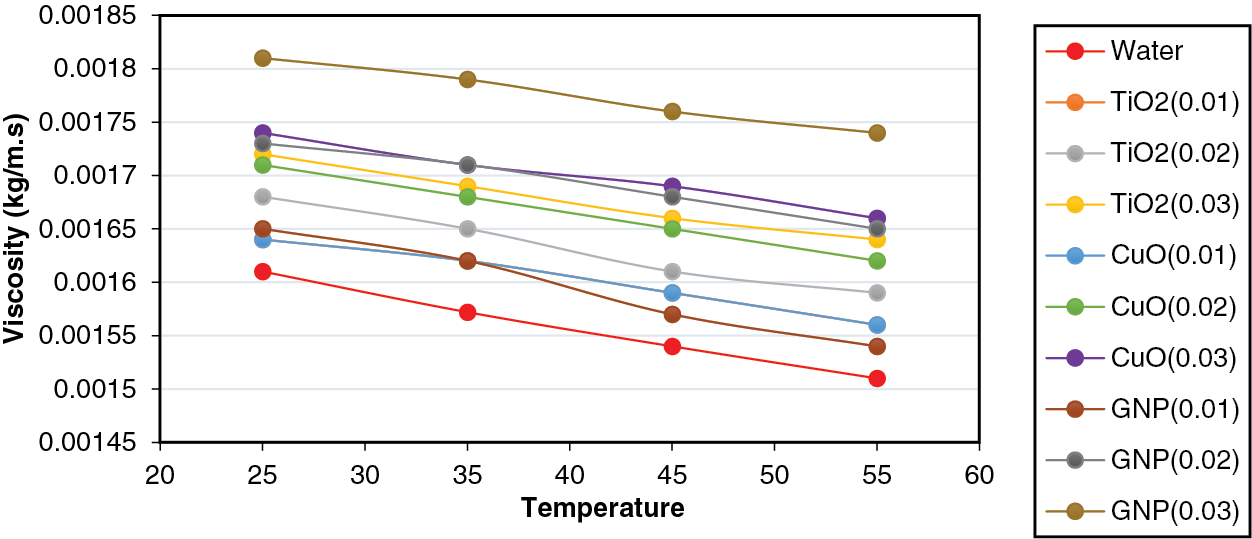
Figure 9: Dynamic viscosity of nanofluids vs. temperature
In Fig. 10, thermal conductivity measurements for different nanofluids TiO2/water, CuO/water, and GNP/water are presented at four distinct temperatures. The findings unequivocally indicate that the addition of minute quantities of nanoparticles results in a substantial enhancement in thermal conductivity compared to the base fluid. Furthermore, the data underscore that the choice of nanoparticles employed markedly influences the thermal conductivity of nanofluids. The results suggest that elevating the concentration of nano-additives with increasing temperature will further enhance the thermal conductivity in line with the observed trends [8].
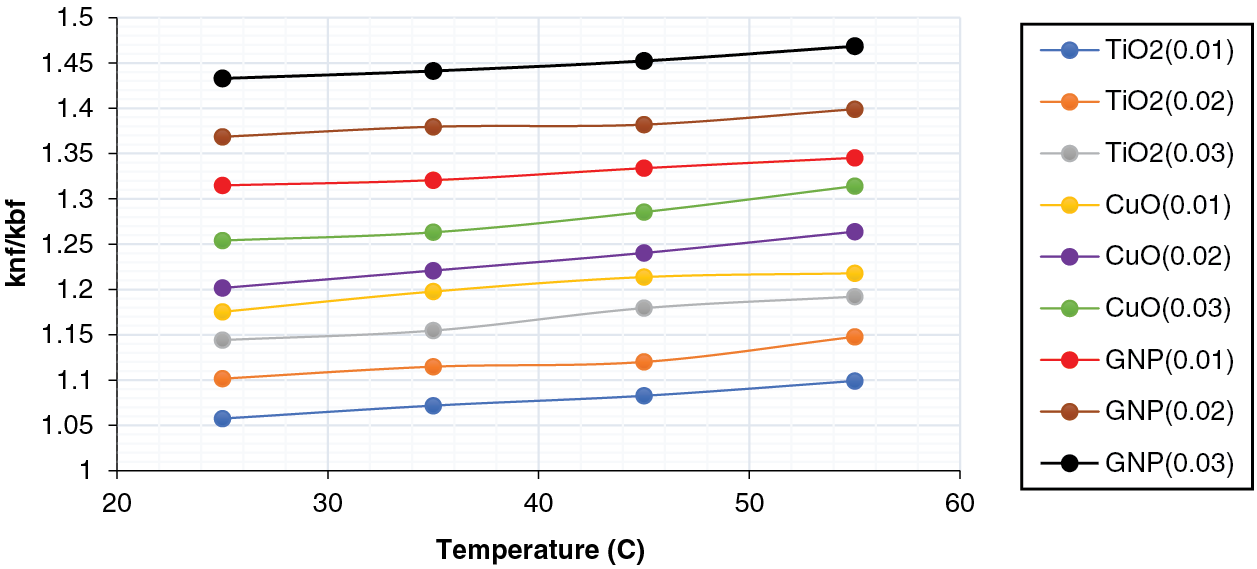
Figure 10: Enhancement of nanofluids’ thermal conductivity as a function of volume concentration at varying temperatures
The nanofluids containing 0.01%, 0.02% and 0.03% volume concentration TiO2 nanoparticles showed an increase in heat conductivity of 8%, 12%, and 18%, respectively, in comparison with the water basic fluid. Moreover, for CuO the enhancement was 21%, 24% and 28%, respectively. Additionally, for GNP/water nanofluid the improvement in thermal conductivity was 33%, 39% and 43%, respectively.
The results showed that the highest thermal conductivity was for the GNP/water nanofluid with 0.03 vol.% concentration, reaching 44% at 25 degrees Celsius.
3.3 The Samples’ Heat Transfer Coefficient
3.3.1 Validation of Experimental Test
Before commencing systematic experiments on the base fluid and nanofluid, the reliability and accuracy of the experimental measurements were validated using deionized (DI) water exclusively. The experimental results obtained from the DI water tests were compared with the predictions derived from Eq. (11) [33]. To ensure the accuracy of the measurements, the experimental setup was carefully calibrated and verified the following relation:
The properties were assessed under bulk-temperature conditions throughout the study. Fig. 11 illustrates that an increase in the Reynolds number leads to an increase in the Nusselt number. The experimental data exhibited a strong agreement with the results obtained from the correlation used in the analysis. The maximum deviation observed between the experimental and theoretical data was found to be 9.6%, which is below the acceptable threshold of 10%. This finding confirms the reliability and accuracy of the test rig and instrumentation employed in the study.
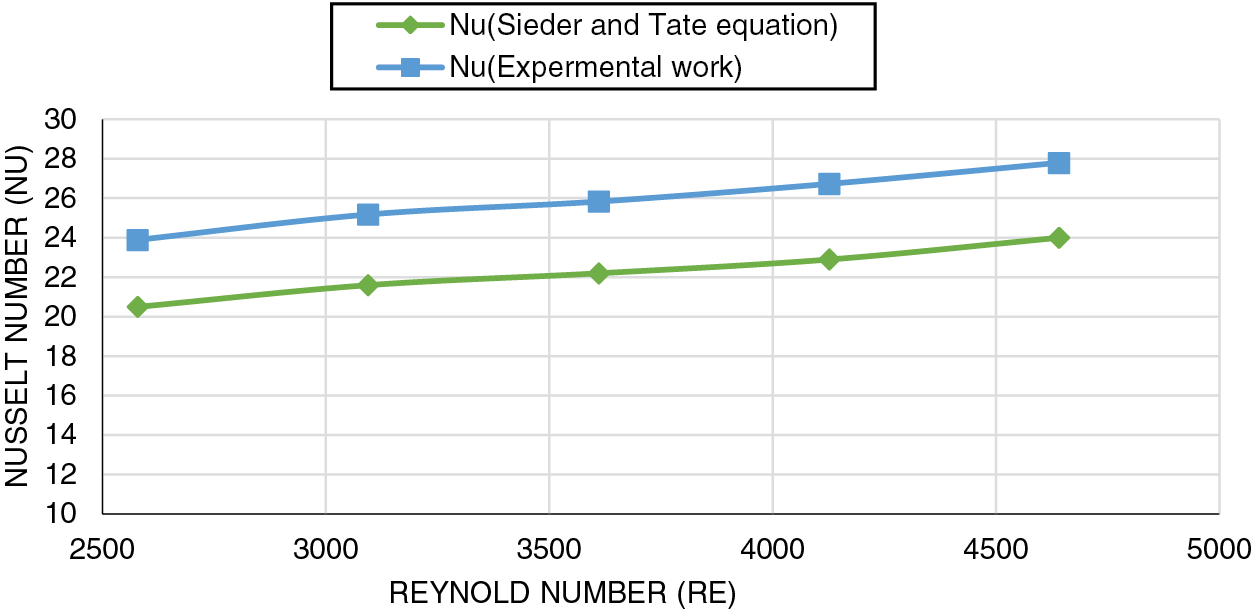
Figure 11: Effective of Reynolds number on a Nusselt number of distilled water with Sieder and Tate equation
3.3.2 Flow Rate Impact on Heat Transfer Coefficient for Samples
The convective heat transfer coefficient was evaluated across five sections with distinct flow rates to minimize experimental setup errors. The variations of the convective heat transfer coefficient as a function of flow rate are illustrated in Fig. 12.
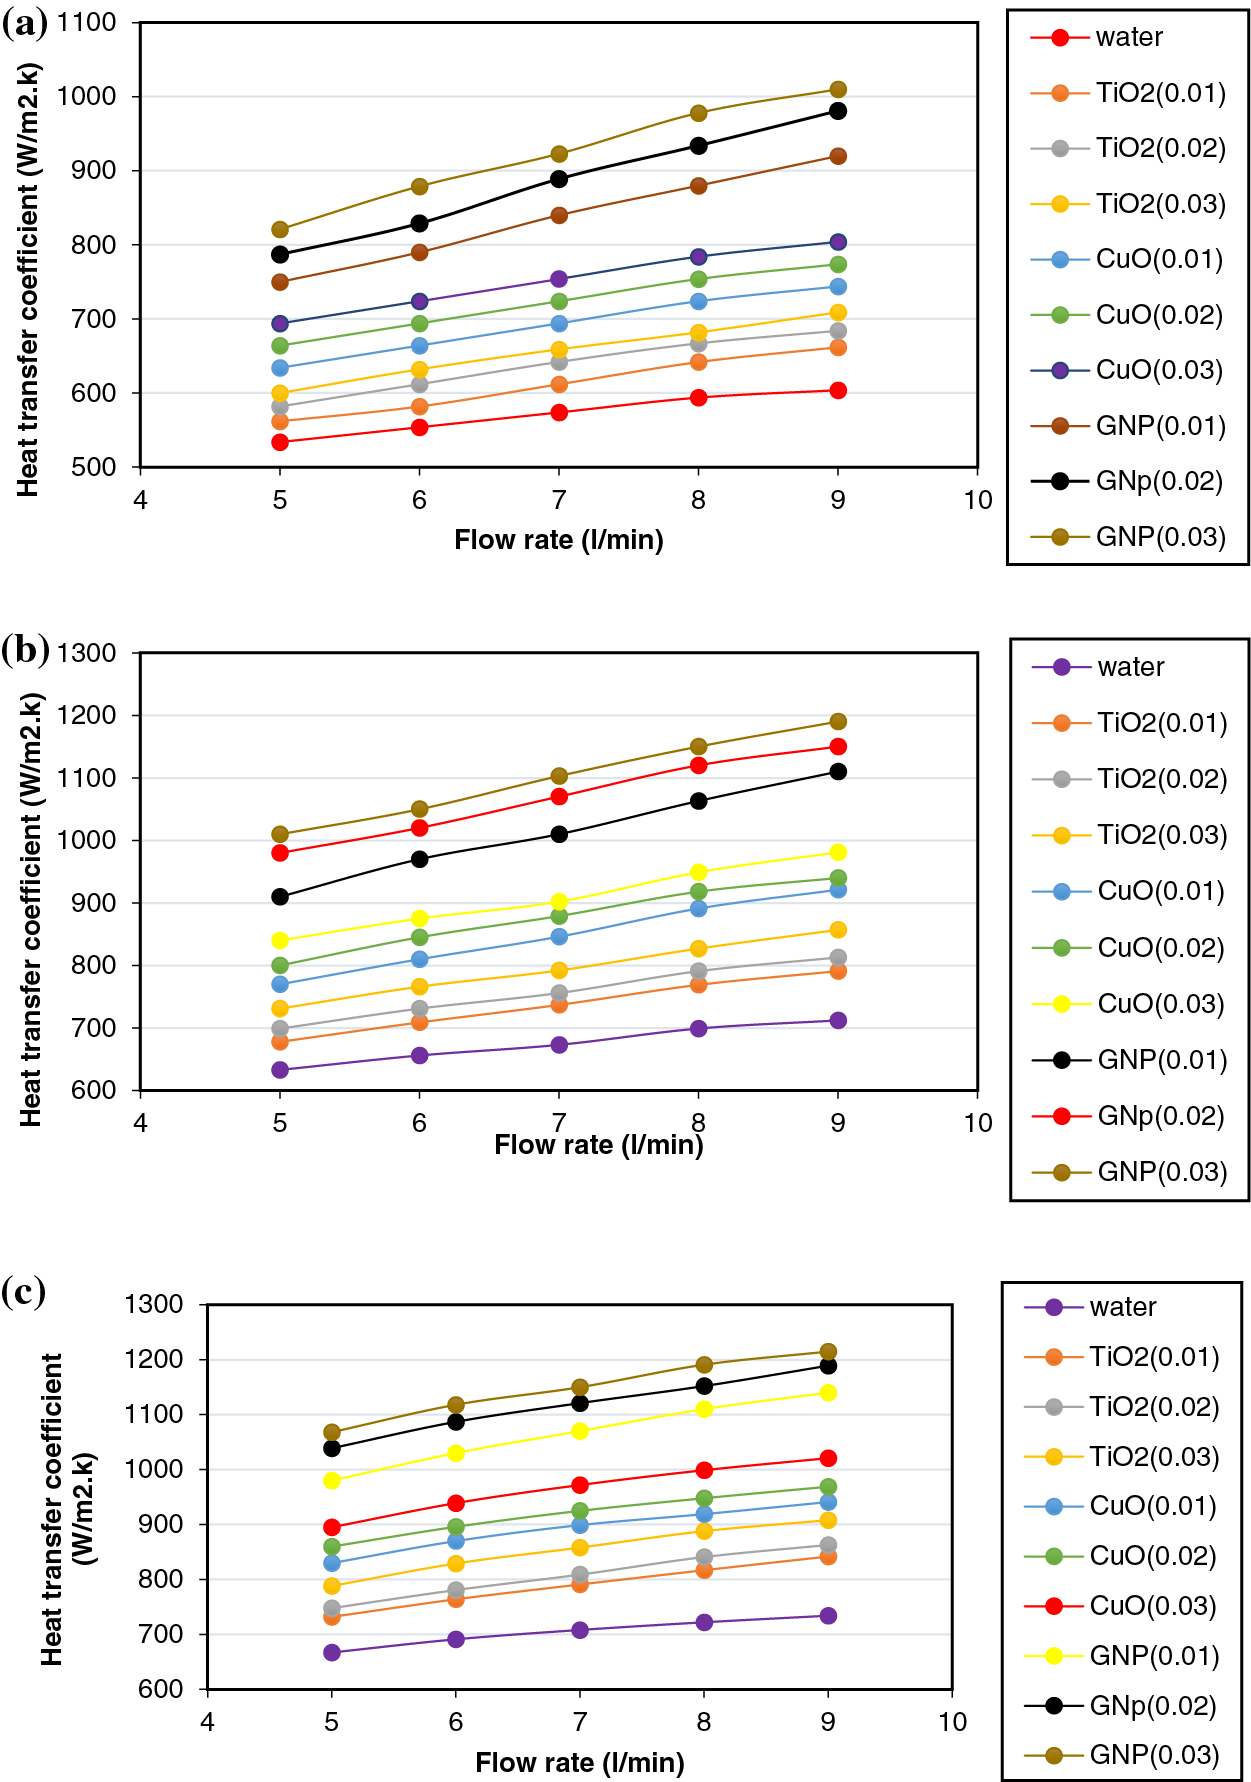
Figure 12: The changes in the convective heat transfer coefficient for TiO2, CuO, and GNP nanofluids with varying flow rates at different temperatures: (a) 25°C, (b) 35°C, and (c) 45°C
Fig. 12a–c depicts the influence of nanofluid concentration and temperature on the convective heat transfer coefficient. During the heat transfer process from the surface to the fluid, the thermal boundary layer undergoes exponential growth with increasing distance from the test section entrance. It is anticipated that the heat transfer coefficients of the samples will surpass those of water. This improvement can be ascribed to various factors such as enhanced thermal conductivity, reduced boundary layer thickness, particle migration, Brownian motion, and shear induction [35].
All research findings indicate that the convective heat transfer coefficient rises with the flow rate, indicating that TiO2, CuO, and GNP nanofluids exhibit superior heat transfer capabilities compared to pure water. This enhanced heat transfer is attributed to a thinner thermal boundary layer, which is associated with higher flow rates, improved thermal conductivity, and reduced thermal resistance between the flowing nanofluid and the inner wall surface temperature of the tube. Specifically, at a flow rate of 9 L/min and a temperature of 45°C, the convective heat transfer coefficient increases by up to 23%, 39%, and 68% for TiO2, CuO, and GNP, respectively.
Furthermore, the convective heat transfer coefficient is significantly influenced by factors like the Brownian motion of particles, thermo-physical properties, and specific surface area. The improved heat convection seen in GNP nanofluids is credited to the heightened thermal conductivity of the nanofluid and the stochastic movement of GNP nanoparticles.
3.3.3 Impact of Reynolds Number on Samples’ Local Heat Transfer Coefficient
The investigation focused on heat transfer coefficients of TiO2, CuO, and GNP nanofluids under isoflux thermal conditions at temperatures of 25°C, 35°C, and 45°C for turbulent flow regimes with varying volume fractions (0.01, 0.02, and 0.03). The variations of heat transfer coefficients with Reynolds numbers are depicted in Fig. 13 under different experimental conditions. The results reveal that the heat transfer coefficients increase with rising temperature and nanoparticle concentration. Notably, the highest volume fraction of GNP nanoparticles, 0.03 vol.%, led to a remarkable 53% improvement in the heat transfer coefficient at 2579 Reynolds number.
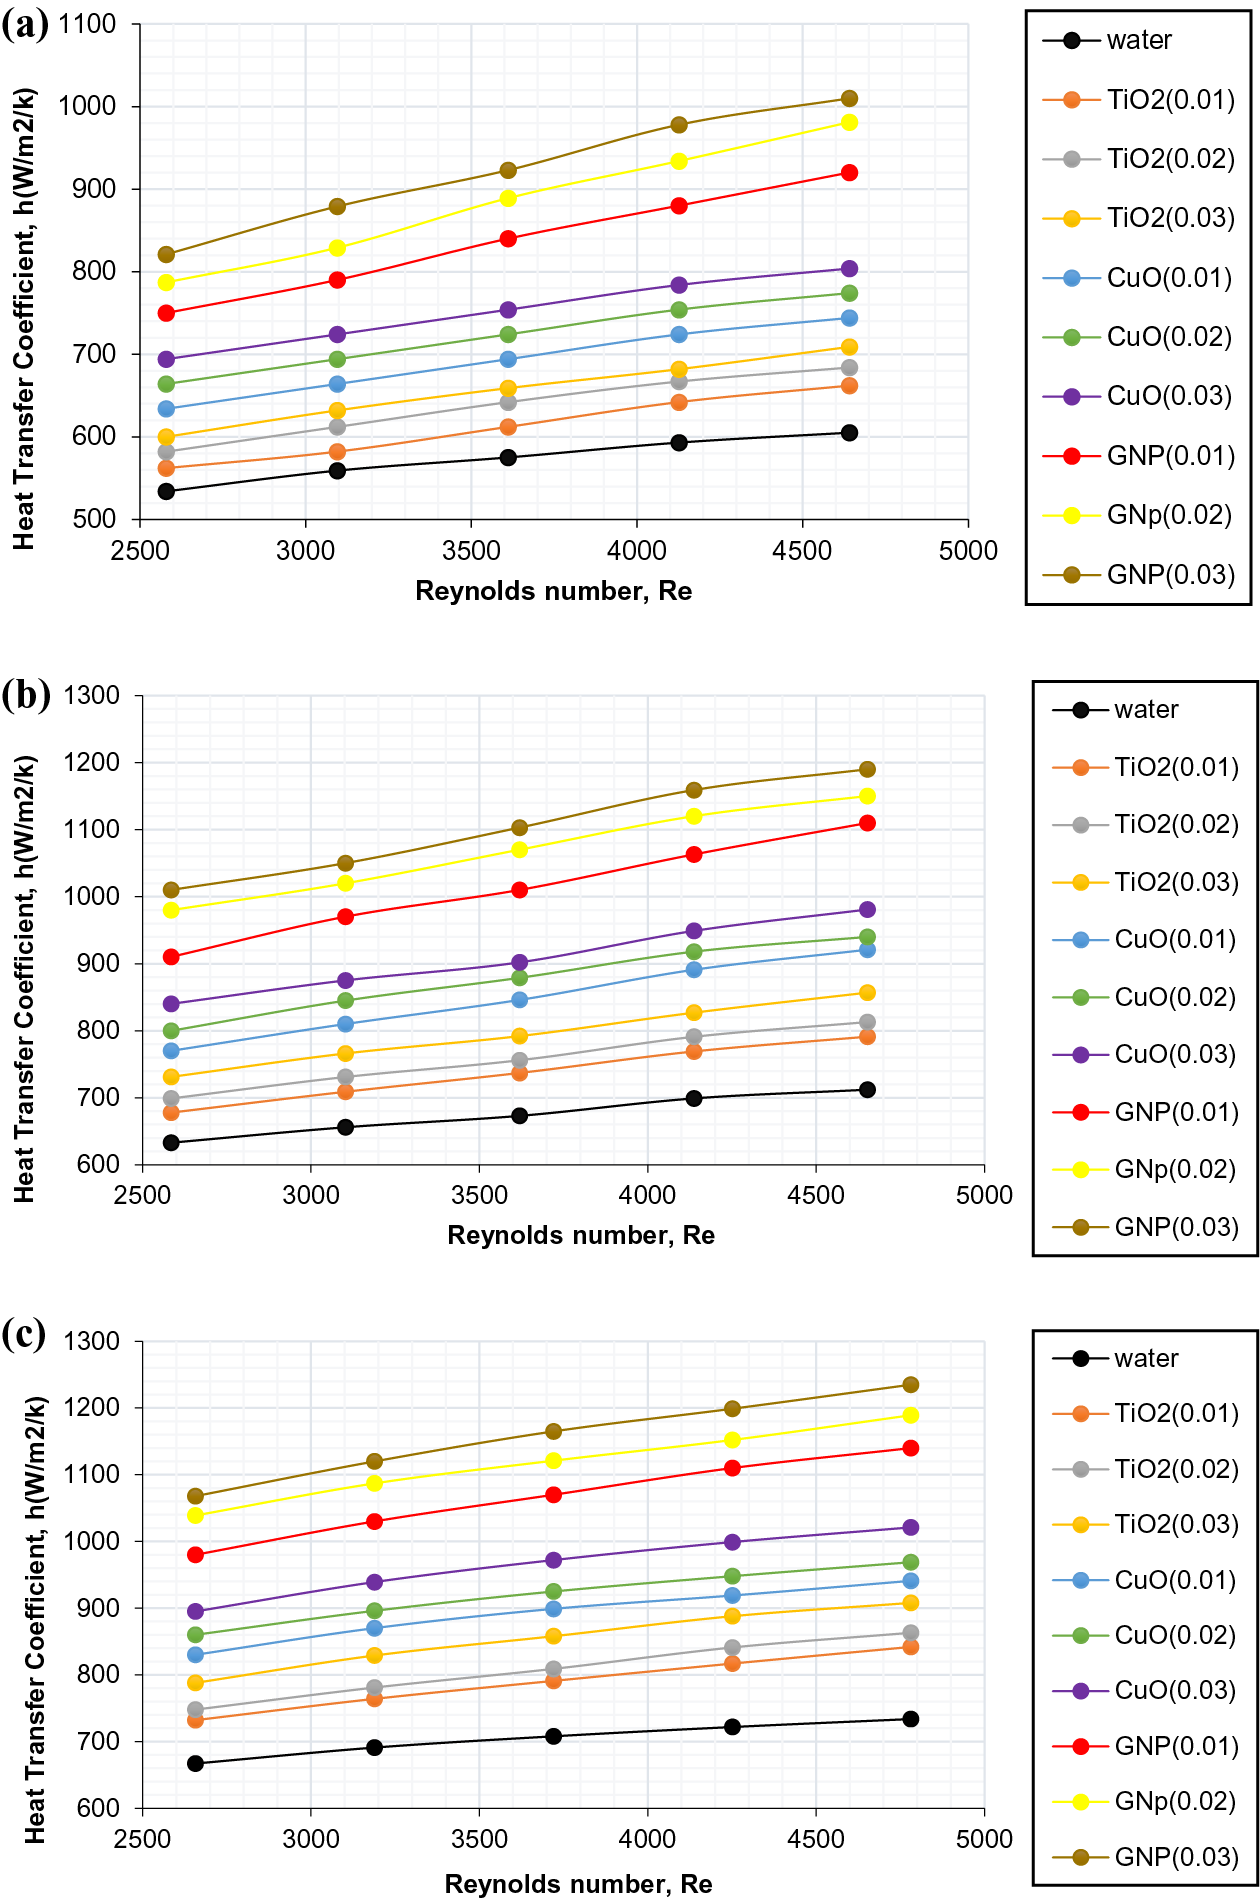
Figure 13: Heat transfer coefficient variation for TiO2,CuO, and GNP nanofluids with Reynold number for different temperature (a) 25°C, (b) 35°C, and (c) 45°C
3.3.4 Effect of Average Nusselt Number
Fig. 14 depicts a connection between the Nusselt number and Reynolds number for various concentrations of TiO2/water, CuO/water, GNP/water nanofluids. It’s been noted that when the Reynolds number rises, so does the Nusselt number. Conversely, an increase in the concentration of nanofluids leads to a decrease in the Nusselt number. This behavior can be attributed to the fact that while the heat transfer coefficient increases with higher concentration, the increase in thermal conductivity is relatively more significant. For instance, for a 0.03% concentration of TiO2-water nanofluid, the thermal conductivity shows a 14.4% increase compared to the base fluid. However, for the same concentration, the heat transfer coefficient only exhibits a 12.3% increase over the base fluid at a Reynolds number of 3538. This trend is also observed for CuO/water and GNP/water nanofluids. This is similar to what Alosious et al. explained [36]. Accordingly, the results show that the greatest Nusselt number at 45C with 0.03% volume concentration for nanofluids GNP/warte, CuO/water and TiO2/water, where the values were 17.8%, 11.09%, 8.11%, respectively.
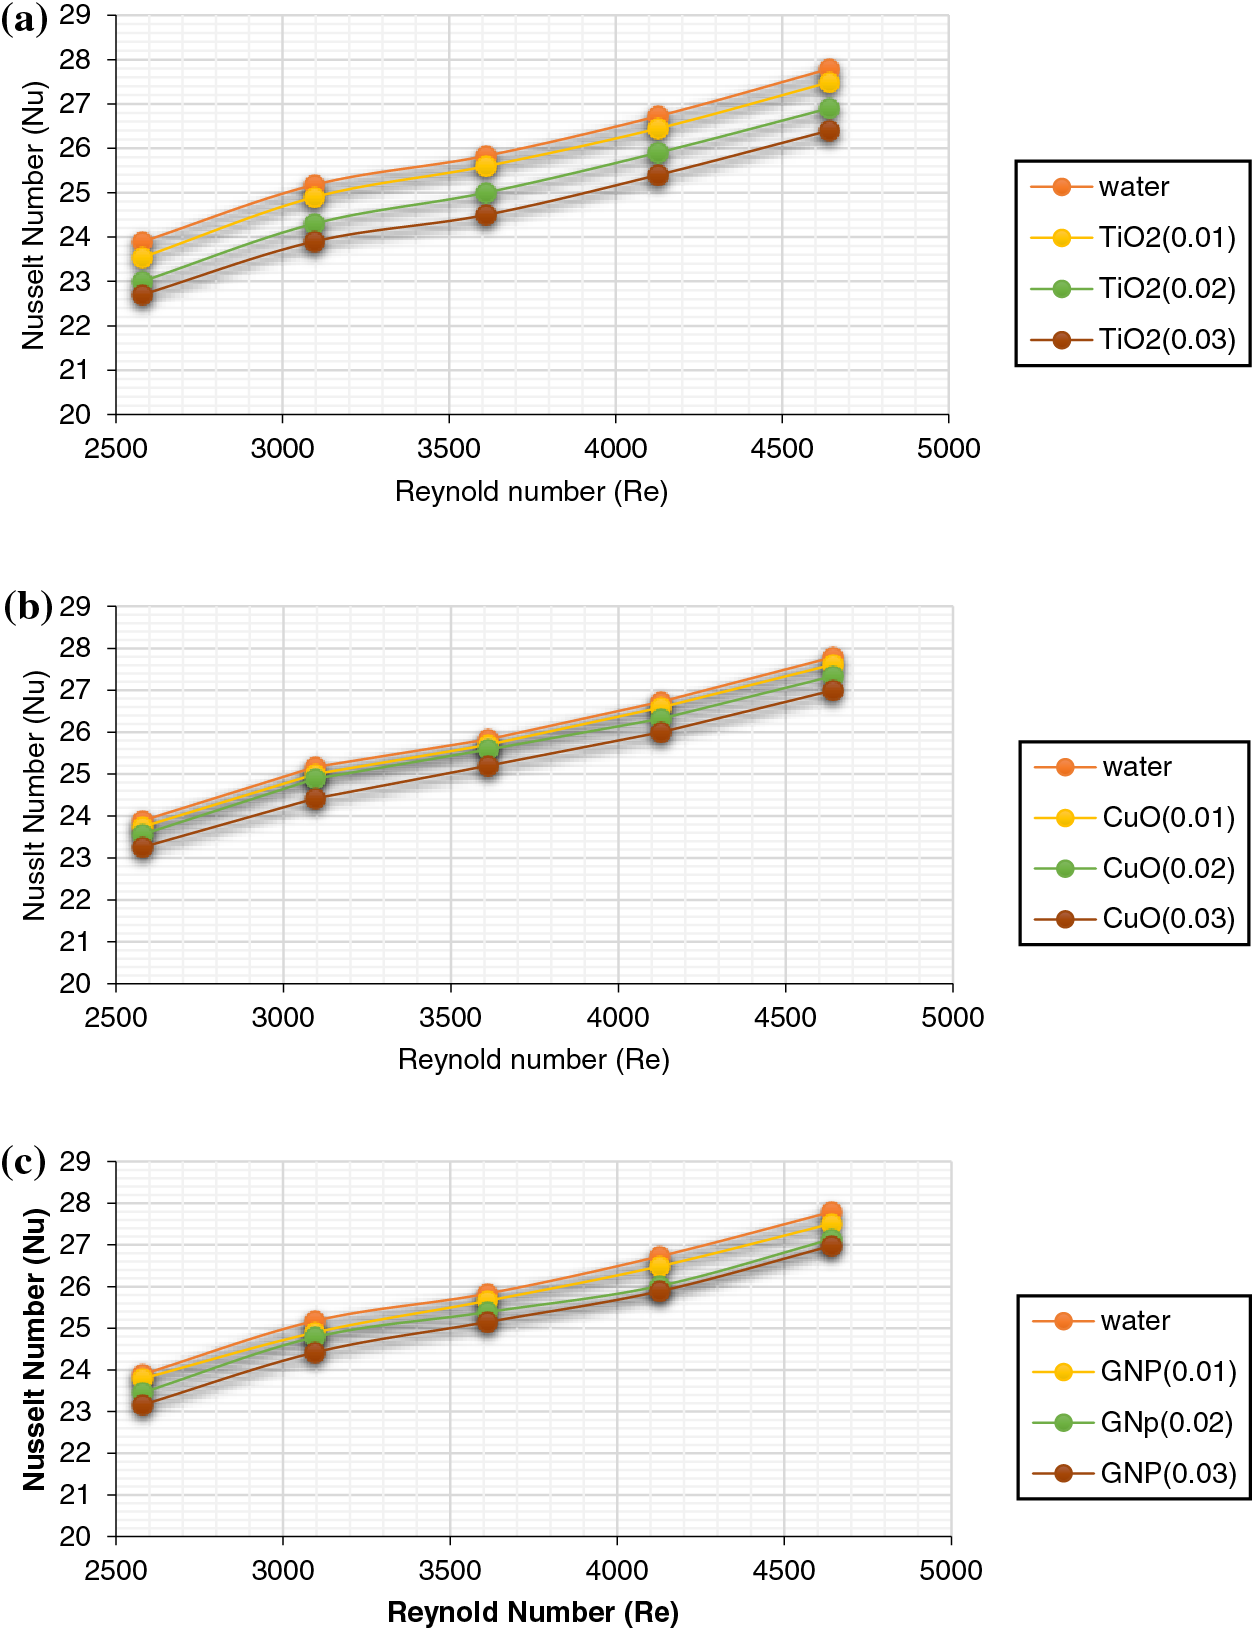
Figure 14: Nusselt number variation with Reynolds number for various nanofluid concentrations: (a) TiO2/water, (b) CuO/water, and (c) GNP/water
Fig. 15 illustrates the pressure drop rates of nanofluids containing three different types of nanoparticles (TiO2, CuO, and GNP) with varying volume fractions. Observations indicate that the pressure drop of nanofluids rises with increasing Reynolds number or flow rate. Nanofluids typically demonstrate higher pressure drops compared to pure water, a phenomenon attributed to the elevated friction factor associated with nanofluids. The primary reason for the increase in the friction factor is the elevation in the nanofluid’s viscosity caused by the presence of nanoparticles. As the nanoparticle concentration escalates, the working fluid’s viscosity increases, resulting in higher friction losses. Furthermore, at higher Reynolds numbers, the pressure drop of nanofluids is further amplified due to the augmented velocity. A significant correlation exists between the pressure drop and the required pumping power for nanofluids. Notably, there is a direct relationship between nanoparticle concentration and pressure drop. As the concentration of nanoparticles in the nanofluid rises, the pressure drop also increases proportionally.
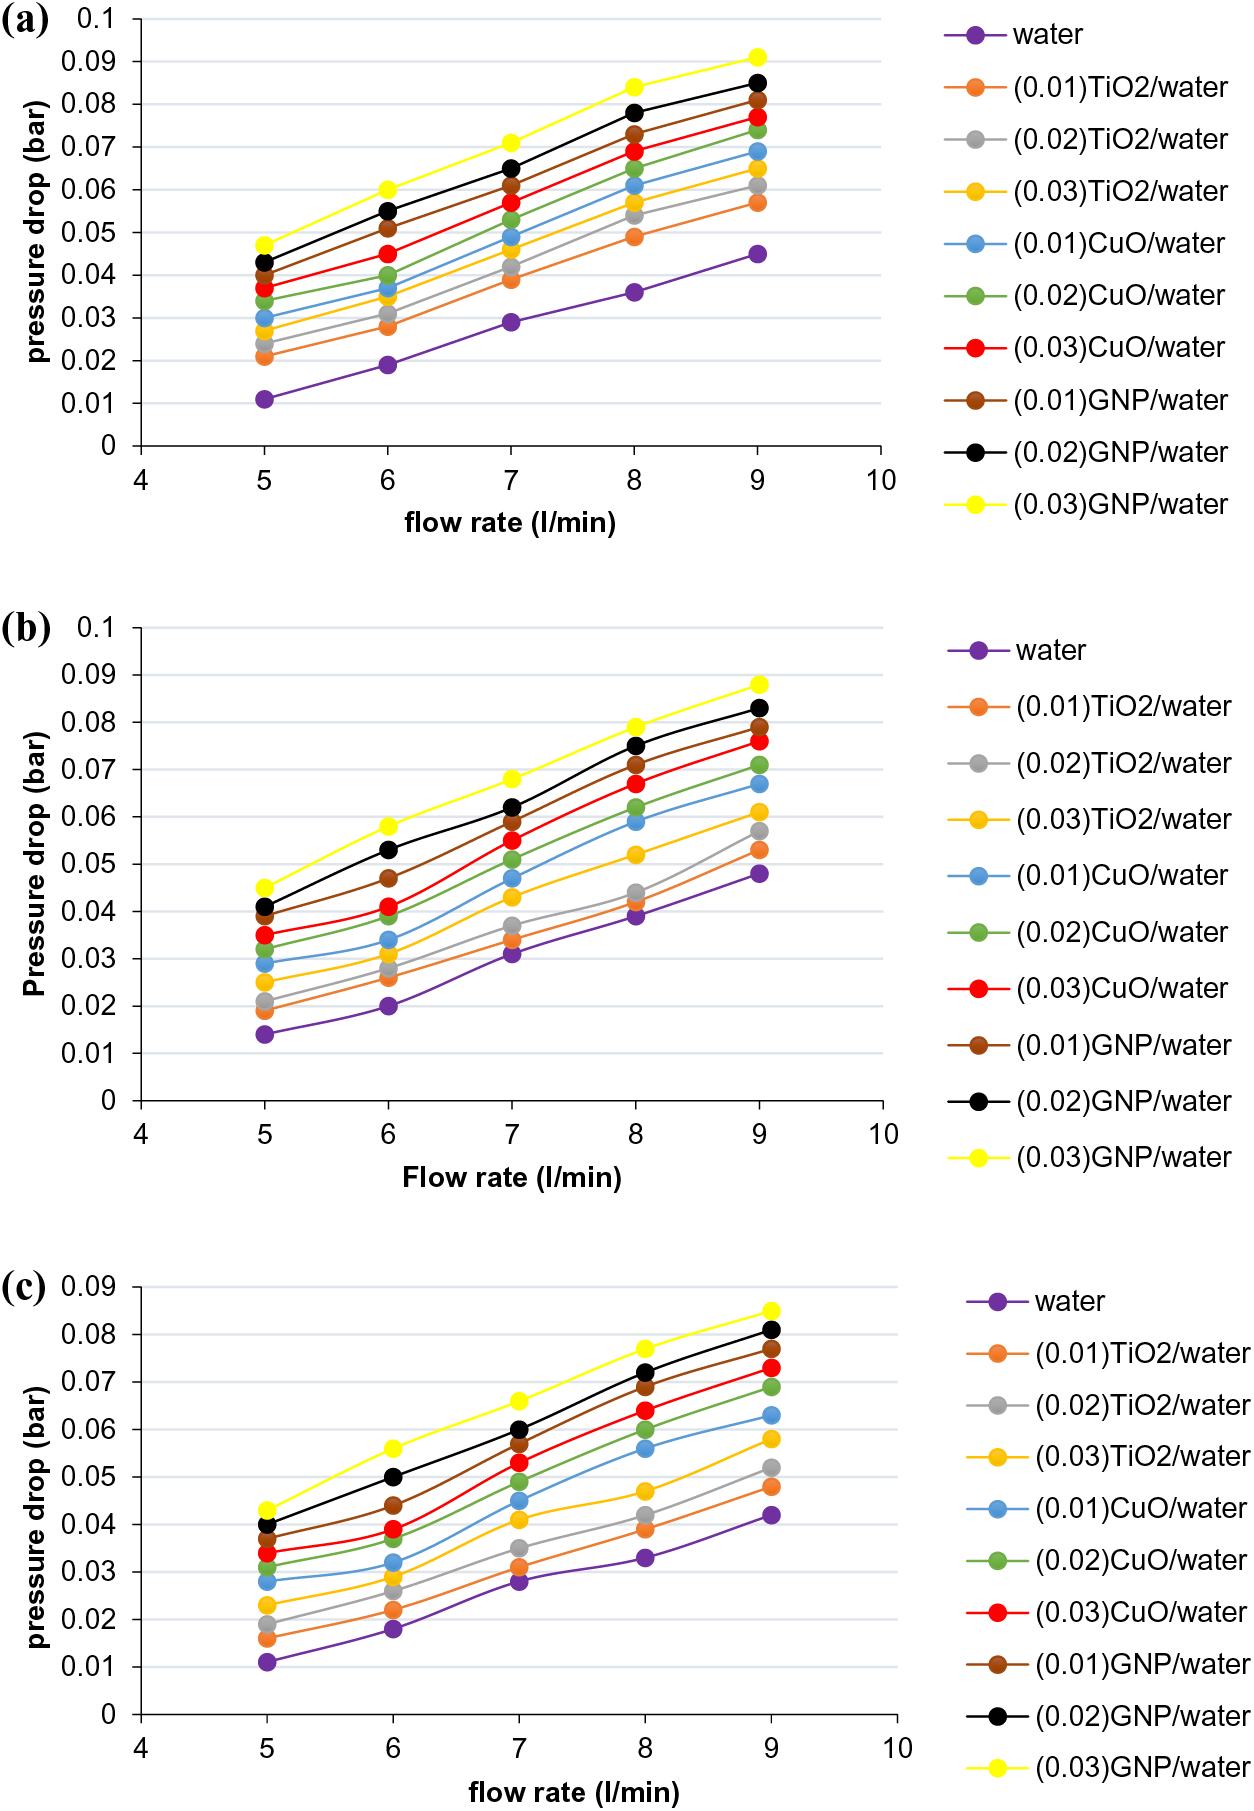
Figure 15: The impact of different flow rates and nanoparticle concentrations on the pressure drop at three different input temperatures: (a) 25°C, (b) 35°C, and (c) 45°C
According to Fig. 16, a friction factor of the nanofluid in turbulent flow regime is depicted. Compared with a base fluid. It is noted that the nanofluids’ friction factor is observed to have higher values. Moreover, it increases with increasing concentrations of nanoparticles and decreases with increasing flow rate and Reynold number. These findings align with the results reported by Alklaibi et al. [26].
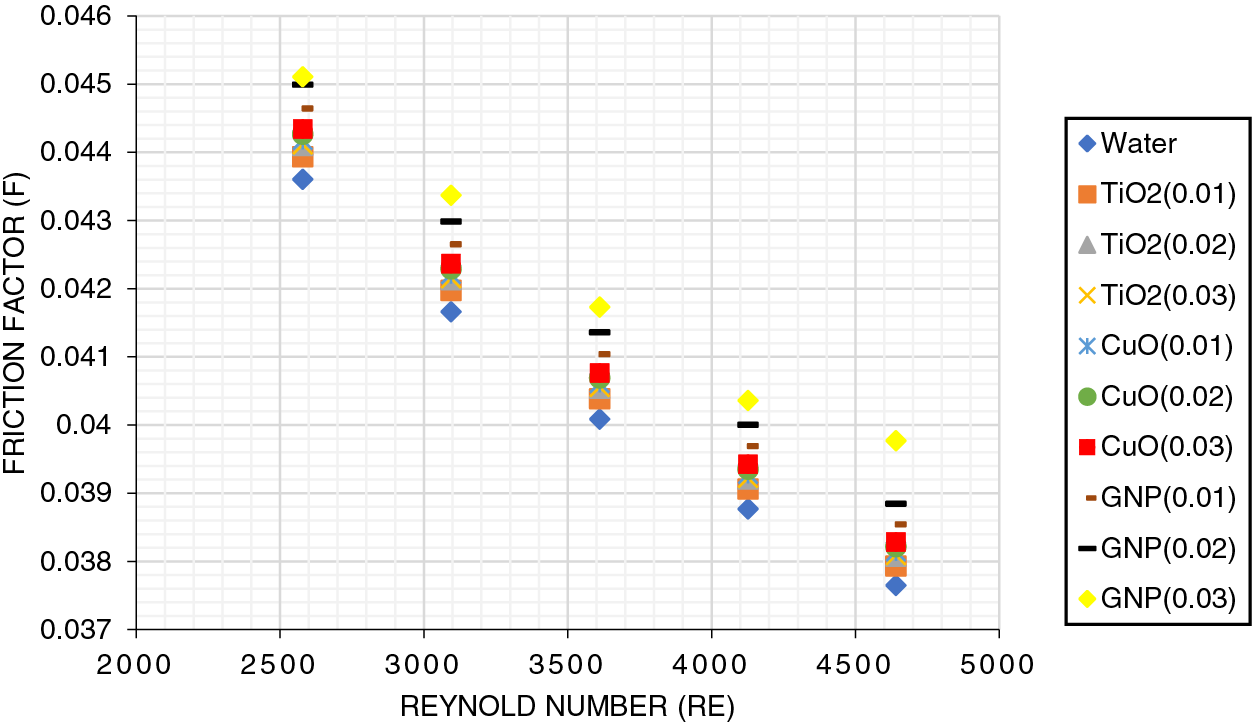
Figure 16: Friction factor of base fluid and nanofluid at inlet temperature 25°C
In this study, The heat transfer experiments were conducted in a copper tube utilizing three different kinds of nanofluids (
1. The SEM tests conducted on the three nanoparticles (TiO2, CuO, and GNP) demonstrated that the particles possessed a uniform structure and high purity, and the average diameter of each of the particles was 50, 30, and 8 nm, respectively.
2. The thermal performance improvement of nanofluids was found to be 23%, 39%, and 68% for TiO2, CuO, and GNP, respectively. These improvements are attributed to the augmented thermal conductivity of the nanofluid, as well as flow rate and heat flux.
3. Temperature had a significant impact on the viscosity of the nanofluids. It decreased at higher temperatures, which increase of 7.5%, 8.7%, and 13% for TiO2, CuO, and GNP, respectively, compared to distilled water.
4. As the Reynolds number and heat flux grew, so did the Nusselt number. For TiO2, CuO, and GNP, the Nusselt number increased by up to 3%, 7%, and 12%, respectively, at 0.03 vol.% concentration with 5 L/min flow rate.
5. At the same conditions, when the concentration was (0.03 vol.%) and the flow rate was (5 L/min), the nanofluid’s pressure drop rose by 1.5%, 18.7%, and 23.3% for TiO2, CuO, and GNP, respectively, comparing with a base fluid.
In summary, thermal performance is enhanced by the use of nanofluids in heat transfer applications.
Suggestions for future works:
1. Advances in nanofluid examination can be expanded and enriched by exploring new nanomaterials, mixing different kinds of nanoparticles, and developing innovative hybrid nanofluids.
2. Combining nanoparticles of higher thermal conductivity with lower thermal conductivity particles such as TiO2-GNP.
3. Increasing the concentration of nanoparticles leads to a significant improvement in the thermal properties of nanofluids. Increasing the concentrations leads to a decrease in the stability of the dispersion, so it is necessary to conduct an intensive survey of the a stability of nanofluids and find the ideal concentrations at which they are stable.
Acknowledgement: The authors extend their sincere appreciation to the Department of Chemical Engineering at the University of Technology and Al-Mustaqbal University for their crucial support and provision of research facilities throughout this study. Special thanks are also due to Zahraa W. Hasan for her significant contributions to this manuscript.
Funding Statement: The authors received no specific funding for this study.
Author Contributions: Draft manuscript preparation: Zahraa N. Hussain, Jamal M. Ali, Hasan S. Majdi, Abbas J. Sultan. Study conception and design: Abbas J. Sultan, H. Al-Naseri. Supervision: Jamal M. Ali, Hasan S. Majdi, Abbas J. Sultan. Data collection: Zahraa N. Hussain, Jamal M. Ali. Analysis and interpretation of results: Zahraa N. Hussain, Jamal M. Ali, H. Al-Naseri. The contribution statement: Jamal M. Ali, Hasan S. Majdi, Abbas J. Sultan. Writing—review & editing: Zahraa N. Hussain, Jamal M. Ali, Abbas J. Sultan, Hasan S. Majdi, H. Al-Naseri. All authors reviewed the results and approved the final version of the manuscript.
Availability of Data and Materials: Nanoparticles (TiO2, CuO, and GNP) purchased from (sky spring nanomaterials). The scanning electron microscope (SEM) test was used for characterization analysis at the Department of Materials Research, Ministry of Science and Technology in Baghdad. Heat flux sensor from FluxTeq LLC (model VA24060-6370, Blacksburg, USA). A heater (produced in the USA by HTS/Amptek Company). ComPAQ Heat Flux and Thermocouple Data Acquisition Instrument (FluxTeq LLC, COMPAQ DAQ, VA24060-6370, Blacksburg, USA).
Ethics Approval: Not applicable.
Conflicts of Interest: The authors declare no conflicts of interest to report regarding the present study.
References
1. Narankhishig Z, Ham J, Lee H, Cho H. Convective heat transfer characteristics of nanofluids including the magnetic effect on heat transfer enhancement—a review. Appl Thermal Eng. 2021;193:116987. [Google Scholar]
2. Bakthavatchalam B, Habib K, Saidur R, Saha BB, Irshad K. Comprehensive study on nanofluid and ionanofluid for heat transfer enhancement: a review on current and future perspective. J Mol Liq. 2020;305:112787. doi:10.1016/j.molliq.2020.112787. [Google Scholar] [CrossRef]
3. Elsaid K, Abdelkareem MA, Maghrabie HM, Sayed ET, Wilberforce T, Baroutaji A, et al. Thermophysical properties of graphene-based nanofluids. Int J Thermofluids. 2021;10:100073. [Google Scholar]
4. Choi SUS, Eastman JA. Enhancing thermal conductivity of fluids with nanoparticles. Argonne, IL, USA: Argonne National Lab.(ANL); 1995. [Google Scholar]
5. Aglawe KR, Yadav RK, Thool SB. Preparation, applications and challenges of nanofluids in electronic cooling: a systematic review. Mater Today: Proc. 2020;43(8):366–72. doi:10.1016/j.matpr.2020.11.679. [Google Scholar] [CrossRef]
6. Wole-Osho I, Okonkwo EC, Kavaz D, Abbasoglu S. An experimental investigation into the effect of particle mixture ratio on specific heat capacity and dynamic viscosity of Al2O3-ZnO hybrid nanofluids. Powder Technol. 2020;363(1–2):699–716. doi:10.1016/j.powtec.2020.01.015. [Google Scholar] [CrossRef]
7. Gupta NK, Tiwari AK, Ghosh SK. Heat transfer mechanisms in heat pipes using nanofluids—a review. Exp Therm Fluid Sci. 2018;90:84–100. [Google Scholar]
8. Hozien O, El-Maghlany WM, Sorour MM, Mohamed YS. Experimental study on thermophysical properties of TiO2, ZnO and Ag water base nanofluids. J Mol Liq. 2021;334(9):116128. doi:10.1016/j.molliq.2021.116128. [Google Scholar] [CrossRef]
9. Turgut A, Tavman I, Chirtoc M, Schuchmann HP, Sauter C, Tavman S. Thermal conductivity and viscosity measurements of water-based TiO2 nanofluids. Int J Thermophys. 2009;30(4):1213–26. doi:10.1007/s10765-009-0594-2. [Google Scholar] [CrossRef]
10. Xie H, Wang J, Xi T, Liu Y, Ai F, Wu Q. Thermal conductivity enhancement of suspensions containing nanosized alumina particles. J Appl Phys. 2002;91(7):4568–72. doi:10.1063/1.1454184. [Google Scholar] [CrossRef]
11. Chakraborty S. An investigation on the long-term stability of TiO2 nanofluid. Mater Today: Proc. 2019;11(1):714–8. doi:10.1016/j.matpr.2019.03.032. [Google Scholar] [CrossRef]
12. Karabulut K, Buyruk E, Kilinc F. Experimental and numerical investigation of convection heat transfer in a circular copper tube using graphene oxide nanofluid. J Brazilian Soc Mech Sci Eng. 2020;42(5):1–16. doi:10.1007/s40430-020-02319-0. [Google Scholar] [CrossRef]
13. Gherasim I, Roy G, Nguyen CT, Vo-Ngoc D. Experimental investigation of nanofluids in confined laminar radial flows. Int J Therm Sci. 2009;48(8):1486–93. [Google Scholar]
14. Martinez VA, Vasco DA, Garcia-Herrera CM, Ortega-Aguilera R. Numerical study of TiO2-based nanofluids flow in microchannel heat sinks: effect of the Reynolds number and the microchannel height. Appl Therm Eng. 2019;161:114130. [Google Scholar]
15. Qi C, Luo T, Liu M, Fan F, Yan Y. Experimental study on the flow and heat transfer characteristics of nanofluids in double-tube heat exchangers based on thermal efficiency assessment. Energy Convers Manag. 2019;197:111877. [Google Scholar]
16. Arevalo-Torres B, Lopez-Salinas JL, García-Cuéllar AJ. Experimental study of forced convective heat transfer in a coiled flow inverter using TiO2-water nanofluids. Appl Sci. 2020;10(15):5225. [Google Scholar]
17. Mahmoudi M, Tavakoli MR, Mirsoleimani MA, Gholami A, Salimpour MR. Experimental and numerical investigation on forced convection heat transfer and pressure drop in helically coiled pipes using TiO2/water nanofluid. Int J Refrig. 2017;74:627–43. [Google Scholar]
18. Sivakumar A. Experimental and numerical investigation of forced convective heat transfer coefficient in nanofluids of Al2O3/water and CuO/EG in a serpentine shaped microchannel heat sink. J/IJHT. 2015;33(1):155–60. [Google Scholar]
19. Godson L, Deepak K, Enoch C, Jefferson B, Raja B. Heat transfer characteristics of silver/water nanofluids in a shell and tube heat exchanger. Arch Civ Mech Eng. 2014;14(3):489–96. doi:10.1016/j.acme.2013.08.002. [Google Scholar] [CrossRef]
20. Novoselov KS, Geim AK, Morozov SV, Jiang D, Katsnelson MI, Grigorieva IV, et al. Two-dimensional gas of massless Dirac fermions in graphene. Nature. 2005;438(7065):197–200. doi:10.1038/nature04233. [Google Scholar] [PubMed] [CrossRef]
21. Akhavan-Zanjani H, Saffar-Avval M, Mansourkiaei M, Sharif F, Ahadi M. Experimental investigation of laminar forced convective heat transfer of graphene-water nanofluid inside a circular tube. Int J Therm Sci. 2016;100(4):316–23. doi:10.1016/j.ijthermalsci.2015.10.003. [Google Scholar] [CrossRef]
22. Ranjbarzadeh R, Karimipour A, Afrand M, Isfahani AHM, Shirneshan A. Empirical analysis of heat transfer and friction factor of water/graphene oxide nanofluid flow in turbulent regime through an isothermal pipe. Appl Therm Eng. 2017;126(2):538–47. doi:10.1016/j.applthermaleng.2017.07.189. [Google Scholar] [CrossRef]
23. Solangi KH, Kazi SN, Luhur MR, Badarudin A, Amiri A, Sadri R, et al. A comprehensive review of thermo-physical properties and convective heat transfer to nanofluids. Energy. 2015;89:1065–86. doi:10.1016/j.energy.2015.06.105. [Google Scholar] [CrossRef]
24. Sivakumar A, Alagumurthi N, Senthilvelan T. Experimental investigation of forced convective heat transfer performance in nanofluids of Al2O3/water and CuO/water in a serpentine shaped micro channel heat sink. Heat Mass Transf und Stoffuebertragung. 2016;52(7):1265–74. doi:10.1007/s00231-015-1649-5. [Google Scholar] [CrossRef]
25. Sadeghinezhad E, Togun H, Mehrali M, Nejad PS, Latibari ST, Abdulrazzaq T, et al. An experimental and numerical investigation of heat transfer enhancement for graphene nanoplatelets nanofluids in turbulent flow conditions. Int J Heat Mass Transf. 2015;81(1):41–51. doi:10.1016/j.ijheatmasstransfer.2014.10.006. [Google Scholar] [CrossRef]
26. Alklaibi AM, Mouli KVVC, Sundar LS. Experimental investigation of heat transfer and effectiveness of employing water and ethylene glycol mixture based Fe3O4 nanofluid in a shell and helical coil heat exchanger. Therm Sci Eng Prog. 2023;40(5):101739. doi:10.1016/j.tsep.2023.101739. [Google Scholar] [CrossRef]
27. Pak BC, Cho YI. Hydrodynamic and heat transfer study of dispersed fluids with submicron metallic oxide particles. Exp Heat Transf Int J. 1998;11(2):151–70. doi:10.1080/08916159808946559. [Google Scholar] [CrossRef]
28. Hasan ZW, Sultan AJ, Sabri LS, Ali JM, Salih HG, Majdi HS, et al. Experimental investigation on the impact of tube bundle designs on heat transfer coefficient in gas-solid fluidized bed reactor for Fischer-Tropsch synthesis. Int Commun Heat Mass Transf. 2022;136:106169. doi:10.1016/j.icheatmasstransfer.2022.106169. [Google Scholar] [CrossRef]
29. Raju KSN. Convective heat transfer basics. In: Fluid mechanics, heat transfer, and mass transfer, chemical engineering practice. John Wiley & Sons; 2011. p. 245–70. doi:10.1002/9780470909973. [Google Scholar] [CrossRef]
30. Ho CJ, Wei LC, Li ZW. An experimental investigation of forced convective cooling performance of a microchannel heat sink with Al2O3/water nanofluid. Appl Therm Eng. 2010;30(2–3):96–103. doi:10.1016/j.applthermaleng.2009.07.003. [Google Scholar] [CrossRef]
31. Asadi A, Alarifi IM, Foong LK. An experimental study on characterization, stability and dynamic viscosity of CuO-TiO2/water hybrid nanofluid. J Mol Liq. 2020;307:112987. doi:10.1016/j.molliq.2020.112987. [Google Scholar] [CrossRef]
32. Bhimani VL, Rathod PP, Sorathiya AS. Experimental study of heat transfer enhancement using water based nanofluids as a new coolant for car radiators. Int J Emerg Technol Adv Eng. 2013;3(6):295–302. [Google Scholar]
33. Vajjha RS, Das DK. Specific heat measurement of three nanofluids and development of new correlations. J Heat Trans. 2009;131(7):071601. doi:10.1115/1.3090813. [Google Scholar] [CrossRef]
34. Ebrahimnia-Bajestan E, Charjouei Moghadam M, Niazmand H, Daungthongsuk W, Wongwises S. Experimental and numerical investigation of nanofluids heat transfer characteristics for application in solar heat exchangers. Int J Heat Mass Transf. 2016;92(2):1041–52. doi:10.1016/j.ijheatmasstransfer.2015.08.107. [Google Scholar] [CrossRef]
35. Ding Y, Alias H, Wen D, Williams RA. Heat transfer of aqueous suspensions of carbon nanotubes (CNT nanofluids). Int J Heat Mass Transf. 2006;49(1–2):240–50. doi:10.1016/j.ijheatmasstransfer.2005.07.009. [Google Scholar] [CrossRef]
36. Alosious S, Sarath R, Nair AR, Krishnakumar K. Experimental and numerical study on heat transfer enhancement of flat tube radiator using Al2O3 and CuO nanofluids. Heat Mass Transf und Stoffuebertragung. 2017;53(12):3545–63. doi:10.1007/s00231-017-2061-0. [Google Scholar] [CrossRef]
Cite This Article
 Copyright © 2025 The Author(s). Published by Tech Science Press.
This work is licensed under a Creative Commons Attribution 4.0 International License , which permits unrestricted use, distribution, and reproduction in any medium, provided the original work is properly cited.
 Downloads
 Citation Tools