
 Submit a Paper
 Propose a Special lssue
 Open Access
ARTICLE

Numerical Study of Cavitating Flows around a Hydrofoil with Deep Analysis of Vorticity Effects
1 Xichang Satellite Launch Center, Wenchang, 571300, China
2 College of Water Resources and Civil Engineering, China Agricultural University, Beijing, 100083, China
* Corresponding Author: Hao Wang. Email:
Fluid Dynamics & Materials Processing 2025, 21(1), 179-204. https://doi.org/10.32604/fdmp.2024.056228
Received 17 July 2024; Accepted 24 September 2024; Issue published 24 January 2025
 View Full Text
 Download PDF
Abstract
This paper aims to numerically explore the characteristics of unsteady cavitating flow around a NACA0015 hydrofoil, with a focus on vorticity attributes. The simulation utilizes a homogeneous mixture model coupled with a filter-based density correction turbulence model and a modified Zwart cavitation model. The study investigates the dynamic cavitation features of the thermal fluid around the hydrofoil at various incoming flow velocities. It systematically elucidates the evolution of cavitation and vortex dynamics corresponding to each velocity condition. The results indicate that with increasing incoming flow velocity, distinct cavitation processes take place in the flow field.Keywords
Nomenclature
| | Density |
| t | Time |
| x | Space variable |
| u | Velocity |
| | Dynamic viscosity |
| Cpm | Specific heat of mixture phase |
| Cpl | Specific heat of liquid phase |
| Cpv | Specific heat of vapor phase |
| T | Temperature |
| | Thermal conductivity |
| L | Latent heat |
| | Condensation rate |
| | Evaporation rate |
| | Volume fraction |
| k | Turbulent kinetic energy |
| | Turbulent eddy dissipation |
| | Filter size |
| n | Exponential coefficient |
| | Single spherical bubble radius |
| | Saturated vapor pressure |
| p | Pressure |
| | Vorticity |
| V | Volume |
| c | Chord length |
| Cp | Pressure coefficient |
| | Cavitation number |
| Subscripts | |
| l | Liquid phase |
| v | Vapor phase |
| | Reference |
| m | Mixture phase |
| i,j,k | Direction of the Cartesian coordinates |
| tur | Turbulence |
| out | Outlet |
Cavitation is the phenomenon of vapor cavities forming in a liquid where the pressure is lower than the saturated vapor pressure [1]. The cavitation process involves phase changes and various complex physical phenomena, including unsteady characteristics [2]. These unsteady features of cavitation are primarily responsible for the hydrodynamic load [3], as well as noise [4] and vibration [5] associated with hydraulic machinery [6]. The unsteady development process of cavitation phenomena is closely related to vortex dynamics [7]. Cavitation generation and development lead to complex vortex structures [8], intensifying the turbulence of the flow field [9] and complicating the interaction between turbulence and cavitation [10].
In recent years, the interaction between the evolution process of vortex structures in cavitation flow fields and cavitation development has become a hot research area for scholars. Szantyr et al. [11] conducted experimental and numerical investigations on tip vortex cavitation. The accuracy of Computational Fluid Dynamics (CFD) predictions heavily relies on the chosen turbulence model, cavitation model, and mesh distribution around the tip region. Tan et al. [12] examined the impact of large-scale cavitating vortical structures on the performance breakdown of an axial water-jet pump. Their observations illustrate that the interaction between the tip leakage vortex (TLV) and the trailing edge of attached cavitation near the rotor blade tip is crucial in the processes leading to breakdown. Wang et al. [13] studied ventilated cavitating flow structures, focusing particularly on vortex shedding dynamics. Their findings reveal two main categories of flow patterns: structures primarily characterized by vortex shedding and relatively stable structures. Liu et al. [14] experimentally investigated flow-induced vibration in cavitating flow around a flexible hydrofoil. They identified two primary shedding mechanisms for cloud cavitation: the re-entrant jet and shockwave mechanisms. Zhang et al. [15] explored the cavitating vortical structures surrounding a Tulin hydrofoil. They utilized Lagrangian Coherent Structures (LCS) to examine the formation, development, and collapse of vortex cavitation patterns. Ji et al. [16] conducted a numerical study investigating cavitation shedding dynamics around a twisted hydrofoil, with a focus on cavitation-vortex interaction. The predicted three-dimensional cavity structures and shedding frequency closely aligned with experimental observations. Additionally, they analyzed three types of flow behavior along the suction side of the twisted hydrofoil. Chen et al. [17] explored the interaction between cavitation and vortices, with a specific focus on the multistage shedding process. They also employed the Liutex method to examine the intricate details of the vortex structure during both primary and secondary cavity shedding processes, particularly emphasizing the formation and development of the U-shaped structure. Ullas et al. [9] investigated internal turbulent cavitating flow using a dynamic cavitation model. Their study shows that the combination of Detached Eddy Simulation (DES) and the Dynamic Cavitation Model (DCM) is the most suitable approach for predicting turbulent cavitating flows. De Giorgi et al. [18] presented data on cavitating flow around a hydrofoil. In summary, the vortex dynamic characteristics in cavitation flow have increasingly gained attention in cavitation research. However, the above studies overlook the analysis of the unsteady characteristics of typical cavitation flow from the perspective of vorticity transport.
Recently, new research findings have emerged supporting the influence of thermodynamic effects on cavitation performance and vorticity characteristics. Ge et al. [19] investigated the thermodynamic effect on cavitation dynamics in a venturi channel, analyzing the thermal transition and the variation in cavity length. Xu et al. [20] investigated the thermodynamic effects on attached cavitation and cavitation-turbulence interaction around a hydrofoil. They examined the coupling mechanism between thermal effects, vorticity, and cavitation. Yu et al. [21] analyzed the interactions between vorticity and local entropy production rate in a two-phase cavitating flow. Shen et al. [22] studied the correlation between hydrodynamic forces and cavity evolution in thermo-sensitive cavitating flow considering the local compressibility. Le et al. [23] investigated thermodynamic cavitation suppression in the laminar vortex flow over a circular cylinder, observing suppression at a relatively low temperature. Liu et al. [24] investigated transient liquid nitrogen cavitating flows, analyzing in detail the interactions between entropy characteristics, vorticity, and force coefficients.
Although the dynamic characteristics of vortices in cavitating flow have been widely studied in recent years, the thermodynamic effects on cavitation performance and vorticity characteristics are still not well understood. Additionally, the cavitating flow around a hydrofoil under different incoming flow velocities, considering thermodynamic effects, has not been fully investigated. In this study, the vortex structure of the unsteady cavitation flow field around the NACA0015 hydrofoil at different incoming flow velocities was numerically analyzed. The relationship between the unsteady cavitation phenomenon and the vortex structure around the hydrofoil was examined. Additionally, the vortex transport equation was introduced to analyze the influence of cavitation on vortex structure development. The objective of this work is to shed light on unsteady cavitating flow and corresponding vorticity characteristics under different velocities, considering thermodynamic effects.
For the homogeneous mixture model, the governing equations for mass, momentum, energy conservation, and mass transport are expressed as follows:
In the formula,
2.2 Density Correction Turbulence Model
The selection of an appropriate turbulence model is essential for precise predictions of cavitating flow. Conventional two-equation turbulence models often exhibit a tendency to overestimate turbulent eddy viscosity within the cavity region, thereby impeding its proper evolution. In this study, a filter-based density correction model (FBDCM) is adopted to capture the turbulence attributes accurately. This model segments the flow field into regions based on the mixing density and subsequently adjusts the turbulent viscosity accordingly. The FBDCM turbulence model is introduced herein as follows:
where
2.3 Modified ZGB Cavitation Model
Isothermal cavitation models have been developed for liquids at room temperatures, disregarding the thermodynamic impacts during cavitation. However, for thermosensitive fluids like fluoroketone, these thermodynamic effects are significant and cannot be disregarded. To address this, modifications have been made to the Zwart cavitation model to account for the influence of thermodynamic effects on cavitating flow. The adjusted evaporation and condensation source terms are presented below:
where
where
2.4 Vorticity Transport Equation
The interplay between thermodynamic effects and compressibility in thermo-sensitive cavitating flow is tightly connected with each other. This paper endeavors to unveil the correlation between the unstable evolution of cavitation, vorticity, and thermo-dynamic effects by employing the vorticity transport equation.
The expression on the left-hand side (LHS) of the equation signifies the rate at which vorticity changes. Conversely, the terms on the right-hand side (RHS) denote various contributing factors: the vortex stretching term (VST), the vortex dilatation term (VDT), the baroclinic torque term (BTT), and the viscous diffusion term (VIS). Specifically, the vortex stretching term elucidates the bending and elongation of the vortex due to velocity gradients. Meanwhile, the vortex dilatation term encapsulates the expansion and contraction of fluid volume, showcasing the impact of fluid compressibility on vorticity. The baroclinic torque term characterizes the effect arising from the misalignment between pressure and density gradients. Additionally, the viscous diffusion of vorticity delineates variations in the vortex due to viscous diffusion. In scenarios characterized by high Reynolds numbers, the viscous force minimally influences the flow field. Consequently, the magnitude of the viscous diffusion term pales in comparison to the other three terms, rendering it negligible.
Kelly [25] conducted a series of experiments to analyze the influence of thermodynamic effects on cavitating flow dynamics. This simulation is based on Kelly’s experimental data and physical model. The hydrofoil has a chord length of C = 50.8 mm, with the angle of attack
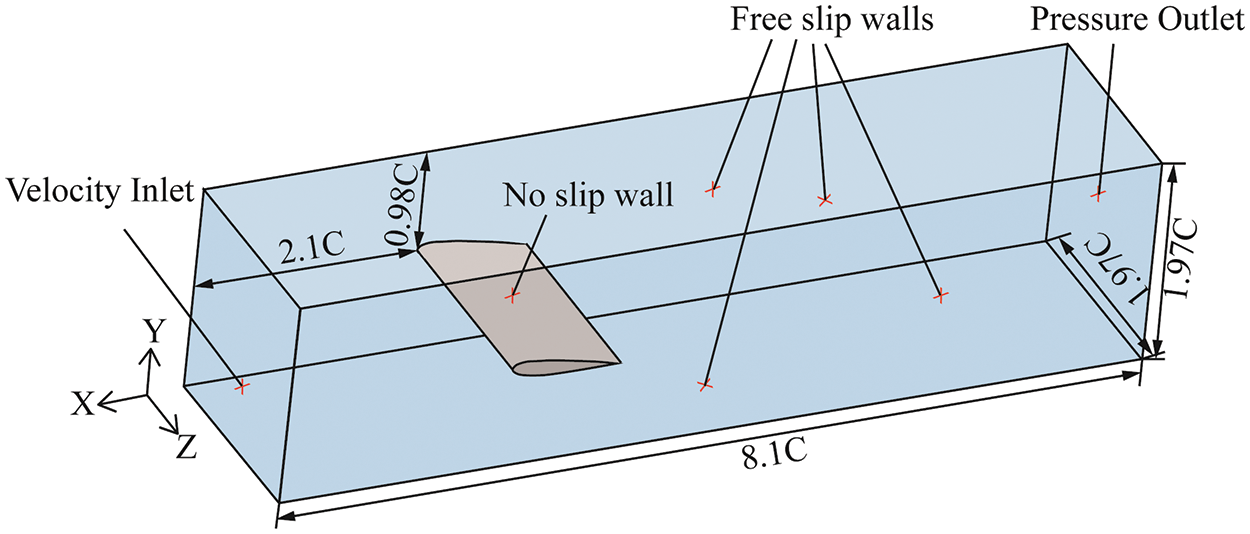
Figure 1: Computational domain and boundary conditions
The cavitation number is defined as follows:
The lift and drag coefficients are defined as follows:
where
This study uses a hexahedral structural mesh generated with ANSYS ICEM. The mesh distribution around the hydrofoil is illustrated in Fig. 2, with refinement applied to ensure accuracy. Three mesh sets—Grid 1, Grid 2, and Grid 3—are used for the mesh independence study, containing 1.837, 2.713, and 4.158 million total grids, respectively. The lift and drag coefficients are analyzed to assess mesh independence. Based on the grid independence analysis, the lift and drag coefficients of Grid 2 and Grid 3 show minimal differences and remain essentially unchanged. Therefore, Grid 2 is selected for subsequent numerical calculations and analysis.
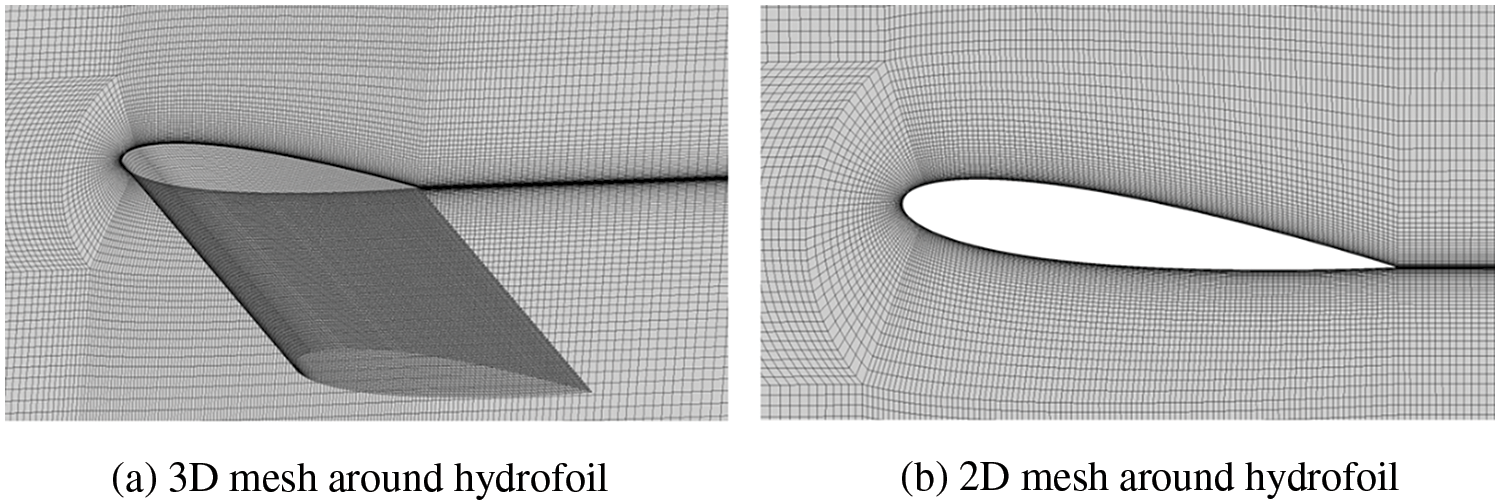
Figure 2: Mesh distribution around the hydrofoil
The pressure coefficient
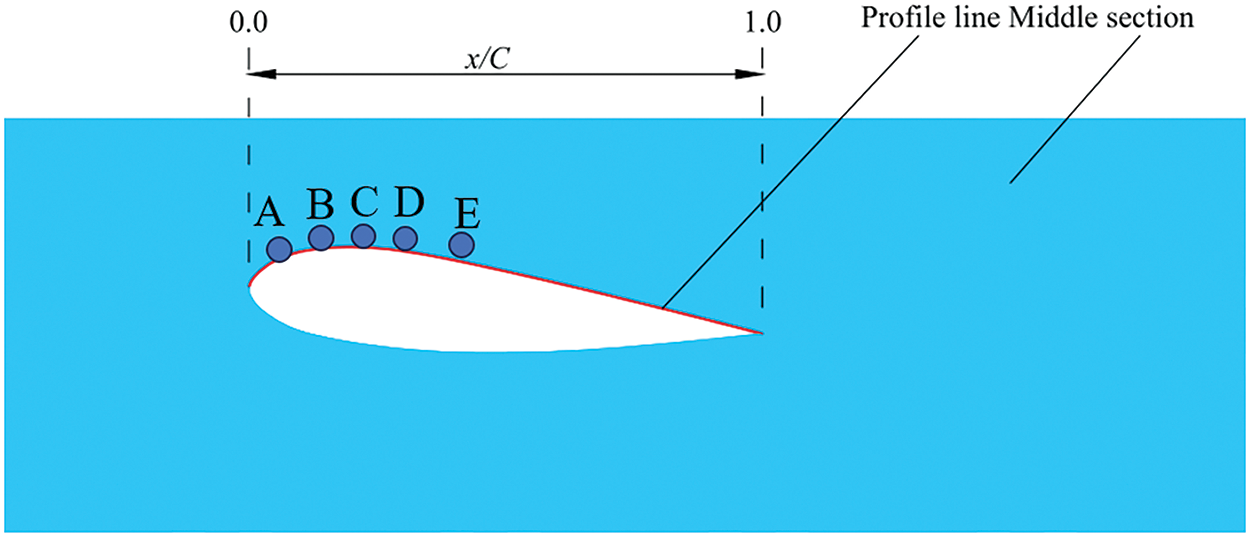
Figure 3: Schematic illustration of the profile line along the suction surface of the hydrofoil
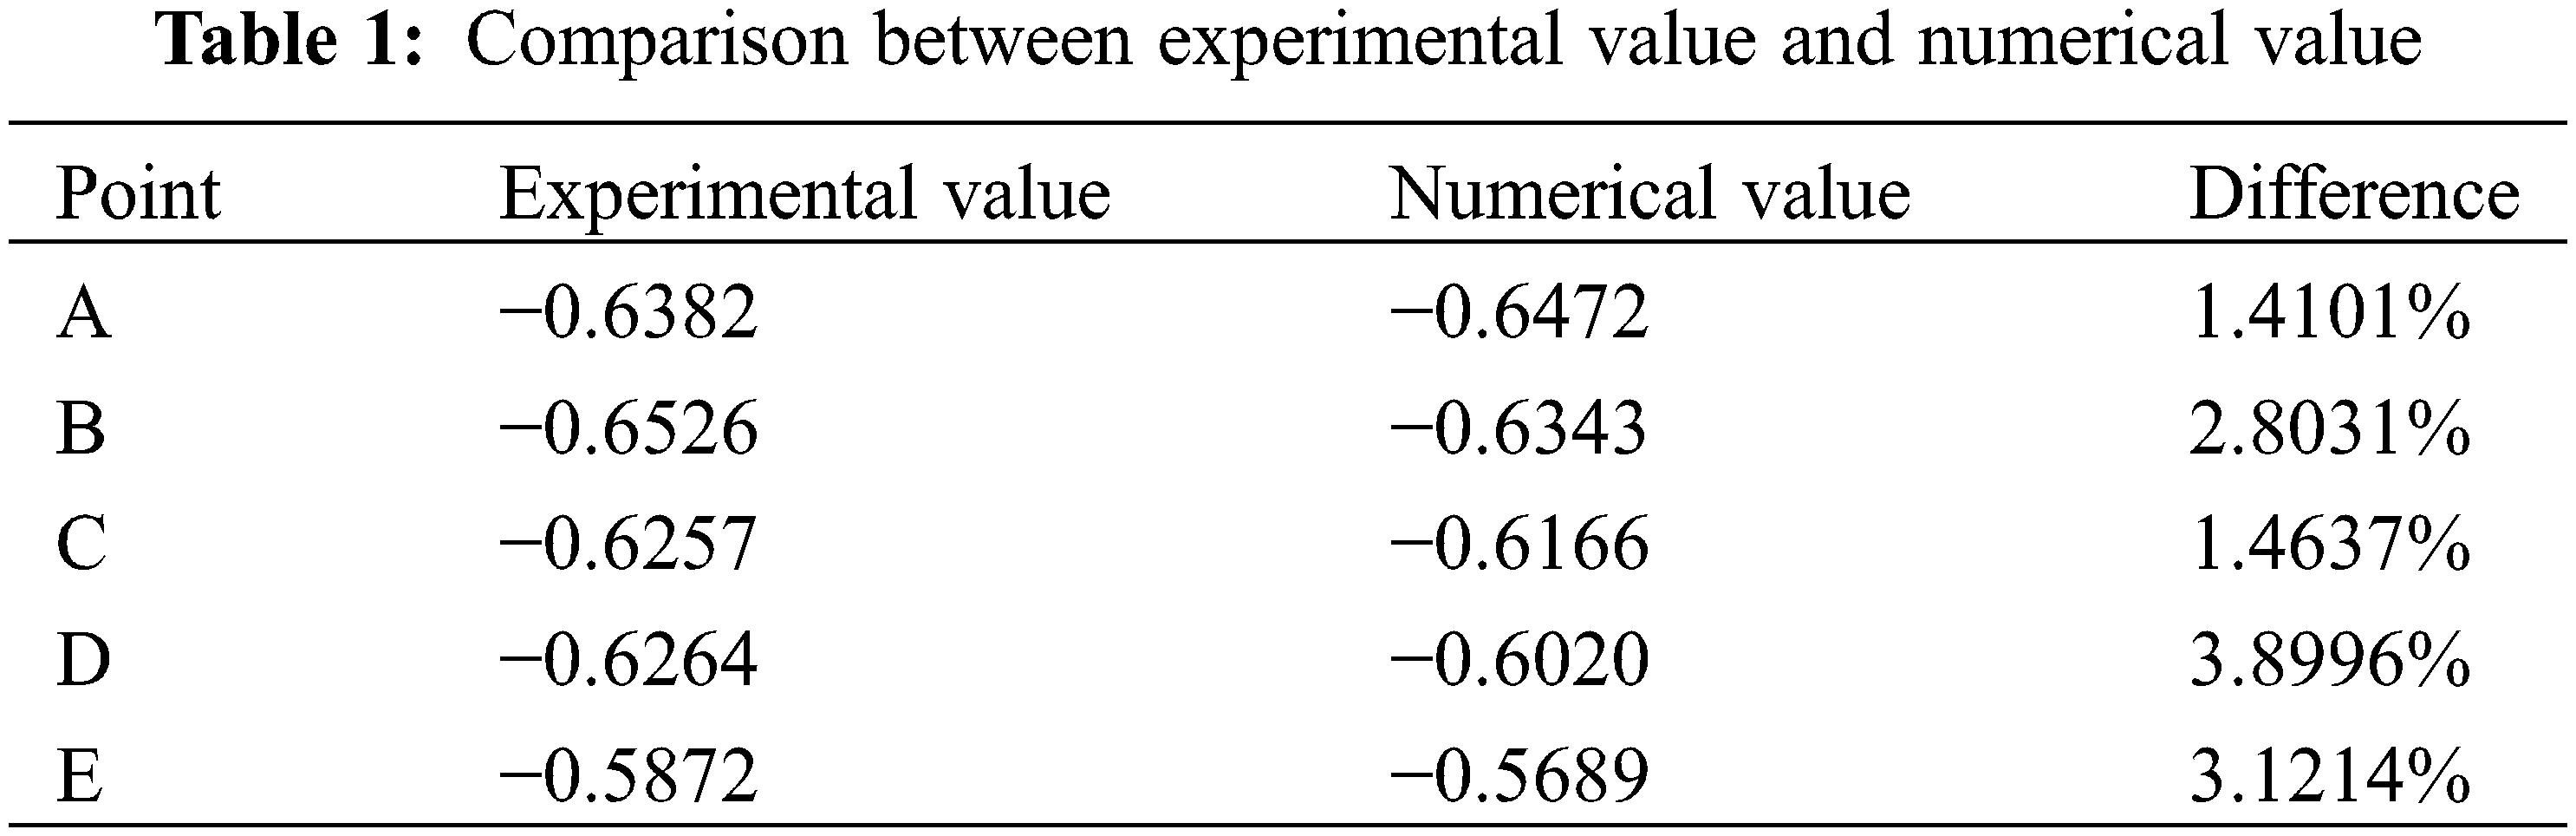
To verify the accuracy of the numerical model, the variation in pressure coefficient along the profile line at points A, B, C, D, and E is shown in Table 1. The numerical pressure coefficients closely match the experimental values, with a maximum difference of less than 4%. This indicates that the current simulation model can effectively simulate cavitating flow.
The inflow temperature is set to be
4.1 General Observations of Transient Cavitation
Based on Kelly’s cavitation flow test of fluoroketone around the NACA0015 airfoil, the study examined the unsteady cavitation flow phenomenon around the airfoil at various incoming flow velocities. The unsteady cavitation flow is categorized into three stages based on the shapes of different flow fields and cavitation development cycle characteristics: (I) At an incoming velocity of 6 m/s, the maximum cavitation length is less than 0.5 C initially, then it gradually falls off, where C is the hydrofoil chord. (II) With an incoming velocity of 7.5 m/s, the maximum cavitation length progressively increases to 0.8 to 1.0 C, accompanied by noticeable attached cavitation. (III) At an incoming velocity of 9.6 m/s, the maximum cavitation length exceeds 1.0 C, covering the entire hydrofoil surface, and larger-scale cloud-like cavitation form in the flow field. Detailed descriptions of the unsteady cavitation flow characteristics of fluoroketone around the hydrofoil at different fluid velocities are shown in Fig. 4.
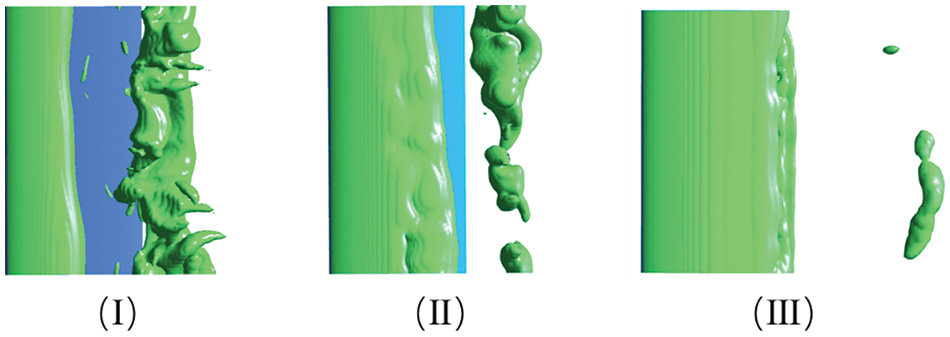
Figure 4: Schematic diagram of maximum length of attached cavity at different inlet velocities. (I) u∞ = 6 m/s, (II) u∞ = 7.5 m/s, (III) u∞ = 9.6 m/s
For the coordinates with respect to the hydrofoil, x is the chordwise coordinates of the hydrofoil, z is the spanwise coordinates of the hydrofoil. To analyze the three-dimensional characteristics of the cavitation flow around the NACA0015 hydrofoil at varying chord lengths, Fig. 5 displays the cavitation volume distribution at xoy sections with different chord lengths. On the hydrofoil, S1, S2, and S3 correspond to z = 0.4928, z = 0.985, and z = 1.4775 C, respectively (the solid blue line represents the intersection line between the cross-section and the hydrofoil surface).
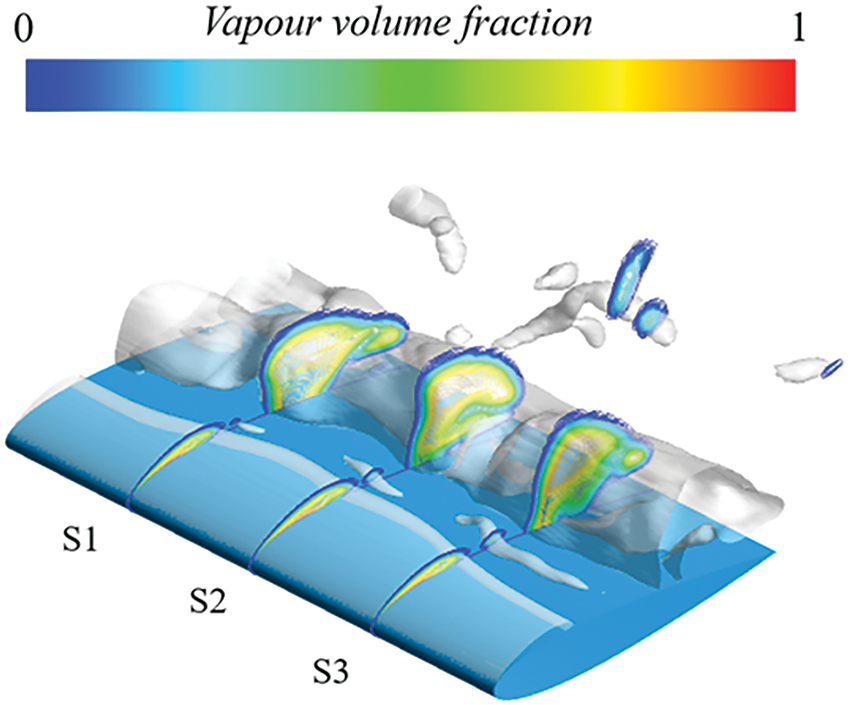
Figure 5: Distribution of vapor volume fraction at different chord length sections
4.2 Flow Characteristics at Different Inlet Velocities
Figs. 6 and 7 show the variation of cavitation volume, and of lift and drag coefficients, respectively, for inlet velocity of 6 m/s. Numerical calculations reveal the quasiperiodic process of cavitation growth, development, and shedding persists under this condition. During this stage, the periodic cavitation development affects the hydrodynamic load, causing the lift coefficient to fluctuate periodically. This section analyzes the characteristics of cavitation dynamics by selecting 6 instantaneous moments from a typical cycle in the Fig. 6b.
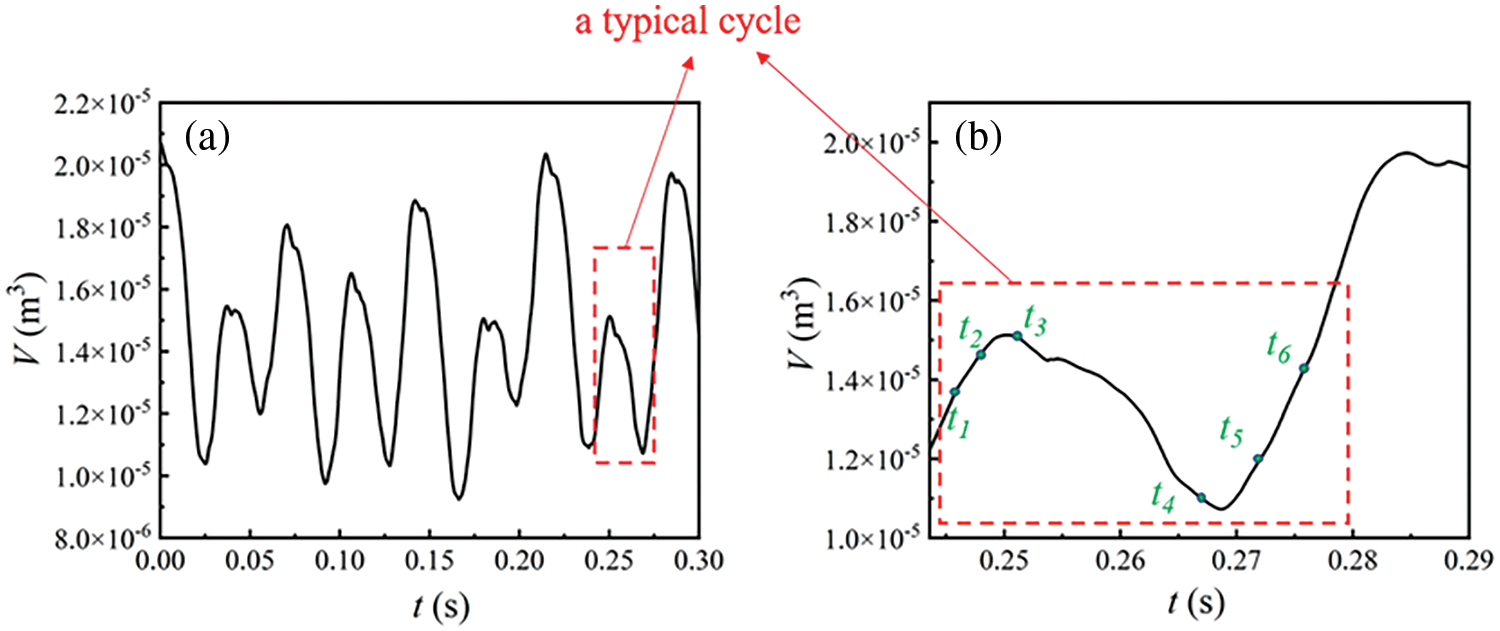
Figure 6: (a) Variation of total cavity volume with time, (b) A typical cycle
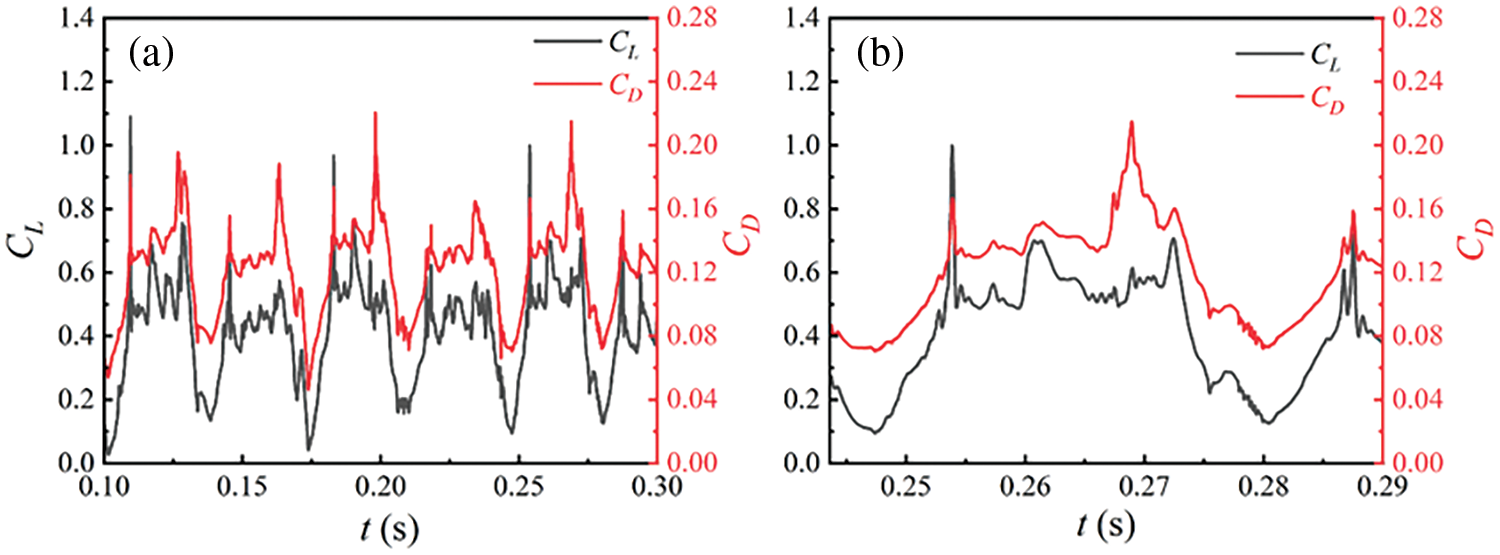
Figure 7: (a) Variation of lift and drag coefficient with time, (b) A typical cycle
Fig. 8 displays the changes in cavitation volume on the S1, S2, and S3 sections at six moments within a typical cycle. A comparison of the cavitation cloud images across the three sections reveals strong three-dimensional characteristics of cavitation at this stage, with variations in cavitation shapes observed among different sections simultaneously. During the t1–t3 stage, cavitation gradually forms at the leading edge of the hydrofoil due to pressure changes. As cavitation develops, it adheres to the leading edge and begins to detach as it approaches a position close to 0.4 C. Concurrently, the hydrodynamic load on the hydrofoil surface alters, leading to an increase in lift and drag coefficients. Upon observation of cavitation at the subsequent moment, it is evident that cavitation is partially detached at this point, particularly upstream of the hydrofoil. Some cavities remain attached to the leading-edge surface, partially dissociating downstream. From t3 to t4, the cavitation bubbles started to detach and collapse downstream, resulting in a decrease in the overall cavitation volume and corresponding lift and drag coefficients. From t5 onwards, new cavitations emerged at the hydrofoil’s leading edge and continued to evolve, while the previously shed vortices collapsed downstream. The energy released during the detachment and collapse of cavitation bubbles altered the hydrodynamic load on the hydrofoil surface, leading to a subsequent increase in lift and drag coefficients.
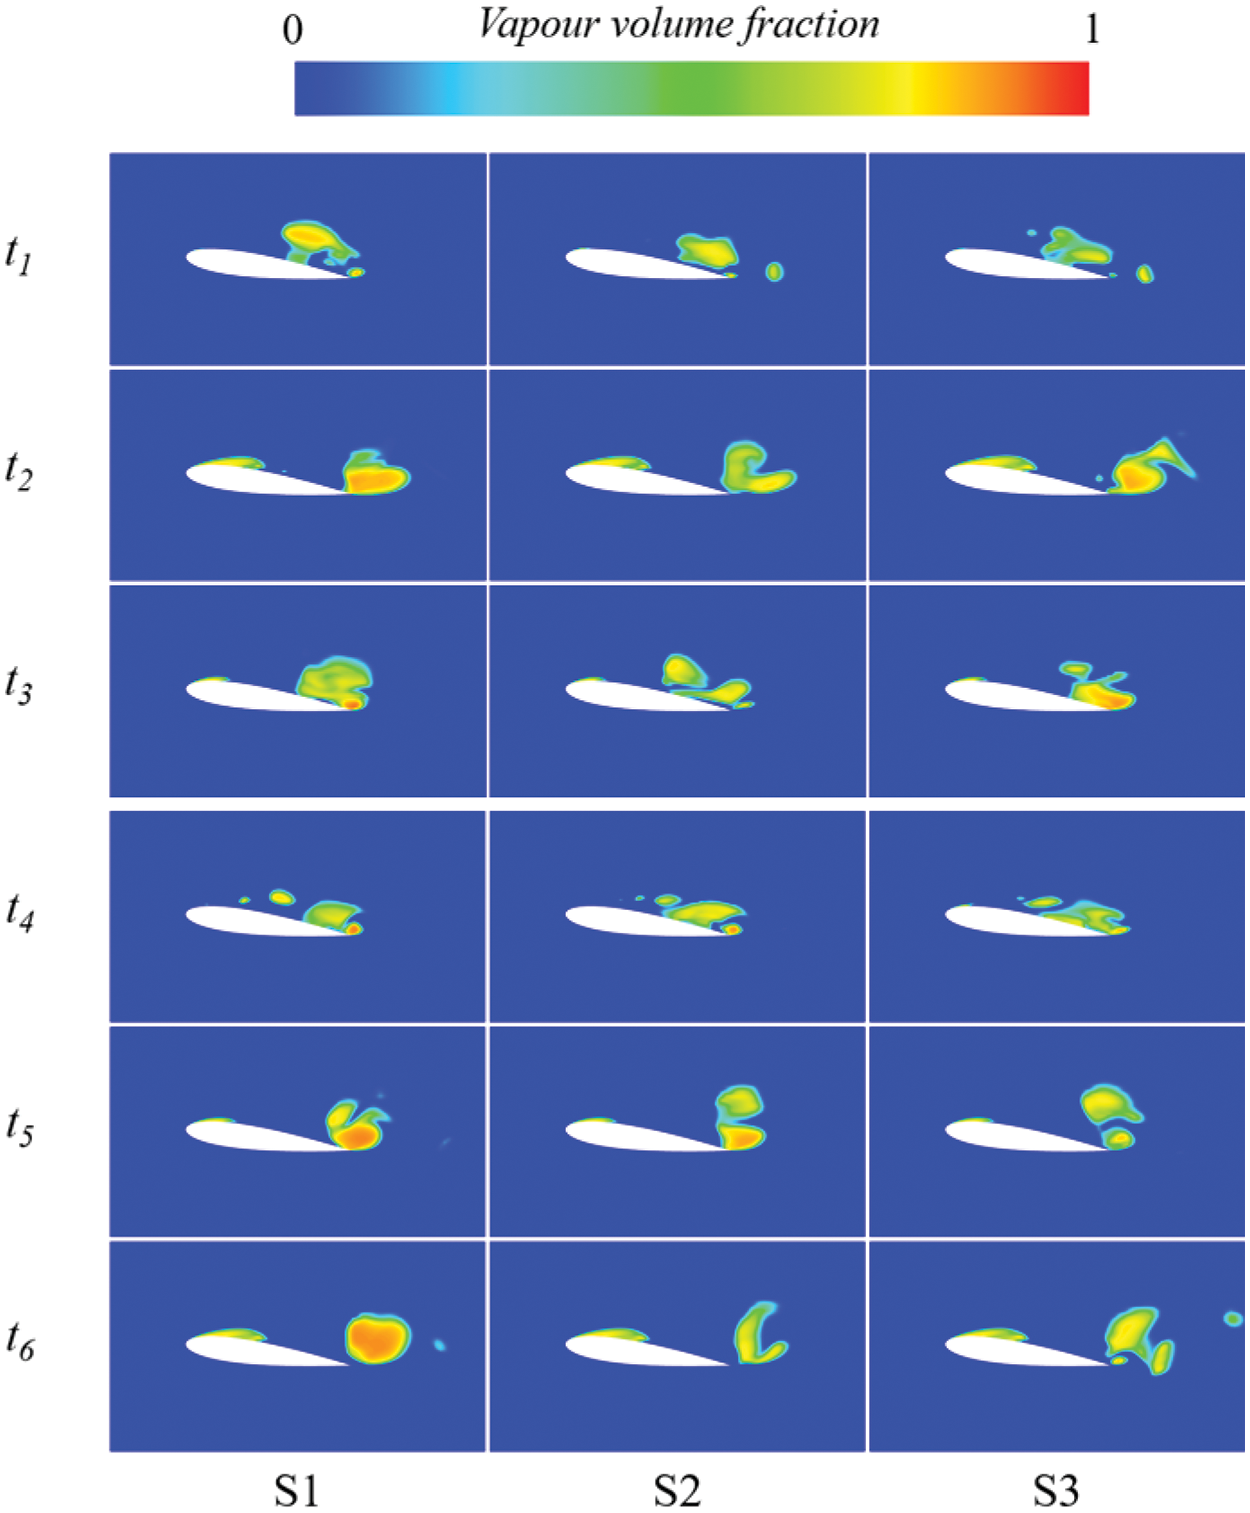
Figure 8: The cavity volume fraction at different sections at six typical instantaneous moments
Cavitation arises from pressure changes, evident in abrupt shifts in the pressure coefficient. To further examine cavitation development locations, Fig. 9 illustrates the pressure coefficient distribution at six typical instantaneous moments. At t1, the pressure coefficients of the three sections change at x = 0.1 and x = 0.6 C, corresponding to the cavitations that detached in the previous cycle at time t1 in Fig. 9 and those that will form in the next cycle. At t2, the pressure coefficient begins to change near x = 0.45 C, indicating that the cavitation attached to the hydrofoil surface has developed near x = 0.45 C. At t3, the pressure coefficient changes at both x = 0.2 and x = 0.7 C, confirming the partial shedding mode mentioned earlier. This means that the cavitation developed at time t2 partially detaches and moves to the position of 0.7 C along the hydrofoil. At t4, the cavitation attached to the leading edge of the hydrofoil shrinks to 0.1 C, while the cavitation detached from the trailing edge starts collapsing, causing a significant pressure change. At t5, new cavitations begin developing continuously, extending the length to 0.3 C, while the previously collapsed cavitation continues moving downward along the hydrofoil span length of 0.9 C. At t6, the length of the cavitation attached to the leading edge continues to increase to about 0.45 C, initiating a new cycle of development.
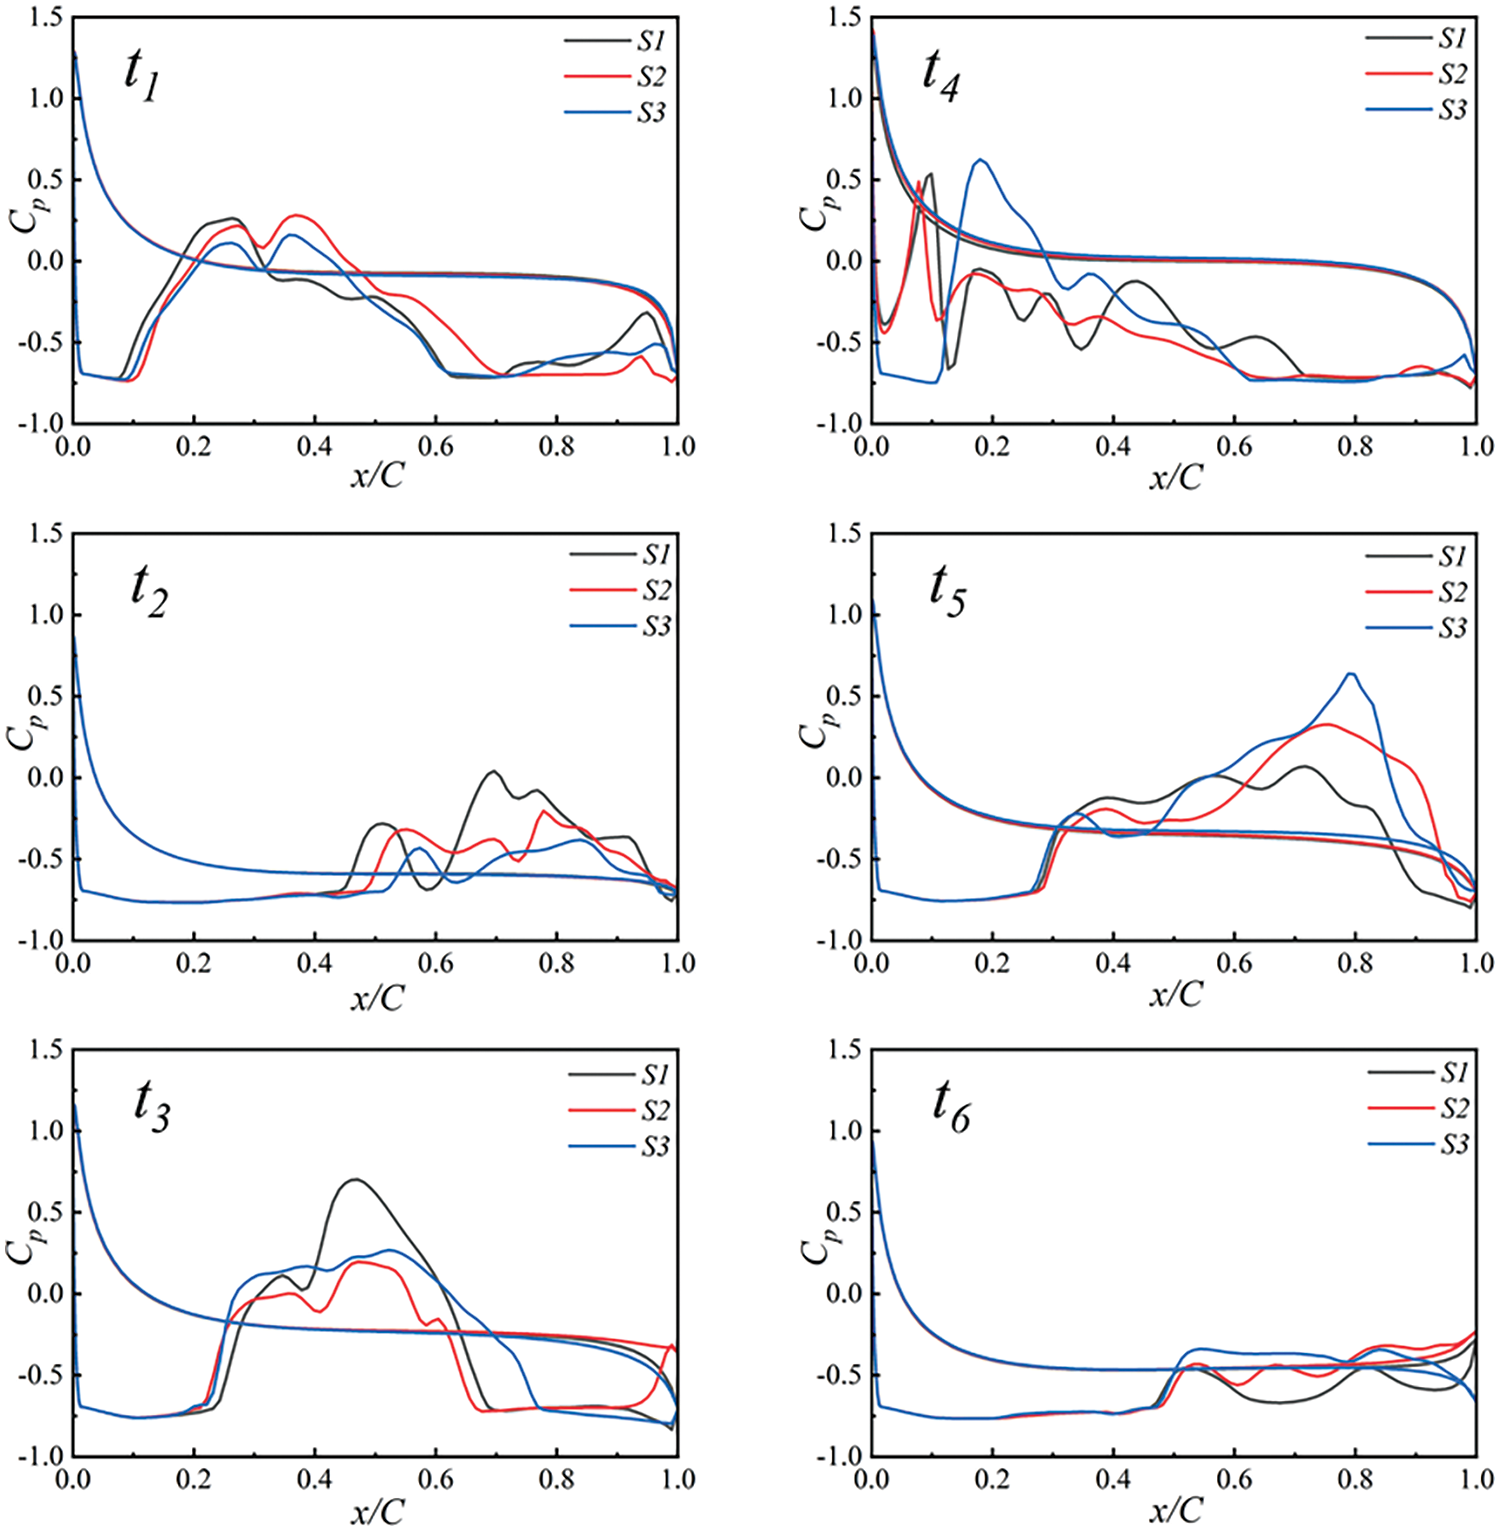
Figure 9: Distribution of pressure coefficients at different cross-sections at six typical instants
To illustrate the impact of the three-dimensional cavitation structure on vortex generation and transport in cavitation flow, we selected the vortex distribution and transport on the spanwise sections S1, S2, and S3 of the hydrofoil for discussion. Fig. 10 depicts the distribution of Ω values at different sections during six instantaneous moments. It reveals the close relationship between the growth, development, and shedding of cavitation and the vortex structure. The results indicate that the vortex structure develops more densely near the cavitation. Additionally, a higher Ω value at the center of the cavitation suggests a stronger vortex structure inside the cavitation. Moreover, at the trailing edge of the hydrofoil, a significant number of vortices are shed alternately, indicating a notable rotational effect in the vortex shedding process induced by cavitation. Fig. 11 illustrates the distribution of the VST at different cross-sections during six instantaneous moments. The results indicate that the positive and negative alternations of these terms are mainly associated with the shedding of vortices on both sides of the bubble. This alternation reflects the conservation of angular momentum principle. Changes in cavitation during unsteady cavitation led to alterations in the vortex structure, weakening the inertia moment of fluid elements and increasing their angular velocity, which is a key factor in vorticity generation. Therefore, the VST plays a significant role in vorticity transport. Figs. 12 and 13 depict the distribution of the VDT and the BTT, respectively. It’s evident from the Figs. 11 to 13 that these terms only appear at the location of cavitation. As cavitation collapses, both terms gradually vanish. The values of the VDT alternate between positive and negative, which is more pronounced. Meanwhile, at the edge of the cavitation, especially at the fracture, the distribution of the BTT is more evident. Comparing these Figs. 11–13, it can be observed that the VST consistently pervades the entire flow field with vortices, whereas the VDT and the BTT are only present in and around the cavitation. This confirms the significant role of the stretching and twisting term in vorticity transportation.
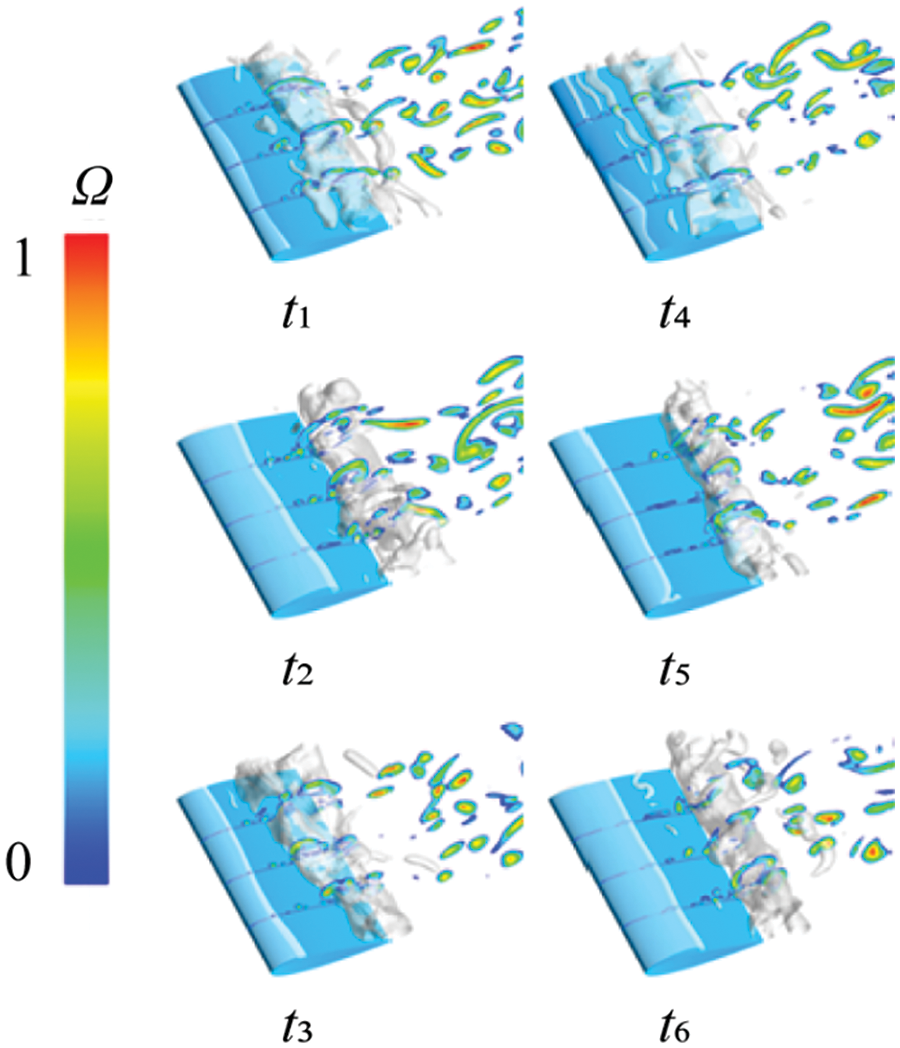
Figure 10: Distribution of Ω values at different sections at different times
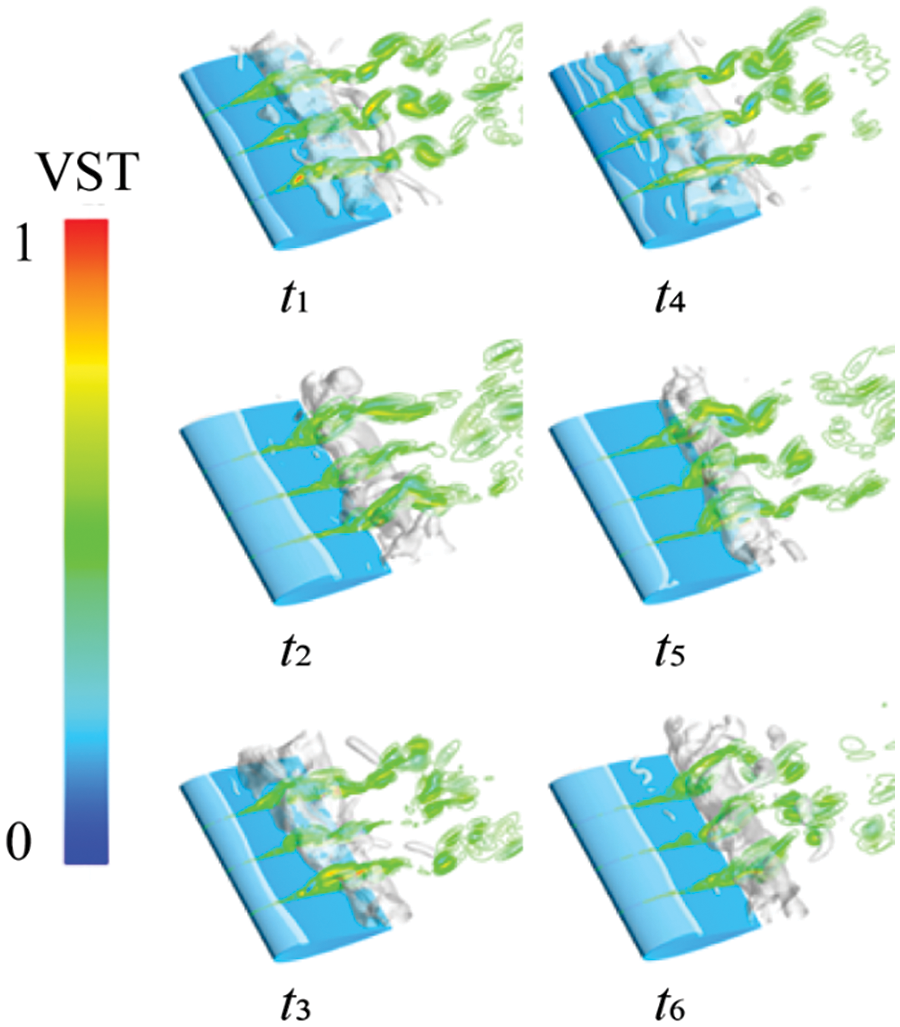
Figure 11: Vortex stretch term contours at different cross sections at different times
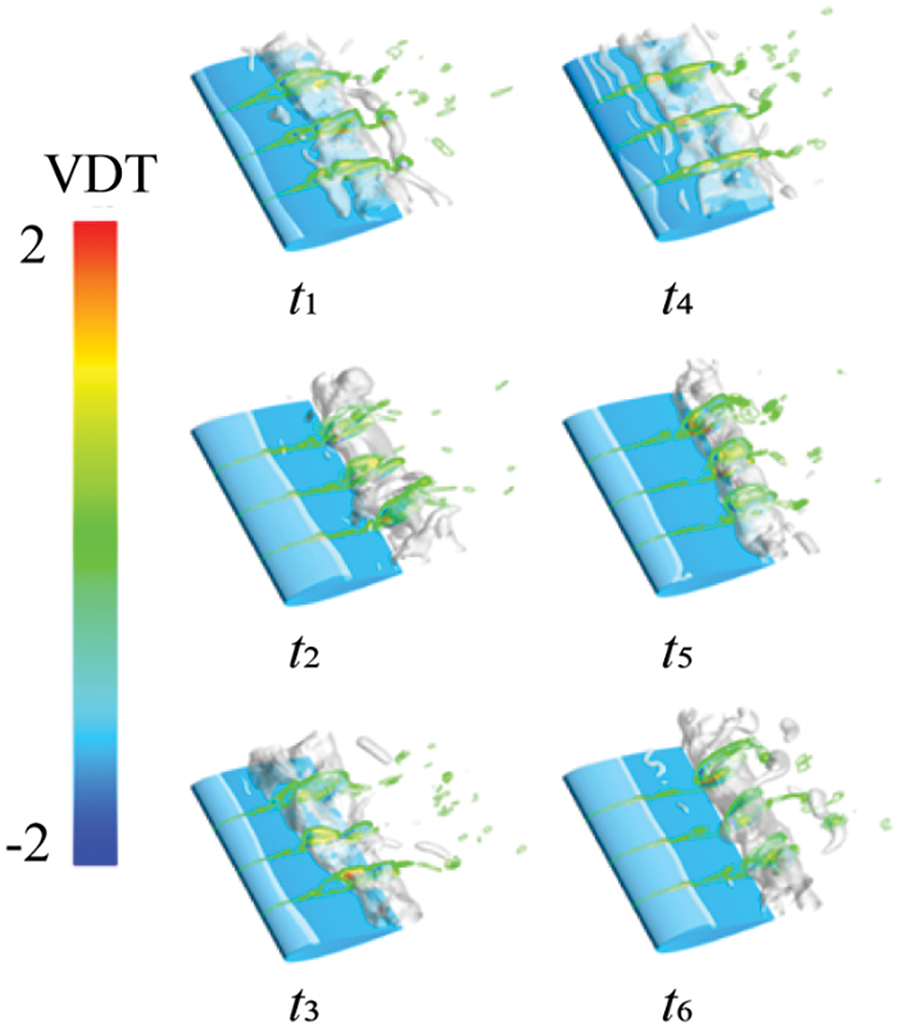
Figure 12: Vortex dilatation term contours at different cross sections at different times
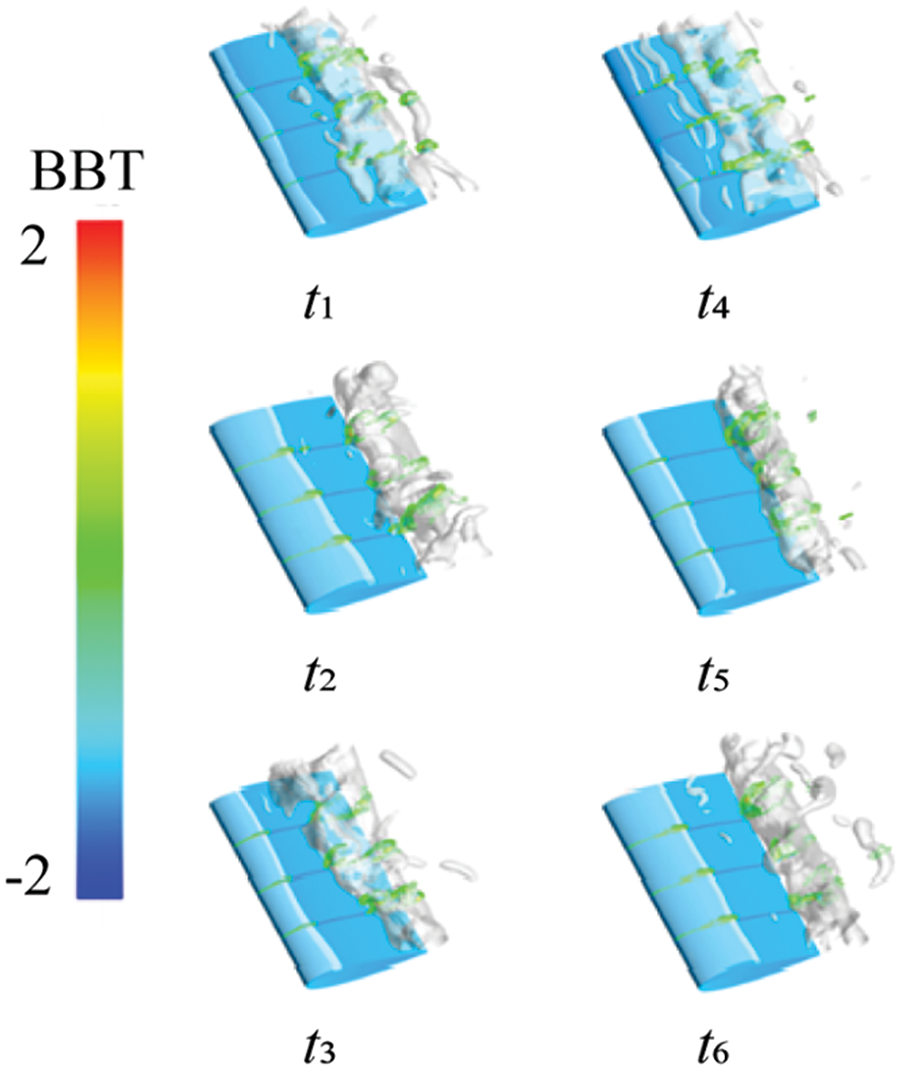
Figure 13: The baroclinic torque contours at different cross sections at different times
Figs. 14 and 15 depict the variation curves of cavitation volume and lift-drag coefficient over time in this working condition. Numerical calculations reveal the qua-si-periodic process of cavitation growth, development, and shedding persists under this condition. At a flow velocity of 7.5 m/s, noticeable sheet cavitation adheres to the hydrofoil’s leading edge, with the maximum cavitation length ranging between 0.5 and 1.0 C. During this stage, the periodic cavitation development affects the hydrodynamic load, causing the lift coefficient to fluctuate periodically between 0.1 and 0.8, and the drag coefficient between 0.05 and 0.2.
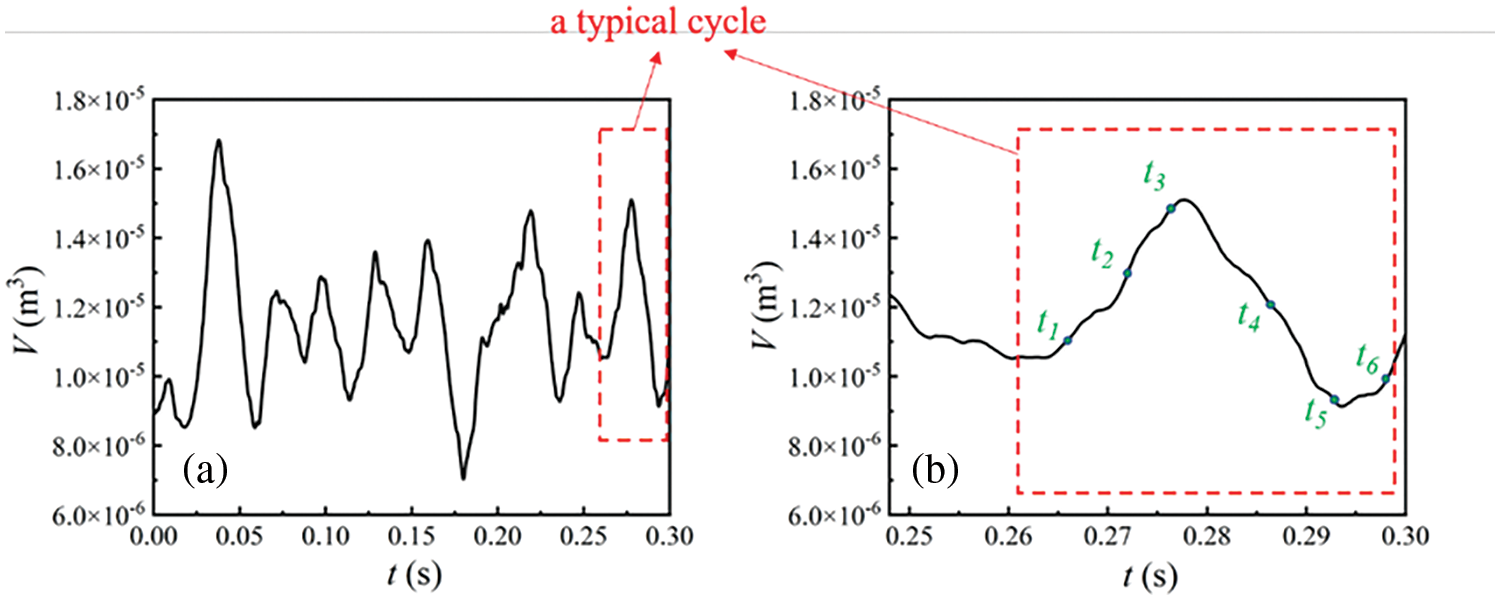
Figure 14: (a) Variation of total cavity volume with time, (b) A typical cycle
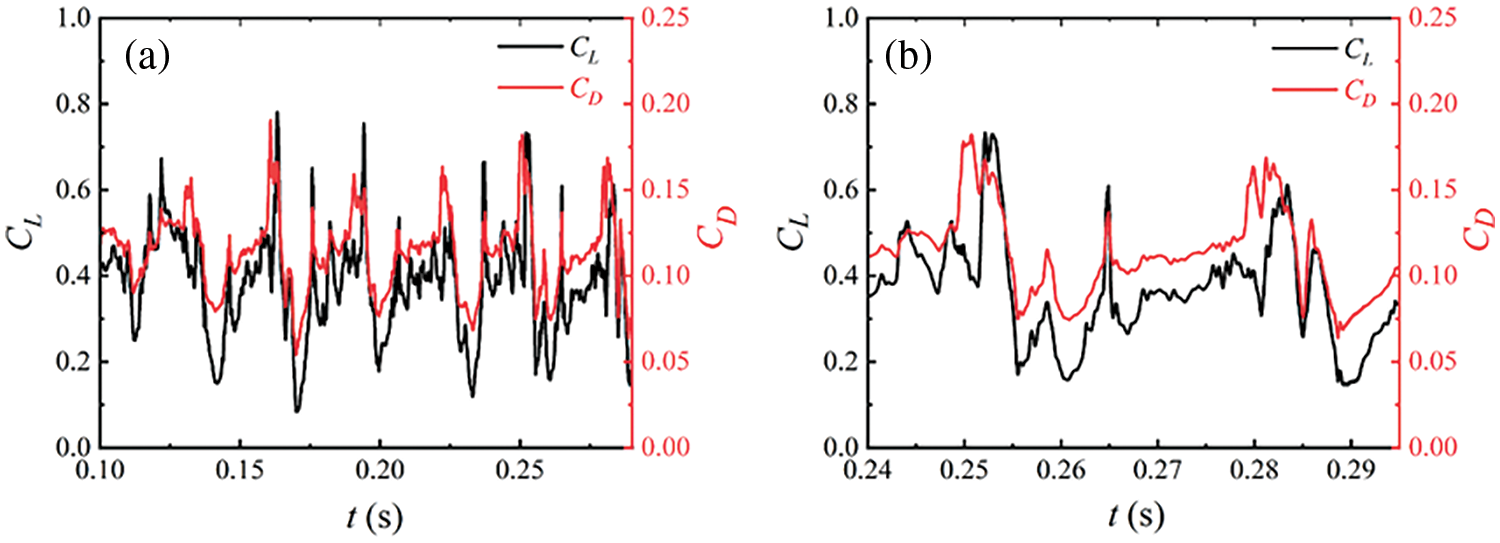
Figure 15: (a) Variation of lift and drag coefficient with time, (b) A typical cycle
Fig. 16 illustrates cavitation cloud diagrams at six typical instantaneous moments within one cycle of sections S1, S2, and S3 at an inflow velocity of 7.5 m/s. In the S1 section, during time t1–t3, cavitation gradually initiates at the hydrofoil’s leading edge due to pressure changes, extending towards the trailing edge and forming pronounced attached cavitation. The attached cavitation on the hydrofoil’s surface reaches a maximum length exceeding half the hydrofoil’s span, i.e., greater than 0.5 C. During the t3–t4 stage, the attached cavitation on the hydrofoil’s surface start to rupture, indicating a partial shedding mode. Some broken cavities detach and move towards the hydrofoil’s trailing edge. In the t4–t5 stage, the remaining cavities on the hydrofoil’s leading edge completely detach from its surface, and all attached cavities shed downstream, displaying a complete shedding mode. Previously partially detached cavity clusters begin to collapse and shrink. At t5–t6, cavitation development initiates a new cycle. Cavitation emerges at the leading edge and grows along the hydrofoil’s surface. Previously shed cavitation downstream collapses. While there are variations in cavitation development on the S2 and S3 sections, the overall pattern mirrors that of the S1 section, following a quasi-periodic growth process.
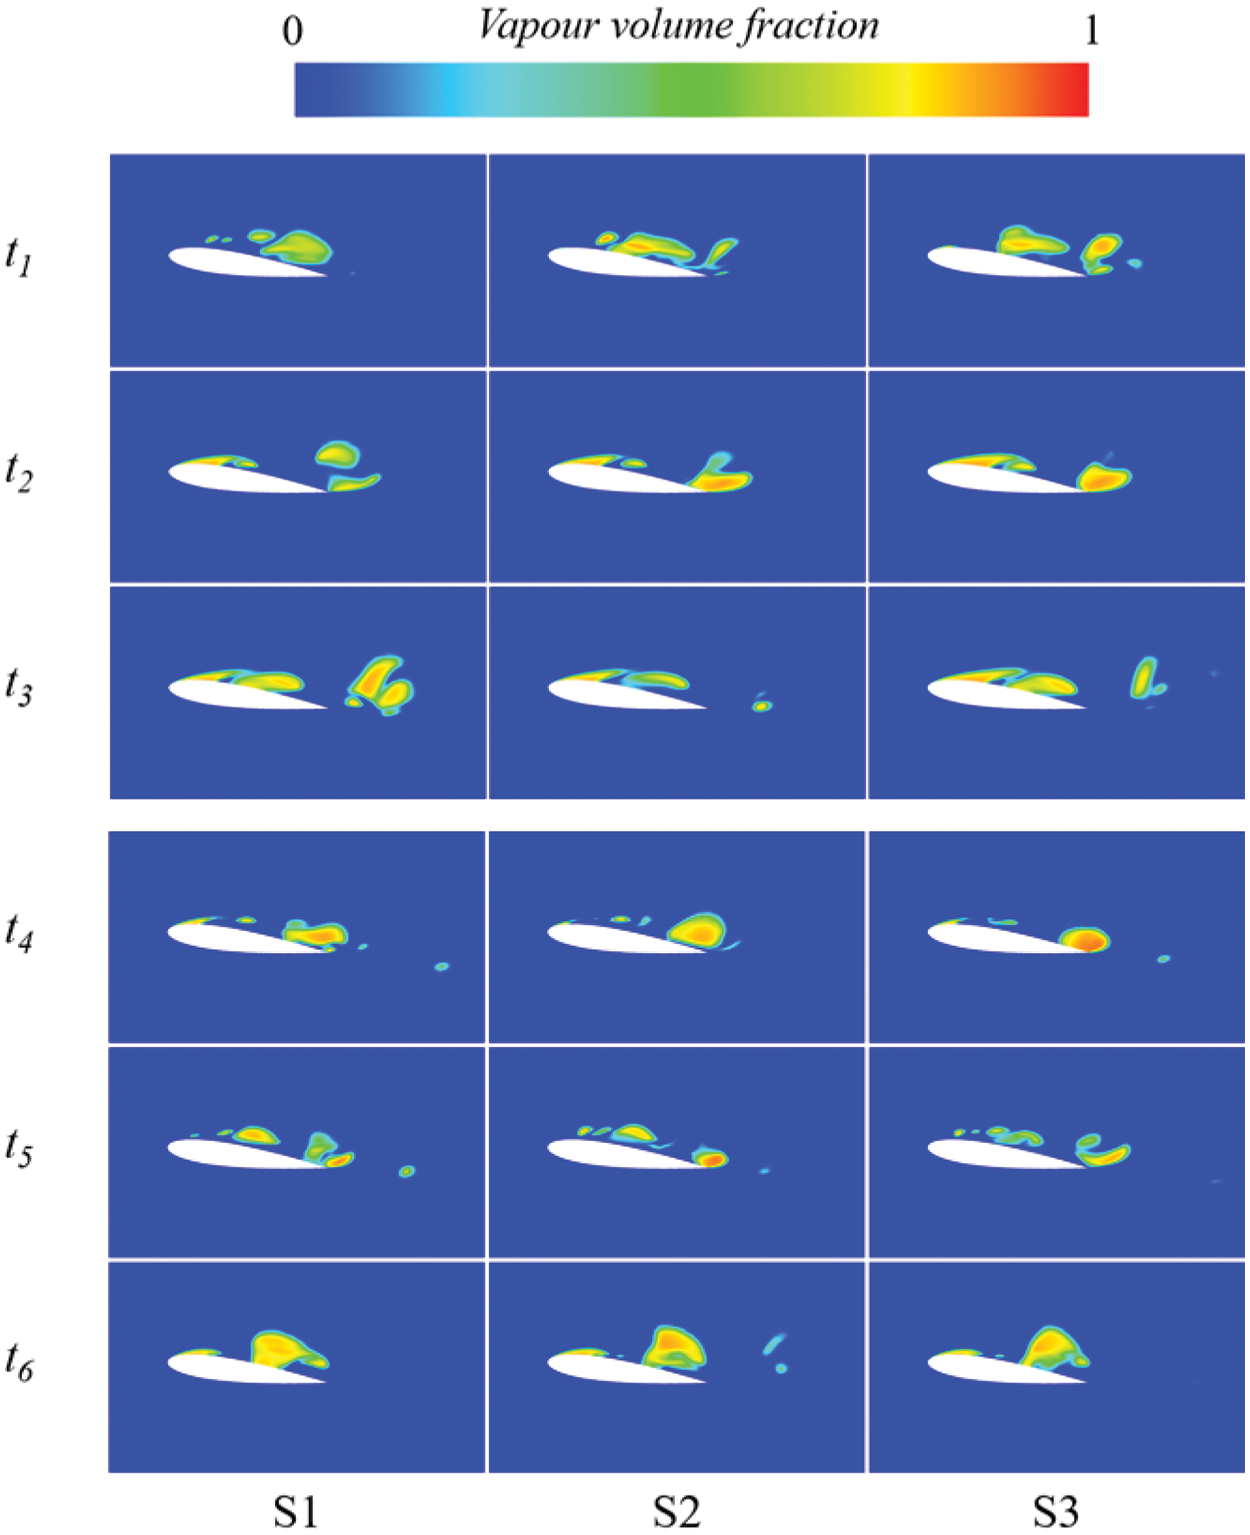
Figure 16: The cavity volume fraction at different sections at six typical instantaneous moments
Fig. 17 illustrates changes in the pressure coefficient at six transient moments with an inflow velocity of 7.5 m/s, showcasing the pressure distribution under this condition. At time t1, cavitation initiates at the leading edge of the hydrofoil at sections S1 and S2, with pressure fluctuations occurring at positions less than 0.1 C. Simultaneously, the vortex detached in the previous cycle near the trailing edge begins to move and collapse. At time t2, cavitation attached to the hydrofoil surface continues to grow, with a length exceeding 0.5 C, resulting in pressure coefficient fluctuations between x = 0.5 and x = 0.7 C. At time t3, small and larger pressure coefficient fluctuations occur at x = 0.3 and x = 0.8 C, respectively. This is because cavitation is about to rupture at x = 0.3 C, leading to partial detachment, while the length of sheet cavitation reaches a peak value which is around 0.8 C. At time t4, there were two noticeable fluctuations in the pressure coefficient near x = 0.2 and x = 0.5 C. This occurred because the sheet cavitation generated earlier ruptured at these locations simultaneously, forming two distinct void clusters. At t5 and t6, the remaining voids at the front edge fall off completely and move downward, while new voids are generated at the front edge, gradually growing. This state aligns with the cavitation evolution depicted in each stage in Fig. 16.
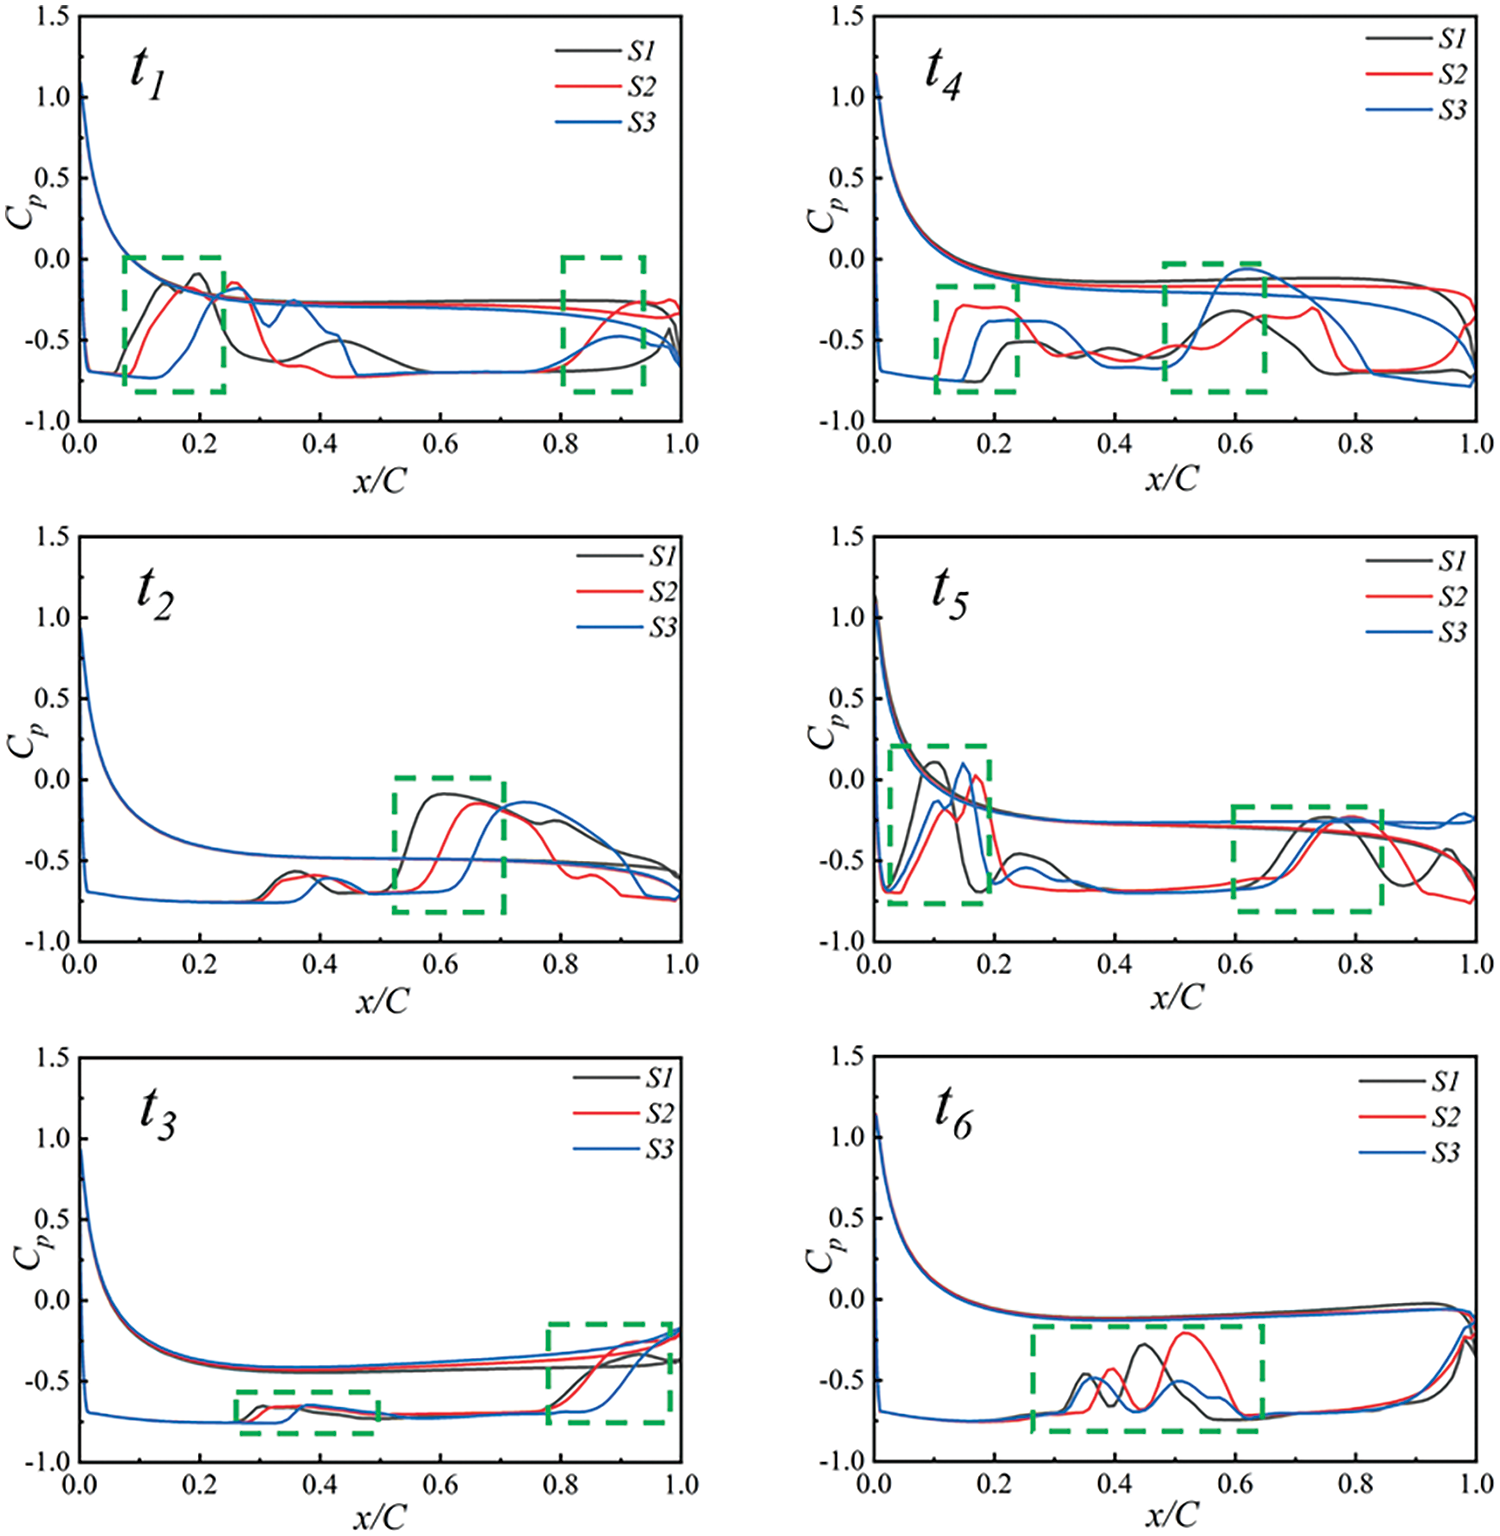
Figure 17: Distribution of pressure coefficients at different cross-sections at six typical instants
Figs. 18 to 21 depict the distribution of vortex Ω value, VST, VDT, and BTT across three hydrofoil cross-sections, along with cavitation changes. Comparing Figs. 18 and 19 reveals that as cavitation sheds, vortices start alternating around it. Where vortex intensity is higher (i.e., larger Ω values), the VST emerges, causing significant alternating positive and negative values. This term fills the flow field along with vortices, acting as the primary source of vorticity transport. In Fig. 20, the VDT increase noticeably with rising incoming flow velocity, evident from the denser colored areas, particularly within cavitation regions. This demonstrates that as flow velocity rises, the influence of VDT on vorticity transport amplifies. In Fig. 21, the BTT correlates with density changes and pressure drops, exhibiting the most significant impact at the gas-liquid interface. Notably, its effect increases notably when cavitation sheds at t4 and completely detaches at t5.
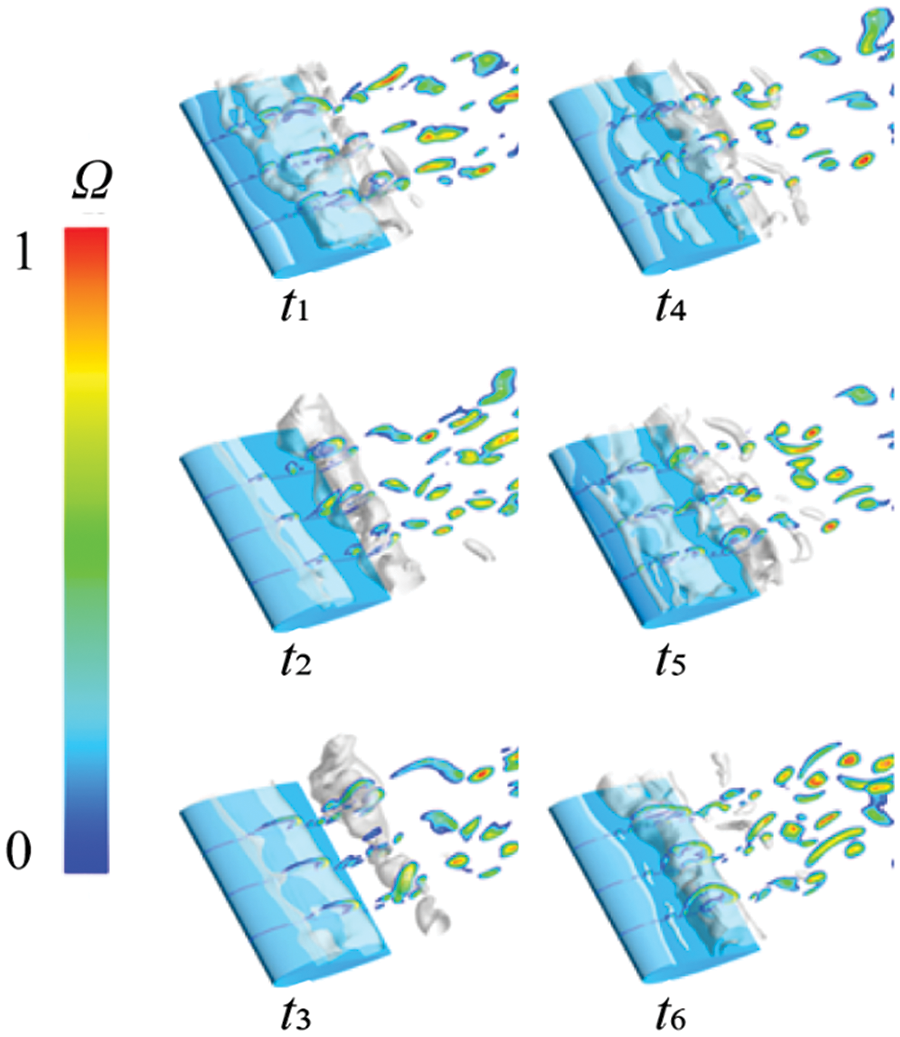
Figure 18: Distribution of Ω values at different sections at different times
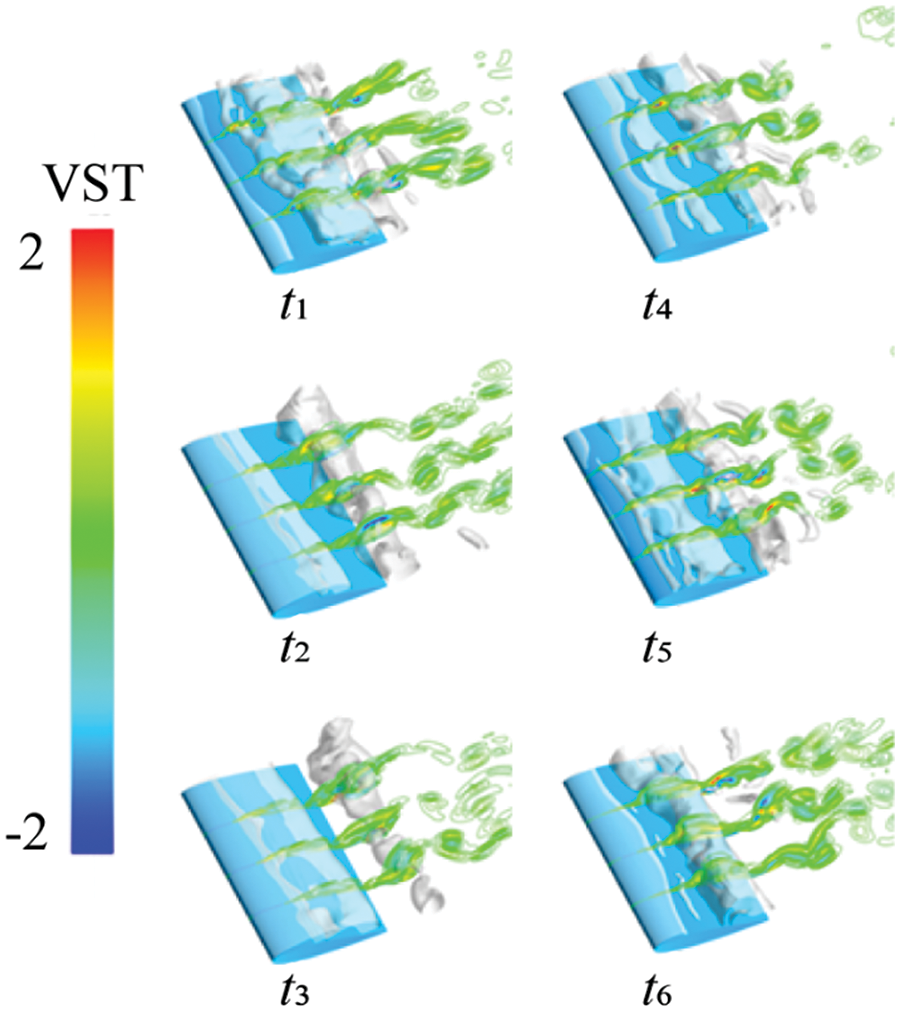
Figure 19: Vortex stretch term contours at different cross sections at different times
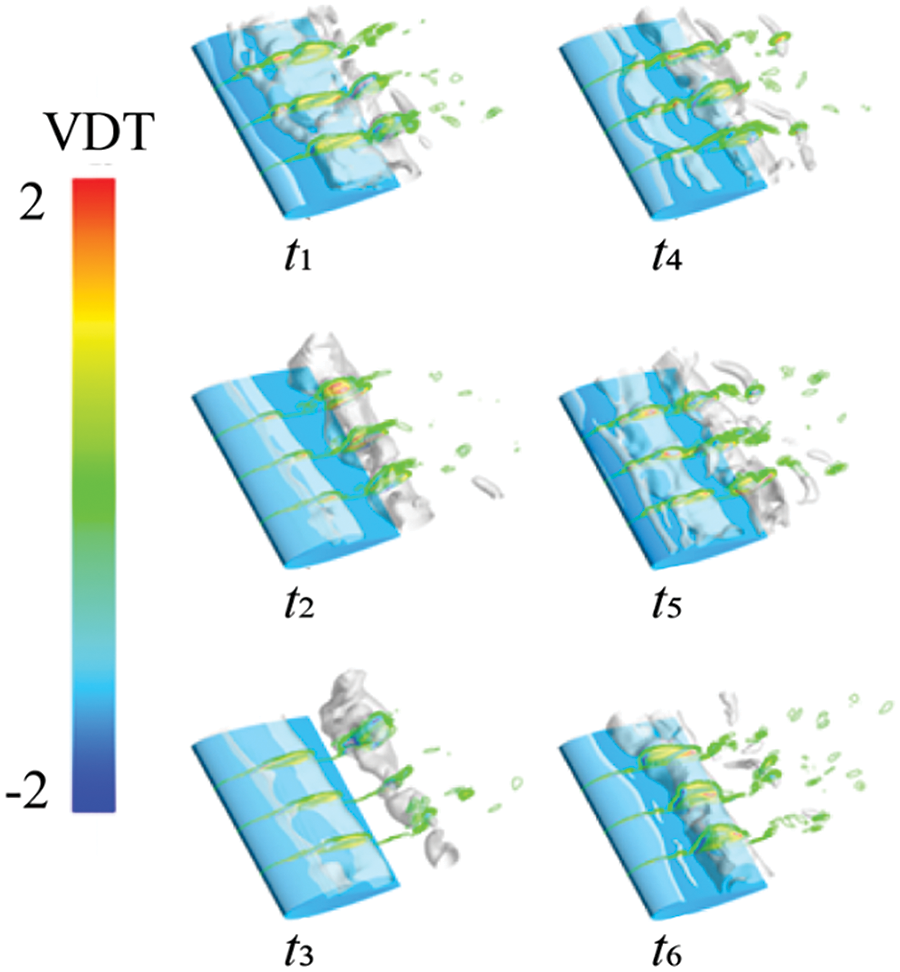
Figure 20: Vortex dilatation term contours at different cross sections at different times
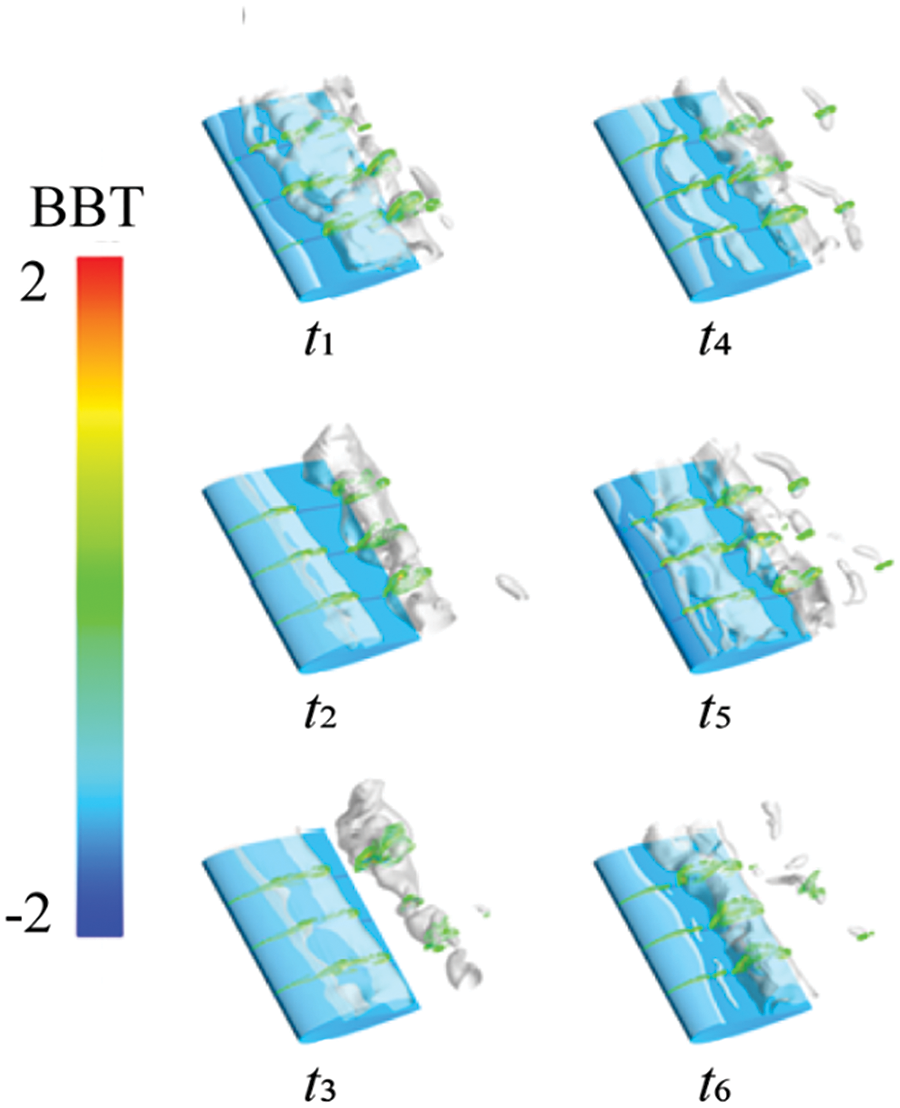
Figure 21: The baroclinic torque contours at different cross sections at different times
This section primarily discusses the characteristics of unsteady cavitation flow around the hydrofoil under an incoming flow velocity of 9.6 m/s and a cavitation number of 0.7. Figs. 22 and 23 depict the curves illustrating the variation of cavitation volume and lift-drag coefficient over time. The results indicate that over time, the volume of cavitation across the entire flow field surpasses that of the first two operating conditions. Additionally, the quasi-periodic growth and shedding process of cavitation are faster compared to the initial two conditions. During this phase, cavitation initiates from the hydro-foil’s leading edge and extends backward. The maximum length of cavitation exceeds 1.0 C, covering the entire hydrofoil surface, forming a noticeable large-scale cloud-like void. Concurrently, alterations in hydrodynamic load mirror cavitation changes, exhibiting shorter periods and more pronounced fluctuations.
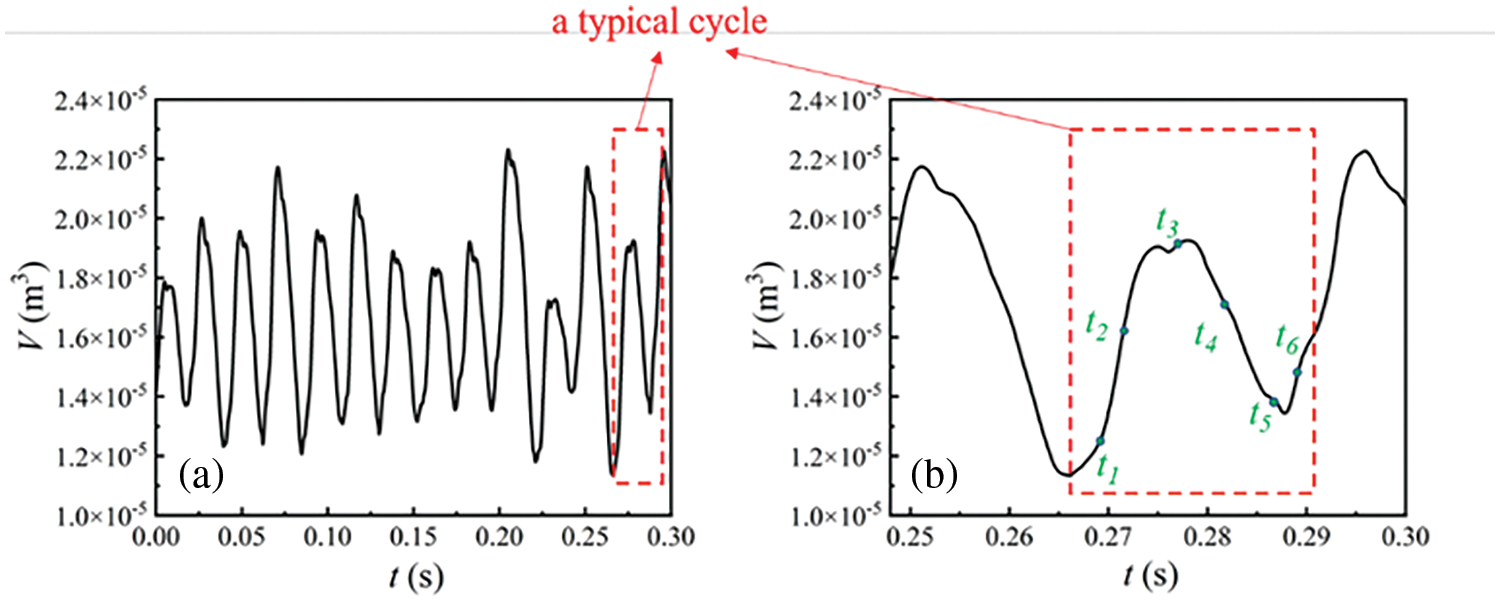
Figure 22: (a) Variation of total cavity volume with time, (b) A typical cycle
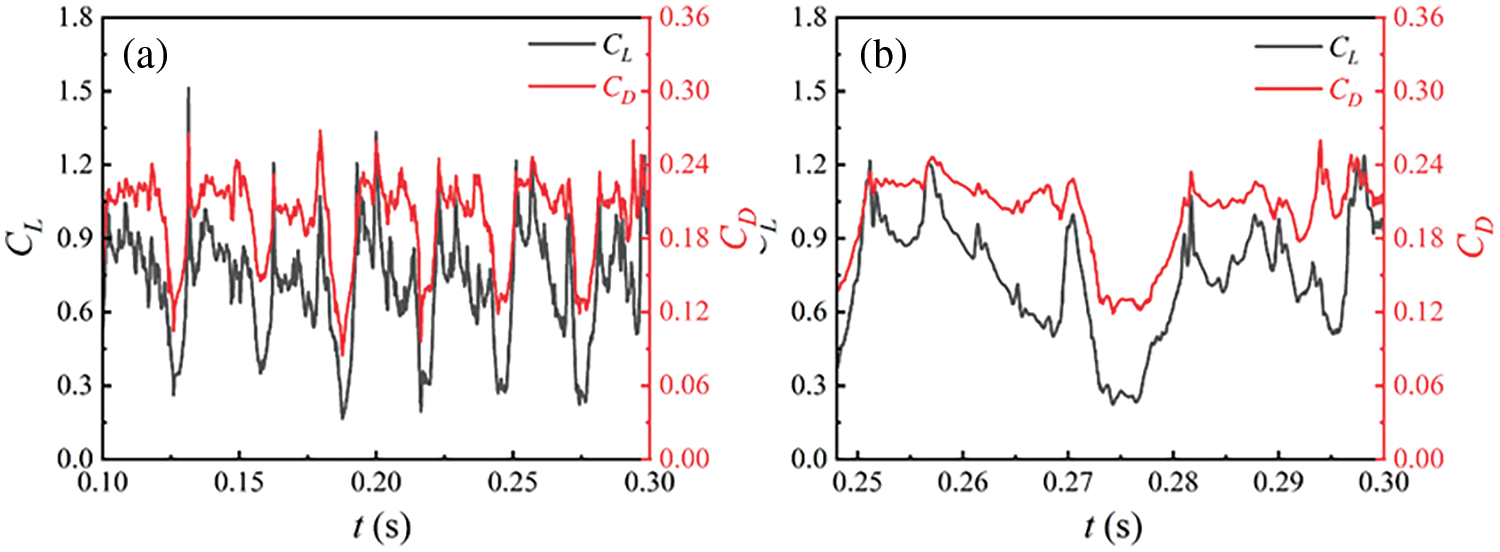
Figure 23: (a) Variation of lift and drag coefficient with time, (b) A typical cycle
Fig. 24 depicts the cavitation change cloud diagram for a typical period on sections S1, S2, and S3 at an inflow velocity of 9.6 m/s. The results reveal significant variations in cavitation scale under this operating condition, with similar patterns across the three sections. Sequentially, the processes of no shedding mode, partial shedding mode, and complete shedding mode occur. From t1 to t3, cavitation enters the development stage, initiating at the hydrofoil’s leading edge and progressing along its surface towards the trailing edge. Throughout this phase, cavitation extends to envelop the entire hydrofoil, forming a pronounced cloud-like void. Notably, the attached cavities at the leading edge persistently grow without detachment (the detached cavities downstream in the image represent the evolution of cavities from the previous cycle). At time t4, the cloud-like cavitation attached to the hydrofoil’s surface starts to break from the middle. The ruptured cavitation fragments into a larger cavitation cluster and several smaller cavities, as seen in section S1. A notable occurrence is the detachment of the cavitation segment at this point. At time t5, the cavities dislodged earlier continue to fragment, forming additional small-scale ones. Meanwhile, the remaining cavities on the hydrofoil’s leading edge start to detach, marking the onset of complete shedding as all cavities depart from the surface. At time t6, attached cavities form again at the leading edge while those dislodged earlier move downstream and collapse. This initiates a new cycle akin to time t1, where cavities grow, detach, disintegrate, and collapse.
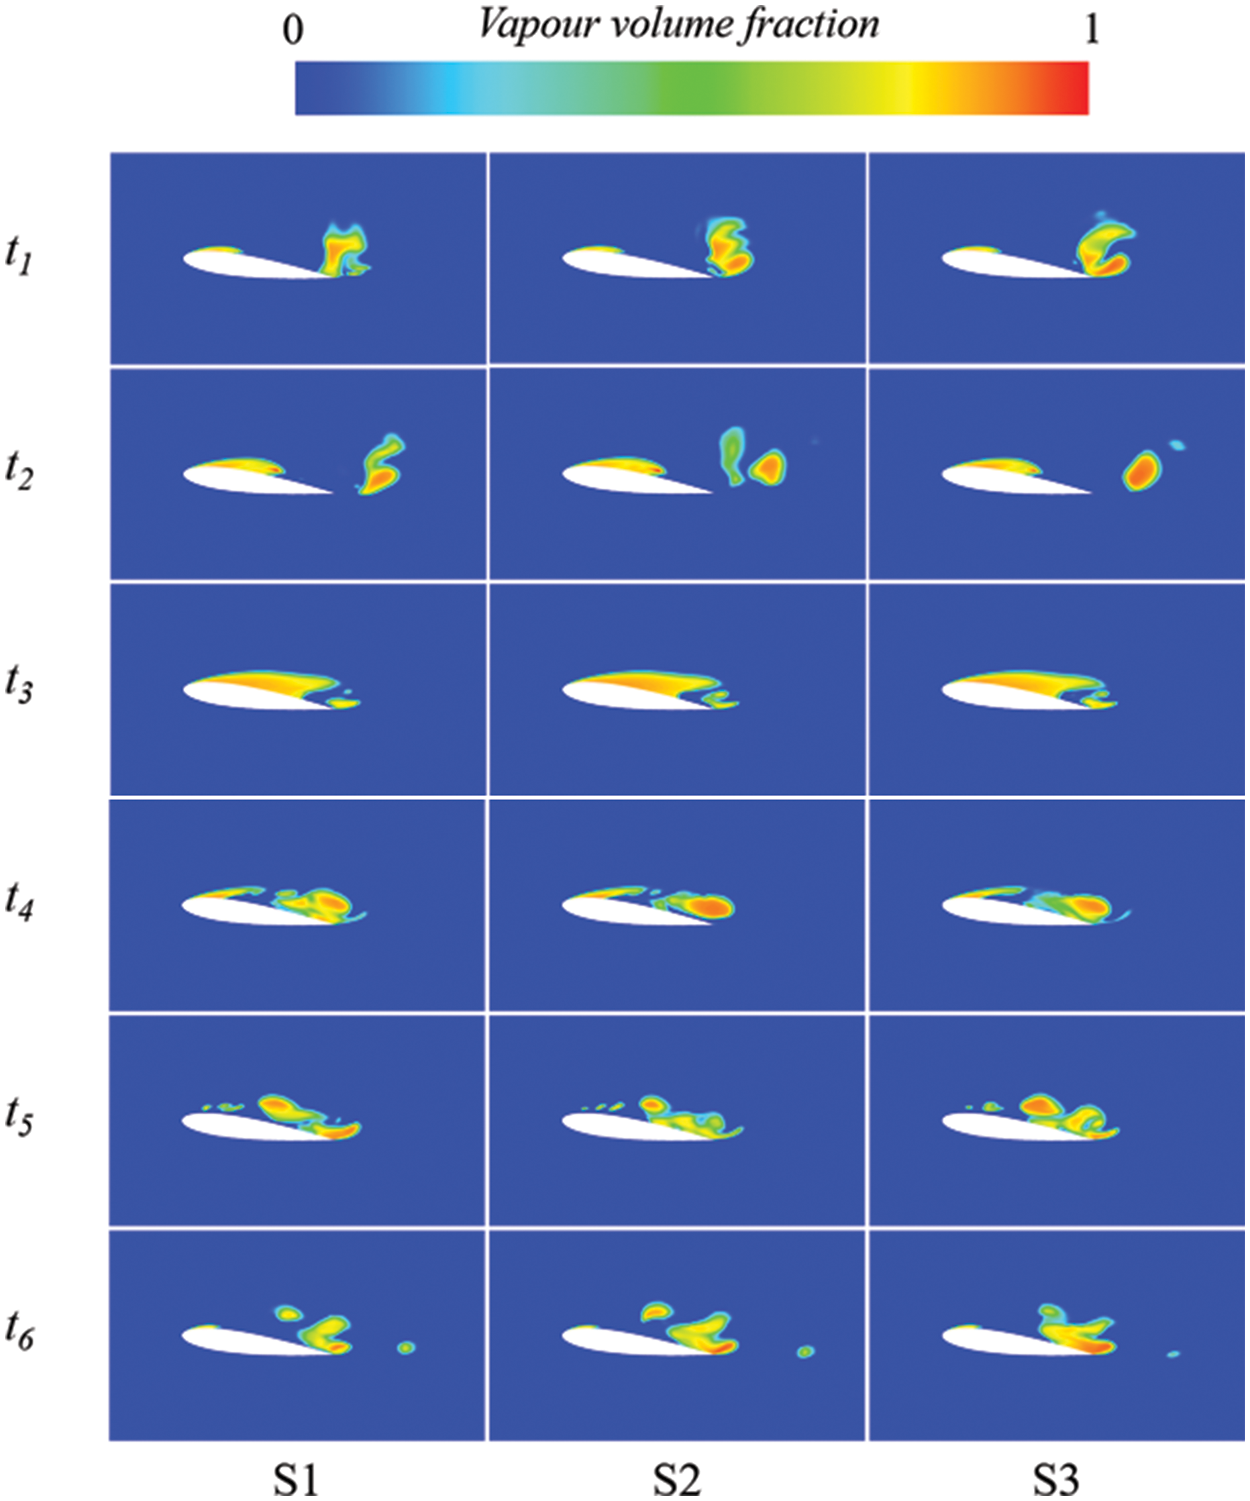
Figure 24: The cavity volume fraction at different sections at six typical instantaneous moments
Fig. 25 illustrates the corresponding pressure coefficient variations. At time t1, the pressure coefficient on the hydrofoil surface abruptly changes near x = 0.4 C, corresponding to where primary cavitation develops at t1 in Fig. 25. Cavitation initiates growth along the leading edge of the hydrofoil, extending to a length of 0.4 C. At time t2, the pressure coefficient on the hydrofoil surface undergoes significant change near x = 0.7 C. At this point, cavitation continues to expand, with the attached cavitation length reaching 0.7 C. At time t3, since cavitation nearly covers the entire hydrofoil surface without any obvious fracture, the pressure coefficient on the hydrofoil surface changes slightly, with no significant sudden change. Therefore, from time t1 to t3, the pressure coefficient on the hydrofoil surface remains in a state of continuous development, with no signs of detachment, indicating a non-shedding mode. At time t4, the pressure coefficient on the hydrofoil sur-face exhibits multiple small fluctuations between x = 0.2 to 0.6 C. This is attributed to the cloud-like cavitation on the hydrofoil surface beginning to rupture, forming several small free bubbles. Although cavitations start to rupture and disintegrate, the hydrofoil surface remains enveloped by the gas phase, resulting in relatively small fluctuation amplitudes in the pressure coefficient. This marks the onset of partial shedding of cavities between times t3 and t4. At time t5, the pressure coefficient on the hydrofoil surface fluctuates significantly, primarily at the leading edge and middle position of the hydrofoil. At this point, cavitation completely separates from the hydrofoil surface at the leading edge, while the bubbles breaking away from the middle of the hydrofoil also start to collapse and disintegrate, gradually descending downward. This signifies a complete shedding mode, with all bubbles detached from the hydrofoil surface. At time t6, the cavitation clusters that were shed continued downstream, and a new cycle of primary cavitation began forming on the hydrofoil surface.
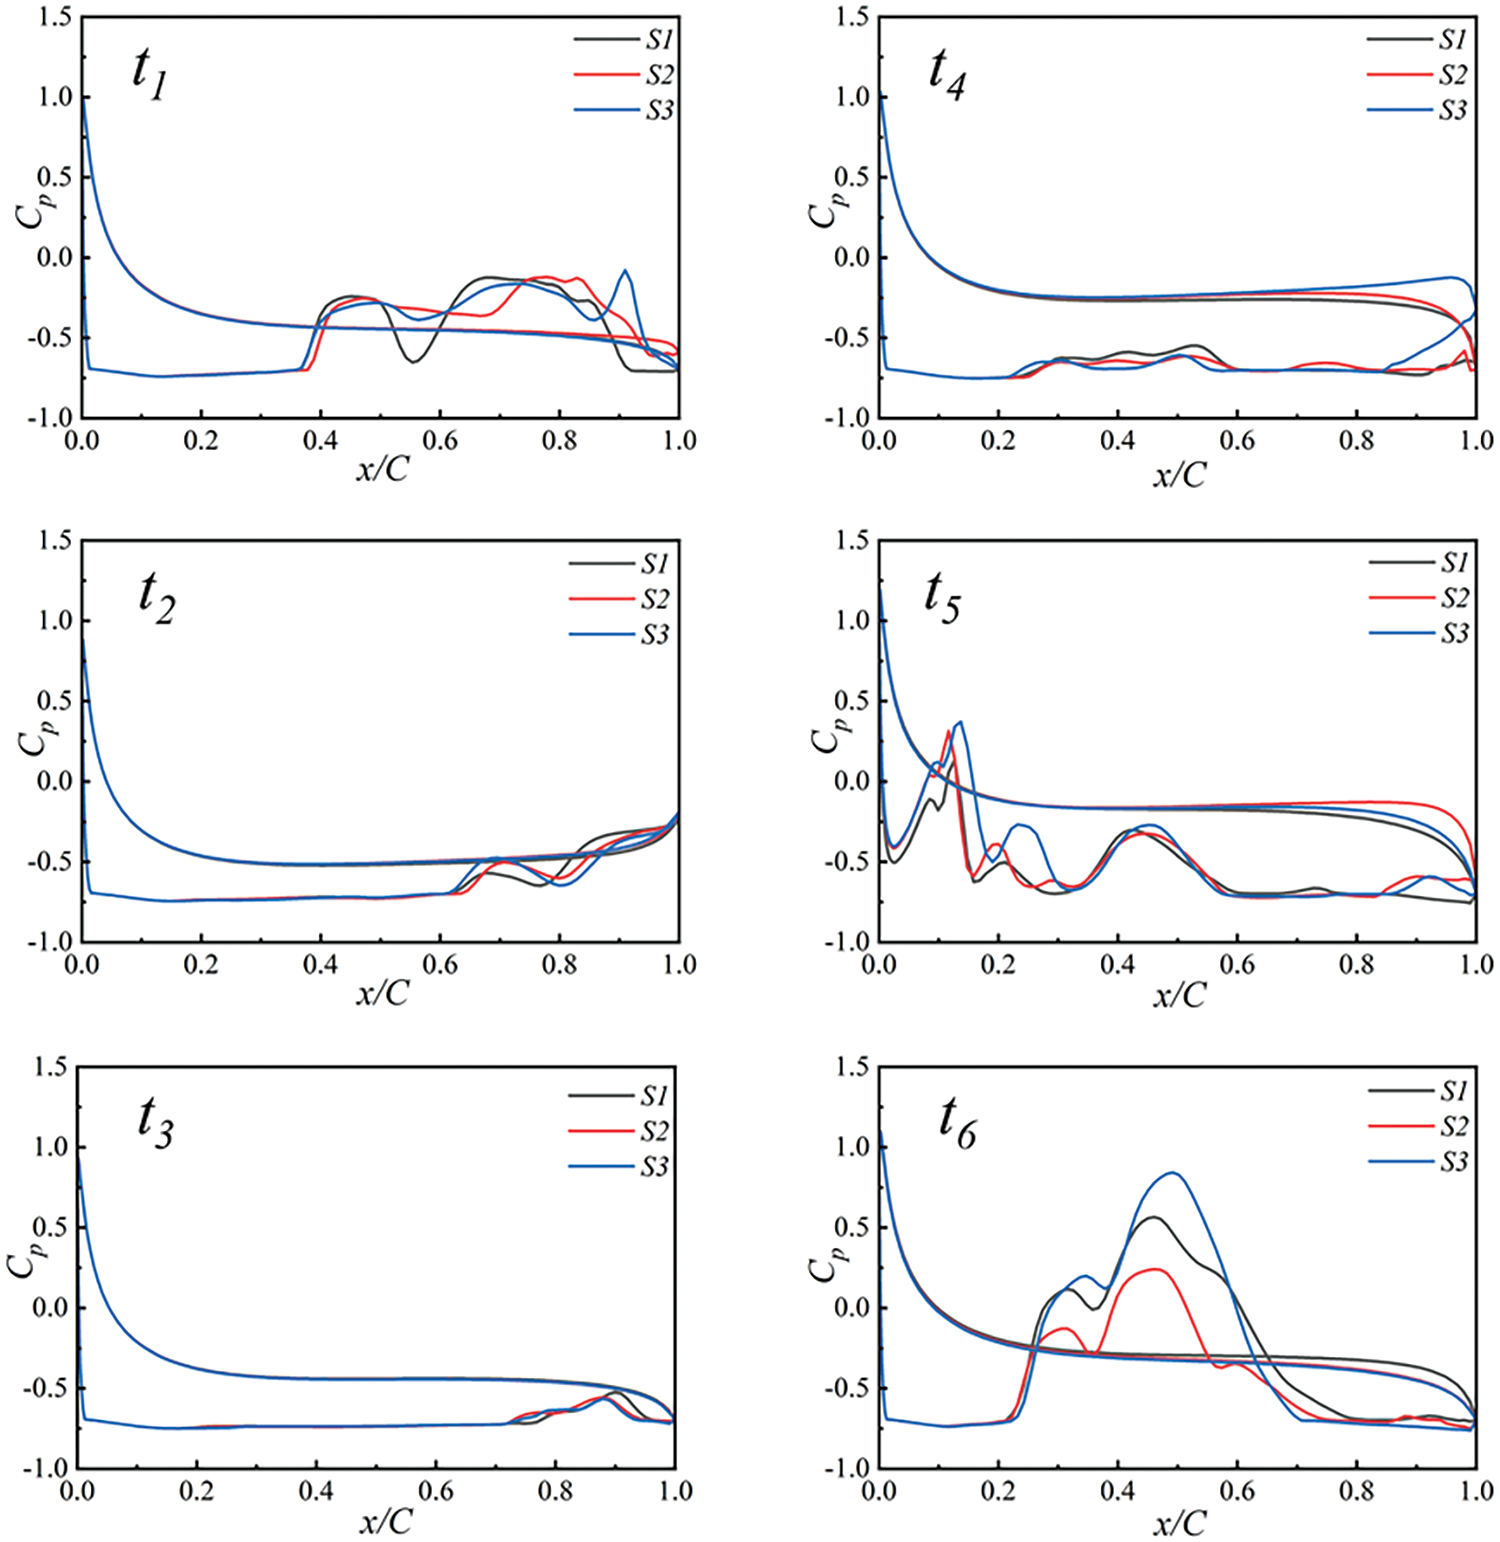
Figure 25: Distribution of pressure coefficients at different cross-sections at six typical instants
Figs. 26 to 29 depict the distribution of vortex Ω value, VST, VDT, and BTT across three cross-sections of hydrofoil, along with cavitation changes. In this process, based on the distribution of Ω values, the vortex and the VST in vorticity transport remain consistent. As large-scale cloud-like cavitation emerges on the hydrofoil surface, the vortex structure becomes more complex. The alternations between positive and negative values of the VST occur more frequently. Moreover, with the increasing incoming flow velocity, the VDT shows a more pronounced alternation between positive and negative values, thereby increasing their influence in this working condition. As for the BTT, it continues to operate at the gas-liquid interface.
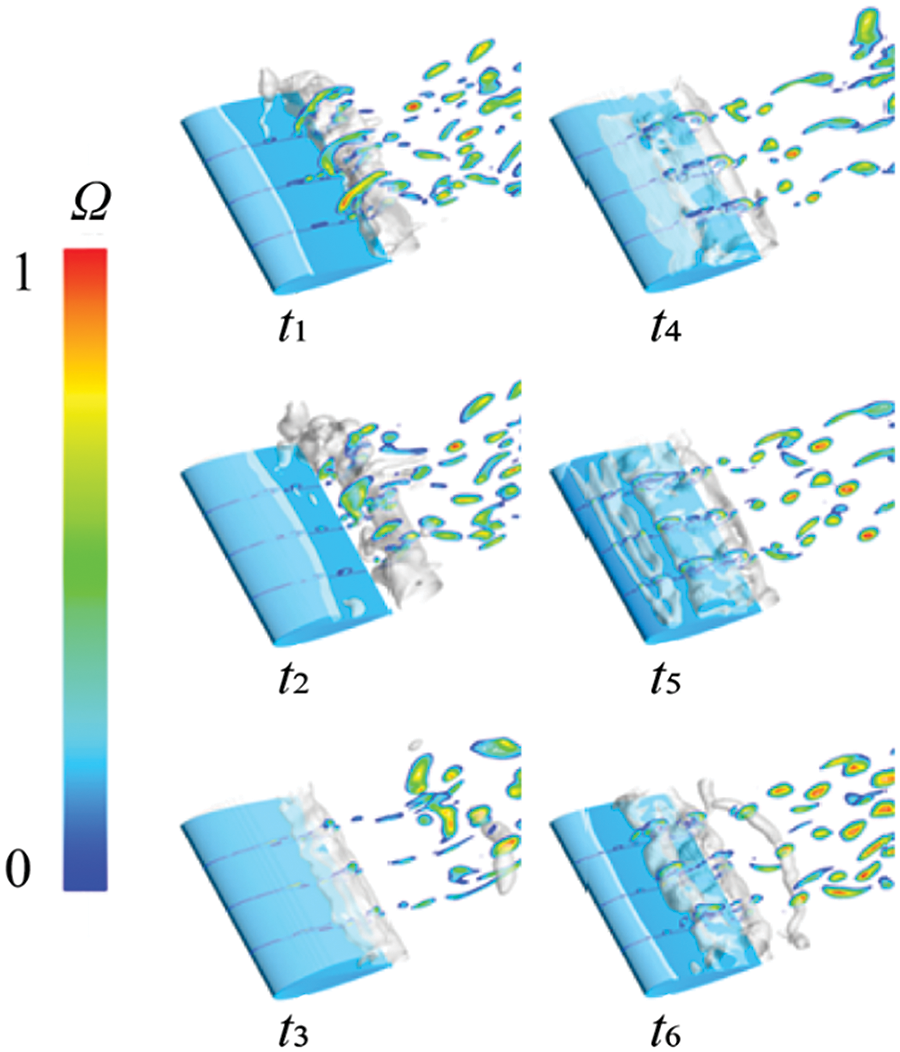
Figure 26: Distribution of Ω values at different sections at different times
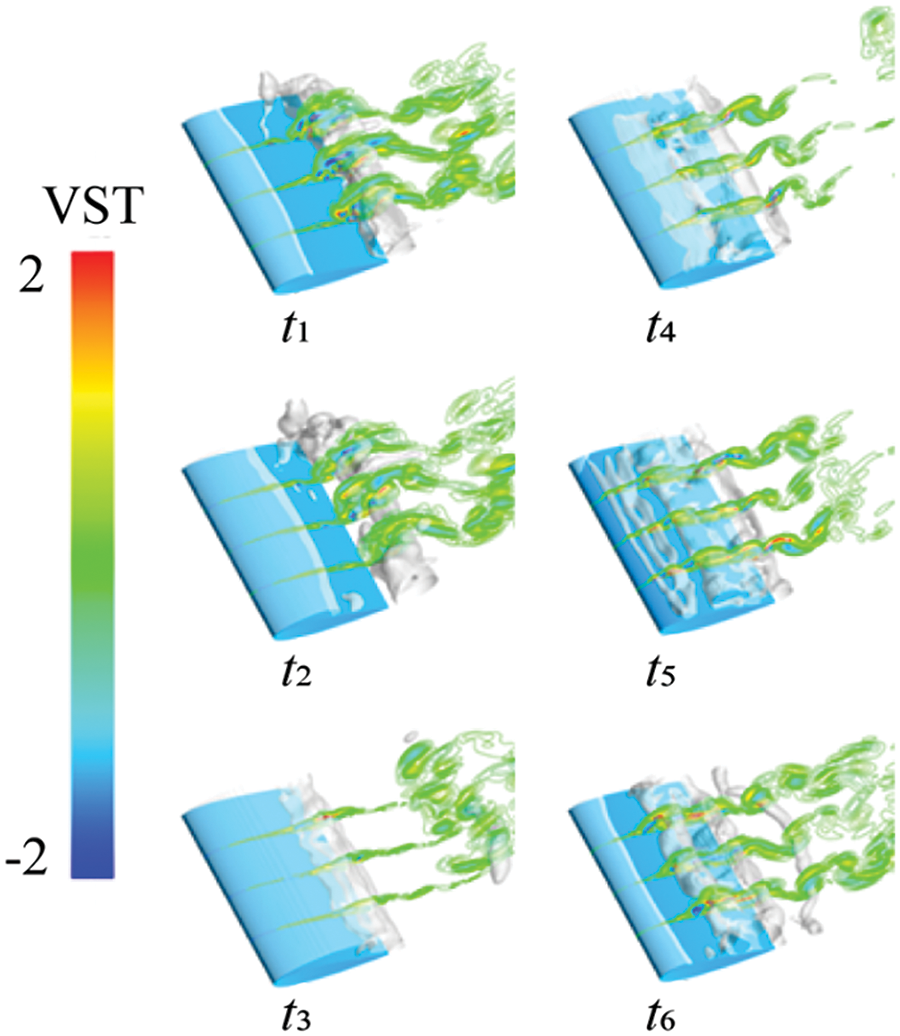
Figure 27: Vortex stretch term contours at different cross sections at different times
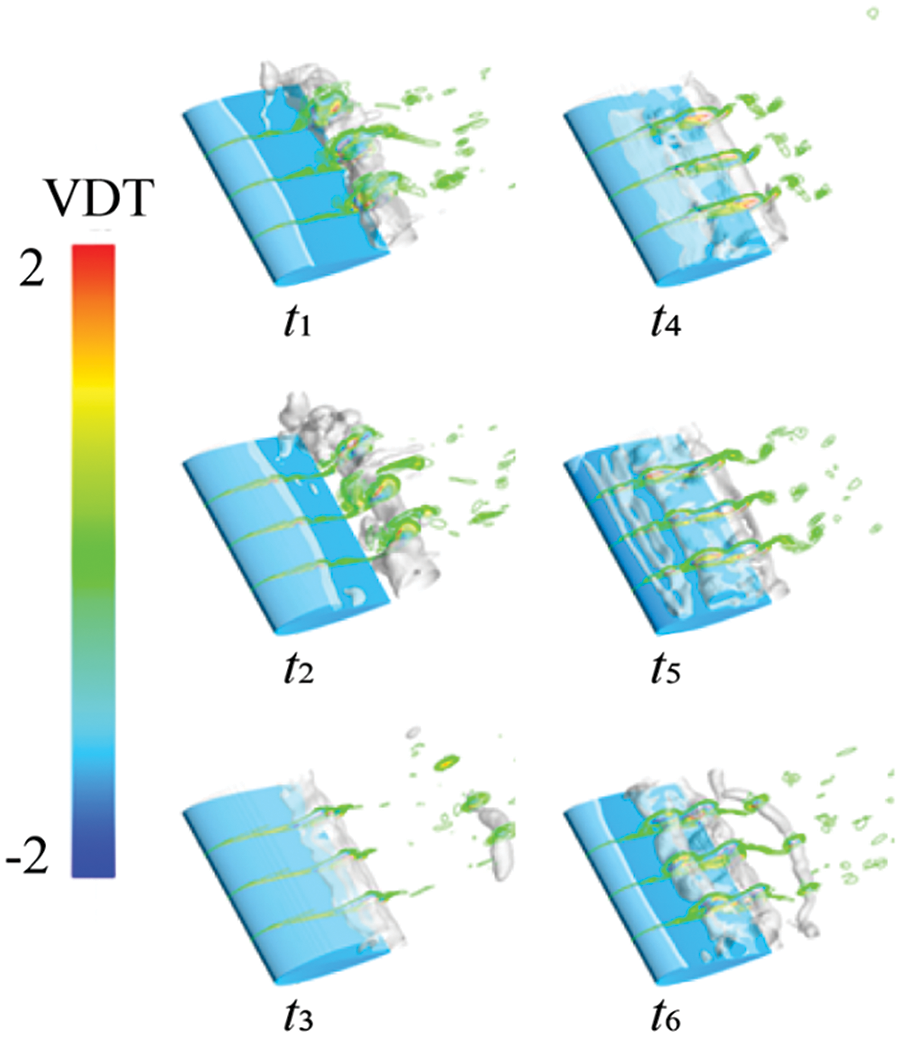
Figure 28: Vortex dilatation term contours at different cross sections at different times
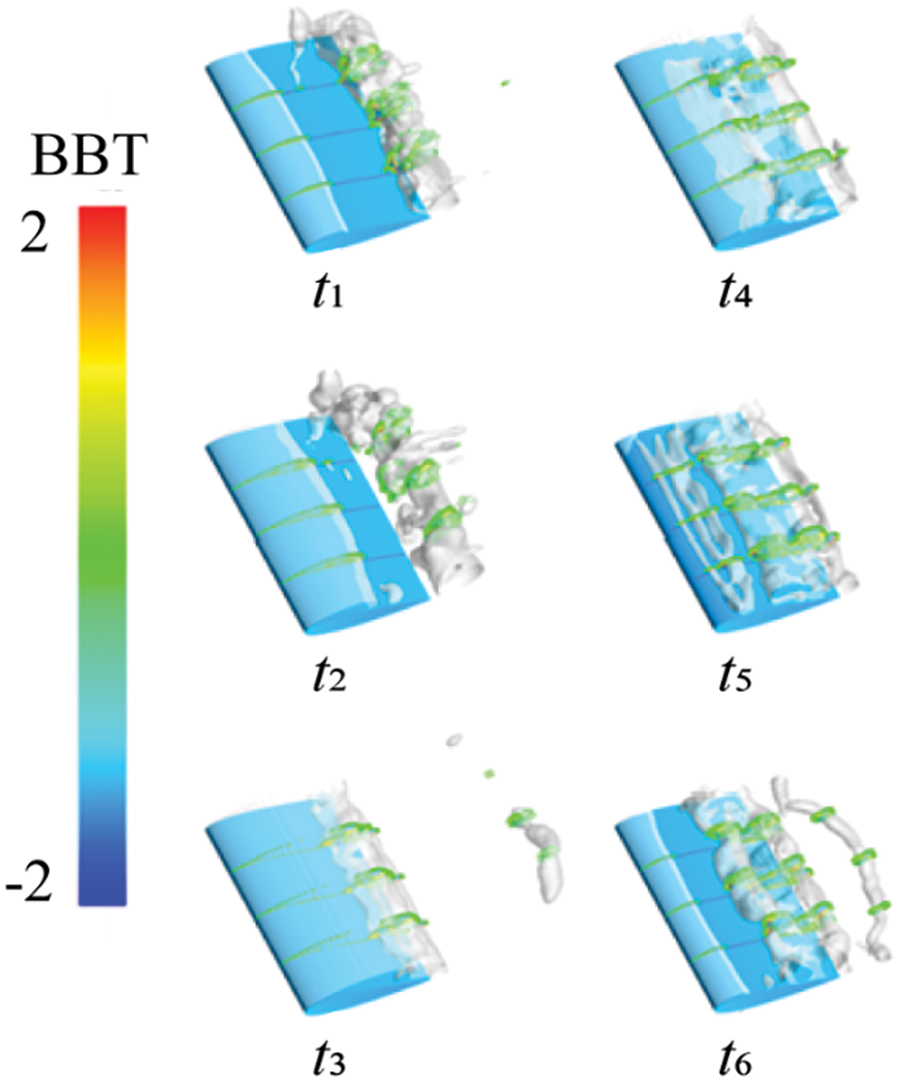
Figure 29: The baroclinic torque contours at different cross sections at different times
4.2.4 Evaluation of the Effect of Incoming Flow Velocity on Cavitation Characteristics around Hydrofoils
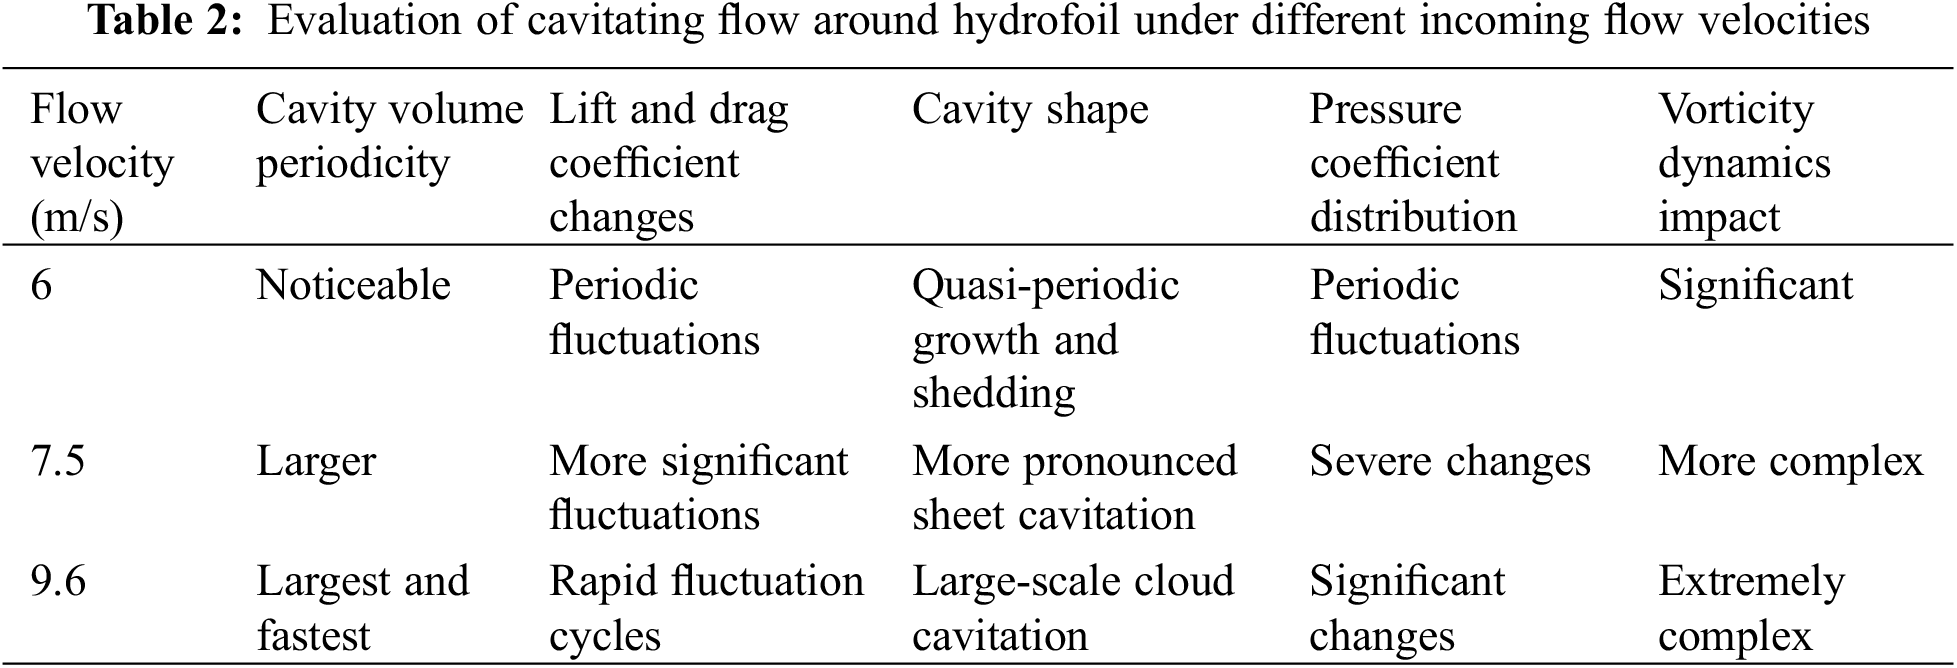
In Sections 4.2.1–4.2.3, the cavitating flows around hydrofoil are analyzed under different incoming flow velocities (6, 7.5, 9.6 m/s). This section will integrate the above results to comprehensively evaluate and analyze the impact of varying incoming flow velocities on the cavitating flow around hydrofoil.
The results indicate that at a flow rate of 6 m/s, cavitation demonstrates a quasi-periodic growth and shedding process. Initially, cavitation starts at the leading edge of the hydrofoil, then gradually expands backward before falling off. At 7.5 m/s, the growth and shedding process of cavitation remain quasi-periodic, but the maximum length of the bubbles increases to 0.5 to 1.0 C, displaying more pronounced sheet cavitation characteristics. At 9.6 m/s, cavitation covers the entire hydrofoil surface, exhibiting a faster quasi-periodic growth and shedding rate compared to the previous two conditions. Additionally, the cavitation volume is significantly larger. Across the three conditions, the morphology and shedding mode of cavitation vary on the cross-section. Particularly at higher flow rates, the three-dimensional characteristics of cavitation become more prominent.
At low incoming flow velocities (6 m/s), vorticity changes are primarily influenced by the VST, which significantly affects vorticity alterations. As the incoming flow velocity increases to 7.5 and 9.6 m/s, the impact of the VDT and the BTT intensifies, particularly within and around cavitation formations. This suggests that fluid compressibility and density gradient alterations affect the vortex, especially at higher flow rates. Table 2 provides a comprehensive evaluation of cavitating flow around hydrofoil under different in-coming flow velocities.
This study simulated the transient cavitating flow around a NACA0015 hydrofoil using the FBDCM turbulence model and the modified Zwart cavitation model. It analyzed the unsteady cavitation characteristics of the thermal fluid around the hydrofoil under various incoming flow velocities and systematically explained the cavitation evolution and vortex dynamics under each flow velocity. The main conclusions are as follows:
1. As the incoming flow velocity increases, different cavitation development processes emerge in the flow field. At an inflow speed of 6 m/s, the maximum length of cavitation attached to the hydrofoil surface is less than 0.5 C. During this process, there are only two shedding modes of cavitation: no shedding mode and partial shedding mode. When the flow speed increases to 7.5 m/s, the maximum length of cavitation development ranges between 0.5 and 1.0 C. At an incoming flow speed of 9.6 m/s, cavitation development covers the entire hydrofoil surface, forming a more prominent large-scale cloud-like cavitation. Under these two speed conditions (7.5 and 9.6 m/s), cavitation appears in three modes: no shedding, partial shedding, and complete shedding.
2. Throughout the entire cavitation process, the VST consistently align with the vortex distribution and predominantly facilitate vortex transport. Conversely, the VDT mainly reside within cavitation bubbles, playing a minor role in vorticity transport. However, their influence intensifies as the incoming flow velocity increases. The BTT, smaller than the first two, primarily resides at the gas-liquid interface and during cavitation breakage, serving as the third source of vorticity transport.
3. The pressure distribution varies with different cavitation modes. By monitoring the pressure distribution on the surface of hydraulic machinery blades, the severity of cavitation can be assessed, offering a useful reference for cavitation monitoring.
Acknowledgement: The authors are grateful to the anonymous reviewers for their critical and constructive review of the manuscript.
Funding Statement: The authors received no specific funding for this study.
Author Contributions: Conceptualization, Shande Li, Wen’an Zhong, and Shaoxing Yu; methodology, Hao Wang; software, Hao Wang; validation, Shande Li, Wen’an Zhong, and Shaoxing Yu; formal analysis, Hao Wang; investigation, Shande Li, Wen’an Zhong, and Shaoxing Yu; resources, Shande Li, Wen’an Zhong, and Shaoxing Yu; data curation, Hao Wang; writing—original draft preparation, Shande Li; writing—review and editing, Hao Wang; visualization, Hao Wang; supervision, Hao Wang; project administration, Hao Wang. All authors reviewed the results and approved the final version of the manuscript.
Availability of Data and Materials: The data presented in this study are available on request from the corresponding author.
Ethics Approval: Not applicable.
Conflicts of Interest: The authors declare no known competing financial interests or personal relationships that could have appeared to influence the work reported in this paper.
References
1. Folden TS, Aschmoneit FJ. A classification and review of cavitation models with an emphasis on physical aspects of cavitation. Phys Fluids. 2023;35(8):081301. [Google Scholar]
2. Choi K, Kim S, Kim H, Kim C. Computational investigation on the non-isothermal phase change during cavitation bubble pulsations. Ocean Eng. 2023;285:115414. [Google Scholar]
3. Hofmann J, Thiébaut C, Riondet M, Lhuissier P, Gaudion S, Fivel M. Comparison of acoustic and hydrodynamic cavitation: material point of view. Phys Fluids. 2023;35(1):017112. [Google Scholar]
4. Park C, Do Kim G, Yim GT, Park Y, Moon I. A validation study of the model test method for propeller cavitation noise prediction. Ocean Eng. 2020;213:107655. [Google Scholar]
5. Yusuf L, Symes MD, Prentice P. Characterising the cavitation activity generated by an ultrasonic horn at varying tip-vibration amplitudes. Ultrason Sonochem. 2021;70:105273. [Google Scholar] [PubMed]
6. Kirschner O, Riedelbauch S. Cavitation detection in hydraulic machinery by analyzing acoustic emissions under strong domain shifts using neural networks. Phys Fluids. 2023;35(2):027128. [Google Scholar]
7. Kadivar E, Lin Y, el Moctar O. Experimental investigation of the effects of cavitation control on the dynamics of cavitating flows around a circular cylinder. Ocean Eng. 2023;286(12):115634. doi:10.1016/j.oceaneng.2023.115634. [Google Scholar] [CrossRef]
8. Zaresharif M, Ravelet F, Kinahan DJ, Delaure Y. Cavitation control using passive flow control techniques. Phy Fluids. 2021;33(12):121301. [Google Scholar]
9. Ullas P, Chatterjee D, Vengadesan S. Prediction of unsteady, internal turbulent cavitating flow using dynamic cavitation model. Int J Numer Methods Heat Fluid Flow. 2022;32(10):3210–32. doi:10.1108/HFF-09-2021-0600. [Google Scholar] [CrossRef]
10. Darbhamulla NB, Jaiman RK. A finite element framework for fluid-structure interaction of turbulent cavitating flows with flexible structures. Comput Fluids. 2024;277(4):106283. doi:10.1016/j.compfluid.2024.106283. [Google Scholar] [CrossRef]
11. Szantyr J, Flaszyński P, Tesch K, Suchecki W, Alabrudziński S. An experimental and numerical study of tip vortex cavitation. Pol Marit Res. 2012;18(4):14–22. doi:10.2478/v10012-011-0021-z. [Google Scholar] [CrossRef]
12. Tan D, Li Y, Wilkes I, Vagnoni E, Miorini RL, Katz J. Experimental investigation of the role of large scale cavitating vortical structures in performance breakdown of an axial waterjet pump. J Fluid Eng. 2015;137(11):111301. doi:10.1115/1.4030614. [Google Scholar] [CrossRef]
13. Wang Z, Huang B, Zhang M, Wang G. Experimental and numerical investigation of ventilated cavitating flow structures with special emphasis on vortex shedding dynamics. Int J Multiphase Flow. 2018;98(11):79–95. doi:10.1016/j.ijmultiphaseflow.2017.08.014. [Google Scholar] [CrossRef]
14. Liu Y, Huang B, Zhang H, Wu Q, Wang G. Experimental investigation into fluid–structure interaction of cavitating flow. Physi Fluids. 2021;33(9):093307. [Google Scholar]
15. Zhang M, Chen H, Wu Q, Li X, Xiang L, Wang G. Experimental and numerical investigation of cavitating vortical patterns around a Tulin hydrofoil. Ocean Eng. 2019;173(5):298–307. doi:10.1016/j.oceaneng.2018.12.064. [Google Scholar] [CrossRef]
16. Ji B, Luo X, Arndt RE, Wu Y. Numerical simulation of three dimensional cavitation shedding dynamics with special emphasis on cavitation-vortex interaction. Ocean Eng. 2014;87(1):64–77. doi:10.1016/j.oceaneng.2014.05.005. [Google Scholar] [CrossRef]
17. Chen J, Huang B, Liu T, Wang Y, Wang G. Numerical investigation of cavitation-vortex interaction with special emphasis on the multistage shedding process. Appl Math Model. 2021;96(2):111–30. doi:10.1016/j.apm.2021.02.003. [Google Scholar] [CrossRef]
18. De Giorgi MG, Fontanarosa D, Ficarella A. CFD data of unsteady cavitation around a hydrofoil, based on an extended Schnerr-Sauer model coupled with a nucleation model. Data Brief. 2019;25(2):104226. doi:10.1016/j.dib.2019.104226. [Google Scholar] [PubMed] [CrossRef]
19. Ge M, Petkovšek M, Zhang G, Jacobs D, Coutier-Delgosha O. Cavitation dynamics and thermodynamic effects at elevated temperatures in a small Venturi channel. Int J Heat Mass Transf. 2021;170(39):120970. doi:10.1016/j.ijheatmasstransfer.2021.120970. [Google Scholar] [CrossRef]
20. Xu B, Liu K, Deng J, Liu X, Shen X, Zhang D, et al. Thermodynamic effect on attached cavitation and cavitation-turbulence interaction around a hydrofoil. Ocean Eng. 2023;281(6):114764. doi:10.1016/j.oceaneng.2023.114764. [Google Scholar] [CrossRef]
21. Yu A, Tang Q, Zhou D, Liu J. Entropy production analysis in two-phase cavitation flows with thermodynamic cavitation model. Appl Therm Eng. 2020;171:115099. doi:10.1016/j.applthermaleng.2020.115099. [Google Scholar] [CrossRef]
22. Shen T, Li X, Li L, Wang Z, Liu Y. Evaluation of vorticity forces in thermo-sensitive cavitating flow considering the local compressibility. Int Commun Heat Mass Transf. 2021;120(2):105008. doi:10.1016/j.icheatmasstransfer.2020.105008. [Google Scholar] [CrossRef]
23. Le AD, Truong V-A, Iga Y. Thermodynamic cavitation suppression on the laminar vortex flow over a circular cylinder in water. Int J Heat Mass Transf. 2023;211(2):124210. doi:10.1016/j.ijheatmasstransfer.2023.124210. [Google Scholar] [CrossRef]
24. Liu Y, Li X, Ge M, Li L, Zhu Z. Numerical investigation of transient liquid nitrogen cavitating flows with special emphasis on force evolution and entropy features. Cryogenics. 2021;113(1):103225. doi:10.1016/j.cryogenics.2020.103225. [Google Scholar] [CrossRef]
25. Kelly SB. Experiments in thermosensitive cavitation of a cryogenic rocket propellant surrogate. University of Florida: USA; 2012. [Google Scholar]
26. Lin C, Zhao X, Wang Z, Cheng H, Wang C, Ji B. Large eddy simulations of sheet-to-cloud cavitation transitions with special emphasis on the simultaneous existence of the re-entrant jet and shock waves. J Turbul. 2024;25(4–6):157–80. doi:10.1080/14685248.2024.2350070. [Google Scholar] [CrossRef]
Cite This Article
 Copyright © 2025 The Author(s). Published by Tech Science Press.
This work is licensed under a Creative Commons Attribution 4.0 International License , which permits unrestricted use, distribution, and reproduction in any medium, provided the original work is properly cited.
 Downloads
 Citation Tools