
 Submit a Paper
 Propose a Special lssue
 Open Access
ARTICLE

Molecular Dynamics-Based Simulation of Polyethylene Pipe Degradation in High Temperature and High Pressure Conditions
1 School of Mechanical Engineering, Xinjiang University, Urumqi, 830046, China
2 Xinjiang Yian Special Inspection Engineering Company Limited, Urumqi, 830063, China
3 Xinjiang Uygur Autonomous Region Inspection Institute of Special Equipment, Urumqi, 830000, China
4 Pressure Pipe Department, China Special Equipment Inspection and Research Institute, Beijing, 100013, China
5 Tarim Oilfield Branch Company, Korla, 841000, China
6 Yimai Cai Oil and Gas Management Area, Tarim Oilfield Branch Office, Korla, 841000, China
* Corresponding Author: Yang Wang. Email:
Fluid Dynamics & Materials Processing 2024, 20(9), 2139-2161. https://doi.org/10.32604/fdmp.2024.053941
Received 14 May 2024; Accepted 25 June 2024; Issue published 23 August 2024
 View Full Text
 Download PDF
Abstract
High-density polyethylene (HDPE) pipes have gradually become the first choice for gas networks because of their excellent characteristics. As the use of pipes increases, there will unavoidably be a significant amount of waste generated when the pipes cease their operation life, which, if improperly handled, might result in major environmental contamination issues. In this study, the thermal degradation of polyethylene materials is simulated for different pressures (10, 50, 100, and 150 MPa) and temperatures (2300, 2500, 2700, and 2900 K) in the framework of Reactive Force Field (ReaxFF) molecular dynamics simulation. The main gas products, density, energy, and the mean square displacement with temperature and pressure are also calculated. The findings indicate that raising the temperature leads to an increase in the production of gas products, while changing the pressure has an impact on the direction in which the products are generated; the faster the temperature drops, the less dense the air; both temperature and pressure increase impact the system’s energy conversion or distribution mechanism, changing the system’s potential energy as well as its total energy; the rate at which molecules diffuse increases with temperature, and decreases with pressure. The results of this investigation provide a theoretical basis for the development of the pyrolytic treatment of polyethylene waste materials.Keywords
Natural gas systems frequently employ HDPE pipes due to their excellent mechanical qualities, resistance to chemicals, and simplicity of installation. These days, HDPE is used to construct more than 90% of newly constructed natural gas piping systems [1]. As a result, HDPE has become the most common type of pipe used in natural gas pipeline systems. It’s been nearly 60 years since DuPont Company put polyethylene pipelines to work on a large scale to transport natural gas [2], and today millions of kilometers of polyethylene pipelines carry natural gas around the world. However, the widespread usage of polymer materials would undoubtedly result in a significant waste output, and these days, the environmental issues brought on by polymer solid waste are the main source of concern for people all over the world. The main treatment methods for solid waste are landfills, incineration, and pyrolysis. The landfill method is capable of disposing of solid waste, but the efficiency of resource utilization and reuse of waste is very low, while the incineration method has certain limitations due to the complexity of the process, the large investment, and the high cost of equipment loss and maintenance and operation. Pyrolysis by pyrolysis of plastic waste at high temperatures can effectively recycle originally difficult-to-reuse polymer materials so that it is converted into fuel or valuable chemicals [3]. The sustainable utilization of resources can be better achieved. The majority of the time, polyethylene pyrolysis is controlled experimentally. Font et al. [4] studied the fluctuation of semivolatile and hazardous chemicals created during the thermal cracking of polyethylene at temperatures ranging from 600 to 900 degrees Celsius, as well as the behavior of various compounds during thermal decomposition. Roy et al. [5] examined the thermal breakdown of low-density polyethylene in nitrogen and air conditions. The analysis of derivative thermogravimetric (DTG) curves revealed that polyethylene degradation occurs in a single or many phases via different processes in the two environments. It was also discovered that temperature has a considerable influence on thermal breakdown. Thermal decomposition in air conditions is a more complex occurrence, with a range of chemicals formed depending on the reaction mechanism, including but not limited to peroxides, acids, and alcohols. Mo et al. [6] used thermogravimetric analysis and the technique of differential scanning calorimetry to explore the thermally broken down features and kinetics of cross-linked polyethylene insulation, and their findings confirmed the presence of CO2 and H2O in the gaseous products formed by pyrolysis. Xue et al. [7] explored the co-pyrolysis of red oak and high-density polyethylene and found that this combination enhanced the generation of light hydrocarbon gases and inhibited the pyrolysis of red oak, reducing the generation of char. Du et al. [8] used differential scanning calorimetry (DSC) and fourier transform infrared spectroscopy (FTIR) spectroscopy to show that the principal pyrolysis products of irradiation crosslinked polyethylene were olefins. Kumari et al. [9] pyrolyzed polyethylene at 410°C–430°C and 11–36 bar and showed that high pressure resulted in less olefins and more isoalkanes, cyclic and aromatic hydrocarbons. The study’s findings revealed that high-pressure polyethylene disintegration produced fewer olefins while producing more isomeric alkanes, cyclic hydrocarbons, and aromatic hydrocarbons. Honus et al. [10] investigated the gases and gas characteristics produced by polyethylene at temperatures of 500°C, 700°C, and 900°C, characterizing 24 gases and comparing the results to those obtained from traditional fuels such as natural gas (NG) and propane. Cheng et al. [11] examined the distribution of polyethylene pyrolysis products under high-pressure settings, and their findings revealed that high pressure improves the chemical composition and product qualities of pyrolysis oils closer to fuel standards.
However, the majority of the experimental work must be performed at high temperatures, and the results are very dependent on the settings, making the investigation of reaction pathways in PE heat treatment unsuitable. Experimental research has made major contributions to understanding the degradation mechanism, yet there are limitations: The degradation process takes time, and the complicated chemical interactions are difficult to investigate in detail at the macroscopic size, and the physical and chemical events that occur during thermal decomposition are so complicated [12] that experimental approaches cannot accurately record atomic-scale variations. Because molecular simulation techniques may directly see the specifics of chemical reactions at the atomic level, something that cannot be achieved using experimental methods, they have been increasingly popular in pyrolysis investigations in recent years [13]. Mastral et al. [14] rebuilt PE and other plastics, created a molecular-level dynamic system for polymeric gasification and examined the critical functions of H-extraction and β-breakage in PE pyrolysis polymerization. Ramin et al. [15] explored the thermal degradation process of polyethylene from 27 to 1550 degrees Celsius, and the results revealed that the degradation process of polyethylene is significantly accelerated at temperatures above 1100 degrees Celsius, and a large amount of reducing gases are produced. Liu et al. [16] found that the main pyrolysis processes for polyethylene are end-chain breakage, dehydrogenation, and dehydrogenation, among others. They also used ReaxFF MD simulations to compute the yields of the key components and assess the overall kinetics of macromolecular breakage, resulting in a trend in the evolution of the products that was consistent with tests and literature. Wang et al. [17] used ReaxFF computational models to investigate the mechanism and combined pyrolysis of cellulose and polyethylene. The outcomes demonstrated that the presence of polyethylene greatly improved the products’ quality and that combined pyrolysis led to the production of alcoholic and hydrocarbon products. Hong et al. [18] employed ReaxFF to study the polyethylene and polystyrene co-pyrolysis of coal at Jundong. The results showed that while polyethylene has the opposite impact on coal, coal stimulates polyethylene pyrolysis at low temperatures but has no effect at high temperatures. Chen et al. [19] used MD modeling using ReaxFF to characterize the whole pyrolysis process of three polymeric materials: HDPE, polymethyl methacrylate (PMMA), and high-impact polystyrene (HIPS). They discovered that all three polymeric materials generated fuel gases with alkane groups and that these fuel gases could all function as sources of fire. Kong et al. [20] studied the use of the ReaxFF modeling and simulation technique for the pyrolysis of cross-linked polyethylene, finding quantitative gas product distributions and showing the gas formation mechanism. In conclusion, past research has significantly expanded the application of ReaxFF MD simulations in polymer pyrolysis, while emphasizing the significance of molecular dynamics as a paradigm for explaining chemical reaction processes in polymer pyrolysis.
The main objective of this study is to investigate the effects of different temperatures and pressures on the degradation of polyethylene using ReaxFF molecular dynamics simulations. The main gas products, density, energy, and mean square displacement changes during degradation are described in detail, and the effects of temperature and pressure on these changes are investigated. With the addition of the pressure factor to the previous study of only the effect of temperature on the degradation of polyethylene materials, an understanding of the degradation of polyethylene at different temperatures and pressures will contribute to a better understanding of the pyrolysis engineering of polymeric solid wastes.
The molecular dynamics simulation was run for around 12 days with 2500 HDPE atoms to maximize efficiency while conserving computer resources. The temperature range for the simulation was 2300–2900 K. An increase in simulation temperature would help to observe slow and chemically likely reactions at lower temperatures in the picosecond simulation range. To enable the observation of thermal degradation processes within an appropriate simulation period, the high-temperature setting guaranteed enough atomic mobility and molecular collisions to speed up the reaction rate and reduce the simulation duration [21]. The simulation system uses periodic boundary conditions with the time step set to 0.25 fs, without considering the environment of the polyethylene chain. The initial model is shown in Fig. 1, a relaxation process of 25 ps was carried out to allow the simulated system to gradually converge to an equilibrium state, which enables the stability and nature of the system to be investigated and ensures that the results obtained are more accurate and reliable. In addition, VelocityVerlet time integration [22] and Nose-Hoover temperature and pressure control methods [23] were used to perform simulations up to 250 ps at four different temperatures (2300, 2500, 2700, and 2900 K) with four different pressures (10, 50, 100, and 150 MPa).
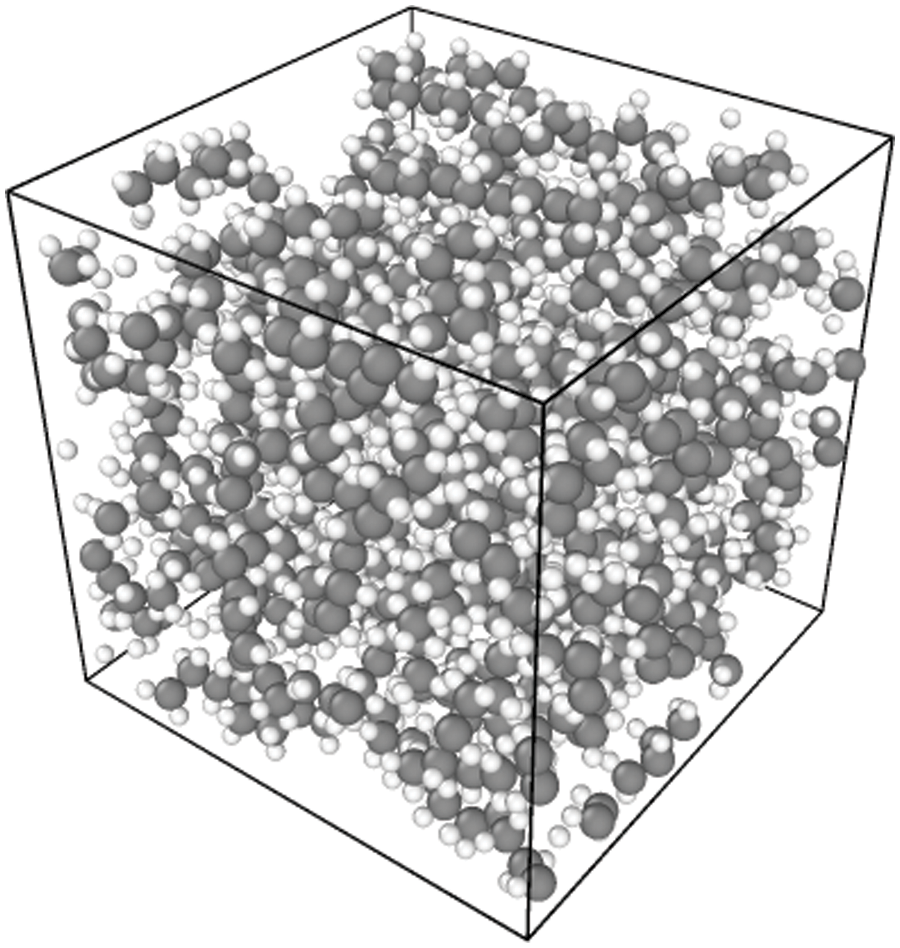
Figure 1: Initial model (Carbon atoms in gray and hydrogen atoms in white)
Atomic-scale computational techniques are now powerful tools for the in-depth study of material properties and chemical reactions, thanks to the advancements in computer science and quantum mechanics. Quantum mechanics (QM), while capable of producing results with high precision, is constrained by its high computational cost [24]. ReaxFF was developed specifically to address these issues, retaining almost the accuracy of QM but allowing MD to be computed at almost as low a cost as a simple force field. The process of HDPE thermal deterioration was examined using Reactive Molecular Dynamics Simulations. ReaxFF, a bond level-based reaction field developed by van Duin et al. [25] in 2001, allows for the explicit description of chemical reactions in complex systems as well as the characterization of general relationships between bond distances and bond levels and between bond levels and bond energies.
where F is the acting force, and the unit is N;
The following equation describes the total system energy in ReaxFF [19]:
where
4 Simulation Results and Discussion
4.1 Distribution of Important Products
The gaseous products of high-pressure, high-temperature degradation, methane, ethylene, acetylene, ethane, propane, propylene, and a small number of alkyl groups (methyl and ethyl), were simulated during the simulation process; however, because the generation of alkyl groups is relatively small, only some of the products generated in a large amount of product generation is selected. Figs. 2–5 show the changes in the main products with increasing temperature at 10, 50, 100, and 150 MPa, respectively. As can be seen in Figs. 2 to 9, the main products simulated under these conditions are hydrogen, methane, ethylene, acetylene, and ethane. The analysis shows that at 10, 50, 100, and 150 MPa, the trends of hydrogen, methane, ethylene, acetylene, and ethane production with increasing temperatures are the same, and this result shows that the simulations carried out have a high degree of accuracy. In the simulated system, when the pressure is kept stable, the generation of hydrogen, methane, acetylene, and ethane increases gradually with the increase in temperature, and at 2300 K, the generation of hydrogen, methane, acetylene and ethane is relatively small, and with the continuous increase of temperature, when it reaches 2500 K, the trend of the growth of hydrogen and acetylene is more obvious, which corresponds to the further decomposition of the pyrolysate of HDPE. Methane and ethane grew modestly and remained relatively stable. Ethylene is produced in large quantities at 2300 K and peaks around 2500 K and is the dominant product in this temperature range. As the temperature rises, there is a tendency for the production of ethylene to decrease, probably because of the longer period of high temperature; ethylene begins to convert others into small molecule gases, and the rapid growth of hydrogen and acetylene is observed in this process, so it is hypothesized that the ethylene should be converted into a small amount of C1-4 hydrocarbons.
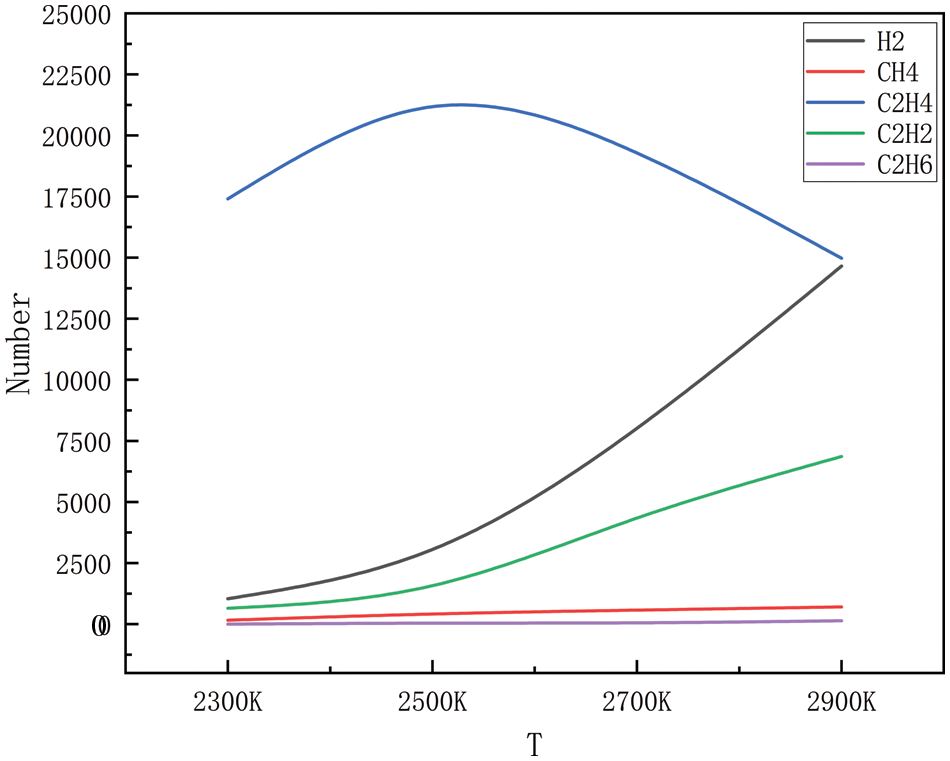
Figure 2: Dispersion of the product at various temperatures at 10 MPa
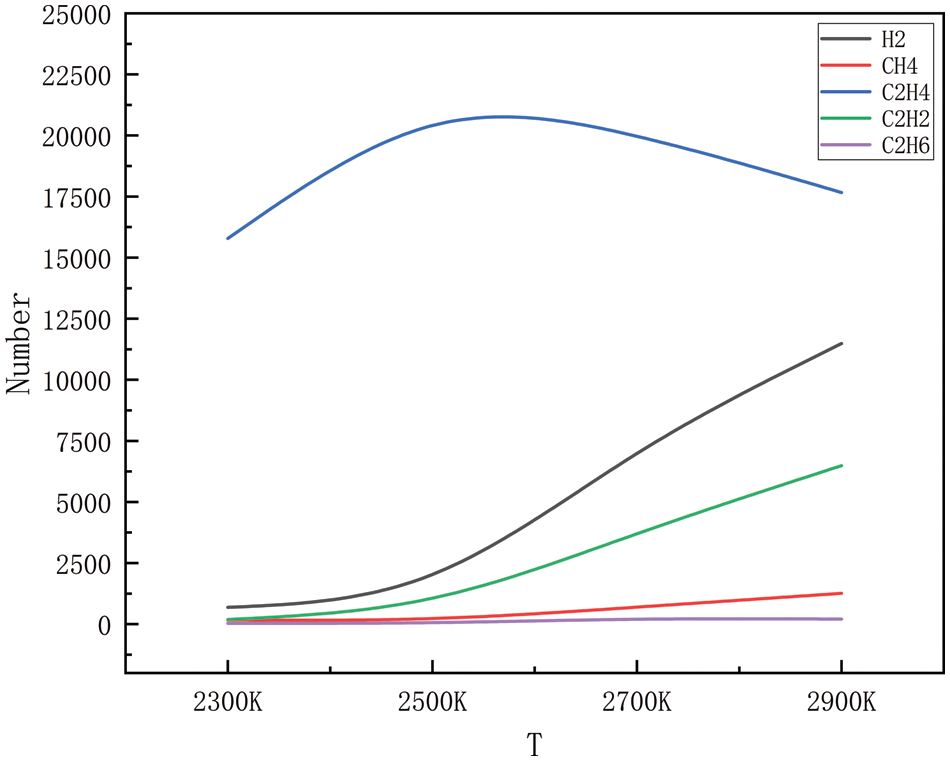
Figure 3: Dispersion of the product at various temperatures at 50 MPa
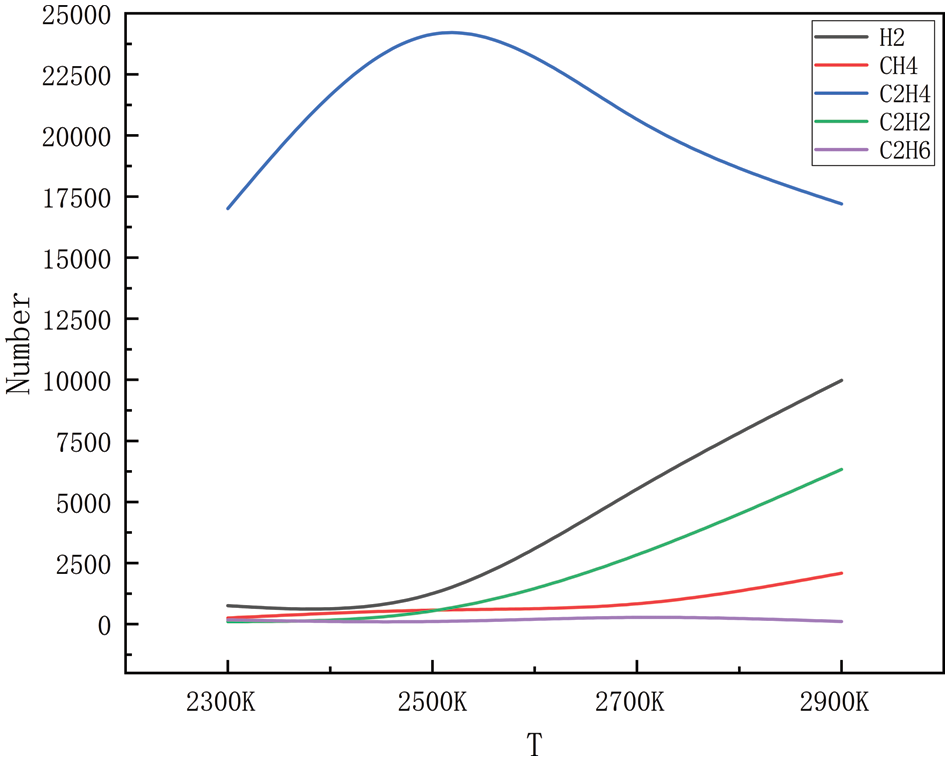
Figure 4: Dispersion of the product at various temperatures at 100 MPa
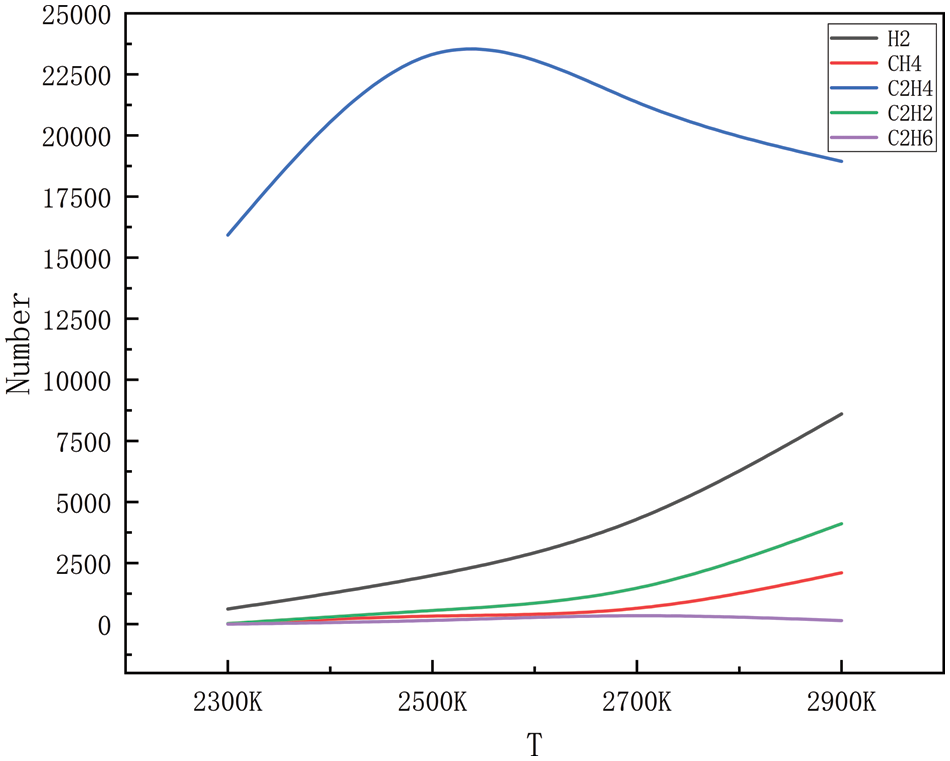
Figure 5: Dispersion of the product at various temperatures at 150 MPa
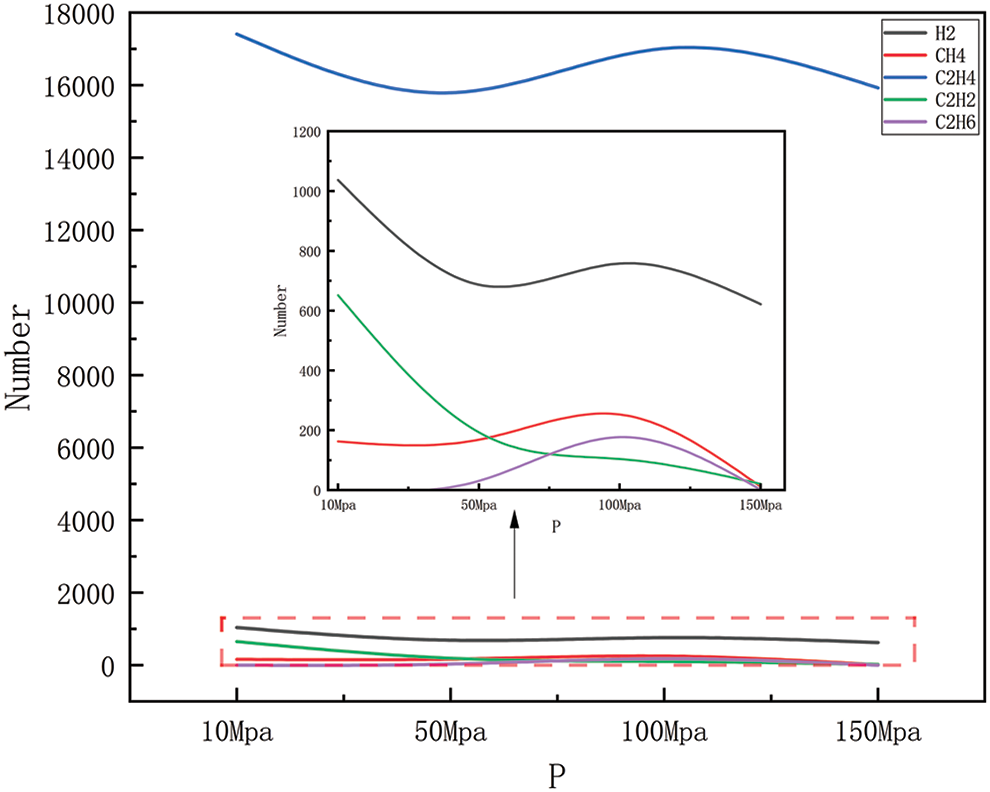
Figure 6: Product distribution at 2300 K for different pressures
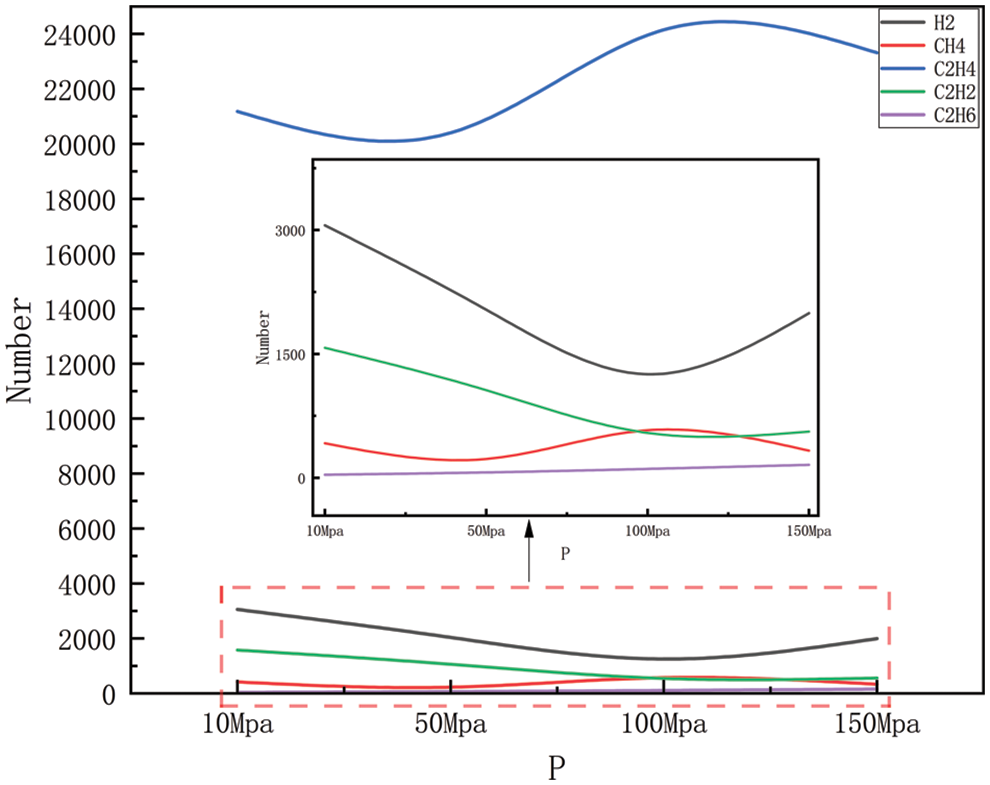
Figure 7: Product distribution at 2500 K for different pressures
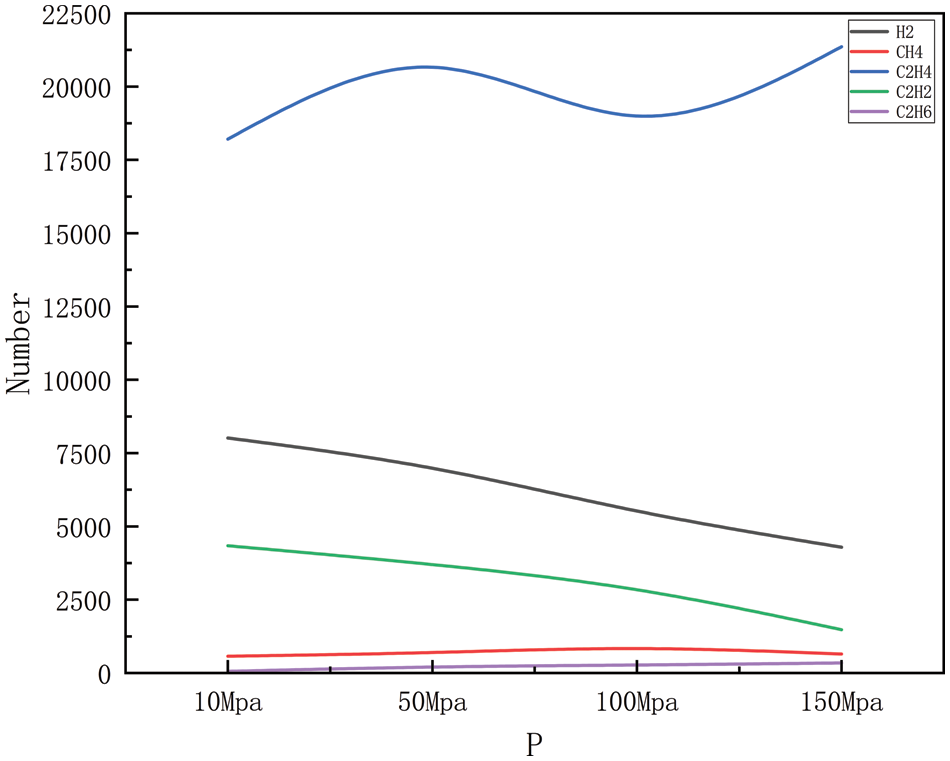
Figure 8: Product distribution at 2700 K for different pressures
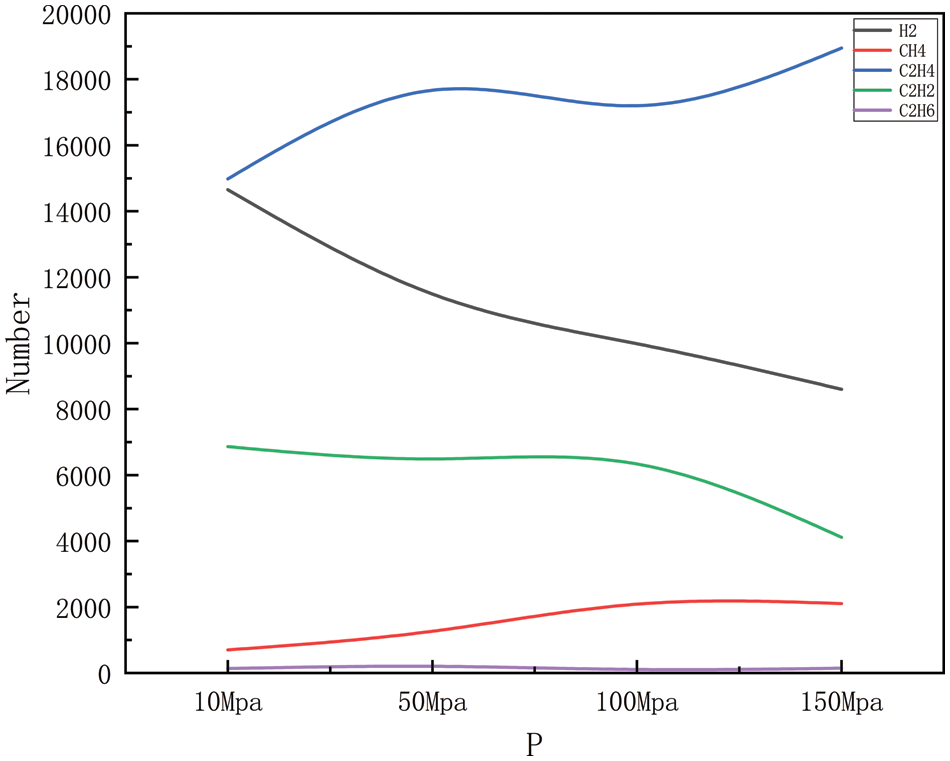
Figure 9: Product distribution at 2900 K for different pressures
Figs. 6–9 show the changes in major products with increasing pressure at 2300, 2500, 2700, and 2900 K, respectively. As can be easily obtained from the figures, the generation of hydrogen, methane, ethylene, acetylene, and ethane shows greater or lesser fluctuations with increasing pressure, where the fluctuation trends are the same in Figs. 6 and 7, and similar in Figs. 8 and 9. Carbon-carbon bonds are broken and shorter molecules are produced as a result of the heat breakdown of polyethylene to create ethylene, which requires the absorption of energy and is, therefore, a heat-absorbing reaction, and in the simulated system, increasing the pressure of the system will tend to push the reaction in an exothermic direction, i.e., toward the reactants, to maintain the equilibrium of the system, to reduce the pressure of the system. This means that with increased pressure, ethylene production may decrease as the system tries to absorb the excess pressure (by reducing the amount of gas product). However, as the pressure gradually increases, the volume of the reaction system will begin to decrease, and increasing the pressure will push the reaction in the direction of the product, i.e., in the direction of ethylene production, at which point the ethylene yield will begin to increase again. The production of hydrogen includes the dissolution of hydrogen-carbon bonds, the production of methane includes the dissolution of hydrogen-carbon bonds, and carbon-carbon bonds, and the production of acetylene and ethane involves the disintegration of carbon chains and the process of reorganization of hydrogen atoms, all of which require the absorption of energy, and so are all heat-absorbing reactions, i.e., they will show the same tendency to change as ethylene. However, in Figs. 8 and 9, the trend of several product generation is different from Figs. 6 and 7, this is because, under high-temperature conditions, the activation energy of the chemical reaction may decrease, thus increasing the rate of the reaction, the change of pressure may also affect the frequency and direction of the collision between the reactant molecules, which may affect the rate of the reaction and the distribution of the products, it should also be considered that the stability of the compound under high temperature and pressure may change. For example, methane may be more stable at high pressures relative to acetylene, so as pressure increases, methane production may increase while acetylene production may decrease. In practice, the chemical reaction equilibrium is also affected by a variety of other factors, including specific reaction conditions, reaction kinetics, and other possible by-products that may be formed, etc. The analysis of the amount of product generated also takes into account all of the above complexities, which may lead to the observation that the yield of the product rises or falls in different pressure intervals.
As shown in Figs. 10–17, for the analysis of density, the density changes at different pressures with different temperatures were selected to improve the accuracy of the simulation. The whole process of the simulation is 250 ps, but the process with large density changes occurs within the first 60 ps. Figs. 10–13 correspond to the effect of temperature variation on density at 10, 50, 100, and 150 MPa of pressure, respectively. As can be seen in Figs. 10 to 13, it can be seen that when the pressure is kept constant, the density of HDPE becomes lower and lower as the temperature increases, and although there are some fluctuations in the overall change in density, the overall trend of decline remains the same. This is because when the temperature rises, the atoms or molecular groups in the polyethylene molecular chain increase their average kinetic energy due to increased thermal movement. Increased thermal motion leads to a rise in the mean separation between molecules, which is reflected in an increase in bond length and a decrease in cluster density (i.e., the number of molecular clusters per unit volume). When the pressure is constant, the increased distance between molecules leads to an expansion of the overall volume of the material and, thus a decrease in density. The higher the temperature the faster the density decreases in a given time.
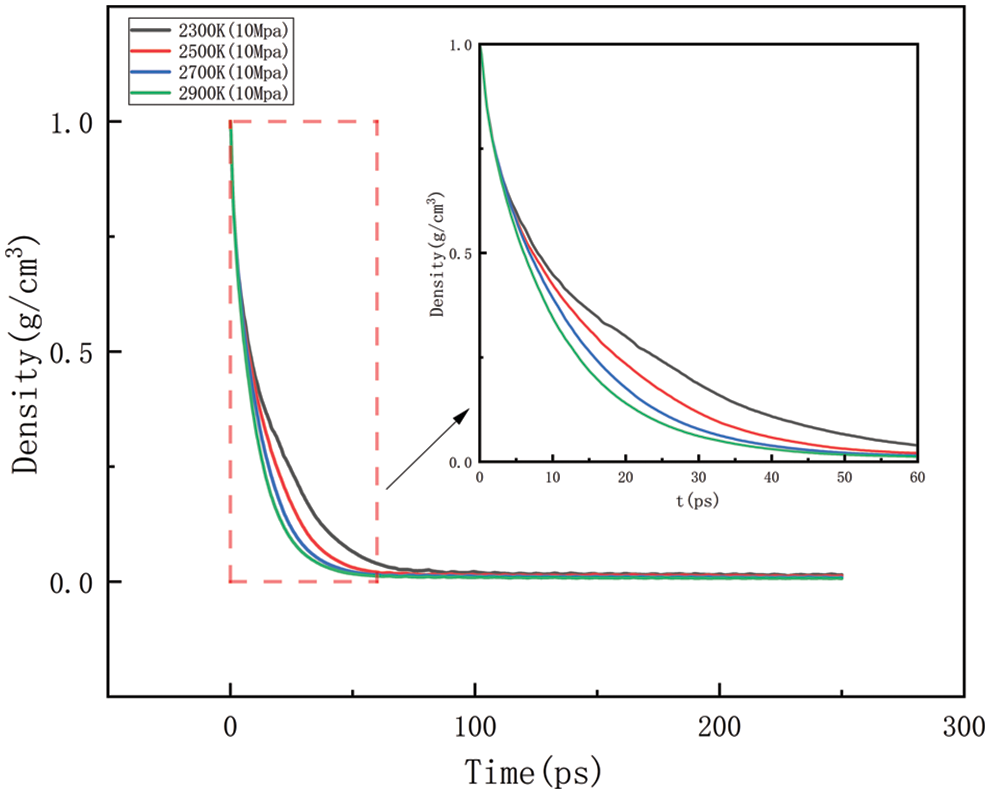
Figure 10: Density change at different temperatures under 10 MPa
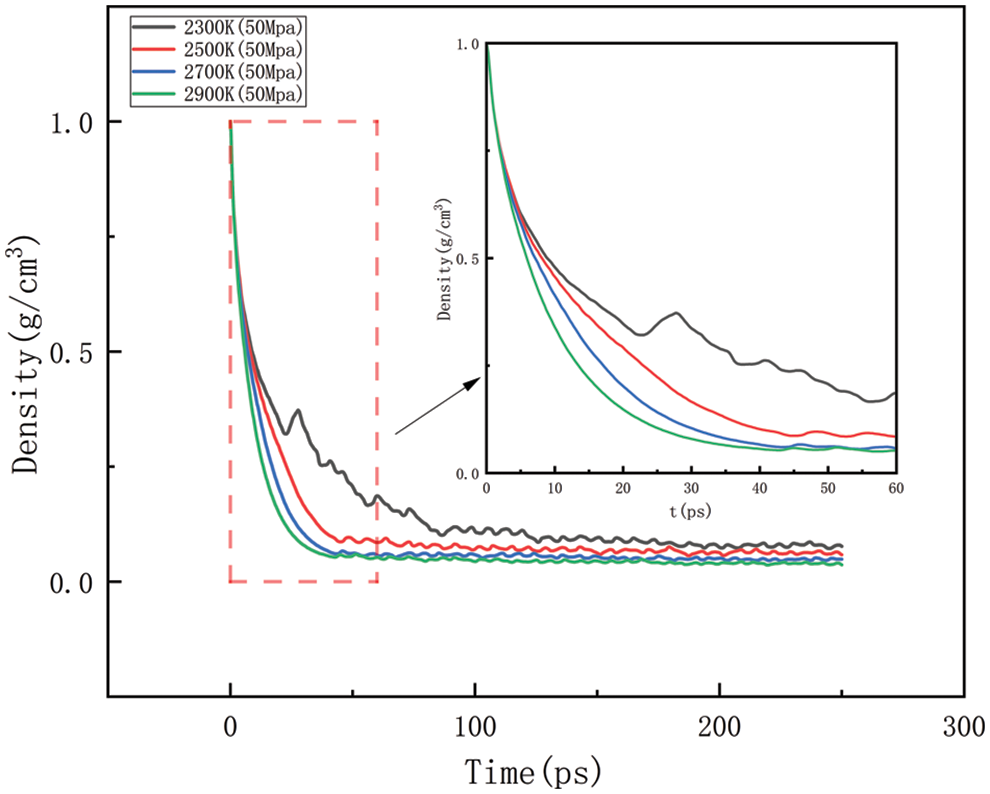
Figure 11: Density change at different temperatures under 50 MPa
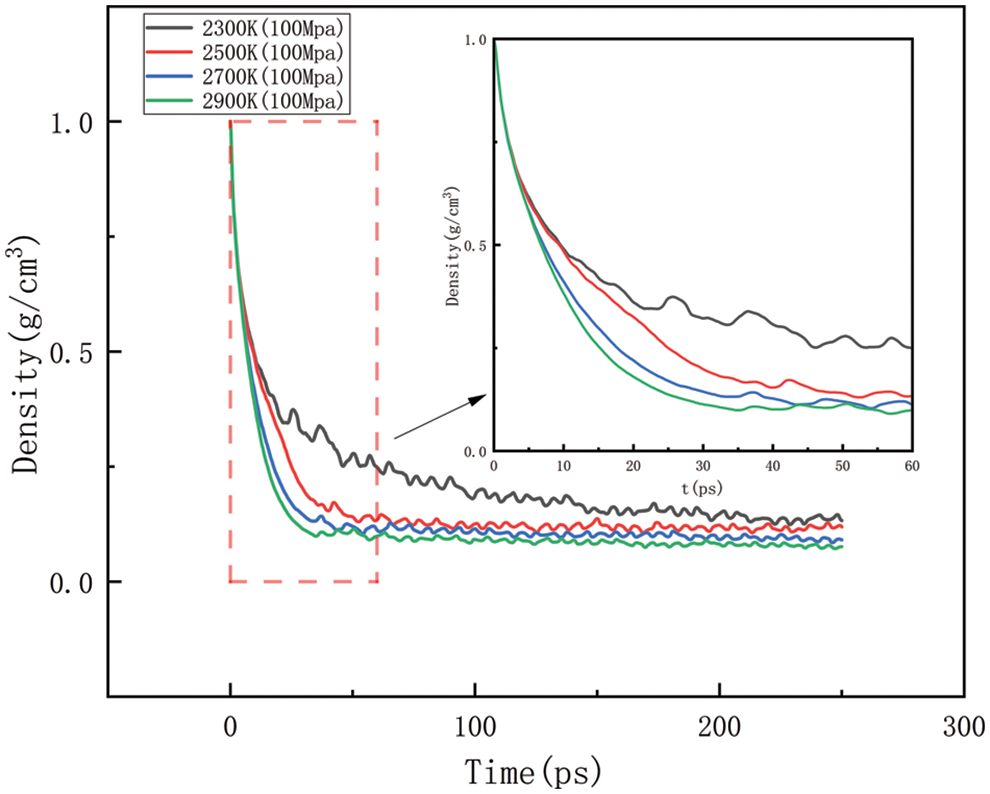
Figure 12: Density change at different temperatures under 100 MPa
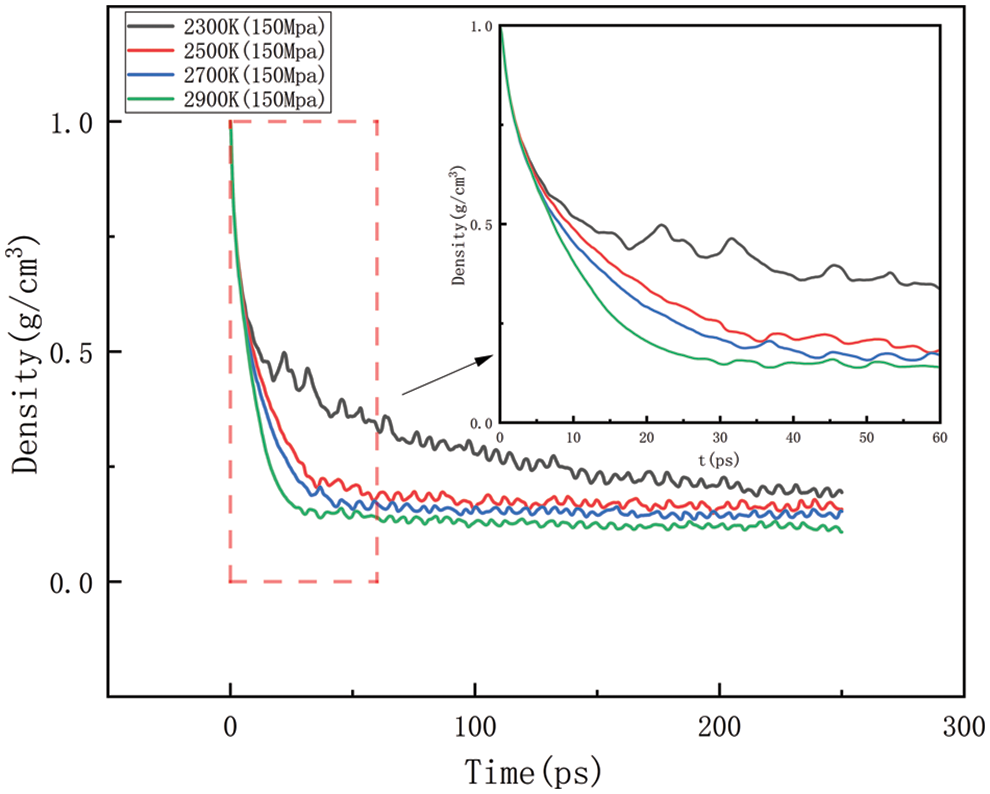
Figure 13: Density change at different temperatures under 150 MPa
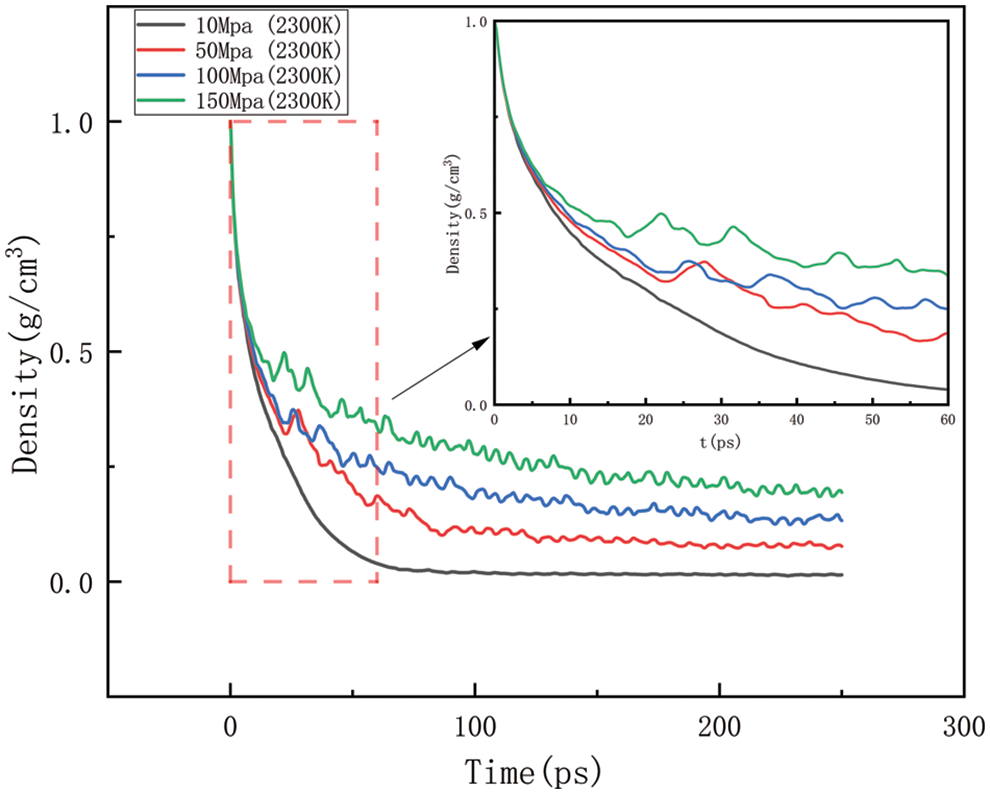
Figure 14: Variation in density at various temperatures at 2300 K
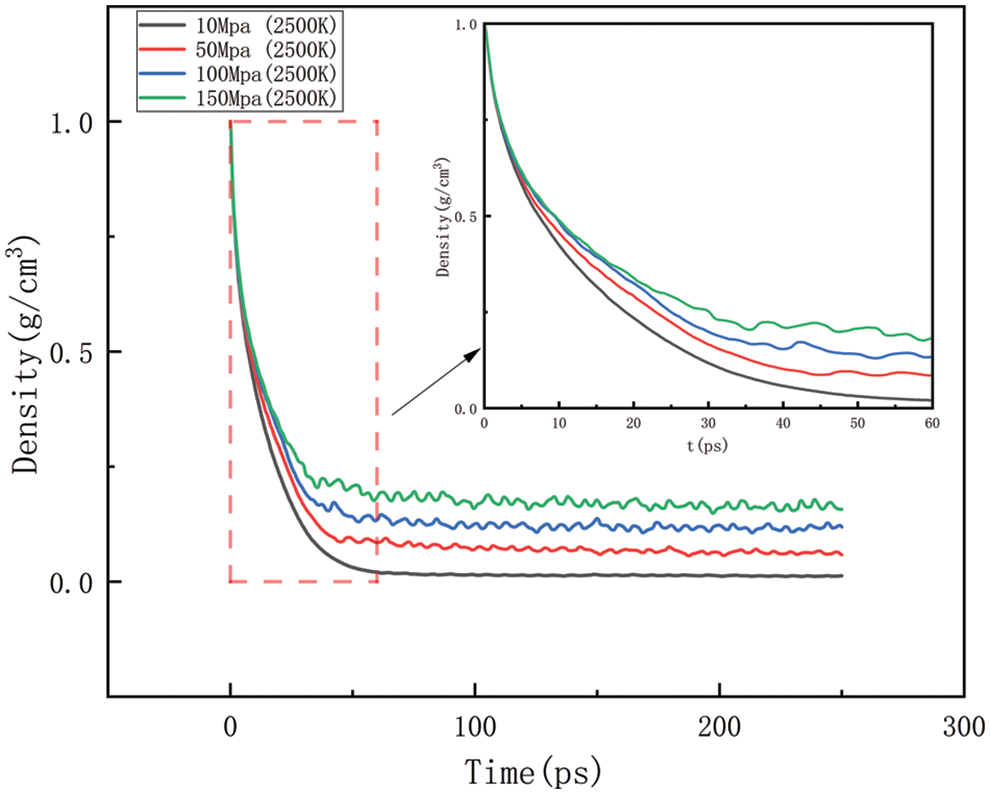
Figure 15: Variation in density at various temperatures at 2500 K
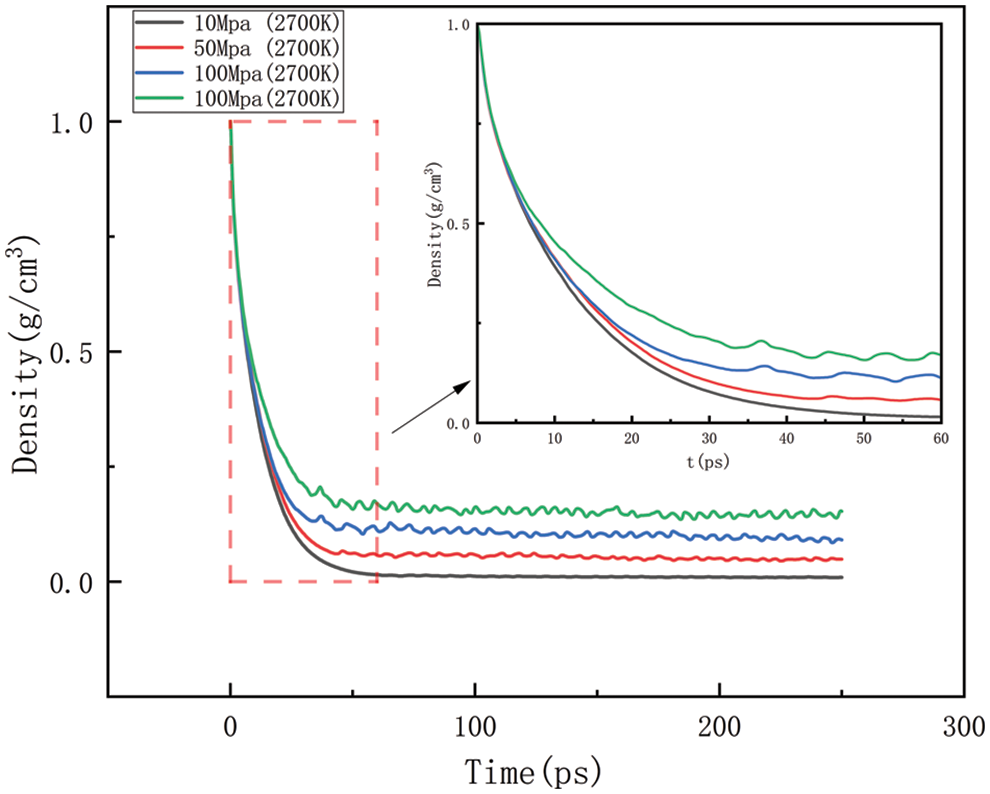
Figure 16: Variation in density at various temperatures at 2700 K
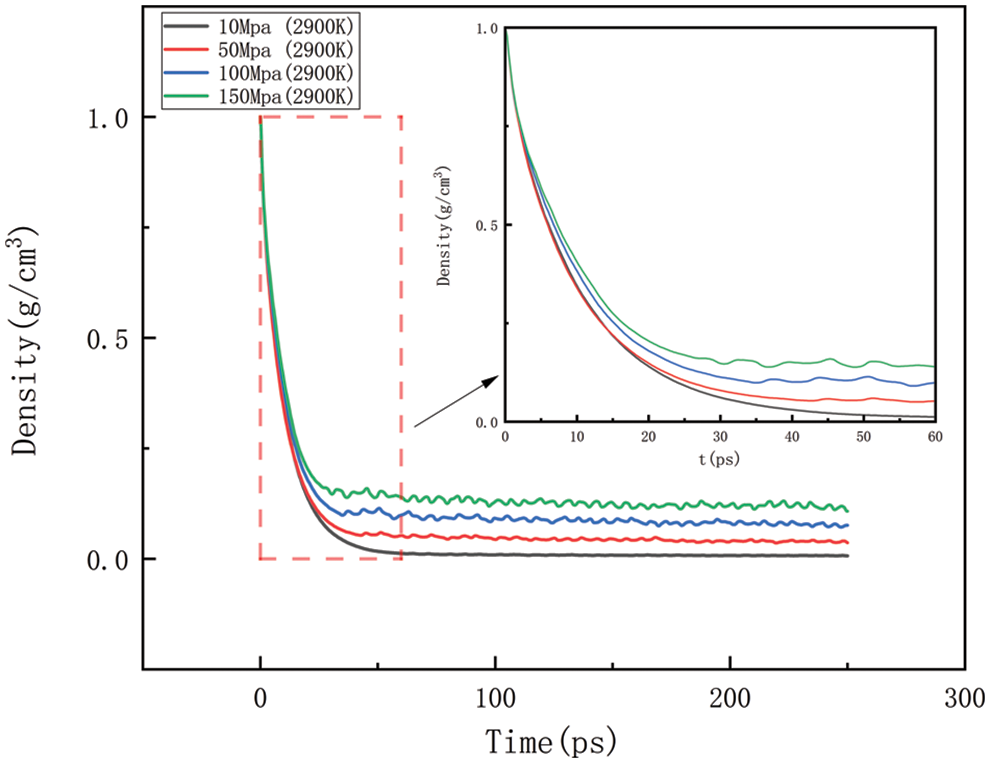
Figure 17: Variation in density at various temperatures at 2900 K
Figs. 14–17 should be the effect of pressure change on density at temperatures of 2300, 2500, 2700, and 2900 K, respectively. As can be seen in Figs. 14 to 17, At 2300 K, the density eventually drops to 0.014–0.197 g/cm3; at 2500 K, the density eventually drops to 0.012–0.157 g/cm3; at 2700 K, the density eventually drops to 0.009–0.142 g/cm3; at 2900 K, the density eventually drops to 0.006–0.113 g/cm3. The greater the pressure, the slower the density decreases, and the greater the final density value, the pressure plays a slowing down effect on the decrease of density. When the temperature is kept constant, with the increasing pressure, the density of HDPE will be reduced but not lower and lower, the greater the pressure, the slower the density reduction, analyze the reason for this is that with the increase in pressure, the intermolecular interactions become complex. To a certain extent, these interactions prevent further compression of the polymer chains, thus affecting the increase in the bond length of the molecular chains. When the increase in bond length is limited, the cluster density (i.e., the number of molecular chain segments per unit volume) increases, which means that, although the external volume is decreasing, the compactness of the molecular chain is increasing, which in turn leads to a decrease in the equilibrium distance between atoms. Thus, while the overall density may appear to decrease under high pressure, it is actually due to adjustments in the internal structure of the molecule that allow the rate of density decrease to be slowed down.
Figs. 18–21 show the energy changes of the whole simulated system with the increase of temperature at 10, 50, 100, and 150 MPa, respectively, and Figs. 22–25 show the energy changes of the whole simulated system with the increase of pressure at 2300, 2500, 2700, and 2900 K, respectively. As the image illustrates, the kinetic energy, potential energy, and total energy of the entire system at 0 ps experienced a precipitous increase to a specific value, and then, with time, the kinetic energy growth rate in the system became a slower increase in the rate of decrease, showing a more stable or gradual growth trend, the system’s potential energy, as well as the overall energy (i.e., the sum of the system’s energy, usually consists of kinetic energy and potential energy), show a slightly faster rate of increase relative to the kinetic energy. The simulation is initially performed when the system is suddenly boosted from a lower temperature (relaxation temperature of 300 K) to a higher temperature condition, which results in a sudden increase in the kinetic and potential energies of the system because the system has to make rapid adjustments to the new equilibrium state. Kinetic energy is directly related to the temperature of the system, which stabilizes after an initial sharp rise, so kinetic energy increases more slowly. The potential energy, as well as the total energy of the system, show a slightly faster growth rate relative to the kinetic energy. This may indicate that the energy conversion or distribution mechanism of the system tends to convert more energy into potential energy or other forms of non-kinetic energy with the continuation of time in the process, resulting in a relatively faster rate of increase of potential and total energy.
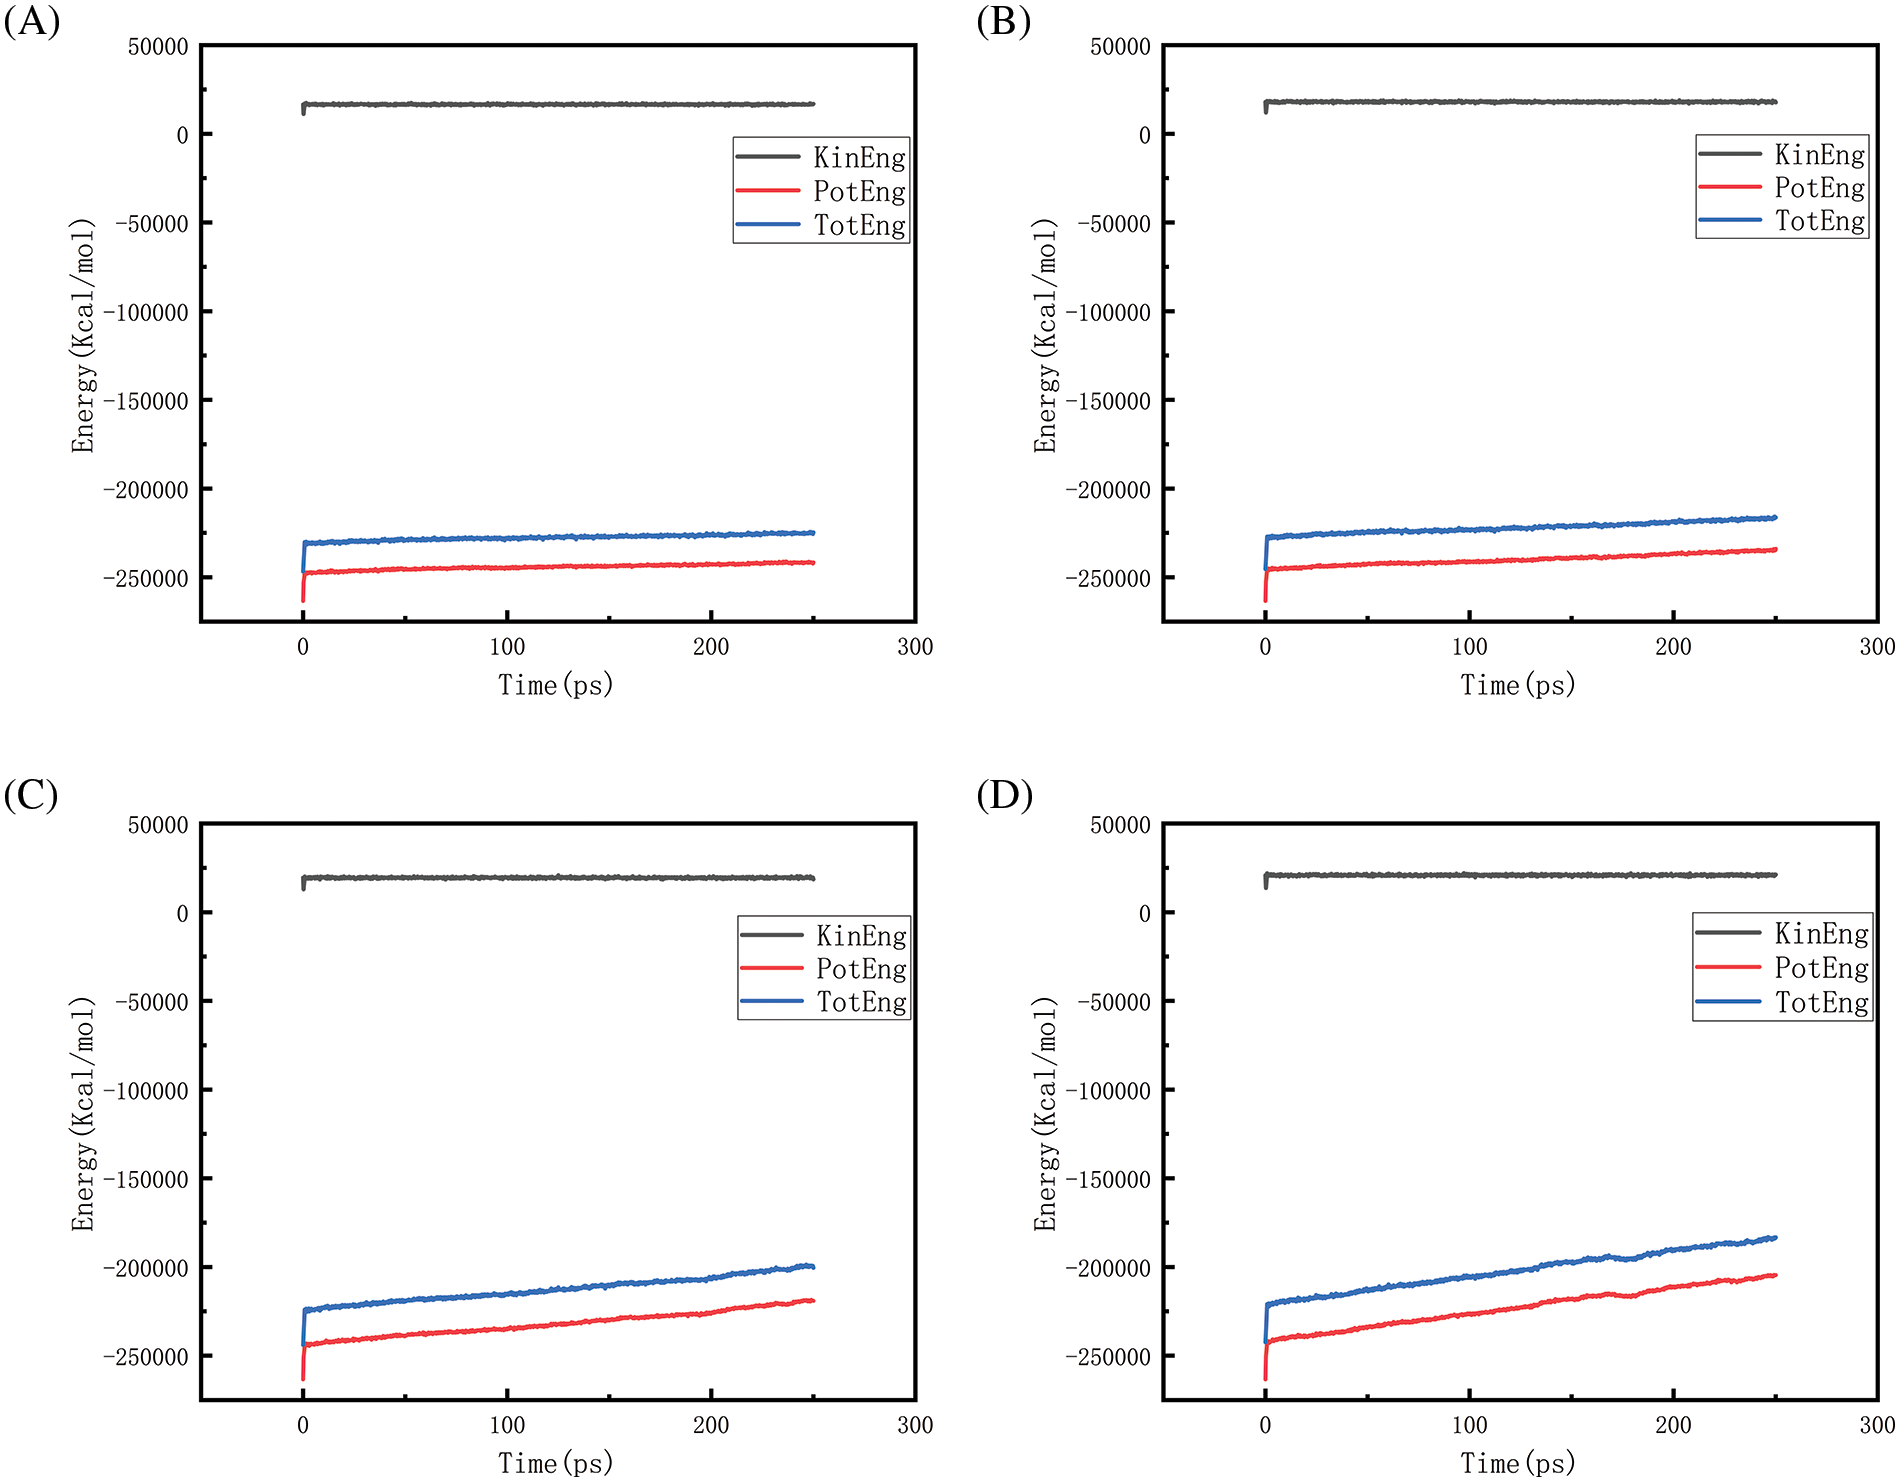
Figure 18: Graphs of energy changes at different temperatures at 10 MPa (A, B, C, D represent energy graphs at 2300, 2500, 2700, 2900 K, respectively)

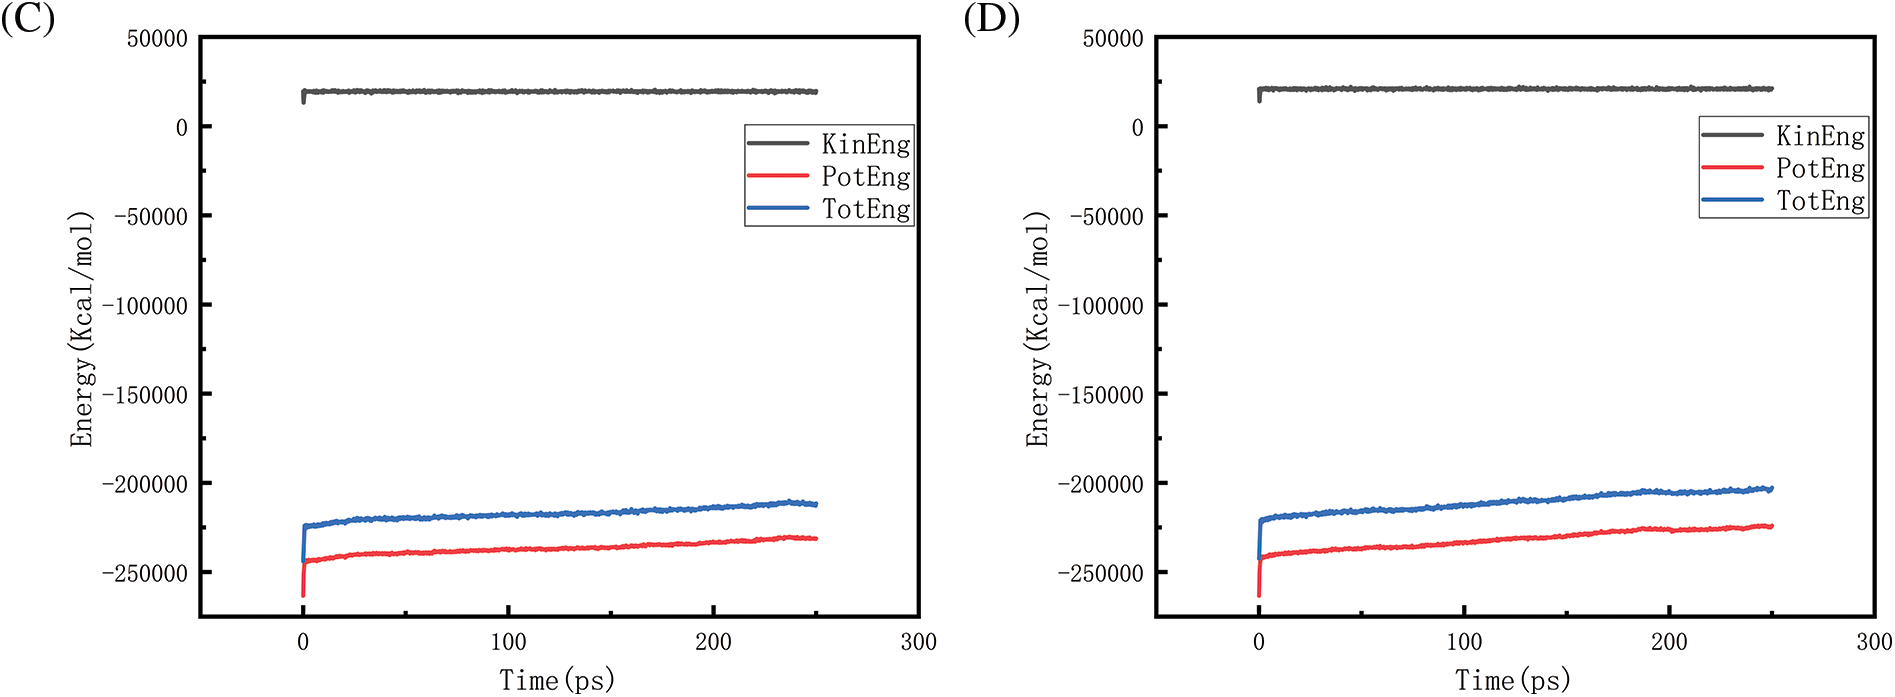
Figure 19: Graphs of energy changes at different temperatures at 50MPa (A, B, C, D represent energy plots at 2300, 2500, 2700, 2900 K, respectively)
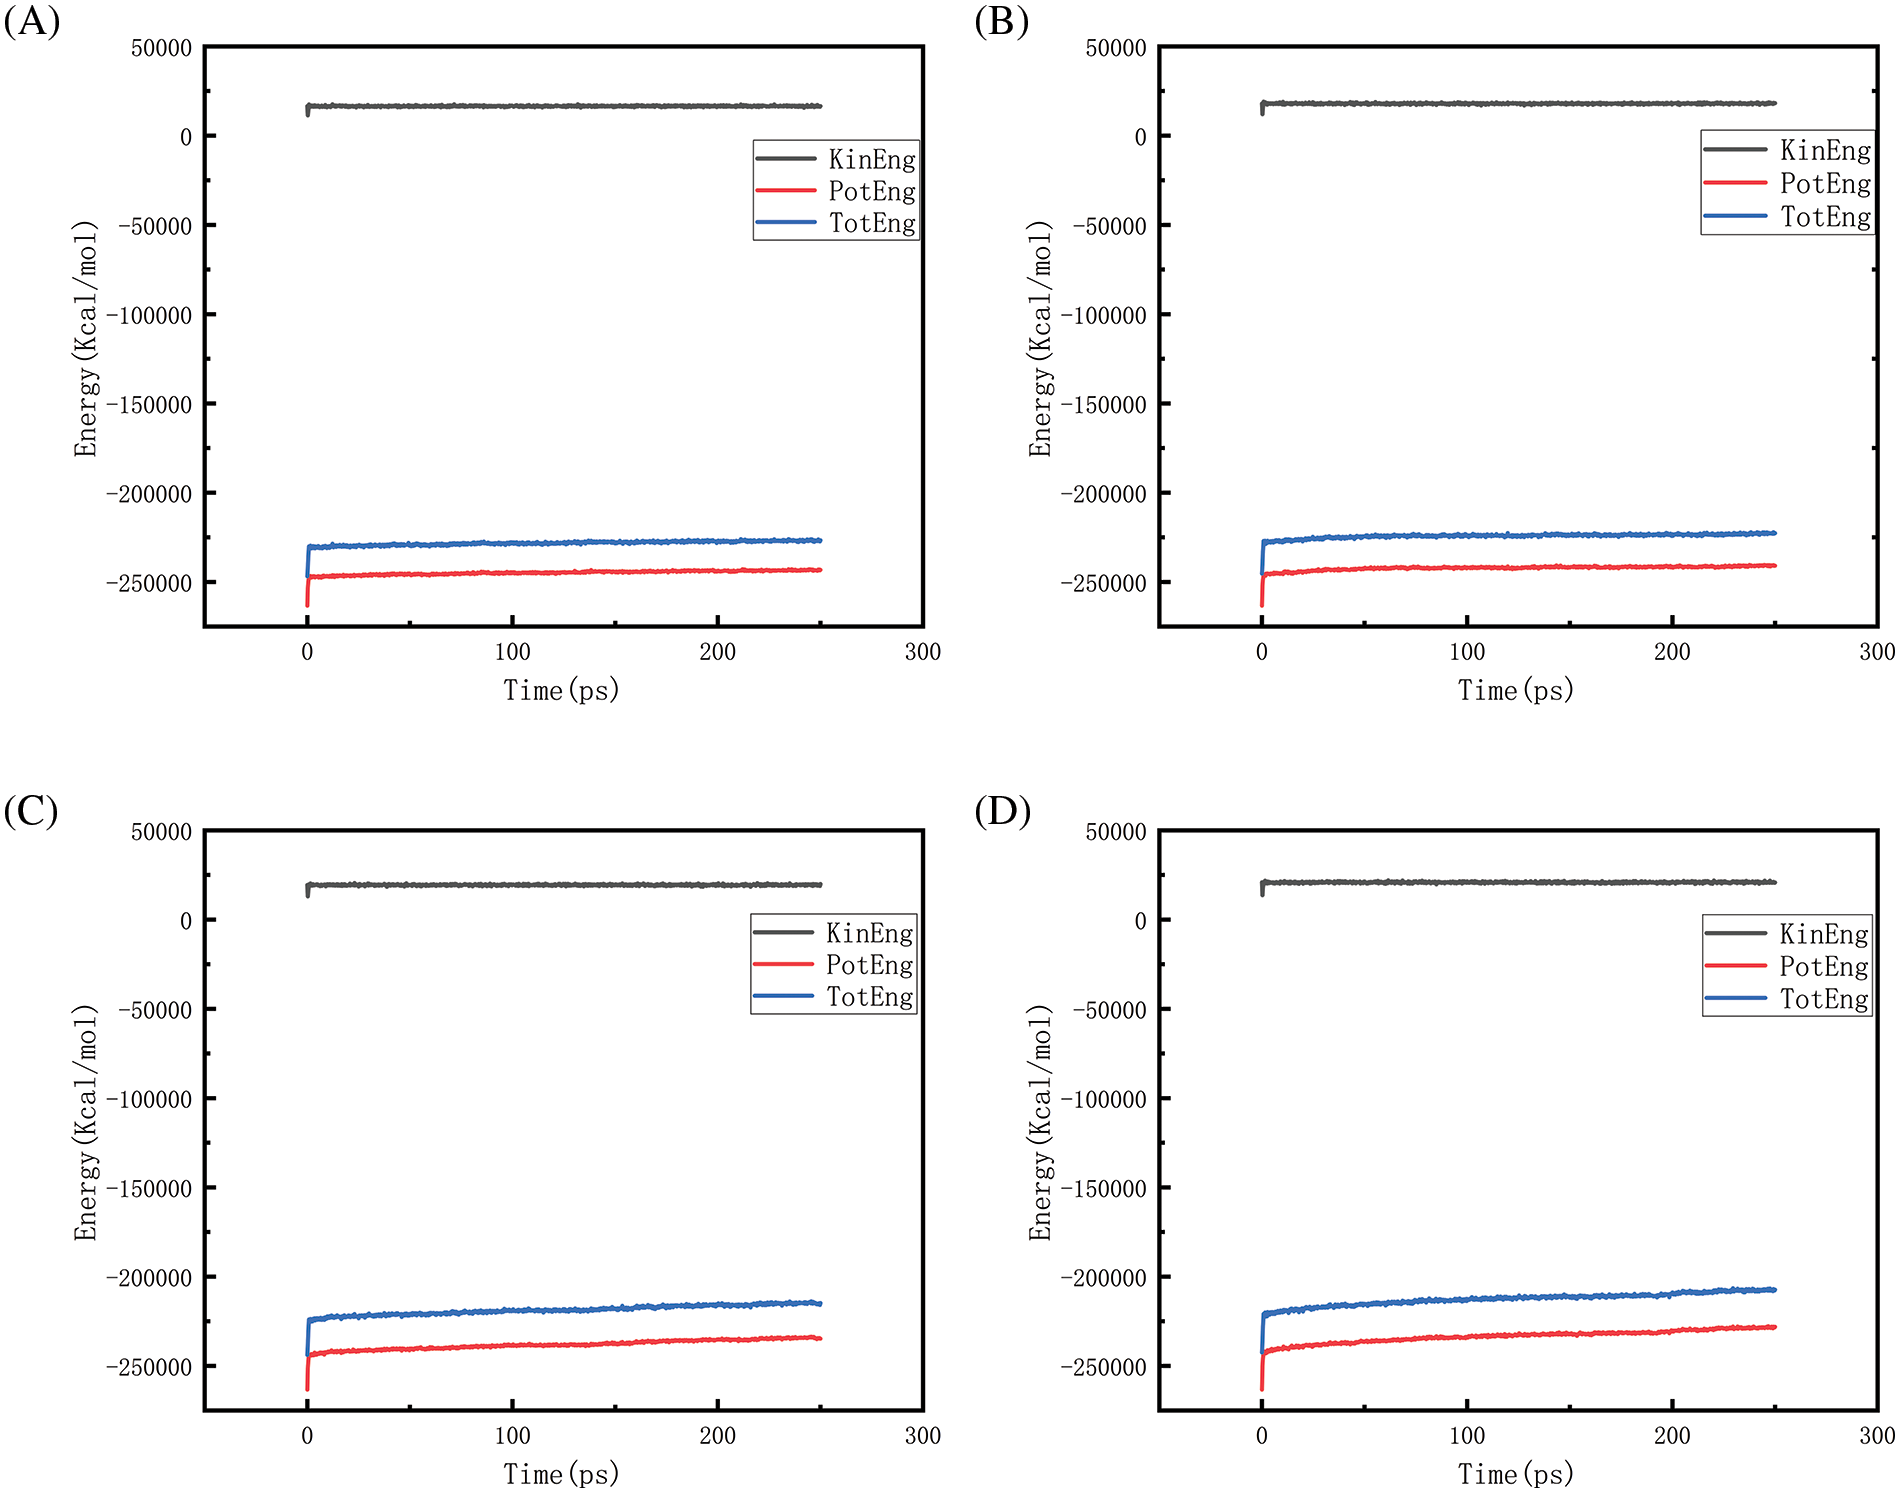
Figure 20: Graphs of energy changes at different temperatures at 100 MPa (A, B, C, D represent energy graphs at 2300, 2500, 2700, 2900 K, respectively)
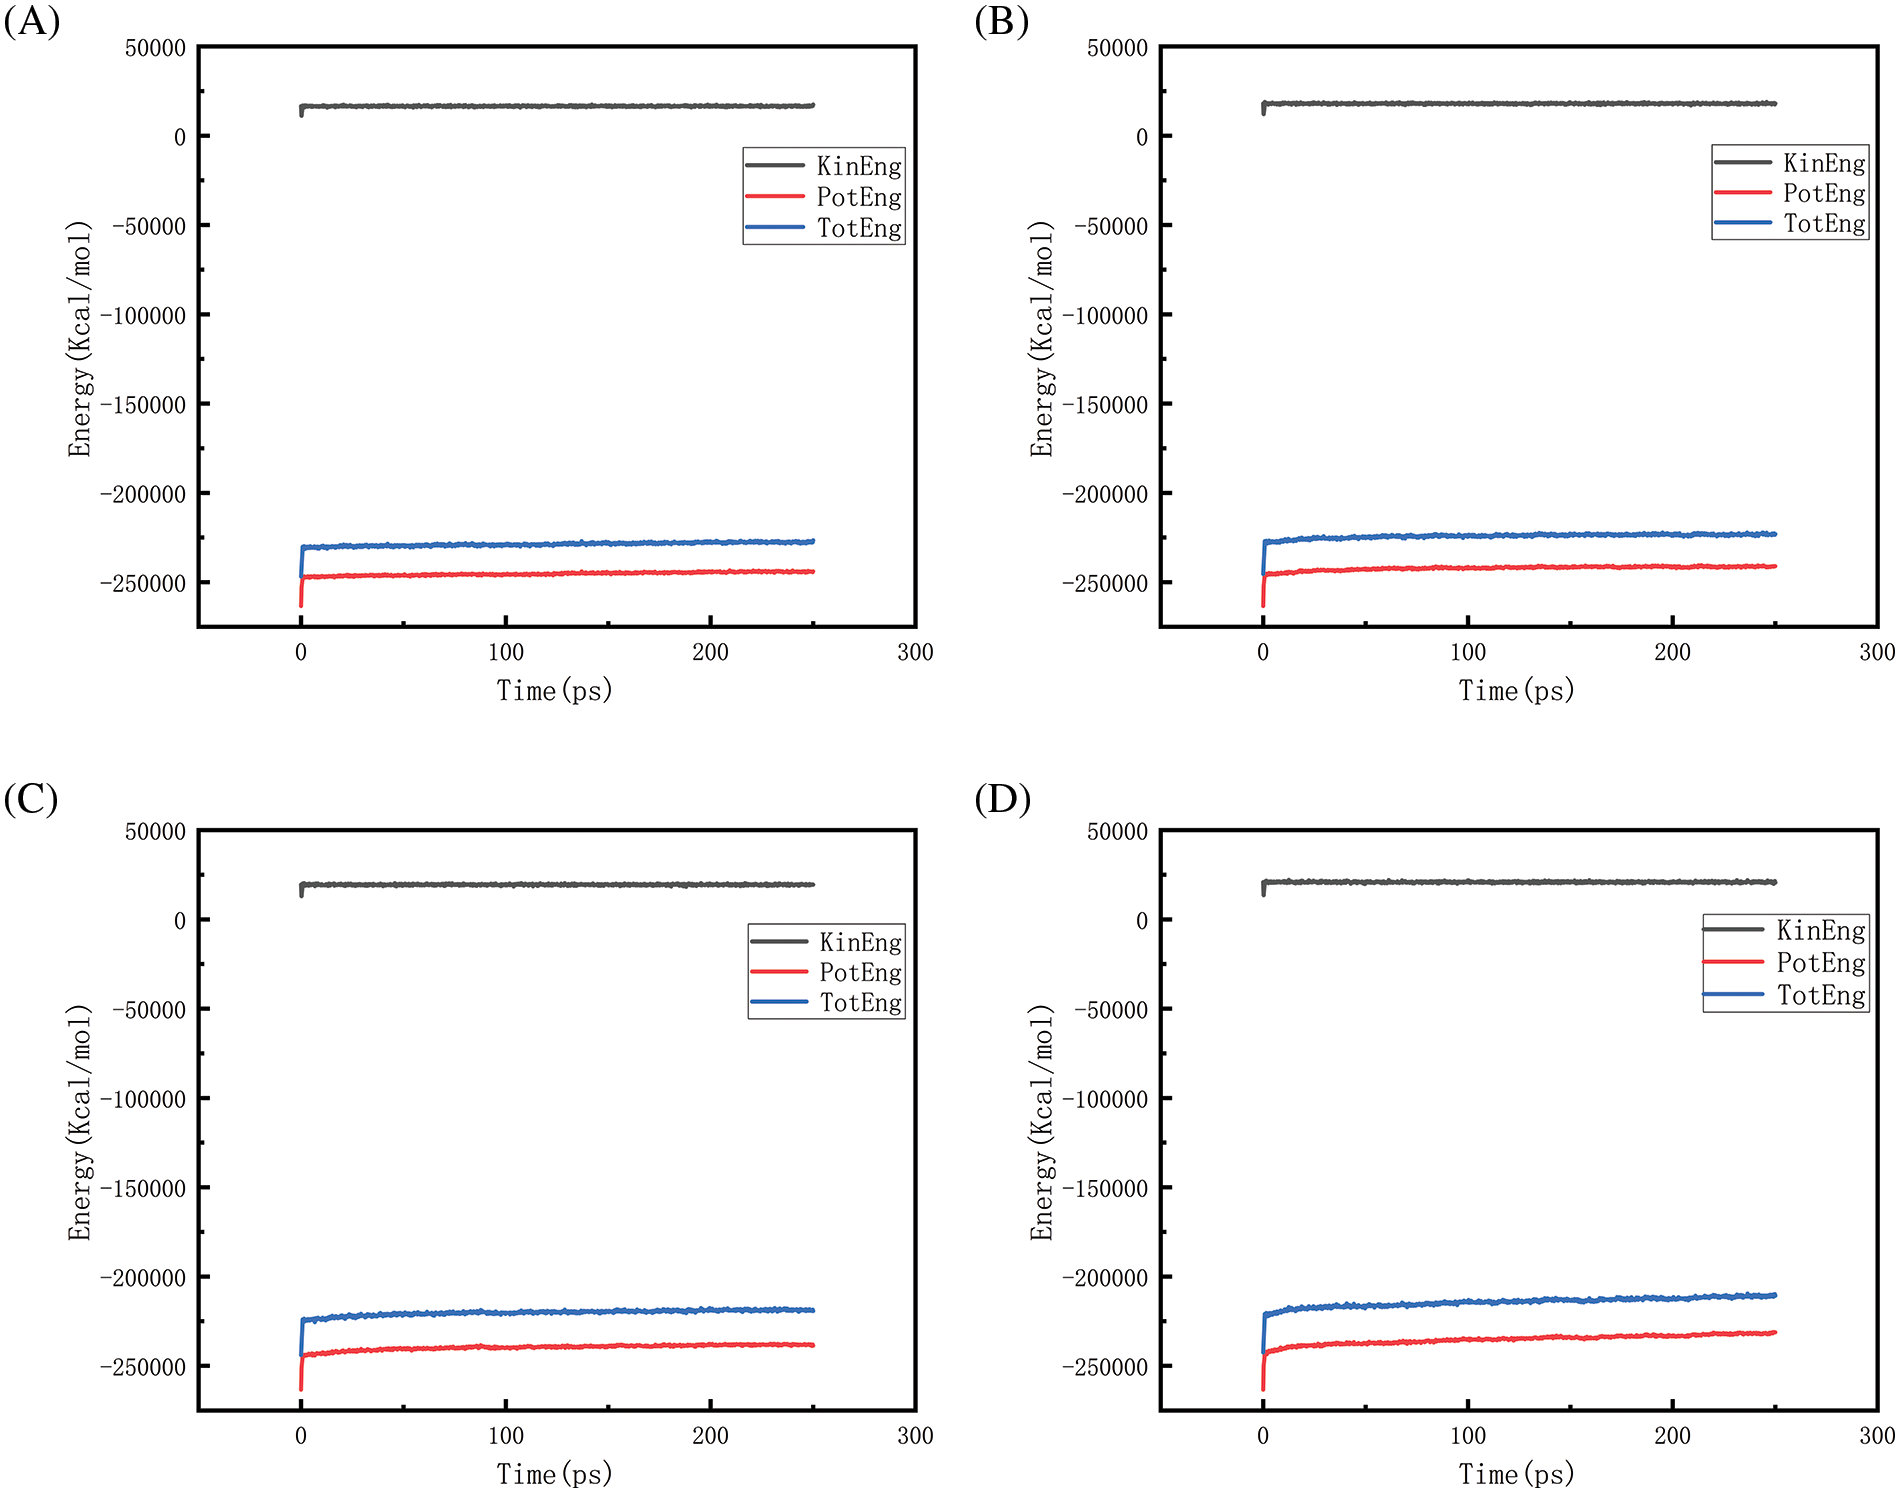
Figure 21: Graphs of energy changes at different temperatures at 150 MPa (A, B, C, D represent energy graphs at 2300, 2500, 2700, 2900 K, respectively)
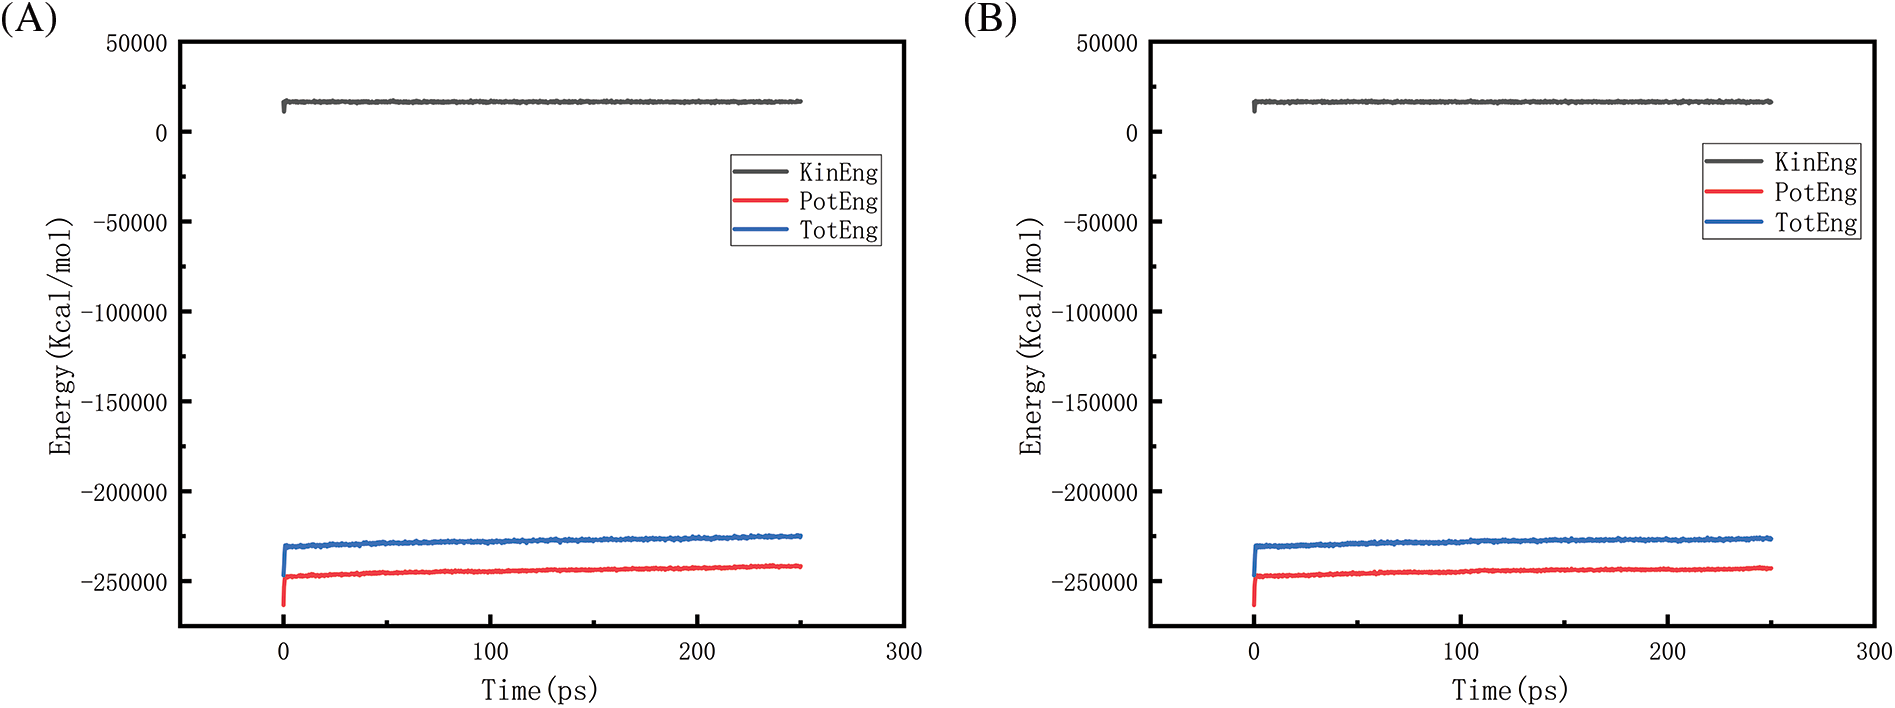
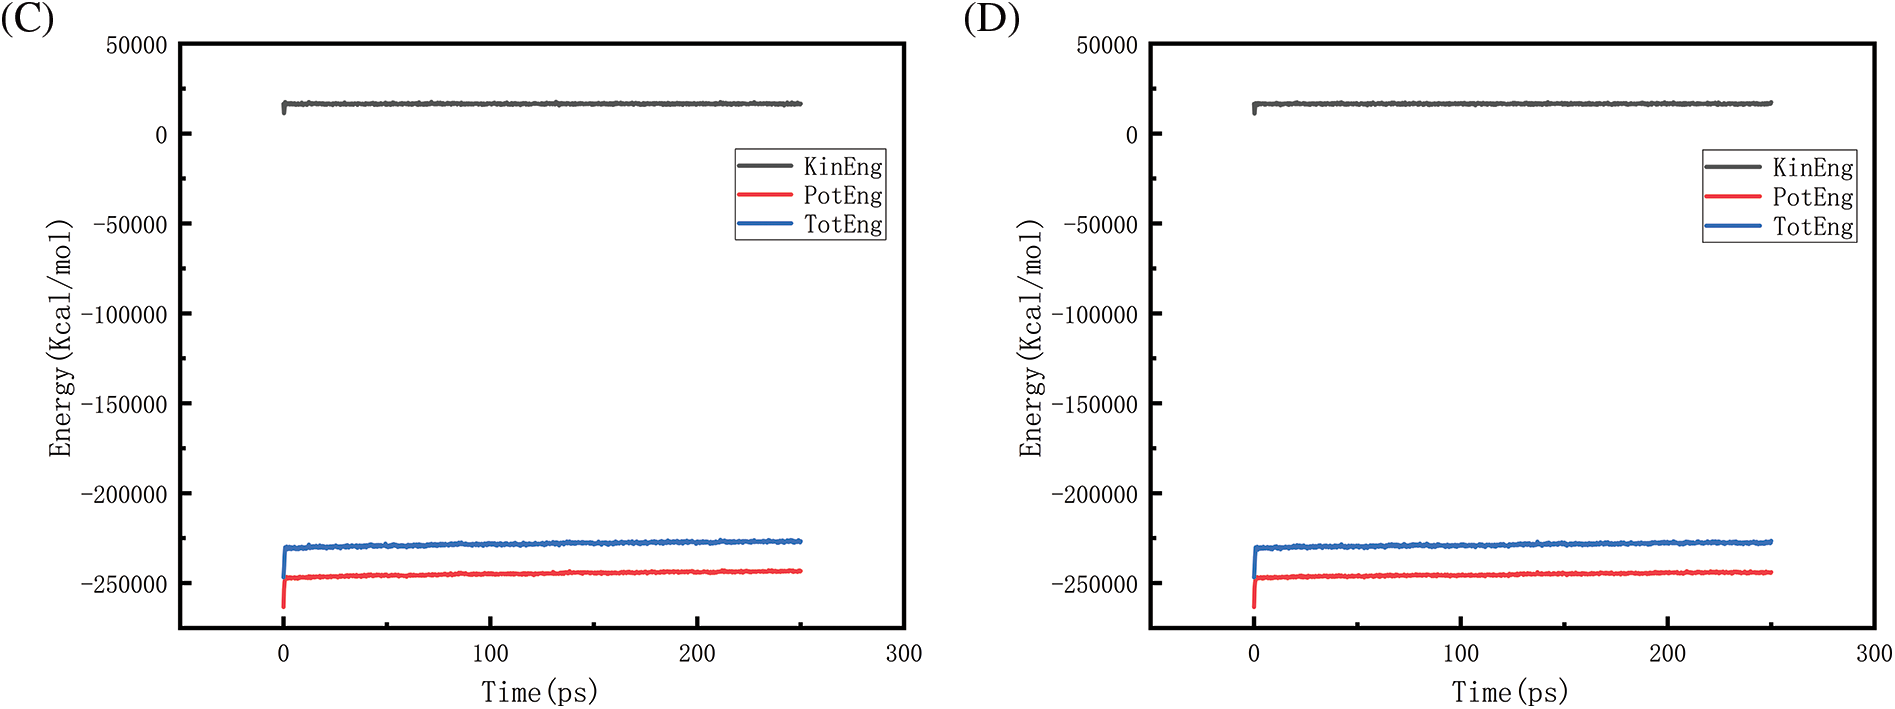
Figure 22: Graphs of energy changes at different pressures at 2300 K (A, B, C, D represent energy graphs at 10, 50, 100, 150 MPa, respectively)
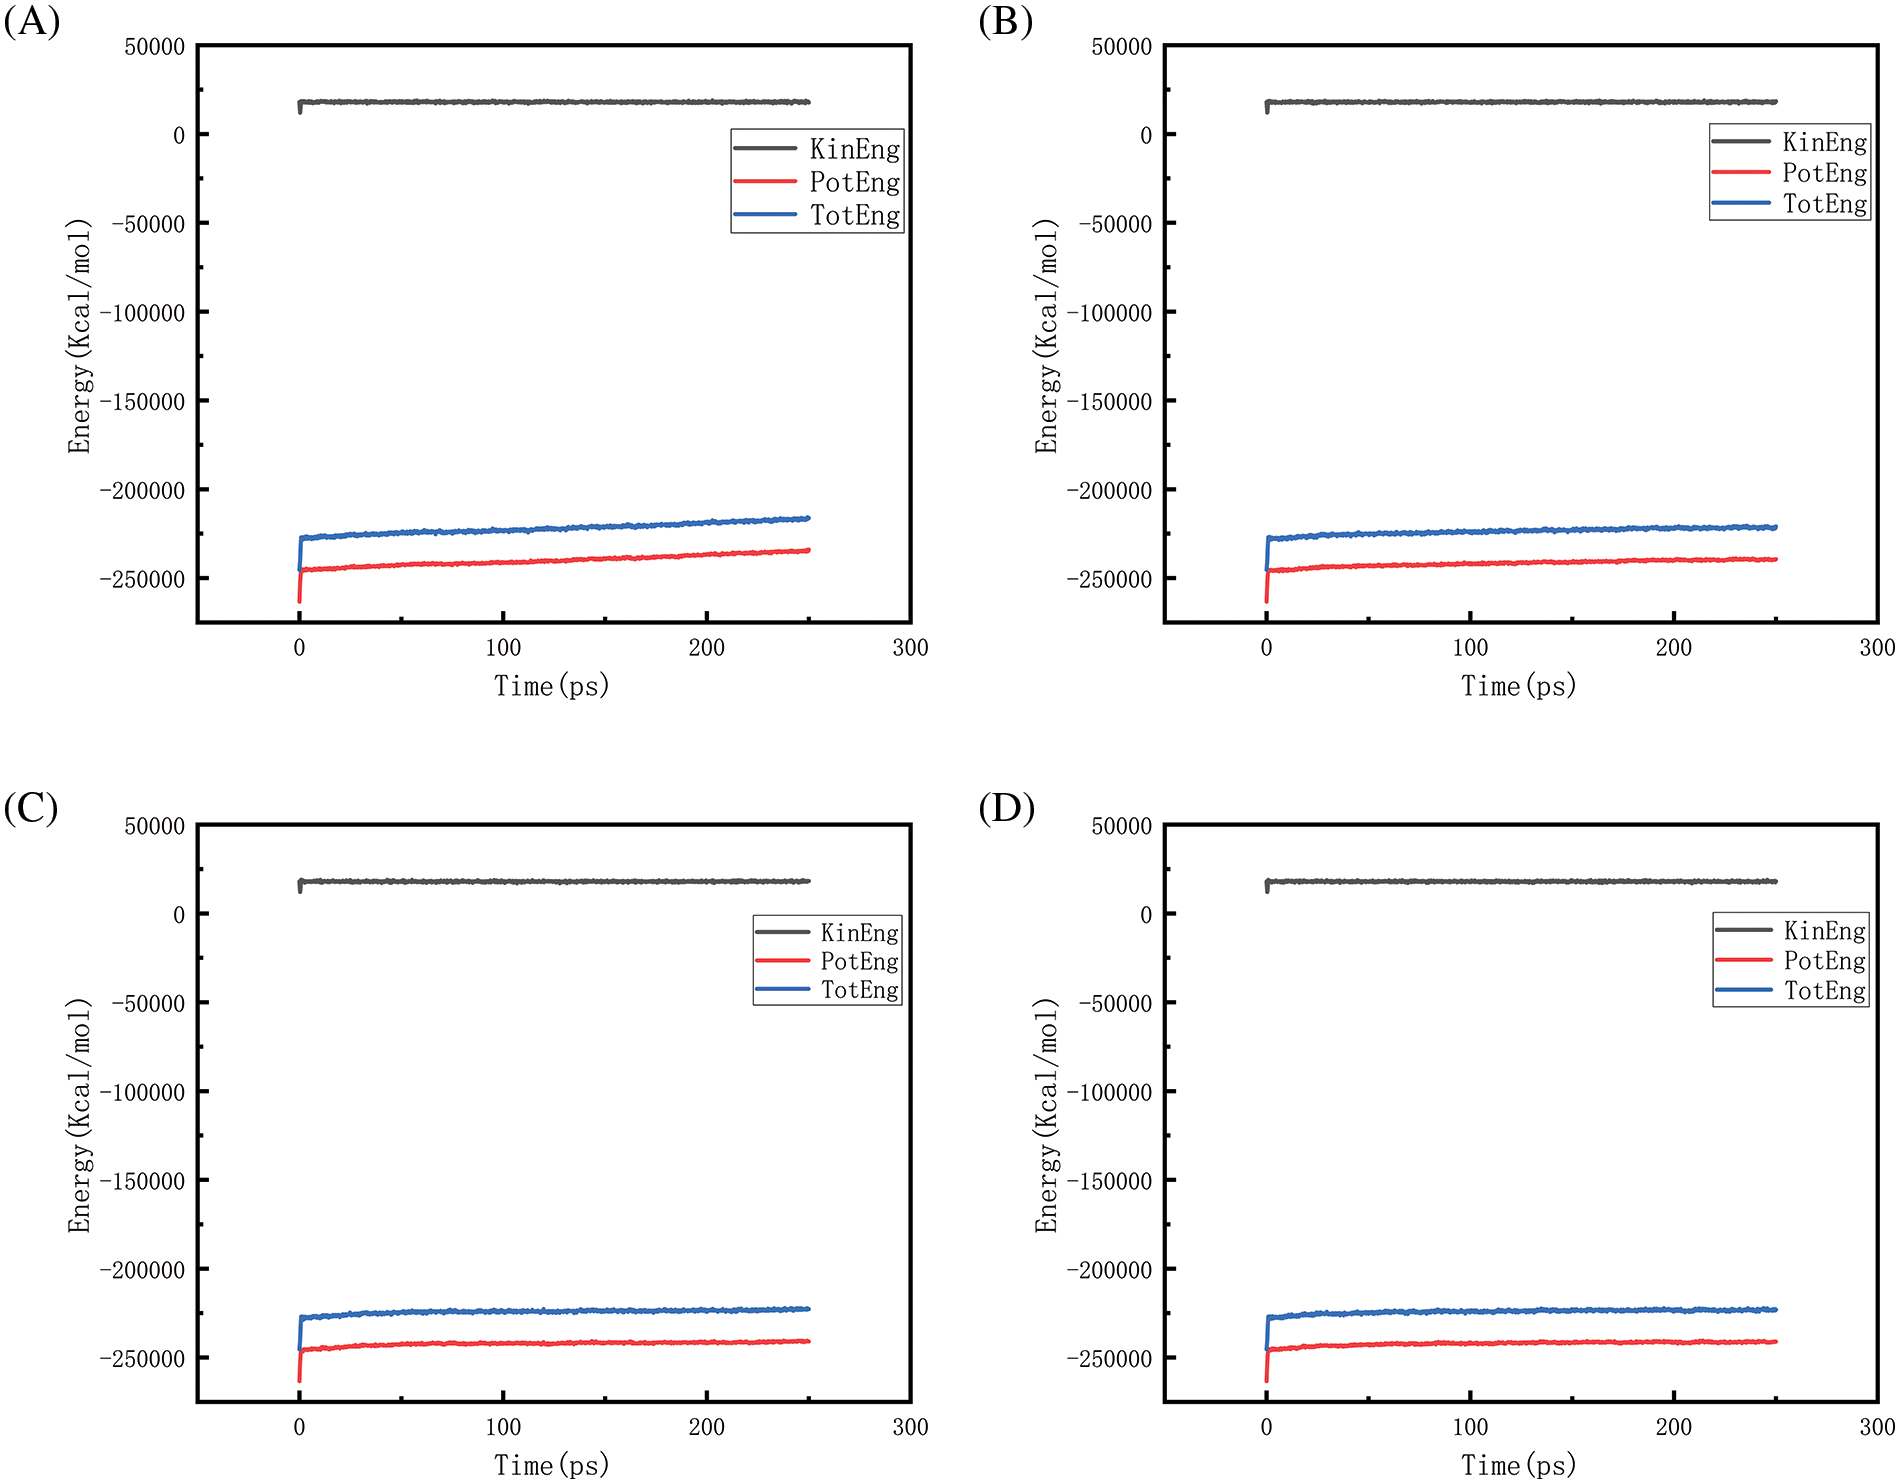
Figure 23: Graphs of energy changes at different pressures at 2500 K (A, B, C, D represent energy graphs at 10, 50, 100, 150 MPa, respectively)
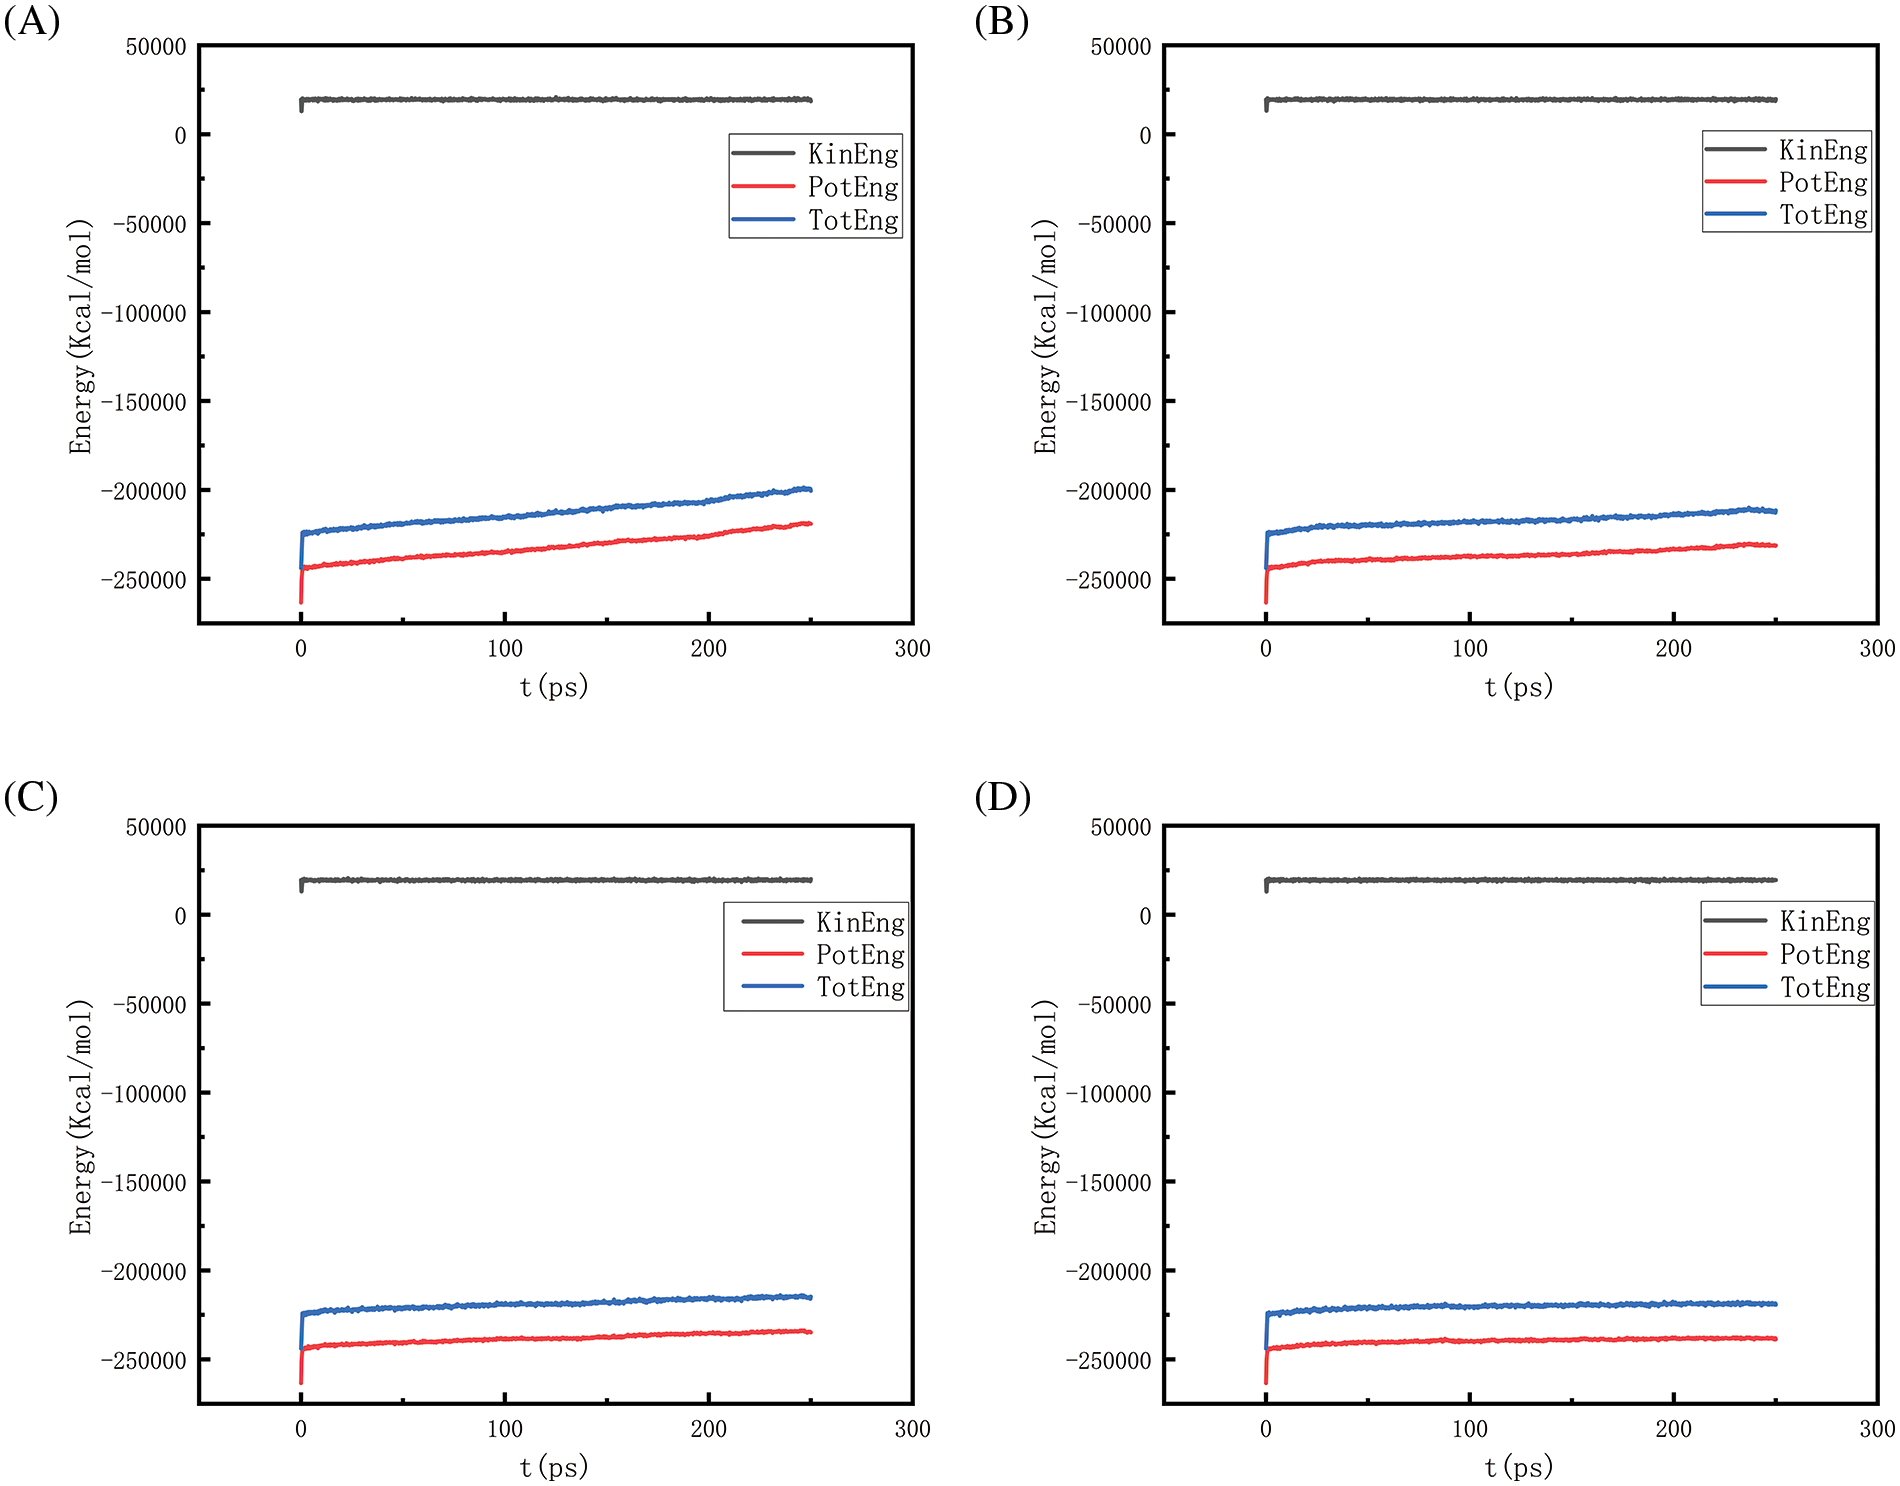
Figure 24: Graphs of energy changes at different pressures at 2700 K (A, B, C, D represent energy graphs at 10, 50, 100, 150 MPa, respectively)
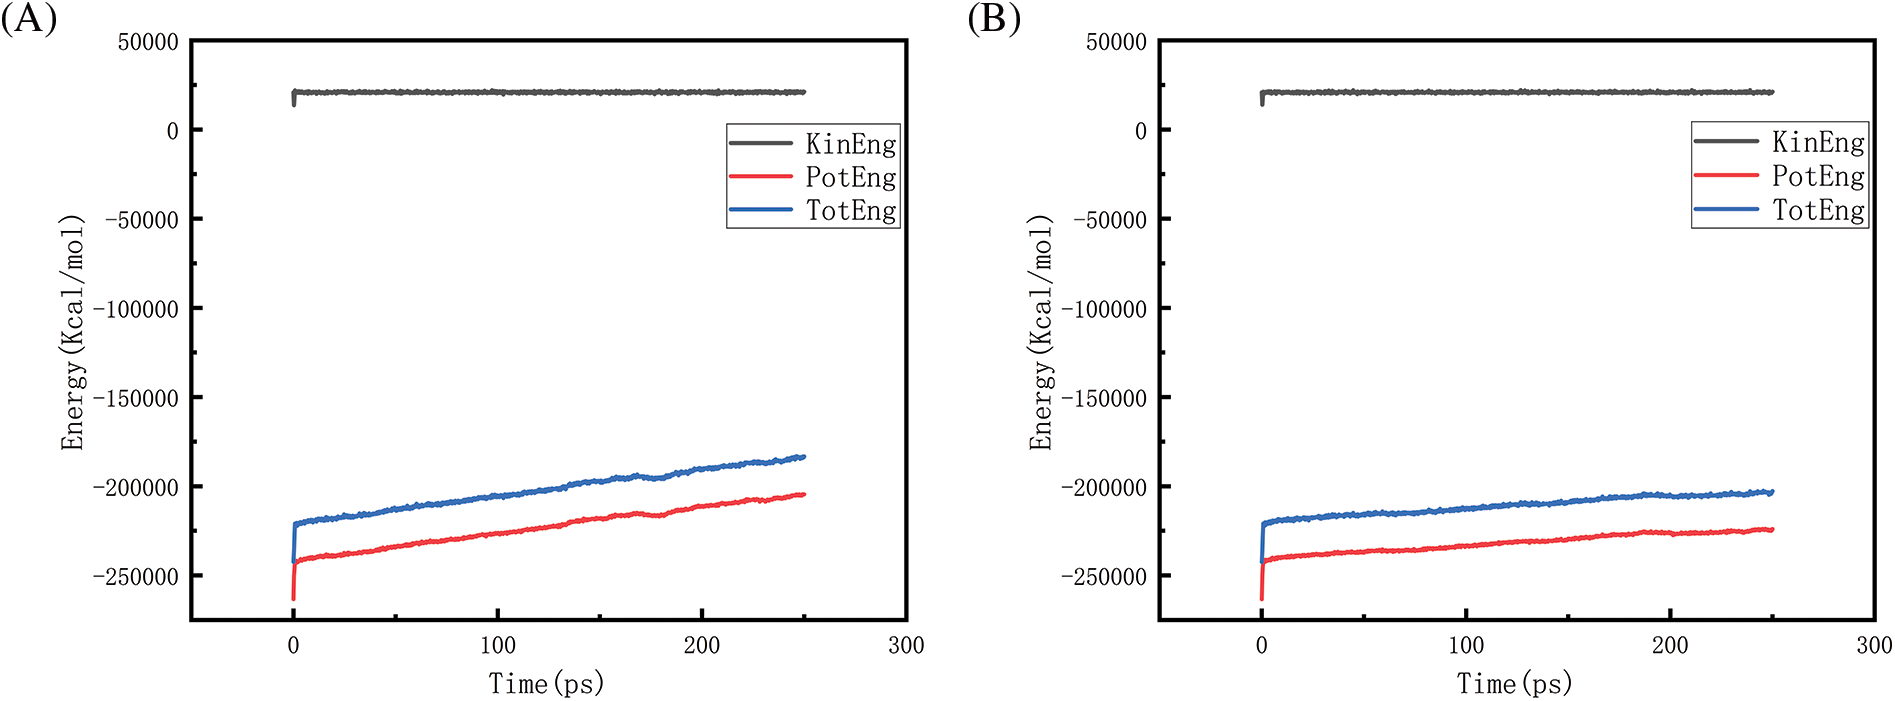
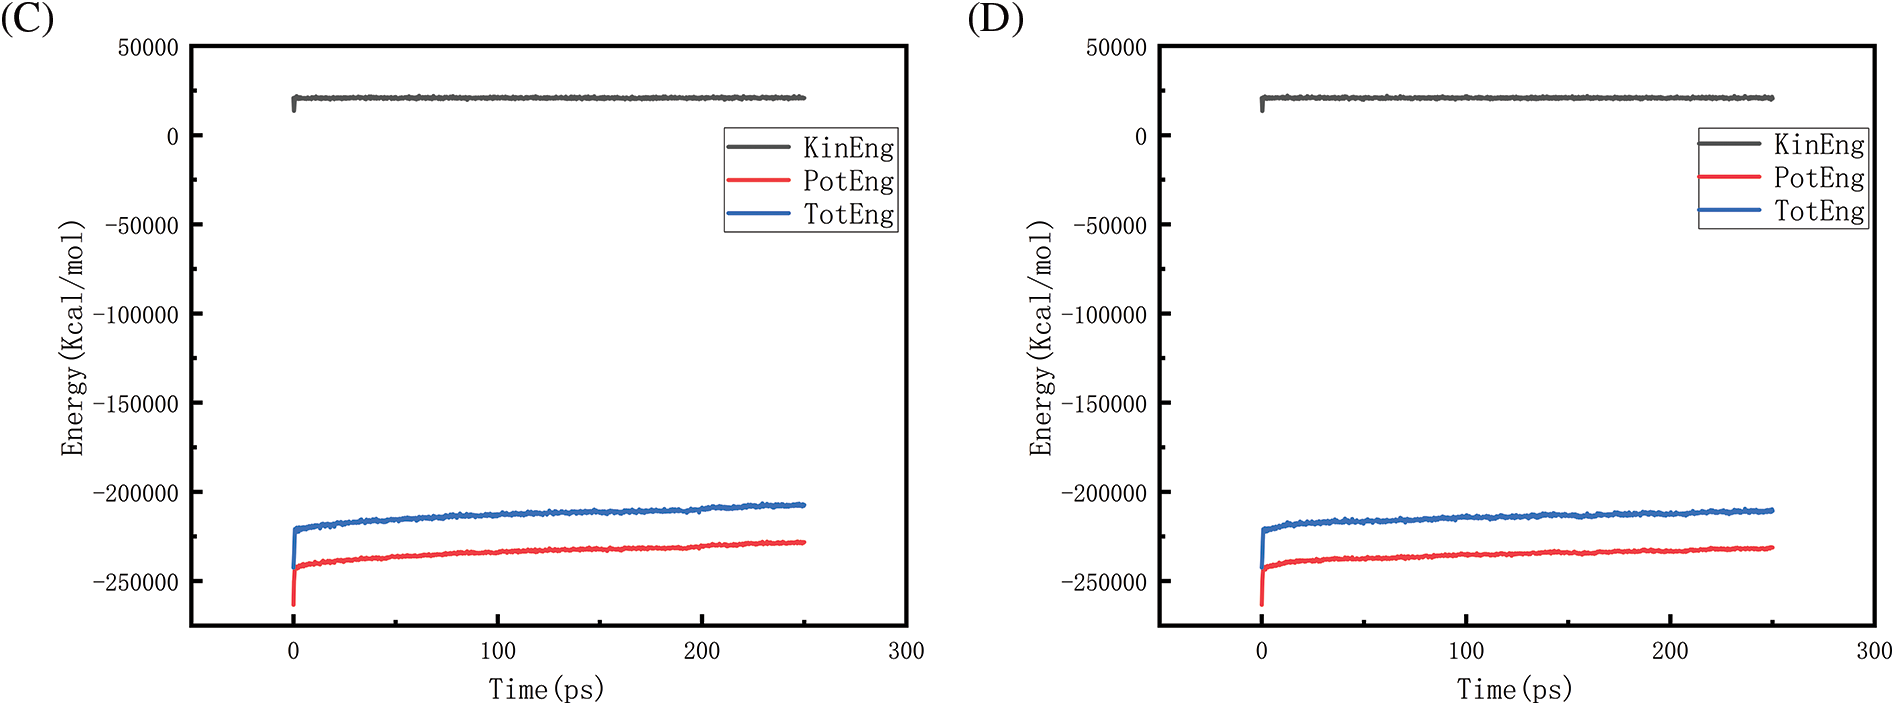
Figure 25: Graphs of energy changes at different pressures at 2900 K (A, B, C, D represent energy graphs at 10, 50, 100, 150 MPa, respectively)
Observing Fig. 18A–D, we find that the potential energy and total energy in the system increase to a certain extent, and the higher the temperature, the more obvious the trend of increase. Combined with Fig. 2 above, it can be seen that the amount of hydrogen generated at this time is larger, because hydrogen is generated by the thermal degradation of polyethylene at high temperatures, so it is a heat-absorbing reaction, i.e., it is necessary to absorb energy from the environment to promote the breakage and reorganization of the chemical bond, thus forming hydrogen gas. The heat-absorption reaction leads to an increase in the potential energy within the system and thus increases the total energy of the system. The higher the temperature, the greater the amount of hydrogen produced and the more obvious the trend of energy increase. Similarly, the rise in potential energy and total energy in Figs. 19–21 is also due to the production of hydrogen, and the difference in the degree of increase is due to the difference in the amount and trend of hydrogen production.
Figs. 22 and 23 is the temperature of 2300 and 2500 K when the different pressure energy change graph, because at this time the simulation temperature is relatively low, although the pressure is increasing, the whole temperature system under the potential energy and the total energy is relatively stable and not a big change, it can be judged that the temperature is the main reason to affect the energy change. Figs. 24 and 25 in the first graph (pressure of 10 MPa) of the potential energy and total energy rose faster, while the other graphs rose more and more slowly, from the above Figs. 8 and 9 show, that the increase in pressure leads to a reduction in the amount of hydrogen generated, the reduction in the amount of hydrogen generated leads to a reduction in the heat-absorption reaction, which further affects the system of potential energy and the total energy of the rising trend.
4.4 Mean Square Displacement (MSD)
Fig. 26, along with Fig. 27, represents the mean square displacement (MSD) at different pressures as well as at different temperatures. From the figure, when the system pressure is maintained at a certain level, the relationship of MSD with increasing temperature is 2900 > 2700 > 2500 > 2300 K. The greater the slope of the curve of the MSD plot, the faster the rate of diffusion. The results show that as the temperature increases, the thermal motion of the molecules intensifies, the energy state becomes higher, and the intermolecular interaction forces are relatively weaker, thus allowing the molecules to move more freely. This enhanced molecular motion not only leads to an increase in the MSD value but also implies an increase in the rate of molecular diffusion. When the temperature is maintained at a certain level, as the pressure increases, the relationship of MSD is 10 > 50 > 100 > 150 MPa. That is, the higher the pressure the lower the rate of diffusion. Because increasing the pressure of a system at a fixed temperature usually means that the particles are compressed into a smaller volume, the average distance between them decreases, the interactions become stronger, and the particles therefore, have less free space to move. Combined with the above analysis of density, the increase in pressure allows the rate of density reduction of the system to be slowed down, and collisions between particles are more frequent, limiting to some extent the movement of particles within the polyethylene, which leads to a decrease in the rate of diffusion. The simulation’s outcomes demonstrate that the diffusion rate at 10 MPa is much higher than the other pressure parameters, indicating that the particles diffuse best at this pressure state, and the comparison of the values of MSD reveals that the effect of temperature on the diffusion behavior is much greater than the pressure factor.
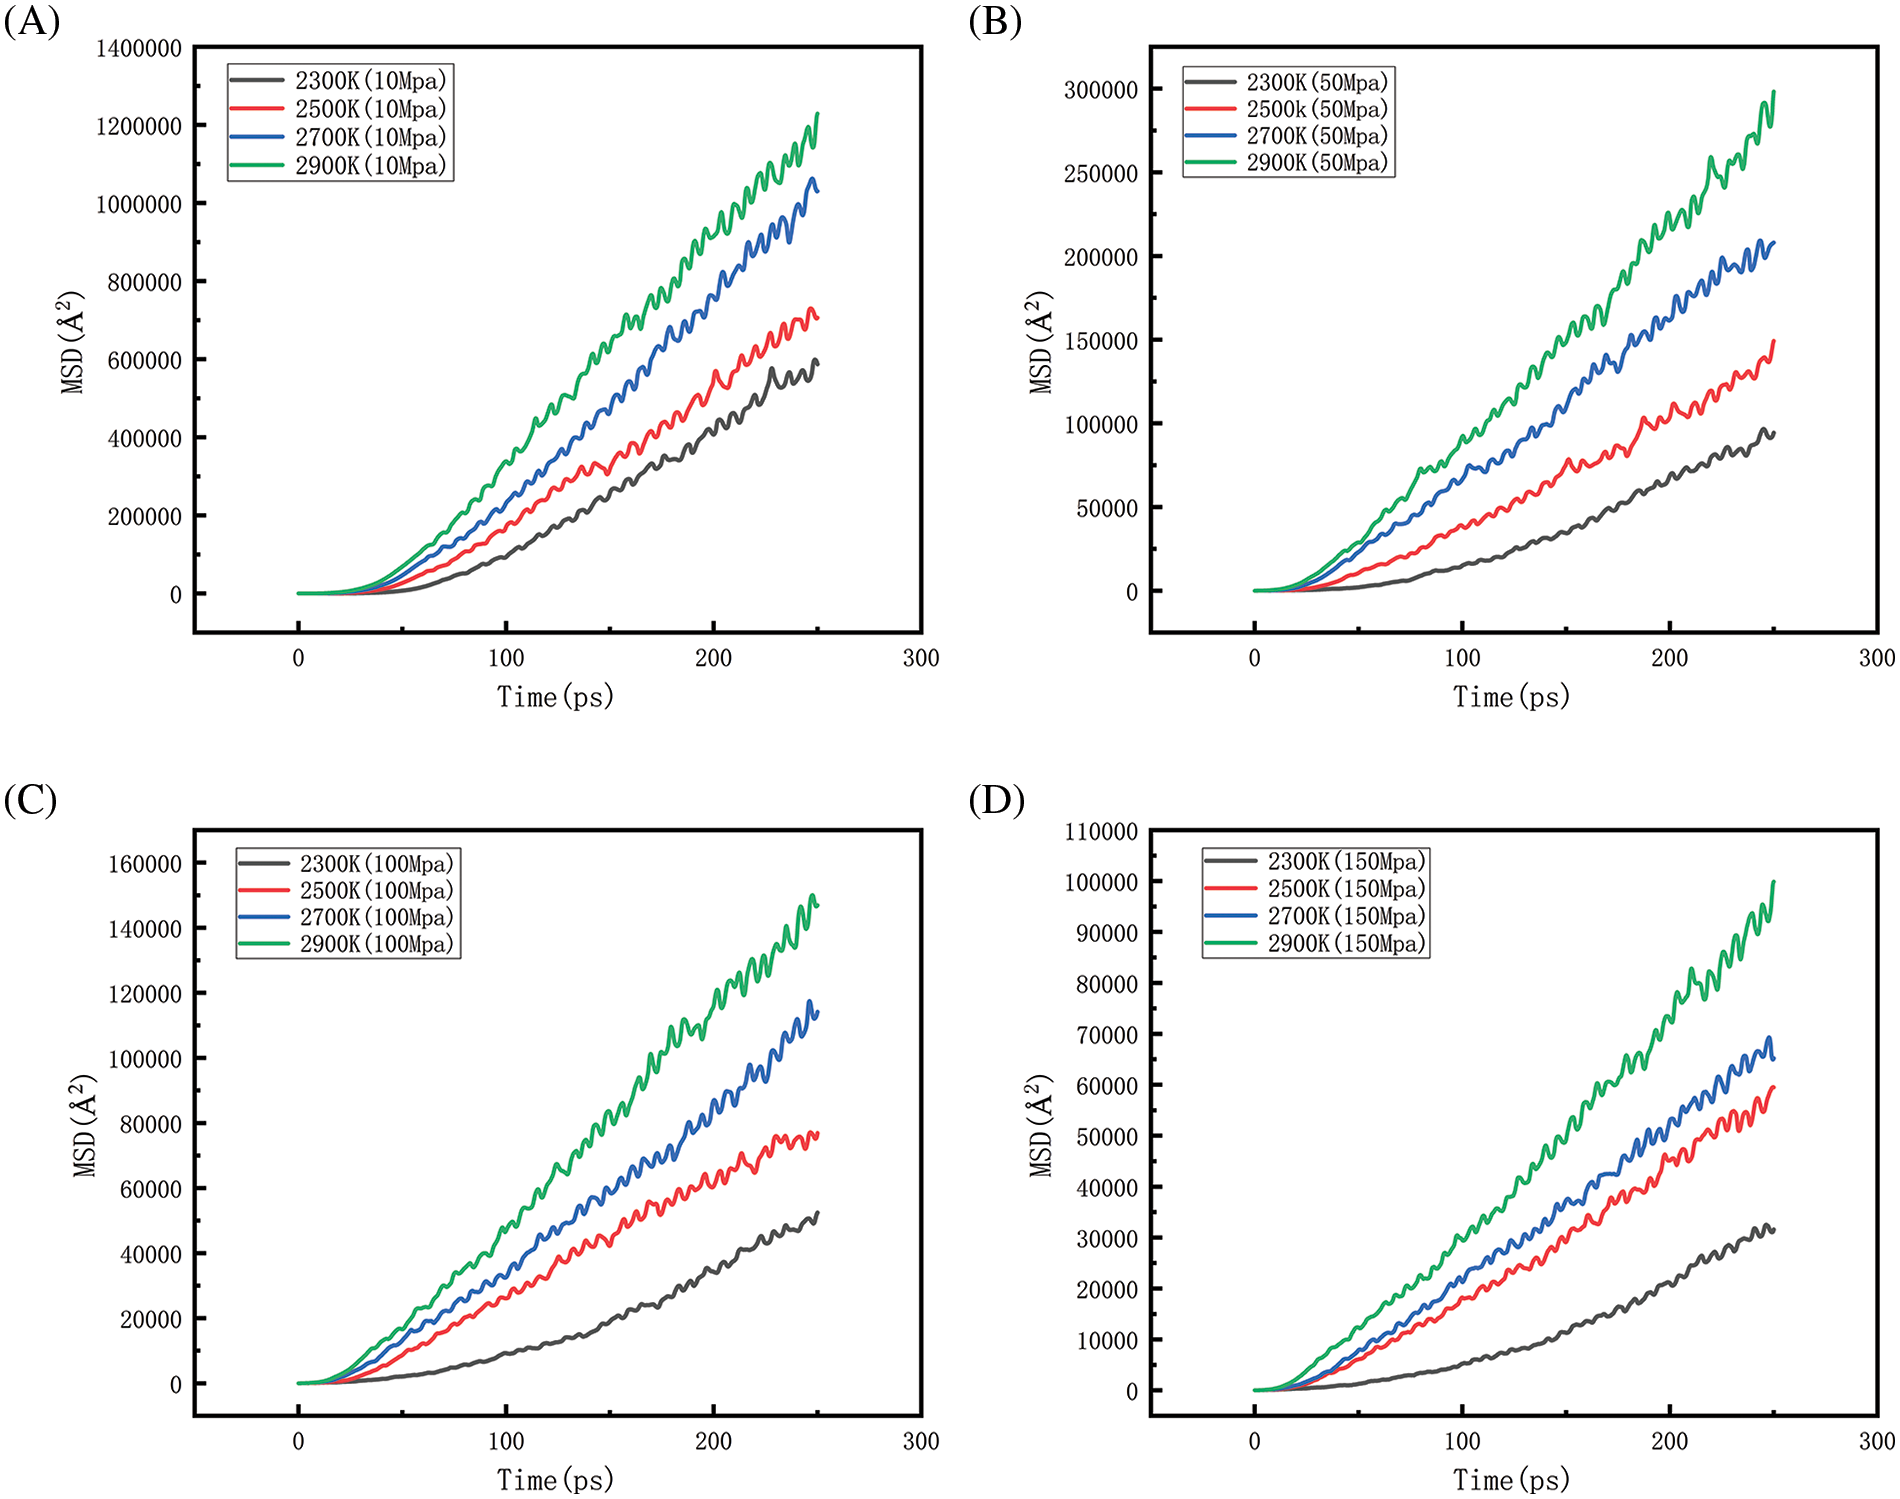
Figure 26: Changes of MSD at different temperatures when the pressure is constant (A, B, C, D represent MSD diagrams at different temperatures at 10, 50, 100 and 150 MPa, respectively)
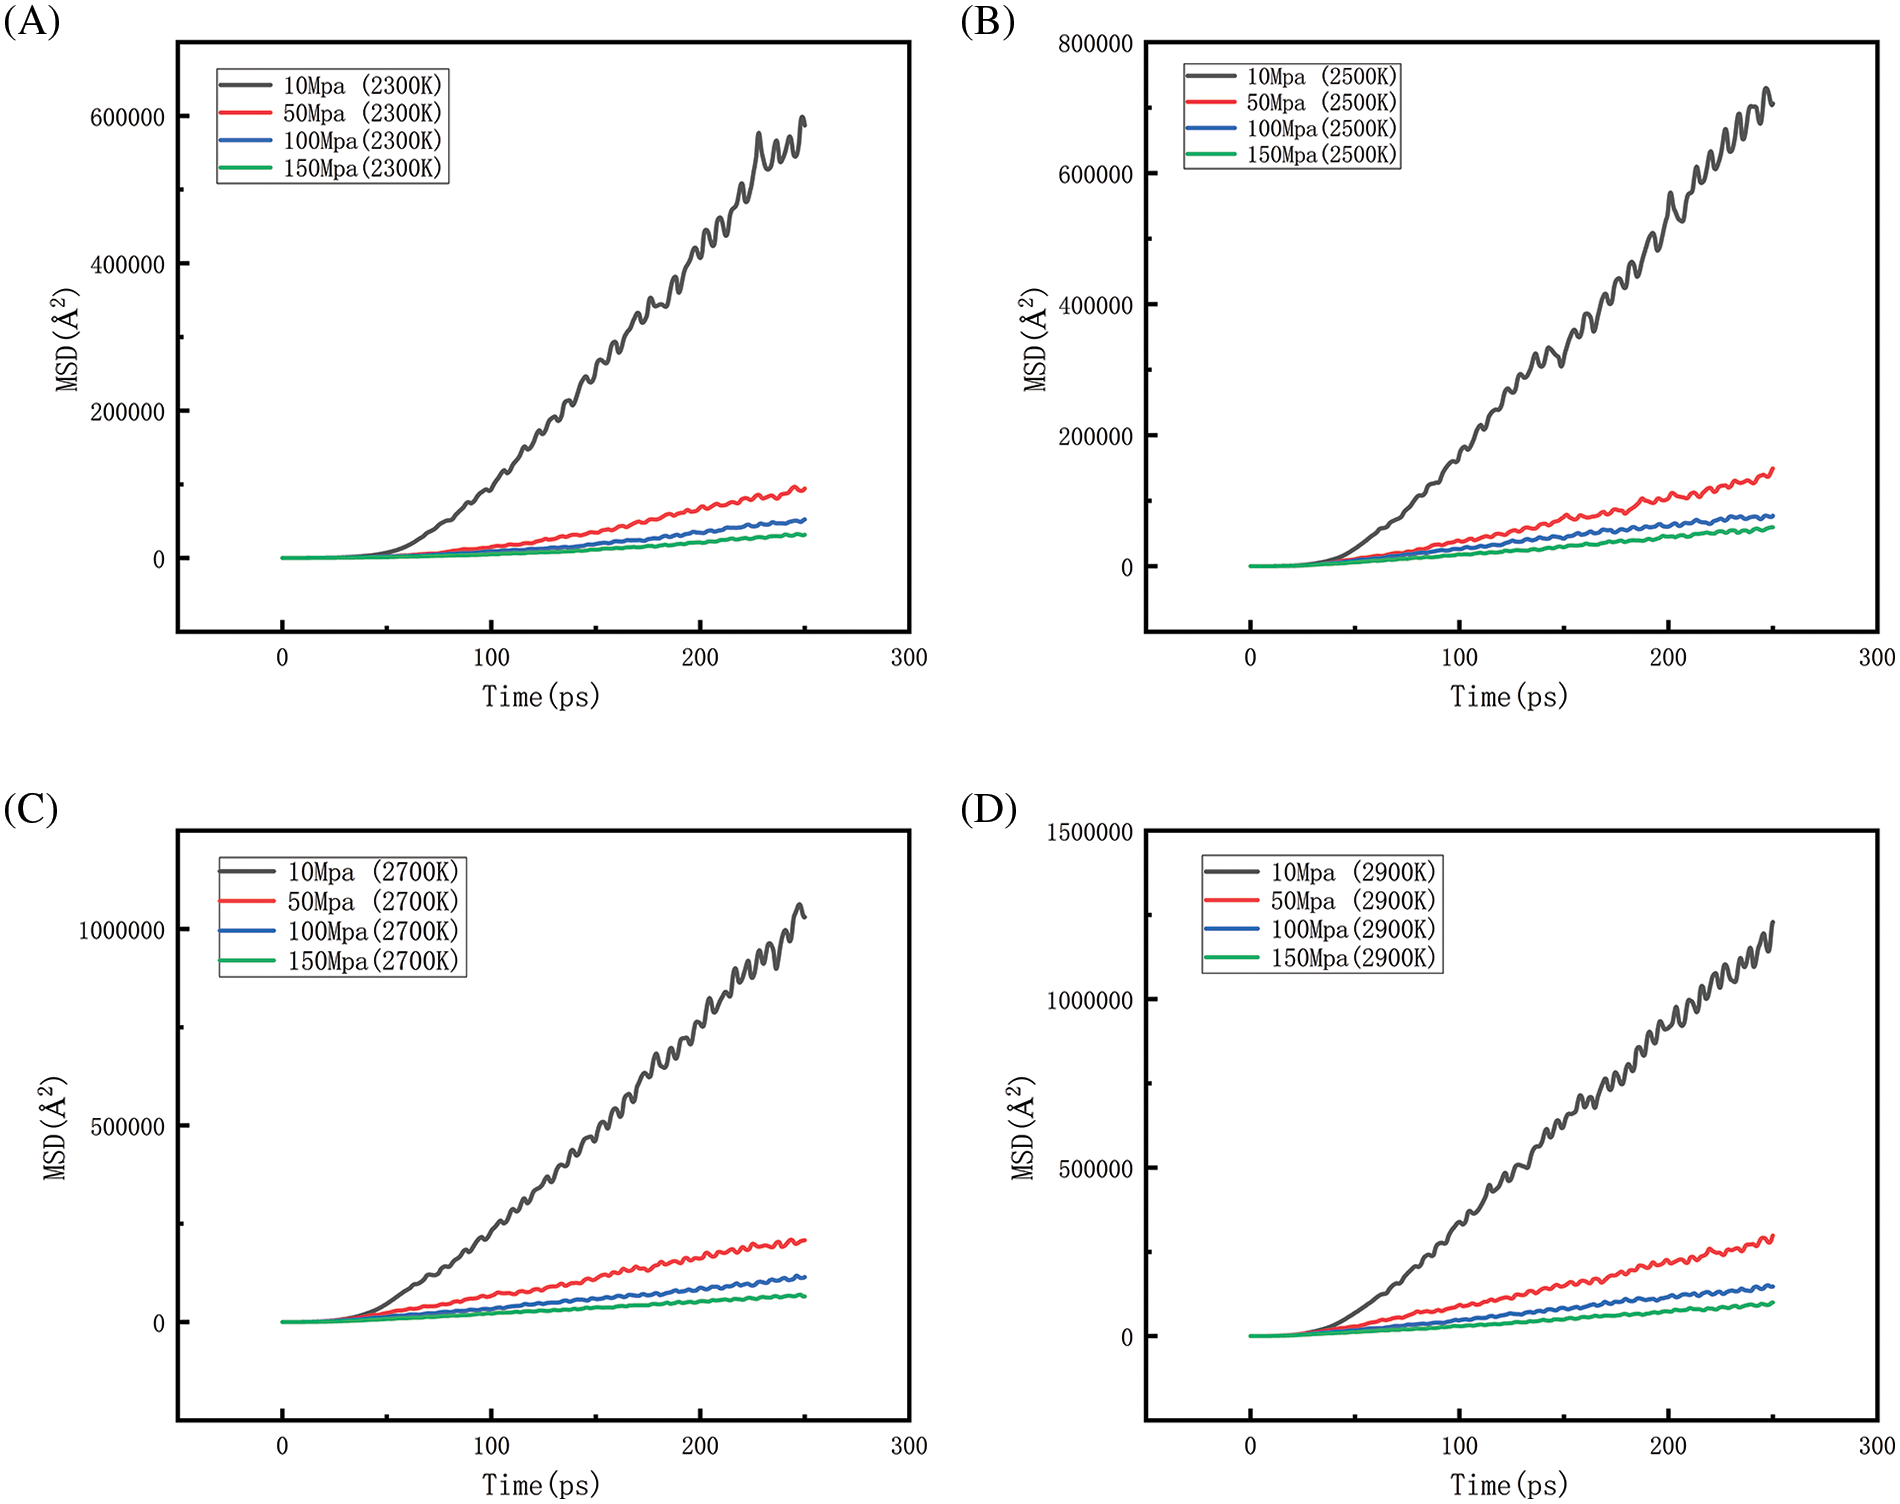
Figure 27: Changes of MSD under different pressures when the temperature is constant (A, B, C, D represent MSD diagrams of different pressures at 2300, 2500, 2700 and 2900 K, respectively)
(1) Product analysis: The products simulated under these conditions are mainly hydrogen, methane, ethylene, acetylene, and ethane. Liu et al. [16] studied the pyrolysis product distribution of polyethylene at 2000–3000 K, in which mono-olefins such as ethylene and propylene reached the maximum yield of around 2500 K, which is consistent with the results of this paper, due to the reason that the model size is different, the generation of propylene in this paper is minuscule, so it is not done statistically. Its analysis shows that when the pressure is kept stable, the generation of hydrogen, methane, acetylene, and ethane increases gradually with the increase in temperature. When the temperature remains stable, the production of hydrogen, methane, ethylene, acetylene, and ethane shows greater or lesser fluctuations as the pressure is increased because, to maintain the equilibrium of the system, an increase in the pressure of the system will tend to drive the reaction in an exothermic direction, i.e., toward the reactants, to reduce the pressure of the system.
(2) Density analysis: When the pressure is kept constant, the density of HDPE becomes lower and lower as the temperature rises because when the temperature rises, its average kinetic energy also increases, increasing the average distance between molecules. Similar results were found in the study of Ramos et al. [31]. Where the density of polyethylene decreased from 0.83 g/cm3 to about 0.72 g/cm3 with increasing temperature at 400–650 K, indicating that the density of polyethylene decreases with increasing temperature, and the same applies at 400–650 K as at 2300–2500 K. When the temperature is held constant, the density of HDPE decreases but not increasingly as the pressure continues to increase, due to intermolecular interactions.
(3) Energy analysis: The kinetic, potential, and total energies of the entire system experience a precipitous cliff-like increase to a specific value at 0 ps because the system has to make rapid adjustments to the new equilibrium state, resulting in a sudden increase in kinetic and potential energies. Subsequently, the rate of kinetic energy growth in the system becomes slower over time, and the potential energy as well as the total energy of the system, grows faster relative to the kinetic energy due to the energy conversion or distribution mechanism of the system.
(4) Mean square displacement analysis: The rate of molecular diffusion grows with temperature when the pressure is kept at a particular level, and the rate of diffusion decreases with increasing pressure when the temperature is kept at a particular level. The diffusion rate of polyethylene molecules was studied by Sun et al. [32]. Between 400 and 600 K. They discovered that when the temperature climbed, the diffusion rate went from 0.13 to 0.34 nm2/ns, indicating that a rise in temperature causes an increase in the rate of atomic diffusion.
In this paper, thermal degradation of HDPE is simulated at four different sets of pressures (10, 50, 100, and 150 MPa) with four different sets of temperatures (2300, 2500, 2700, and 2900 K), and the simulated significant generation products, densities, energies, and mean square displacements are analyzed. The results show that, in addition to ethylene, the generation of other products increases gradually with the increase in temperature, with the gradual increase of temperature, the generation of ethylene will decline, probably because the high temperature promotes the further decomposition of ethylene, the pressure changes on the product of the more complex; the increase in temperature will lead to the reduction of the density of polyethylene, the increase in pressure to a certain extent will slow down the density of the extent of the decrease; the change of the energy with The change of energy is related to the generation of products, and the heat absorption and exothermic reaction during the generation of products will affect the rise and fall of energy; the increase of temperature will promote the diffusion of molecules, and the increase of pressure will slow down the diffusion of molecules. Provides some new ideas for the recycling of polyethylene materials, and despite the obvious environmental and economic advantages of pyrolysis, there are still some challenges to its application. For example, pre-treatment of plastic wastes, scaling up of pyrolysis equipment, market acceptance of products, and techno-economic analysis require further research and development. Pyrolysis of plastic solid waste is a multifaceted and beneficial solution that promotes the sustainable concept of waste-to-resource, reduces dependence on fossil fuels, and increases the economic value of plastic waste. With the continuous improvement of technology and policy support, it is expected that this technology will play an even more important role in the field of waste treatment and resource recovery in the future.
Acknowledgement: We sincerely thank the anonymous reviewers for their constructive comments, which led to serious improvements in the manuscript.
Funding Statement: This work was supported by the sponsored by Natural Science Foundation of Xinjiang Uygur Autonomous Region (No. 2022D01C389), the Xinjiang University Doctoral Start-Up Foundation (No. 620321029), and the Science and Technology Planning Project of State Administration for Market Regulation (No. 2022MK201).
Author Contributions: The authors confirm contribution to the paper as follows: study conception and design: Guowei Feng, Yang Wang; data collection: Qing Li; analysis and interpretation of results: Yang Wang, Wenshen Ran, Hang Dong; draft manuscript preparation: Sixi Zha, Minjun Zheng. All authors reviewed the results and approved the final version of the manuscript.
Availability of Data and Materials: The data obtained in this study are available from the corresponding author upon reasonable request.
Conflicts of Interest: The authors declare that they have no conflicts of interest to report regarding the present study.
References
1. Kiass N, Khelif R, Boulanouar L, Chaoui K. Experimental approach to mechanical property variability through a high-density polyethylene gas pipe wall. J Appl Polym Sci. 2005;97(1):272–81. doi:10.1002/app.21713. [Google Scholar] [CrossRef]
2. Brown N. Intrinsic lifetime of polyethylene pipelines. Polymer Eng & Sci. 2007;47(4):477–80. doi:10.1002/pen.20696. [Google Scholar] [CrossRef]
3. Aguado A, Becerra L, Martínez L. Glycolysis optimisation of different complex PET waste with recovery and reuse of ethylene glycol. Chem Papers. 2023;77(6):3293–303. doi:10.1007/s11696-023-02704-8. [Google Scholar] [CrossRef]
4. Font R, Aracil I, Fullana A, Martı́n-Gullón I, Conesa JA. Semivolatile compounds in pyrolysis of polyethylene. J Anal and Appl Pyrolysis. 2003;68:599–611. doi:10.1016/S0165-2370(03)00038-X. [Google Scholar] [CrossRef]
5. Roy PK, Surekha P, Rajagopal C, Choudhary V. Thermal degradation studies of LDPE containing cobalt stearate as pro-oxidant. Express Polym Lett. 2007;1(4):208–16. doi:10.3144/expresspolymlett.2007.32. [Google Scholar] [CrossRef]
6. Mo SJ, Zhang J, Liang D, Chen HY. Study on pyrolysis characteristics of cross-linked polyethylene material cable. Procedia Eng. 2013;52:588–92. [Google Scholar]
7. Xue Y, Zhou S, Brown RC, Kelkar A, Bai X. Fast pyrolysis of biomass and waste plastic in a fluidized bed reactor. Fuel. 2015;156:40–6. [Google Scholar]
8. Du Y, Jiang X, Lv G, Jin Y, Wang F, Chi Y, et al. TG-DSC and FTIR study on pyrolysis of irradiation cross-linked polyethylene. J Mater Cycles Waste Manag. 2017;19:1400–4. [Google Scholar]
9. Kumari A, Kumar S. Pyrolytic degradation of polyethylene in autoclave under high pressure to obtain fuel. J Anal Appl Pyrolysis. 2017;124:298–302. [Google Scholar]
10. Honus S, Kumagai S, Fedorko G, Molnár V, Yoshioka T. Pyrolysis gases produced from individual and mixed PE, PP, PS, PVC, and PET—Part I: production and physical properties. Fuel. 2018;221:346–60. [Google Scholar]
11. Cheng L, Gu J, Wang Y, Zhang J, Yuan H, Chen Y, et al. Polyethylene high-pressure pyrolysis: better product distribution and process mechanism analysis. Chem Eng J. 2020;385:123866. [Google Scholar]
12. Jerdy AC, Pham T, González-Borja MÁ, Atallah P, Soules D, Abbott R, et al. Impact of the presence of common polymer additives in thermal and catalytic polyethylene decomposition. Appl Catalysis B: Environ. 2023;325:122348. [Google Scholar]
13. Zhang F, Yang R, Lu D. Investigation of polymer aging mechanisms using molecular simulations: a review. Polymers. 2023;15(8):1928. [Google Scholar] [PubMed]
14. Mastral JF, Berrueco C, Gea M, Ceamanos J. Catalytic degradation of high density polyethylene over nanocrystalline HZSM-5 zeolite. Polymer Degrad Stab. 2006;91(12):3330–8. [Google Scholar]
15. Ramin L, Assadi MHN, Sahajwalla V. High-density polyethylene degradation into low molecular weight gases at 1823 K: an atomistic simulation. J Anal and Appl Pyrolysis. 2014;110:318–21. [Google Scholar]
16. Liu X, Li X, Liu J, Wang Z, Kong B, Gong X, et al. Study of high density polyethylene (HDPE) pyrolysis with reactive molecular dynamics. Polymer Degrad Stab. 2014;104:62–70. doi:10.1016/j.polymdegradstab.2014.03.022. [Google Scholar] [CrossRef]
17. Wang Y, Li Y, Zhang C, Yang L, Fan X, Chu L, et al. A study on co-pyrolysis mechanisms of biomass and polyethylene via ReaxFF molecular dynamic simulation and density functional theory. Process Safety and Environ Protect. 2021;150:22–35. doi:10.1016/j.psep.2021.04.002. [Google Scholar] [CrossRef]
18. Hong D, Li P, Si T, Guo X. ReaxFF simulations of the synergistic effect mechanisms during co-pyrolysis of coal and polyethylene/polystyrene. Energy. 2021;218:119553. doi:10.1016/j.energy.2020.119553. [Google Scholar] [CrossRef]
19. Chen TBY, Yuen ACY, Lin B, Liu L, Lo ALP, Chan QN, et al. Characterisation of pyrolysis kinetics and detailed gas species formations of engineering polymers via reactive molecular dynamics (ReaxFF). J Anal Appl Pyrolysis. 2021;153:104931. doi:10.1016/j.jaap.2020.104931. [Google Scholar] [CrossRef]
20. Kong J, Zhou K, Ren X, Chen Y, Li Y, Meng P, et al. Insight into gaseous product distribution of cross-linked polyethylene pyrolysis using ReaxFF MD simulation and TG-MS. J Anal Appl Pyrolysis. 2023;169(3):105847. doi:10.1016/j.jaap.2022.105847. [Google Scholar] [CrossRef]
21. Yao H, Li X, Dan H, Dai Q, You Z. Compatibility investigation of waste plastics in bitumen via a molecular dynamics method. Elect Res Archive. 2023;31(12):7224–43. doi:10.3934/era.2023366. [Google Scholar] [CrossRef]
22. Chin SA. Fundamental derivation of two Boris solvers and the Ge-Marsden theorem. Phys Rev E. 2021;104(5):055301. doi:10.1103/PhysRevE.104.055301. [Google Scholar] [PubMed] [CrossRef]
23. Samaniego-Rojas JD, Gaumard R, Alejandre J, Mineva T, Geudtner G, Köster AM. A molecular mechanics implementation of the cyclic cluster model. Zeitschrift für Naturforschung B. 2024;79(4):201–13. doi:10.1515/znb-2023-0090. [Google Scholar] [CrossRef]
24. Lu X, Wang X, Li Q, Huang X, Han S, Wang G, et al. A ReaxFF-based molecular dynamics study of the pyrolysis mechanism of polyimide. Polymer Degrad Stab. 2015;114(4):72–80. doi:10.1016/j.polymdegradstab.2015.02.004. [Google Scholar] [CrossRef]
25. Van Duin AC, Dasgupta S, Lorant F, Goddard WA. ReaxFF: a reactive force field for hydrocarbons. J Phy Chem A. 2001;105(41):9396–409. doi:10.1021/jp004368u. [Google Scholar] [CrossRef]
26. Afroz MM, Shin YK, Van Duin AC, Li-Oakey KD. ReaxFF reactive force field model enables accurate prediction of physiochemical and mechanical properties of crystalline and amorphous shape-memory polyurethane. J Appl Polym Sci. 2023;140(39):e54466. [Google Scholar]
27. Song L, Zhang TC, Zhang Y, Chen BC, Wu M, Zhou SQ, et al. Simulations on the oxidation of Al-Mg alloy nanoparticles using the ReaxFF reactive force field. Mater Today Commun. 2023;35:106180. [Google Scholar]
28. Xuan W, Wang H, Yan S, Xia D. Exploration on the steam gasification mechanism of waste PE plastics based on ReaxFF-MD and DFT methods. Fuel. 2022;315:123121. [Google Scholar]
29. Salmon E, Van Duin AC, Lorant F, Marquaire PM, Goddard III WA. Early maturation processes in coal. Part 2: reactive dynamics simulations using the ReaxFF reactive force field on Morwell Brown coal structures. Organic Geochem. 2009;40(12):1195–209. [Google Scholar]
30. Wolf M, Vallverdu GS. Reactive molecular dynamics simulations of plastics pyrolysis with additives: comparison of ReaxFF branches and experimental results. J Anal Appl Pyrolysis. 2024;177:106266. [Google Scholar]
31. Ramos J, Vega JF, Martinez-Salazar J. Molecular dynamics simulations for the description of experimental molecular conformation, melt dynamics, and phase transitions in polyethylene. Macromolecules. 2015;48(14):5016–27. doi:10.1021/acs.macromol.5b00823. [Google Scholar] [CrossRef]
32. Sun C, Hou C, Zhang Y. Molecular dynamic simulation of polyethylene chain at different temperatures and pressures. Sustain Energ Technol Assess. 2022;52(2):102096. doi:10.1016/j.seta.2022.102096. [Google Scholar] [CrossRef]
Cite This Article
 Copyright © 2024 The Author(s). Published by Tech Science Press.
This work is licensed under a Creative Commons Attribution 4.0 International License , which permits unrestricted use, distribution, and reproduction in any medium, provided the original work is properly cited.
 Downloads
 Citation Tools