
 Submit a Paper
 Propose a Special lssue
 Open Access
ARTICLE

Simulation Study on the Heat Transfer Characteristics of a Spray-Cooled Single-Pipe Cooling Tower
1 Tianjin Key Lab of Refrigeration Technology, Department of Refrigeration and Low Temperature Engineering, Tianjin University of Commerce, Tianjin, 300134, China
2 Jiangsu Yongzhiyu Technology Development Co., Ltd., Xuzhou, 221700, China
3 Shandong Onar Refrigeration Technology Co., Ltd., Binzhou, 256600, China
* Corresponding Author: Kaiyong Hu. Email:
Fluid Dynamics & Materials Processing 2024, 20(9), 2109-2126. https://doi.org/10.32604/fdmp.2024.050773
Received 17 February 2024; Accepted 27 May 2024; Issue published 23 August 2024
 View Full Text
 Download PDF
Abstract
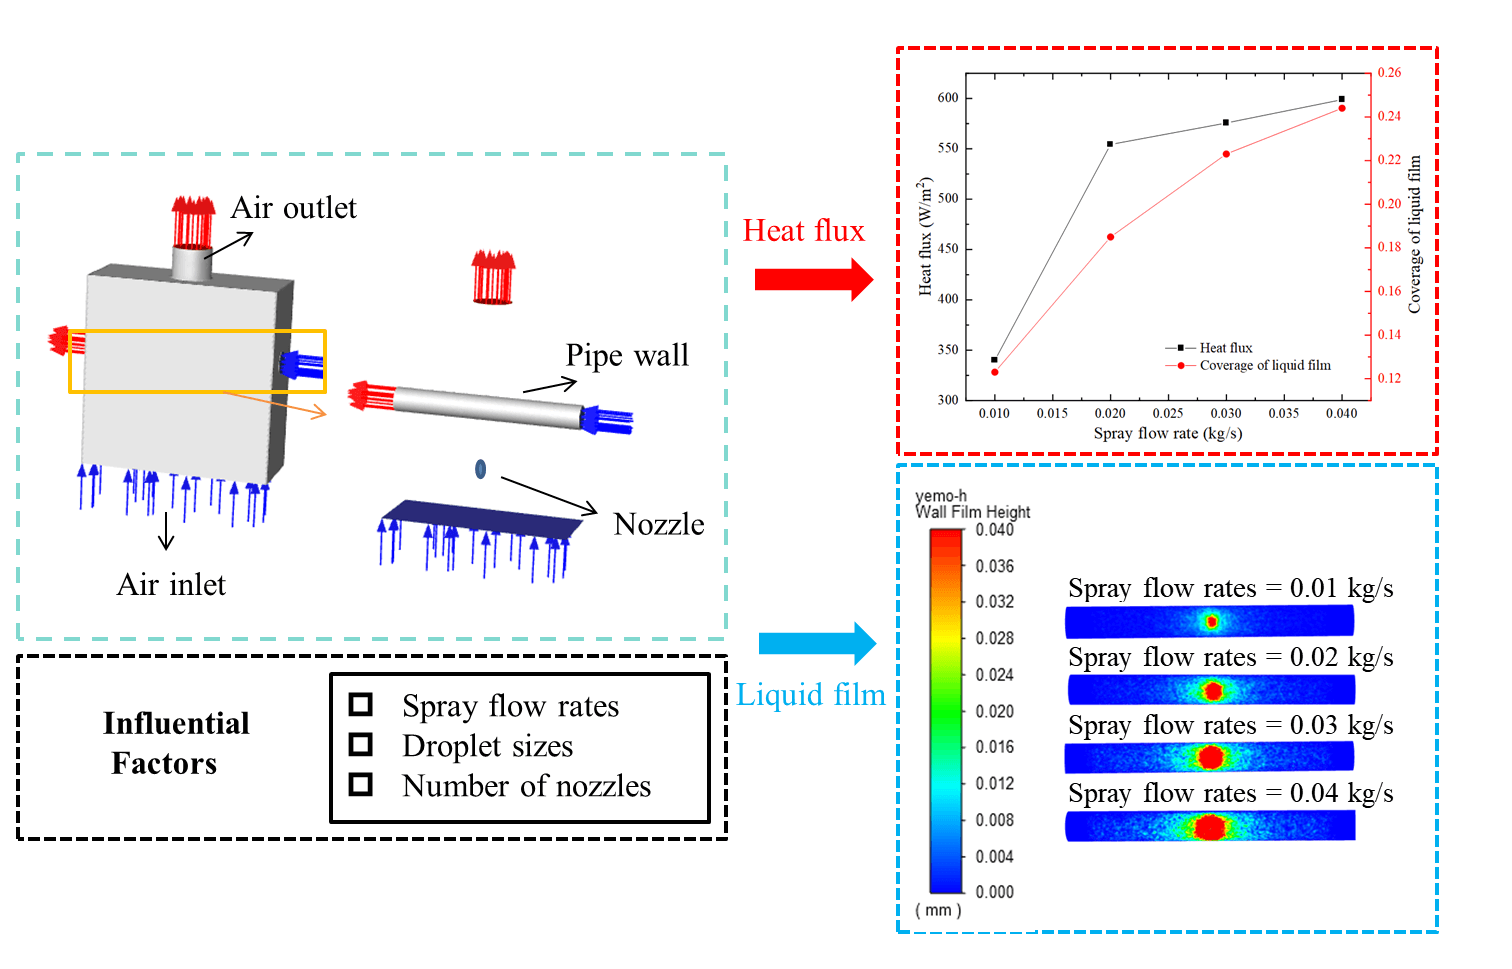
The current study focuses on spray cooling applied to the heat exchange components of a cooling tower. An optimization of such processes is attempted by assessing different spray flow rates and droplet sizes. For simplicity, the heat exchanger of the cooling tower is modeled as a horizontal round tube and a cooling tower spray cooling model is developed accordingly using a computational fluid dynamics (CFD) software. The study examines the influence of varying spray flow rates and droplet sizes on the heat flow intensity between the liquid layer on the surface of the cylindrical tube and the surrounding air, taking into account the number of nozzles. It is observed that on increasing the spray flow strength, the heat flow intensity and extent of the liquid film in the system are enhanced accordingly. Moreover, the magnitude of droplet size significantly impacts heat transfer. A larger droplet size decreases evaporation in the air and enhances the deposition of droplets on the round tube. This facilitates the creation of the liquid film and enhances the passage of heat between the liquid film and air. Increasing the number of nozzles, while maintaining a constant spray flow rate, results in a decrease in the flow rate of each individual nozzle. This decrease is not favorable in terms of heat transfer.Graphic Abstract
Keywords
Nomenclature
| | Heat exchange area between the liquid film and the air, m2 |
| | Surface area of the droplet, m2 |
| | Resistance coefficient |
| | Specific heat capacity, J/(kg⋅K) |
| | Heat capacity of the species in the |
| | Constants for the |
| | Function of the mean strain and rotation rates, the angular velocity of the system rotation, and the turbulence fields ( |
| | Mass diffusion coefficient |
| | Thermal diffusion coefficient |
| | Total energy |
| | Turbulent kinetic energy produced |
| | Turbulent kinetic energy |
| | Diffusion flux of species |
| | Static pressure, Pa |
| | Prandtl number |
| | Heat dissipation of the horizontal circular tube, kJ/s |
| | Reynolds number |
| | Net rate of production of species |
| | Turbulent Schmidt number |
| | Energy source term |
| | Source term produced by discrete-phase transition |
| | User-defined source terms |
| | Mass source term |
| | Momentum source term |
| | Average temperature of the liquid film, K |
| | Average temperature of air outside the tube, K |
| | Temperature difference in the pipe between the hot water inlet and outflow, K |
| | Change in droplet temperature in the control volume, K |
| | Contribution of wave expansion to the total dissipation rate in compressible turbulence |
| | Local mass fraction of different component |
| | Constant pressure specific heat at the average temperature of the hot water in the pipe, kJ/(kg·K) |
| | Diameter of droplets, mm |
| | Gravitational acceleration, m/s2 |
| | Convective heat transfer coefficint, W/(m2⋅K) |
| | Convective heat transfer coefficient, W/(m2⋅K) |
| | Mass transfer coefficient, kg/(m2⋅s) |
| | Latent heat, J/kg |
| | Enthalpy of the water vapor, J/kg |
| | Turbulent kinetic energy |
| | Effective thermal conductivity, |
| | Thermal conductivity of fluid, W/(m⋅K) |
| | Mass of the droplet, kg |
| | Mass flux of droplets, kg/s |
| | Average mass of droplets in control volume, kg/s |
| | Initial mass of droplet particles, kg |
| | Initial droplet mass flux, kg/s |
| | Mass change of droplets when passing through each control volume, kg |
| | Mass flow rate of hot water in the horizontal circular tube, kg/s |
| | Number of tubes in the first row of tube bundles |
| | System time, s |
| | Continuous phase velocity field, m/s |
| | Velocity of the droplet, m/s |
| | Humidity mass ratio in the gas-phase side of the liquid–gas interface and in humid air, |
| | Turbulent dissipation rate |
| | Molecular viscosity of wet air, Pa⋅s |
| | Continuous phase viscosity, Pa⋅s |
| | Turbulent viscosity, Pa⋅s |
| | Density, kg/m3 |
| | Density of the droplet, kg/m3 |
| | Turbulent Prandtl numbers |
| | Relaxation time of the droplet |
Cooling towers are extensively used and studied across various industries [1–3]. They can be categorized into dry and wet cooling towers [4,5]. Wet cooling towers, offering smaller heat transfer areas but higher efficiency than dry towers, hold greater promise for applications [4]. In closed wet cooling towers, the traditional packing is replaced by a water shower device. Here, spray water, driven by a pump, contacts the outer surface of the tube, effectively cooling the fluid inside without direct contact, thus ensuring that the process water remains uncontaminated [6]. Studies have indicated that closed wet cooling towers outperform open towers in terms of heat transfer [7,8], leading to significant interest and research in closed cooling tower technology [9–12].
In a closed wet cooling tower, hot water flows through a coil and undergoes cooling as it interacts with the air and spray water surrounding the tube. Heat from the hot water transfers to the pipe wall through a combination of convection and conduction. The spray water forms a liquid film on the outer surface of the pipe, absorbing heat from the pipe wall. This liquid film then engages in convective heat transfer with the surrounding air, and the heat is released to the air outside the pipe. The intricate heat transfer mechanisms in cooling towers have become a central focus of research [13–15]. Studies on cooling tower heat transfer characteristics have emphasized factors such as environmental conditions, hot water temperature, spray water quantity, and air intake volume. The heat transfer process in a liquid film involves both heat and mass transfer; thus, heat and mass transfer in thin films is a complex area that has been extensively explored by researchers [16–18]. Two prominent theories, proposed by Poppe et al. [16] and Merkel [17], have gained significant recognition in this field. Additionally, Heyns et al. [18] has made valuable contributions by establishing heat transfer coefficients for water films and mass transfer coefficients for air.
To mitigate the costs associated with performance testing for cooling towers, exploring alternative methods is crucial [19]. With the advancements in computer technology, simulating heat transfer performance through computational fluid dynamics (CFD) has emerged as a popular approach. Facao et al. [20] and Ma et al. [21] employed CFD simulations to investigate heat and mass transfer mechanisms in cooling towers and evaporative coolers. They validated their findings by comparing them with experimental data, noting deviations within acceptable limits. Jiang et al. [22] conducted a numerical analysis of flow and heat transfer characteristics in a cross-flow staggered tube bundle with varying Prandtl numbers using CFD simulation. The study revealed that the tube bundle surface demonstrated heat transfer non-uniformity when mercury and water were used as working materials, with mercury exhibiting a lower non-uniformity coefficient than water. Deeb [23] explored the heat transfer characteristics and flow behavior of six rows of mixed tube bundles, including round and teardrop shapes, through Fluent simulation. The findings indicated that the cross-sectional shape and positioning of tubes within the bundle had a significant impact on heat transfer and pressure drop. Additionally, the mixed tube bundles demonstrated superior heat transfer compared with teardrop-shaped bundles, although with a higher coefficient of friction than round tube bundles. Xie et al. [24] developed a three-dimensional CFD model to analyze the countercurrent flow of air-water between staggered tubes in a closed wet cooling tower. The study underscored that the model, incorporating the shear term and water evaporation, could offer insights into pressure drop and air distribution, thus facilitating a deeper comprehension of the heat and mass transfer mechanisms at tube interfaces. Lee et al. [25] employed CFD software to investigate the evaporative heat transfer of evaporative condenser heat exchanger tubes during liquid spray film evaporation. The research demonstrated that the liquid film thickness surrounding the heat exchanger tube, average heat transfer coefficient, and experimental data were in good alignment, particularly with moderate water spray flow rates, leading to a more uniform distribution of heat transfer coefficients. Khan et al. [26] conducted a simulation study on heat transfer and pressure drop in a corrugated tube bundle. The results indicated that twisted surface tubes offered enhanced heat transfer, although at the expense of increased pressure drop. The total heat transfer coefficient on the air side correlated positively with pressure drop and Reynolds number. However, studies have typically assumed homogeneous heat flow properties of wet air and water perpendicular to the planar direction of the spray, leading to a focus on two-dimensional simulations [20–23]. Conversely, three-dimensional simulations can depict the generation of liquid film from the spray on the tube wall [24–26], providing a convenient means to explore the distribution of the liquid film and the spatial distribution of air and droplets. Therefore, the development of three-dimensional simulations is crucial. In closed wet cooling towers, the drenching device consumes a significant amount of water. Considering the current emphasis on water conservation [27], investigating modifications to the drenching device while maintaining the high heat transfer efficiency of the device could be a promising avenue of research to meet water conservation goals. However, spray cooling features some drawbacks, such as the additional power consumption required for spray generation and the necessity to ensure the cleanliness of water entering the nozzles to prevent nozzle clogging.
Spray cooling technology involves atomizing pressurized liquid into small droplets, facilitating evaporation in the air. This evaporation process requires heat absorption, causing the liquid-phase droplets to transition into the gas phase. As a two-phase heat transfer method, spray cooling efficiently harnesses the latent heat of the liquid, resulting in a significant heat transfer capacity [28,29]. Moreover, compared with water-drenching systems, spray cooling technology consumes less water, making it a promising approach for water conservation and enhancing cooling tower efficiency. Therefore, the integration of spray cooling technology in cooling towers has yielded promising results in terms of water conservation and improving the heat transfer coefficient. Currently, the primary pre-cooling method used in cooling towers is spray cooling technology [30,31]. In closed cooling towers, pressure nozzles or air-assisted nozzles are commonly employed to generate spray, with limited emphasis on investigating the heat transfer components. Previous research has shown that variables such as spray flow rate [32], particle size [33], and the number of nozzles [34] significantly influence heat transfer in spray cooling. Additionally, the presence of a liquid film plays a critical role in heat transfer between the heat exchanger and the air side [35,36].
In conclusion, employing CFD to simulate the heat exchange properties of closed cooling towers represents a promising research avenue. However, current studies in this domain have predominantly concentrated on two-dimensional simulations, with only a limited number focusing on three-dimensional analyses. Despite the growing interest in spray cooling technology owing to its remarkable cooling capabilities, research on its application in cooling towers, particularly concerning the direct interaction between spray droplets and heat exchange elements, is scarce. The present study aims to investigate the heat transfer efficiency of spray cooling technology on heat exchange components within closed cooling towers. To achieve this, the study focuses on analyzing the horizontal circular tube within a cooling tower using CFD numerical simulation. Specifically, it examines the impact of spray characteristics on the heat transfer properties of the liquid film and air side. This analysis involves varying parameters such as nozzle flow rate, droplet size, and the number of nozzles.
Fig. 1 presents a schematic of the physical model utilized in this simulation. The model comprises a combination of a rectangular and cylindrical shell on the exterior, while the interior features a horizontal transverse circular tube through which a liquid flows and undergoes cooling. The housing possesses rectangular dimensions of 500 mm × 200 mm × 500 mm. The cylindrical base of the housing is centrally positioned on the upper surface of the rectangle, with the cylinder itself having a diameter of 150 mm and a height of 80 mm. A horizontal circular tube is located within the rectangular area of the housing. The center of this circle is positioned at a height of 375 mm, and the tube measures 50 mm in diameter and 502 mm in length.

Figure 1: Physical model for spray cooling of horizontal circular tube
2.2 Physical Models and Governing Equations
The spray model for this simulation employs a solid conical nozzle within the deformable part model (DPM) to investigate the spray cooling process. The fluid flow in the continuous phase with discrete terms can be described by the Navier–Stokes equations. Moreover, the mass and energy exchanges between the droplets and the air alter the components of the continuous phase, necessitating the tracking of component transport equations.
Continuous-phase fluids must adhere to the equations of conservation of mass, momentum, and energy. Additionally, considering that the evaporation of droplets alters the volume fraction of the air phase, it is essential to introduce the component transport equation, which is expressed as follows [32,37,38]:
(1) Conservation of mass equation
where
(2) Conservation of momentum equation
where
(3) Conservation of energy equation
where
(4) Species transport
where
For laminar flow:
where
For turbulent flow:
where
A discrete-phase droplet moving through continuous-phase air will experience the combined effects of gravity, air resistance, and buoyancy. The equations of motion for a discrete-phase droplet can be described by Newton’s second law [32].
where
where
The droplets are assumed to be spherical for this simulation; therefore, the droplet resistance can be expressed as follows [32]:
The Reynolds number of a droplet with respect to air can be expressed as follows:
2.2.3 Realizable k–epsilon Model
The Reynolds averaging method is commonly employed in engineering applications for turbulence calculation, offering various turbulence models in CFD. Among these models, the realizable k–epsilon model can be applied to free flow, jet flow, and boundary layer flow. Given the high degree of turbulence resulting from droplets being sprayed into the air and impacting the hot surface for heat transfer, the realizable k–epsilon model has been widely used in spray simulation [32,37]. Therefore, this paper also adopts the realizable k–epsilon model to describe the turbulence.
The realizable k–epsilon model equations are described below:
Turbulent viscosity of air
where
and
where
2.2.4 Heat and Mass Transfer to the Droplet
Prior to the discrete droplets colliding with the heated wall in the study, the droplets travel through the continuous phase’s air and exchange heat with it via the processes of convection, thermal radiation, and droplet evaporation. Considering that radiative heat transfer is neglected in this simulation, the heat balance equation of the droplet particles can be written as the sum of the sensible heat change and the latent heat change [38]:
where
2.2.5 Two-Way Coupling Equations
In this simulation, discrete-phase droplets undergo evaporation, engaging in heat and mass exchange with the continuous-phase air. Hence, a two-way coupling method is utilized to compute both the continuous and discrete phases. The mass, momentum, and energy exchange between droplets and the continuous phase per unit volume are integrated into the three conservation equations. The formulas for computing mass, momentum, and energy exchange between continuous and discrete phases are outlined as follows [39]:
where
2.3 Heat Transfer Coefficient between Liquid Film and Air
The heat load in this simulation equals the heat dissipation of the hot water inside the horizontal circular tube, as the hot water within the tube is cooled by the spray droplets and air outside the tube. Consequently, the heat of the hot water inside the tube primarily transfers to the liquid film or air outside the tube through the tube wall, and the heat absorbed by the liquid film is eventually transferred to the air. The following formula can be used to determine the heat dissipation of the horizontal circular tube:
where
The heat transfer within the system must comply with Newton’s law of cooling, as the heat from the hot water inside the tube is conveyed to the liquid film outside the tube, ultimately transferring the heat to the air [40,41].
where h is the convective heat transfer coefficient from the liquid film to air; A denotes the heat exchange area between the liquid film and the air;
The area of the liquid film in contact with the air is not always equal to the area of the tube’s outer wall. Researchers often employ the formula developed by Zalewski et al. [42] to determine the contact area of the liquid film with the air. The following formula can be used to calculate the contact area between the liquid film and the air as the liquid flows through the circular tube:
Considering that the external shell is adiabatic, the heat released from the hot water inside the tube must equal the heat absorbed by the air according to the principle of conservation of energy. Consequently, the heat transfer coefficient h between the liquid film and the air can be expressed as follows:
The ambient temperature is set to 298.15 K, the working pressure to 1 atm, and the gravitational effect is accounted for using g = 9.81 m2/s. The temperature and flow rate of the hot water within the tube are 333.15 K and 0.5 m/s, respectively. The air outside the tube has a temperature of 298.15 K and a flow rate of 2 m/s.
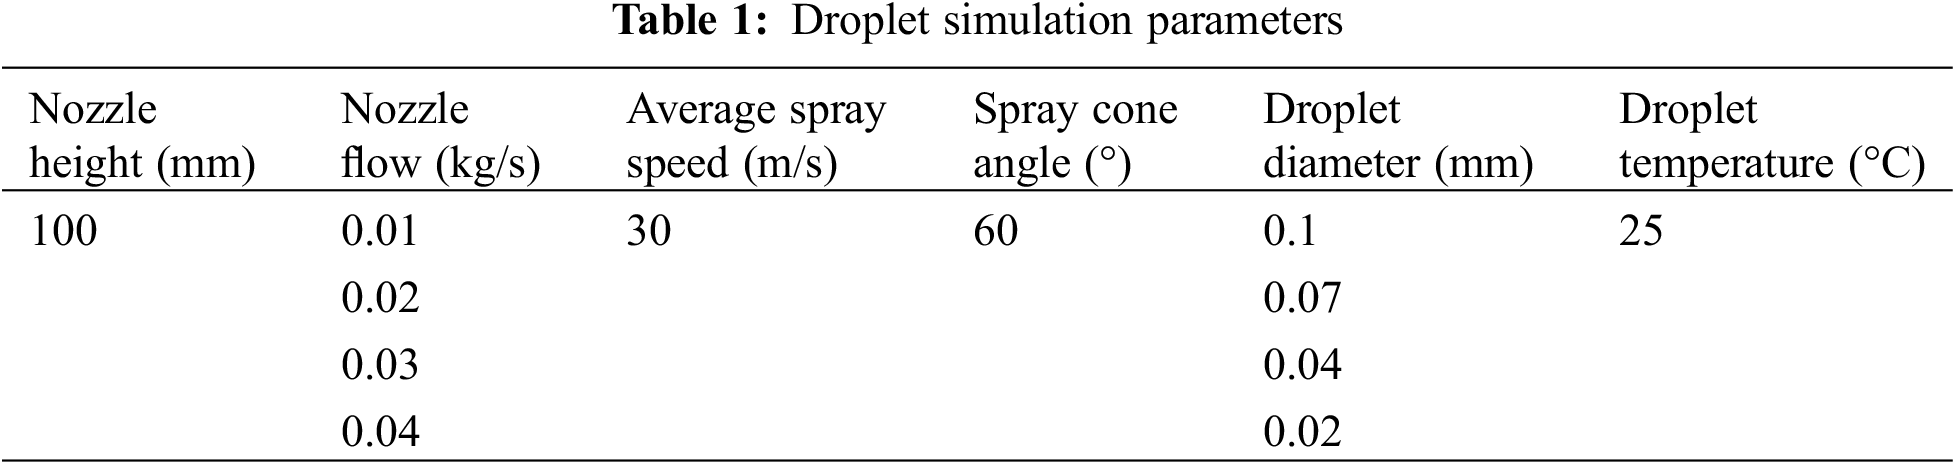
The DPM cone model is utilized to generate the spray droplets, and Table 1 provides the details of each model. Boundary conditions with discrete terms are employed to determine particle trajectories when they intersect a physical boundary, such as a wall or inlet. When the boundary condition is set to “reflect”, the particle rebounds and undergoes a change in momentum based on the bounce coefficient. Further details can be found in reference [38]. Under the “trap” boundary condition, the particle ceases its orbit computation and is labeled “trapped”. In the case of evaporating particles, the entire mass immediately converts into the vapor phase upon contact with the wall. When the boundary condition is “escape”, the particle is deemed “escaped”, and the orbit calculation is terminated. This indicates that the droplets or particles have exited the flow field or system being simulated, leaving the defined simulation area and ceasing to interact with the flow field. If the boundary condition is “wall film”, a liquid film forms when a droplet impacts the wall. The interaction between the droplet and the film is determined by factors such as impact energy and critical temperature, leading to various outcomes such as splash, bounce, adhesion, and diffusion. Information on the conditions for judging these interactions is detailed in [38]. The film is modeled using the Lagrangian liquid film model, which is well-suited for simulating spray droplets. This model accounts for evaporative heat transfer and is applicable to the outer surface of a horizontally oriented circular tube. In this study, the commercial software ANSYS FLUENT (version 20 R2) is employed to numerically solve the governing equations.
In this simulation, the Fluent3D numerical simulation model is employed, and the finite volume method is utilized to discretize the governing equations. Throughout the simulation process, the SIMPLEC algorithm is utilized to couple the pressure field and the velocity field due to its superior convergence [37,43]. Both the convection term and the viscous term are discretized using a second-order discrete format. The time step is set to 50 μs, with 20 iterations in Δt [37,44,45]. Space discretization is conducted through the least squares cell-based discretization, while transient time discretization is conducted using a second-order upwind scheme.
The precision of CFD computations heavily relies on the quality of the mesh employed. The simulation accounts for convective heat transfer occurring between the air and the exterior wall of the tube, as well as between the fluid inside the tube and the tube’s wall. Additionally, spray droplets adhere to the surface of the horizontal circular tube, forming a thin layer of liquid that subsequently undergoes evaporation. To ensure accuracy in the heat transfer calculation and capture the realism of droplet adhesion, conducting a mesh refinement procedure on the tube wall and adding a boundary layer to the fluid within and outside the tube during the simulation is essential. The expansion boundary layer is apparent on both the inner and outer surfaces of the tube wall in Fig. 2, which depicts the mesh of the horizontal circular tube spray cooling model. The right side of the diagram provides an enlarged perspective of the indicated positions in the left diagram.

Figure 2: Details of the model mesh
Various methods are employed for mesh quality evaluation, with average slope and quadrature quality being the most commonly used metrics [46]. The model’s grid quality is assessed according to its maximum skewness and minimum orthogonal mass, where the highest skewness is 0.68 and the minimum orthogonal mass is 0.32. The standard skewness and orthogonal mass grid measures are determined by their mean values. The model’s highest skewness and lowest orthogonal quality both fall within the “excellent” and “good” categories, respectively. This indicates that the model’s grid quality is rated as above “excellent”, and the grid has minimal impact on subsequent calculations.
To ensure the calculation’s accuracy remains independent of grid quality, we conduct a verification of grid independence. This involved using the average surface temperature and thickness of the liquid film at the exit of the horizontal circular tube as reference points, under specific working conditions. Fig. 3 illustrates the results of this verification process. The model’s calculation accuracy remains consistent regardless of the grid quantity: 840, 634, or 3,005,967. The surface average temperature of the horizontal circular pipe outlet and the surface average temperature of the liquid film show minimal changes between the two grid quantities, with relative differences of 1.96% and 0.04% respectively. Hence, employing the grid of 840,634 maintains the desired level of computation precision for the model. To save computation time, the grid quantity of 840,634 is utilized for the calculation.

Figure 3: Results of mesh independence test
To validate the accuracy of the simulation results for this model, we utilize the simulation settings from Zeng et al. [47] and compare them with the simulation results presented in the paper. The specifics of the simulation are provided in Table 2. In this simulation, the physical model consists of eight staggered tubes, with a heat flow density of 28,632.75 W/m2 at a nozzle flow of 2.52 × 10⁻³ kg/s, resulting in an average heat flow density of 3579.1 W/m2 per tube. Comparatively, for a single horizontal circular tube in this simulation, the heat flow density is 3984.053 W/m2, with a relative error of 11.31%. Hence, the simulation of this single-pipe model is considered to have exhibited a certain level of accuracy.
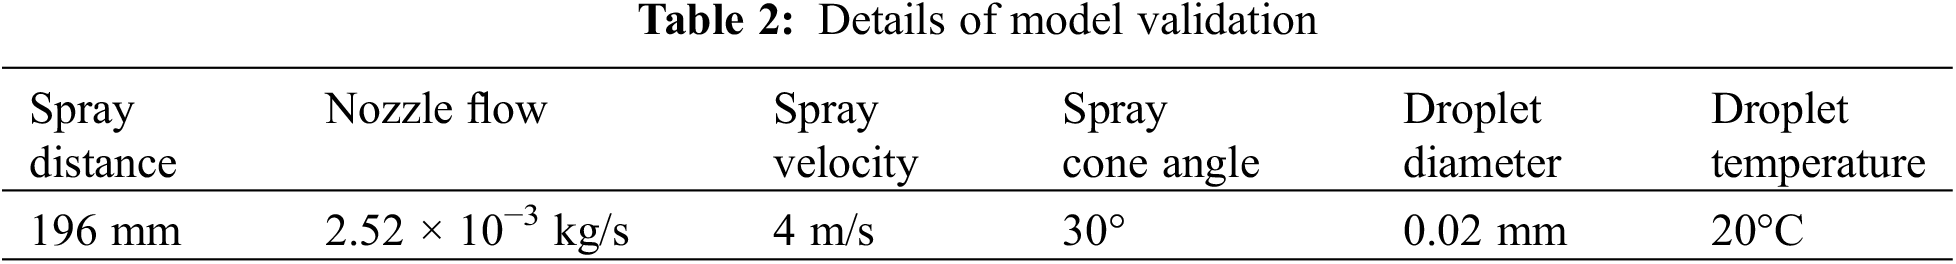
We validate our simulation by comparing it with that of Zeng et al.’s study [47]. We consider Zeng’s simulation to be accurate as they conducted both simulation and experimental validation in their study, and the highest error was within 10%. Considering the difficulty in finding experiments that exactly match our model, we utilize Zeng’s work for simulations, ensuring that the relative error is less than 15%. One aspect contributing to the potential inaccuracies in all our simulations is the assumption of dry air, as the original study does not specify the relative humidity of the air input.
3.2 Effect of Spray Flow Rate on Liquid Film Distribution and Heat Flow Density
Changes in the spray flow rate influence both the thickness of the liquid film and the heat transfer within the system. Fig. 4 illustrates the distribution of liquid film thickness for different spray flow rates, with a wind speed of 2 m/s and spray particle size of 0.1 mm. An increase in the spray flow results in a noticeable increase in the liquid film thickness, not only at the center but also on both sides. This indicates that the spray release rate significantly affects the liquid layer thickness.

Figure 4: Liquid film thickness distribution for various spray flow rates
Fig. 5 illustrates the correlation between heat flow density and liquid film coverage concerning the spray flow rate. The heat flow density of the liquid film increases with higher spray flow rates, although the rate of growth diminishes over time. Moreover, the extent of liquid film coverage progressively increases as the spray flow rate rises. This phenomenon can be attributed to the increased spray flow rate, which results in a higher number of droplets participating in heat transfer on the horizontal tube, thereby enhancing the effective droplet flow and liquid film coverage. Consequently, convective heat transfer from the tube wall to the liquid film increases, with mass transfer occurring from the liquid film to the air. However, further increasing the spray flow rate can elevate the air’s water vapor partial pressure owing to enhanced evaporation in the housing, thus reducing the mass transfer effect. This delay in droplet evaporation causes the liquid film to thicken, leading to an increase in heat flow density. Consequently, the thicker liquid coating increases the thermal resistance of the system, impeding heat passage and reducing heat flow density.
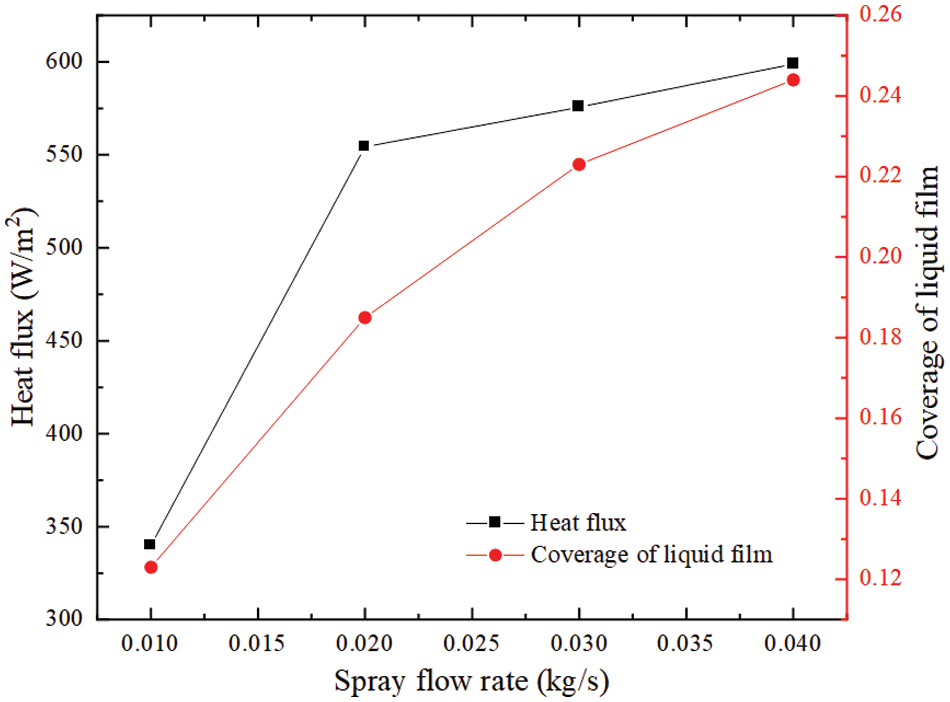
Figure 5: Heat flow density and coverage of liquid film at varying spray flow rates
3.3 Effect of Spray Particle Size on Liquid Film Distribution and Heat Flow Density
Fig. 6 illustrates the variation in liquid film thickness under different spray particle sizes when a single nozzle is used. This simulation assumes a uniform distribution of droplets and incorporates a fragmentation model. Throughout the study, the wind speed remains constant at 0.2 m/s, the spray flow rate is maintained at 0.01 kg/s, and the droplet temperature is held at 25°C. Additionally, the average spray velocity, spray angle, and spray height distance are set to 30 m/s, 60°, and 100 mm, respectively. The figure demonstrates that the thickness of the liquid film increases gradually with the size of the spray particles. This observation suggests that larger droplet sizes result in a thicker liquid film.
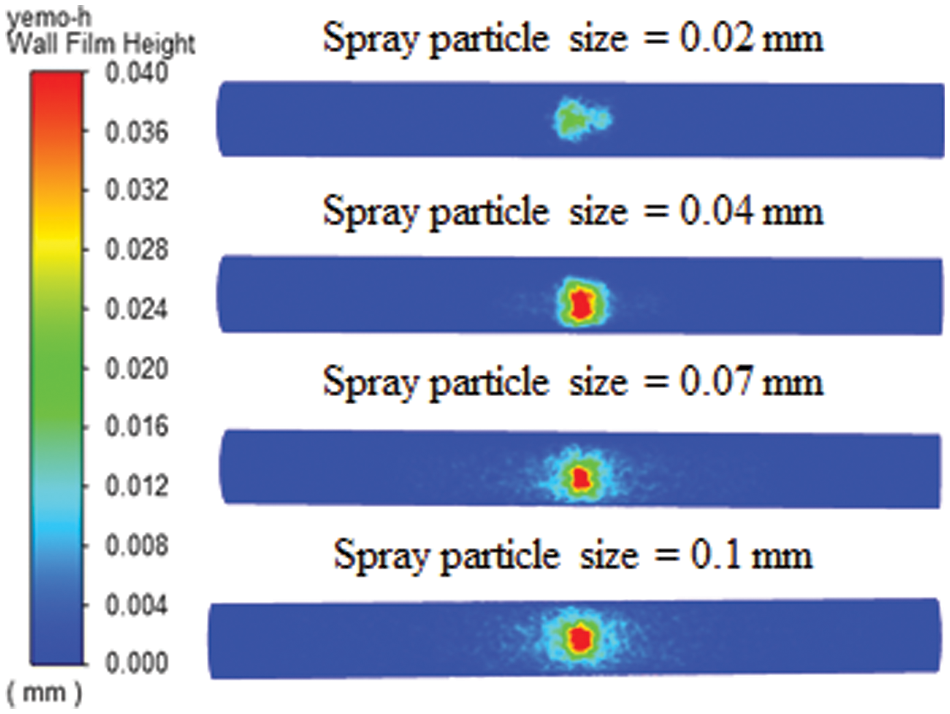
Figure 6: Liquid film thickness distribution for various droplet sizes
Fig. 7 illustrates the relationship between heat flow density, liquid film coverage, and droplet size. Smaller spray droplets evaporate more readily in the atmosphere, resulting in fewer effective droplets reaching the horizontal tube. Consequently, a larger dry area forms on the tube, primarily transferring heat to the air and thus reducing the heat flow density. As droplet size increases, both the heat flow density and liquid film thickness improve, reducing the likelihood of droplets evaporating in the air. This enhances the effectiveness of spraying onto the horizontal tube and minimizes the presence of dry areas.

Figure 7: Heat flow density and liquid film coverage at various droplet sizes
3.4 Effect of the Number of Nozzles on Liquid Film Distribution and Heat Flow Density
The spray emitted from a single nozzle onto the surface of the cylindrical tube generates only a thin layer of liquid in the sprayed region. However, increasing the number of nozzles can lead to a wider dispersion of the liquid layer on the surface of the round tube, thereby improving water evaporation and cooling of the material inside. Fig. 8 illustrates the variation in the thickness of the liquid film under specific conditions: a constant wind speed of 0.2 m/s, a spray particle size of 0.1 mm, and a spray flow rate of 0.03 kg/s, with varying numbers of nozzles. As shown in the data presented in Fig. 8, under a constant spray flow rate, increasing the number of nozzles effectively reduces the thickness of the liquid film in the center of the spray, promoting a more uniform spread of the liquid film on the circular tube.
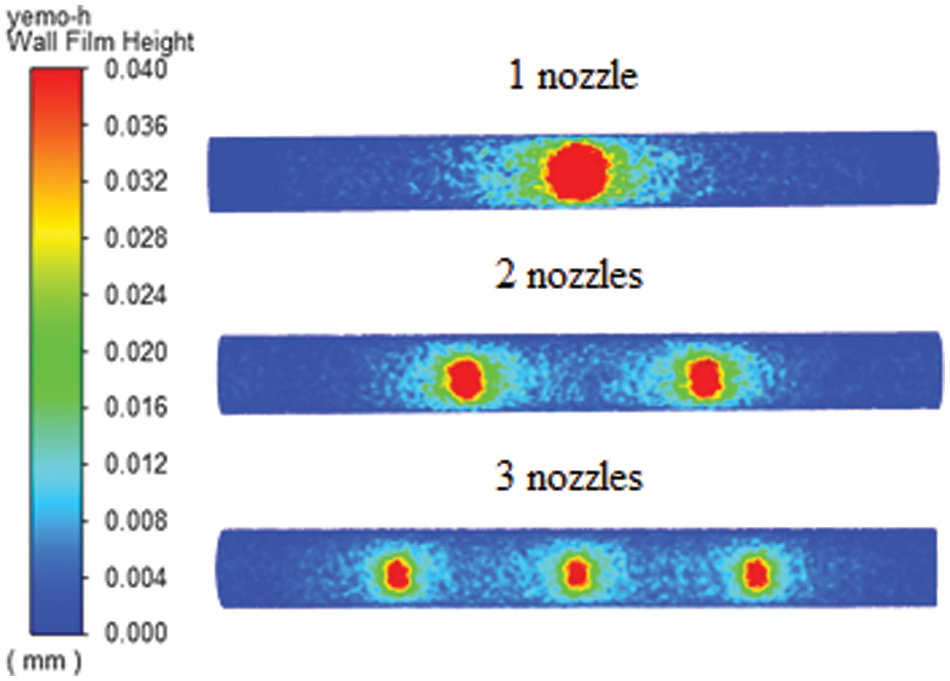
Figure 8: Liquid film thickness distribution with varying number of nozzles
Fig. 9 illustrates the relationship between the number of nozzles and the size and extent of heat transfer in the liquid film. Increasing the number of nozzles expands the coverage of the liquid film and boosts the heat flow density. This enhancement arises from the improved distribution of the liquid film on the horizontal pipe wall and the reduction in thickness at the center of the spray. Furthermore, the higher liquid film flow rate on both sides of the spray area enhances heat transfer between the liquid film and the pipe wall. However, maintaining a constant spray flow rate leads to a decreased flow rate for each nozzle, reducing the tendency to increase heat flow density.
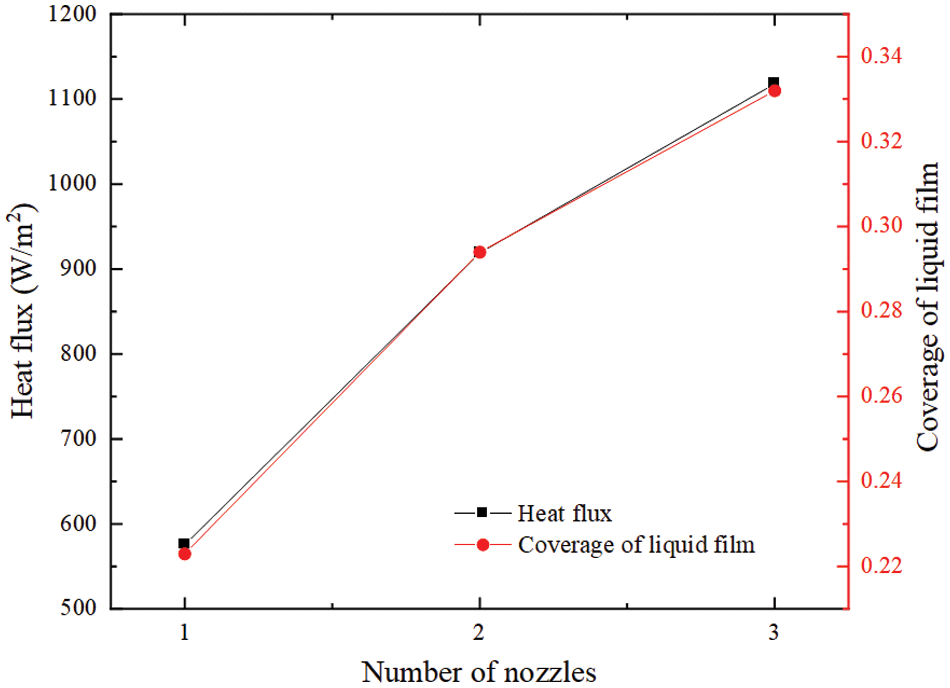
Figure 9: Heat flow density and coverage of liquid film with varying numbers of nozzles
This study simplifies the heat transfer process in a cooling tower by focusing on a horizontal circular tube. The heat transfer characteristics of the tube surface and the liquid coating on the air side are analyzed. The study investigates the impact of spray flow rate, droplet size, and number of nozzles on spray efficiency.
(1) Increasing the spray flow with a single nozzle at constant wind speed and droplet size will thicken the liquid film, and maximum thickness is reached at the central region of the spray. This increase in spray flow positively impacts heat flow density and expands liquid film coverage in the system. However, continual increases in spray flow will further thicken the liquid film, consequently increasing thermal resistance and reducing heat transfer efficiency.
(2) With a single nozzle and fixed wind speed and spray flow rate, larger droplets generate a thicker liquid film. This leads to increased heat flow density and broader liquid film coverage. Smaller spray droplets tend to evaporate more readily, reducing their effective flux through the pipe wall and resulting in drier zones on the wall with lower heat flow density.
(3) Under constant wind speed, spray flow rate, and droplet size, the increase in the number of nozzles reduces the thickness of the liquid film emitted from each nozzle’s center. This increase in nozzle count enhances the extent of the liquid film, thereby improving system heat transfer. However, when the distance between nozzles is minimal, the spray from adjacent nozzles intersects, creating a boundary region. This boundary region thickens the liquid film and reduces flow velocity, hindering heat transmission. Despite a constant spray flow rate, increasing the number of nozzles disperses the liquid film more widely on the horizontal tube. However, this also reduces the discharge rate from each nozzle, resulting in a thinner liquid layer on the tube that is more susceptible to evaporation and the formation of dry regions.
Acknowledgement: None.
Funding Statement: This work was supported by the National Natural Science Foundation of China (Grant No. 52376069) and Shandong Province Science and Technology Small and Medium sized Enterprise Innovation Ability Enhancement Project (Grant No. 2022TSGC2596).
Author Contributions: The authors confirm contribution to the paper as follows: study conception and design: Kaiyong Hu, Zhaoyi Chen; data collection: Yunqing Hu, Huan Sun, Zhili Sun; analysis and interpretation of results: Kaiyong Hu, Zhaoyi Chen, Jinghong Ning; draft manuscript preparation: Kaiyong Hu, Zhaoyi Chen, Tonghua Zou. All authors reviewed the results and approved the final version of the manuscript.
Availability of Data and Materials: The data used to support the findings of this study are available from the corresponding author upon request.
Conflicts of Interest: The authors declare that they have no conflicts of interest to report regarding the present study.
References
1. Zargar A, Kodkani A, Vickers B, Flynn MR, Secanell M. A hybrid cooling tower model for plume abatement and performance analysis. Appl Therm Eng. 2023;219(3):119593. doi:10.1016/j.applthermaleng.2022.119593. [Google Scholar] [CrossRef]
2. Wan DW, Gao SS, Liu MH, Li SG, Zhao YB. Effect of cooling water salinity on the cooling performance of natural draft wet cooling tower. Int J Heat Mass Tran. 2020;161:120257. doi:10.1016/j.ijheatmasstransfer.2020.120257. [Google Scholar] [CrossRef]
3. Zhao CL, Wang MW, Gao Q, Cheng S, He SY, Zhao JF, et al. Investigation on the cooling performance of mechanical draft dry-wet hybrid cooling tower. Appl Therm Eng. 2023;228(3):120473. doi:10.1016/j.applthermaleng.2023.120473. [Google Scholar] [CrossRef]
4. Singla RK, Singh K, Das R. Tower characteristics correlation and parameter retrieval in wet-cooling tower with expanded wire mesh packing. Appl Therm Eng. 2016;96:240–9. doi:10.1016/j.applthermaleng.2015.11.063. [Google Scholar] [CrossRef]
5. Zhao CL, Wang MW, Gao Q, Cheng S, Liu ZL, Geng Z, et al. Comparison on the cooling performance of mechanical draft dry cooling towers pre-cooled with nozzle spray and wet medium. Int J Refrig. 2023;156:298–314. doi:10.1016/j.ijrefrig.2023.09.027. [Google Scholar] [CrossRef]
6. Zhou YS, Zhang P, Zhao JD, Yang HH, Bai YF. Experimental study on performance of a closed wet cooling tower for air wet-bulb temperature near 0°C. J Therm Sci. 2019;28(5):1015–23. doi:10.1007/s11630-018-1159-8. [Google Scholar] [CrossRef]
7. Cui X, Islam MR, Mohan B, Chua KJ. Theoretical analysis of a liquid desiccant based indirect evaporative cooling system. Energy. 2016;95:303–12. doi:10.1016/j.energy.2015.12.032. [Google Scholar] [CrossRef]
8. Rahmati M, Alavi SR, Tavakoli MR. Experimental investigation on performance enhancement of forced draft wet cooling towers with special emphasis on the role of stage numbers. Energ Convers Manage. 2016;126(13):971–81. doi:10.1016/j.enconman.2016.08.059. [Google Scholar] [CrossRef]
9. Tu AM, Liu SJ, Mo X, Chen ER, Zhan XF, Zhu DS. Experimental study of a novel non-packing closed evaporative cooling tower with vertical 3D deformation tubes. Energies. 2022;15(24):9336. doi:10.3390/en15249336. [Google Scholar] [CrossRef]
10. Zhu DS, Zheng WY, Zhou GY, Wu JF, Shi YY. Computational analysis of closed wet cooling towers. Numer Heat Transf, Part A-Appl. 2013;63(5):396–409. doi:10.1080/10407782.2013.733270. [Google Scholar] [CrossRef]
11. Jiang JJ, Liu XH, Jiang Y. Experimental and numerical analysis of a cross-flow closed wet cooling tower. Appl Therm Eng. 2013;61(2):678–89. doi:10.1016/j.applthermaleng.2013.08.043. [Google Scholar] [CrossRef]
12. Hassab MA, Mansour MK, Sadek LA, Qassem MA. Thermal and experimental analysis of cross-flow closed cooling tower. Alex Eng J. 2023;69:739–46. doi:10.1016/j.aej.2023.02.012. [Google Scholar] [CrossRef]
13. Xie XC, He C, Xu T, Zhang BJ, Pan M, Chen QL. Deciphering the thermal and hydraulic performances of closed wet cooling towers with plain, oval and longitudinal fin tubes. Appl Therm Eng. 2017;120(32):203–18. doi:10.1016/j.applthermaleng.2017.03.138. [Google Scholar] [CrossRef]
14. Zheng WY, Zhu DS, Song J, Zeng LD, Zhou HJ. Experimental and computational analysis of thermal performance of the oval tube closed wet cooling tower. Appl Therm Eng. 2012;35(4):233–9. doi:10.1016/j.applthermaleng.2011.10.047. [Google Scholar] [CrossRef]
15. Xu Z, Tang JL, Wu QQ, Fang M. Research on heat transfer and frost resistance performance of the closed wet cooling towers tubes. Int J Therm Sci. 2023;189(2):108257. doi:10.1016/j.ijthermalsci.2023.108257. [Google Scholar] [CrossRef]
16. Poppe M, Rögener H. Evaporative cooling systems. In: VDI-Warmeatlas; 1984. [Google Scholar]
17. Merkel F. Evaporative cooling. In: VDI-Zeitchrift; 1925. vol. 70: p. 123–8 (In German). [Google Scholar]
18. Heyns JA, Kröger DG. Experimental investigation into the thermal-flow performance characteristics of an evaporative cooler. Appl Therm Eng. 2010;30(5):492–8. doi:10.1016/j.applthermaleng.2009.10.010. [Google Scholar] [CrossRef]
19. Xia ZZ, Chen CJ, Wang RZ. Numerical simulation of a closed wet cooling tower with novel design. Int J Heat Mass Tran. 2011;54(11–12):2367–74. doi:10.1016/j.ijheatmasstransfer.2011.02.025. [Google Scholar] [CrossRef]
20. Facao J, Oliveira AC. Heat and mass transfer in an indirect contact cooling tower: cfd simulation and experiment. Numer Heat Transf Part A-Appl. 2008;54(10):933–44. doi:10.1080/10407780802359104. [Google Scholar] [CrossRef]
21. Ma HQ, Liu YM, Xie Y, Liu Y, Ding RX, Hou CQ, et al. Numerical investigation on heat-mass transfer and correlations of humid air-water outside staggered tube bundles. Int J Therm Sci. 2022;179(3):107632. doi:10.1016/j.ijthermalsci.2022.107632. [Google Scholar] [CrossRef]
22. Jiang HT, Wang XS, Liu YW. Numerical study of different Pr number medium turbulent cross flow in staggered tube bundle. Int J Therm Sci. 2023;187:108206. doi:10.1016/j.ijthermalsci.2023.108206. [Google Scholar] [CrossRef]
23. Deeb R. Flow and heat transfer characteristics of staggered mixed circular and drop-shaped tube bundle. Phys Fluids. 2022;34(6):911. doi:10.1063/5.0090732. [Google Scholar] [CrossRef]
24. Xie XC, Liu H, He C, Zhang BJ, Chen QL, Pan M. Deciphering the heat and mass transfer behaviors of staggered tube bundles in a closed wet cooling tower using a 3-D VOF model. Appl Therm Eng. 2019;161:114202. doi:10.1016/j.applthermaleng.2019.114202. [Google Scholar] [CrossRef]
25. Lee YT, Wen CY, Chien LH, He JC, Yang AS. Heat transfer of spray falling films over horizontal tubes with counter current airflows in an evaporative condenser. Int J Heat Mass Tran. 2022;183(10):122199. doi:10.1016/j.ijheatmasstransfer.2021.122199. [Google Scholar] [CrossRef]
26. Khan MS, Zou RP, Yu AB. Computational simulation of air-side heat transfer and pressure drop performance in staggered mannered twisted oval tube bundle operating in crossflow. Int J Therm Sci. 2021;161:106748. doi:10.1016/j.ijthermalsci.2020.106748. [Google Scholar] [CrossRef]
27. Connor R, Coates D. The state of water resources. In: Azoulay A, editor. UN world water development report 2021. Paris: United Nations Educational, Scientific and Cultural Organization; 2021. p. 11–6. [Google Scholar]
28. Kumar B, Kumar R, Gupta A. Rewetting and transient heat transfer on the heated horizontal tube surface during the air-atomized spray cooling. Heat Transf Res. 2023;54(6):21–38. doi:10.1615/HeatTransRes.2022044032. [Google Scholar] [CrossRef]
29. Smakulski P, Pietrowicz S. A review of the capabilities of high heat flux removal by porous materials, microchannels and spray cooling techniques. Appl Therm Eng. 2016;104(2–3):636–46. doi:10.1016/j.applthermaleng.2016.05.096. [Google Scholar] [CrossRef]
30. Miao JY, He SY, Lu YW, Wu YT, Wu XH, Zhang GH, et al. Comparison on cooling performance of pre-cooled natural draft dry cooling towers using nozzles spray and wet medium. Case Stud Therm Eng. 2021;27(2):101274. doi:10.1016/j.csite.2021.101274. [Google Scholar] [CrossRef]
31. He SY, Li Y, Wang MW, Wang AP, Alkhedhair AM, Guan HJ, et al. Investigation on the control mechanism of spray pre-cooling the inlet air of natural draft dry cooling tower. Appl Therm Eng. 2022;217(4):119186. doi:10.1016/j.applthermaleng.2022.119186. [Google Scholar] [CrossRef]
32. Park H, Roh J, Oh KC, Cho H, Kim J. Modeling and optimization of water mist system for effective air-cooled heat exchangers. Int J Heat Mass Tran. 2022;184:122297. doi:10.1016/j.ijheatmasstransfer.2021.122297. [Google Scholar] [CrossRef]
33. Liu H, Cai C, Yan YA, Jia M, Yin BZ. Numerical simulation and experimental investigation on spray cooling in the non-boiling region. Heat Mass Transfer. 2018;54(12):3747–60. doi:10.1007/s00231-018-2402-7. [Google Scholar] [CrossRef]
34. Hou Y, Tao YJ, Huai XL, Zou Y, Sun DL. Numerical simulation of multi-nozzle spray cooling heat transfer. Int J Therm Sci. 2018;125(746):81–8. doi:10.1016/j.ijthermalsci.2017.11.011. [Google Scholar] [CrossRef]
35. Gao X, Kong LJ, Li R, Han JT. Heat transfer of single drop impact on a film flow cooling a hot surface. Int J Heat Mass Tran. 2017;108:1068–77. doi:10.1016/j.ijheatmasstransfer.2016.12.106. [Google Scholar] [CrossRef]
36. Huang YQ, Wang MH, Xu L, Deng J. Experimental study on a spray and falling-film cooling system. Case Stud Therm Eng. 2021;26(7):101057. doi:10.1016/j.csite.2021.101057. [Google Scholar] [CrossRef]
37. Zeraatkardevin A, Jowkar S, Morad MR, Shen X. A three dimensional simulation of spray cooling and its evaporating liquid film generated on patterned surfaces. Int J Multiphas Flow. 2022;155:104174. doi:10.1016/j.ijmultiphaseflow.2022.104174. [Google Scholar] [CrossRef]
38. Fluent A. Ansys fluent theory guide. USA: Ansys Inc.; 2013. vol. 15317. p. 724–46. [Google Scholar]
39. Wan H, He GQ, Xue ZR, Li WQ. Numerical study and experimental verification on spray cooling with nanoencapsulated phase-change material slurry (NPCMS). Int Commun Heat Mass. 2021;123:105187. doi:10.1016/j.icheatmasstransfer.2021.105187. [Google Scholar] [CrossRef]
40. Llano-Restrepo M, Monsalve-Reyes R. Modeling and simulation of counterflow wet-cooling towers and the accurate calculation and correlation of mass transfer coefficients for thermal performance prediction. Int J Refrig. 2017;74(4):47–72. doi:10.1016/j.ijrefrig.2016.10.018. [Google Scholar] [CrossRef]
41. Kloppers JC, Kröger DG. A critical investigation into the heat and mass transfer analysis of counterflow wet-cooling towers. Int J Heat Mass Tran. 2005;48(3–4):765–77. doi:10.1016/j.ijheatmasstransfer.2004.09.004. [Google Scholar] [CrossRef]
42. Zalewski W, Gryglaszewski PA. Mathematical model of heat and mass transfer processes in evaporative fluid coolers. Chem Eng Process. 1997;36(4):271–80. doi:10.1016/S0255-2701(97)00006-8. [Google Scholar] [CrossRef]
43. Lee YT, Chien LH, He JC, Wen CY, Yang AS. Air side performance characterization of wavy Fin-and-tube heat exchangers having elliptic tubes with large waffle heights. Appl Therm Eng. 2022;217:119220. doi:10.1016/j.applthermaleng.2022.119220. [Google Scholar] [CrossRef]
44. Ding HB, Xie P, Ingham D, Ma L, Pourkashanian M. Flow behaviour of drop and jet modes of a laminar falling film on horizontal tubes. Int J Heat Mass Tran. 2018;124(2):929–42. doi:10.1016/j.ijheatmasstransfer.2018.03.111. [Google Scholar] [CrossRef]
45. Zhao K, Wang Y, Ding Y, Jiang YL. Numerical and theoretical study on the spreading characteristics of droplet impact on a horizontal flowing liquid film. Colloid Surface A. 2021;616:126338. [Google Scholar]
46. Park H, Yoo Y, Choi Y, Roh J, Lee J, Kim J. Computational fluid dynamic modelling of optimal water level in low-pressure microbubbles scrubbers. Chem Eng Trans. 2021;86:613–8. [Google Scholar]
47. Zeng ZY, Li YF, Shang TL, Zhan H. Effects of the atomisation spray on heating transfer in evaporative condensers: a numerical study. Therm Sci Eng Prog. 2023;42:101923. [Google Scholar]
Cite This Article
 Copyright © 2024 The Author(s). Published by Tech Science Press.
This work is licensed under a Creative Commons Attribution 4.0 International License , which permits unrestricted use, distribution, and reproduction in any medium, provided the original work is properly cited.
 Downloads
 Citation Tools