
 Submit a Paper
 Propose a Special lssue
 Open Access
ARTICLE

Research on Leading Edge Erosion and Aerodynamic Characteristics of Wind Turbine Blade Airfoil
School of New Energy, Shenyang Institute of Engineering, Shenyang, 110136, China
* Corresponding Author: Xin Guan. Email:
Fluid Dynamics & Materials Processing 2024, 20(9), 2045-2058. https://doi.org/10.32604/fdmp.2024.049671
Received 14 January 2024; Accepted 28 May 2024; Issue published 23 August 2024
 View Full Text
 Download PDF
Abstract
The effects of the erosion present on the leading edge of a wind turbine airfoil (DU 96-W-180) on its aerodynamic performances have been investigated numerically in the framework of a SST k–ω turbulence model based on the Reynolds Averaged Navier-Stokes equations (RANS). The results indicate that when sand-induced holes and small pits are involved as leading edge wear features, they have a minimal influence on the lift and drag coefficients of the airfoil. However, if delamination occurs in the same airfoil region, it significantly impacts the lift and resistance characteristics of the airfoil. Specifically, as the angle of attack grows, there is a significant decrease in the lift coefficient accompanied by a sharp increase in the drag coefficient. As wear intensifies, these effects gradually increase. Moreover, the leading edge wear can exacerbate flow separation near the trailing edge suction surface of the airfoil and cause forward displacement of the separation point.Keywords
Wind turbines often operate in harsh natural environments, so the surfaces of their blades are inevitably eroded by particles such as dust, acid rain, hail and arthropod erosion, especially on the leading edge [1]. Over time, the corrosion on the leading edge of the airfoil becomes increasingly serious and the surface roughness increases gradually. Studies have shown that increasing the roughness of the leading edge greatly decreases the aerodynamic characteristics of blade [2] by decreasing the lift coefficient and increasing the drag coefficient [3]. This decrease in the aerodynamic performance has been shown to decrease the output power of a wind turbine by up to 25% [4]. Castorrini et al. [5] used standardized Euclidean distances to fuse the multi-feature parameters of an image grey-level covariance matrix (i.e., grey-level covariance matrix or GLCM) and constructed a degradation metric for evaluating and screening defects in wind turbine blades. Sareen et al. [6] showed that leading edge erosion reduces lift and increases drag, thus greatly affecting the aerodynamic performance of the airfoil. Gaudern et al. [7] also conducted wind tunnel tests and simulated various erosion depths in order to study the effect on the aerodynamic performance of the airfoils. Gharali et al. [8] performed numerical simulations to study the leading-edge erosion of airfoil S809, and they found that erosion width had a greater effect on the lift coefficient than erosion depth. Zhang et al. [9] performed numerical simulations and studied how the surface roughness of two-dimensional airfoils and three dimensional blades affects the aerodynamic performance of a wind turbine. Their results show that the aerodynamic performance of the airfoil is greatly affected by the surface roughness, especially at the leading edge. Ren et al. [10] performed numerical simulations using the two-dimensional Navier–Stokes (N–S) equation and shear stress transport (SST) k–ω turbulence model and studied the aerodynamic characteristics of the NACA63-430 airfoil. Their results showed that increasing the roughness intensified the transition and flow separation of the turbulence layer in the flow direction. A dynamic model of rain and a dynamic model of hail were constructed and numerically simulated in order to study the effect of hail on the leading edge by Keegan et al. [11]. Zhang et al. [12] experimentally investigated the factors affecting raindrop erosion and found that the relative velocity and frequency of raindrops impacting the blade surface had the greatest effect on the erosion rate. Jiang [13] used computational fluid dynamics (CFD) to analyze the effects of light ice and frost ice on the aerodynamic performance of airfoils. Their results showed that, over a range of angles of attack, frost ice has little effect on the lift coefficient, but slightly reduces the lift-to-drag ratio. Li et al. [14] found that surface pollution reduces the aerodynamic characteristics of the blade, reducing the lift coefficient by up to 35%. Overall, most studies on the effect of leading edge roughness on the aerodynamic performance of wind turbines consider the roughness caused by blade surface icing, dust, and insect accumulation (i.e., material is added). However, little research has been done on the effects of wing leading edge erosion (i.e., material is removed) [15,16]. At present, most tests of wind turbine blades have focused on studying their mechanical properties, and research on the effects of erosion is still in the early stages [17,18]. Some studies have used the loss of blade mass with different erosion times as an image marker and applied neural networks to predict the effects of erosion [19–22].
The fatigue life of wind turbine blades directly determines the service life and energy conversion efficiency of the entire system [23,24]. Under normal operating conditions, wind turbine blades are subjected to complex loads of varying amplitudes due to the nonlinear superposition of centrifugal, aerodynamic, and inertial forces [25,26]. In this study, a numerical analysis of a DU 96-W-180 airfoil was carried out to investigate the effect of different stages of leading edge erosion on the aerodynamic performance, including lift and drag characteristics, flow characteristics, and the flow field around the airfoil [27–29].
2.1 Study Object and Geometric Model of Leading Edge Erosion
The study object was a DU 96-W-180 airfoil designed by the University of Delft in the Netherlands. This airfoil is often used to represent the sharp end of a wind turbine blade, and it has a relative thickness of 18% [30]. For comparison with the literature, the airfoil chord length was set to 0.457 m to match the model used in the wind tunnel tests.The geometry of the DU 96-W-180 wing was shown in Fig. 1.
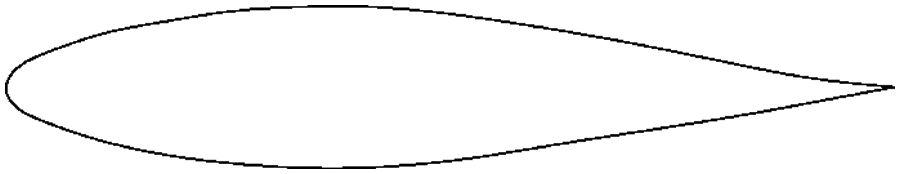
Figure 1: DU 96-W-180 airfoil geometry
Fig. 2 shows pictures of blades eroded after more than 1, 2, and 10 years of service in a wind farm in Northern China (provided by the company 3 M). After 1 year, holes appeared on the leading edge due to sand particles. After 2 years, the holes had developed into larger and deeper pits. As the number of holes and pits increased, material fell off the leading edge over large areas, which is called delamination. Delamination first appeared at the leading edge and gradually expanded along the string line over time. The first and most serious erosion occurred at the leading edge, after which parts near the leading edge wore down. After 10 years, the eroded area had expanded to the trailing edge of the blade.
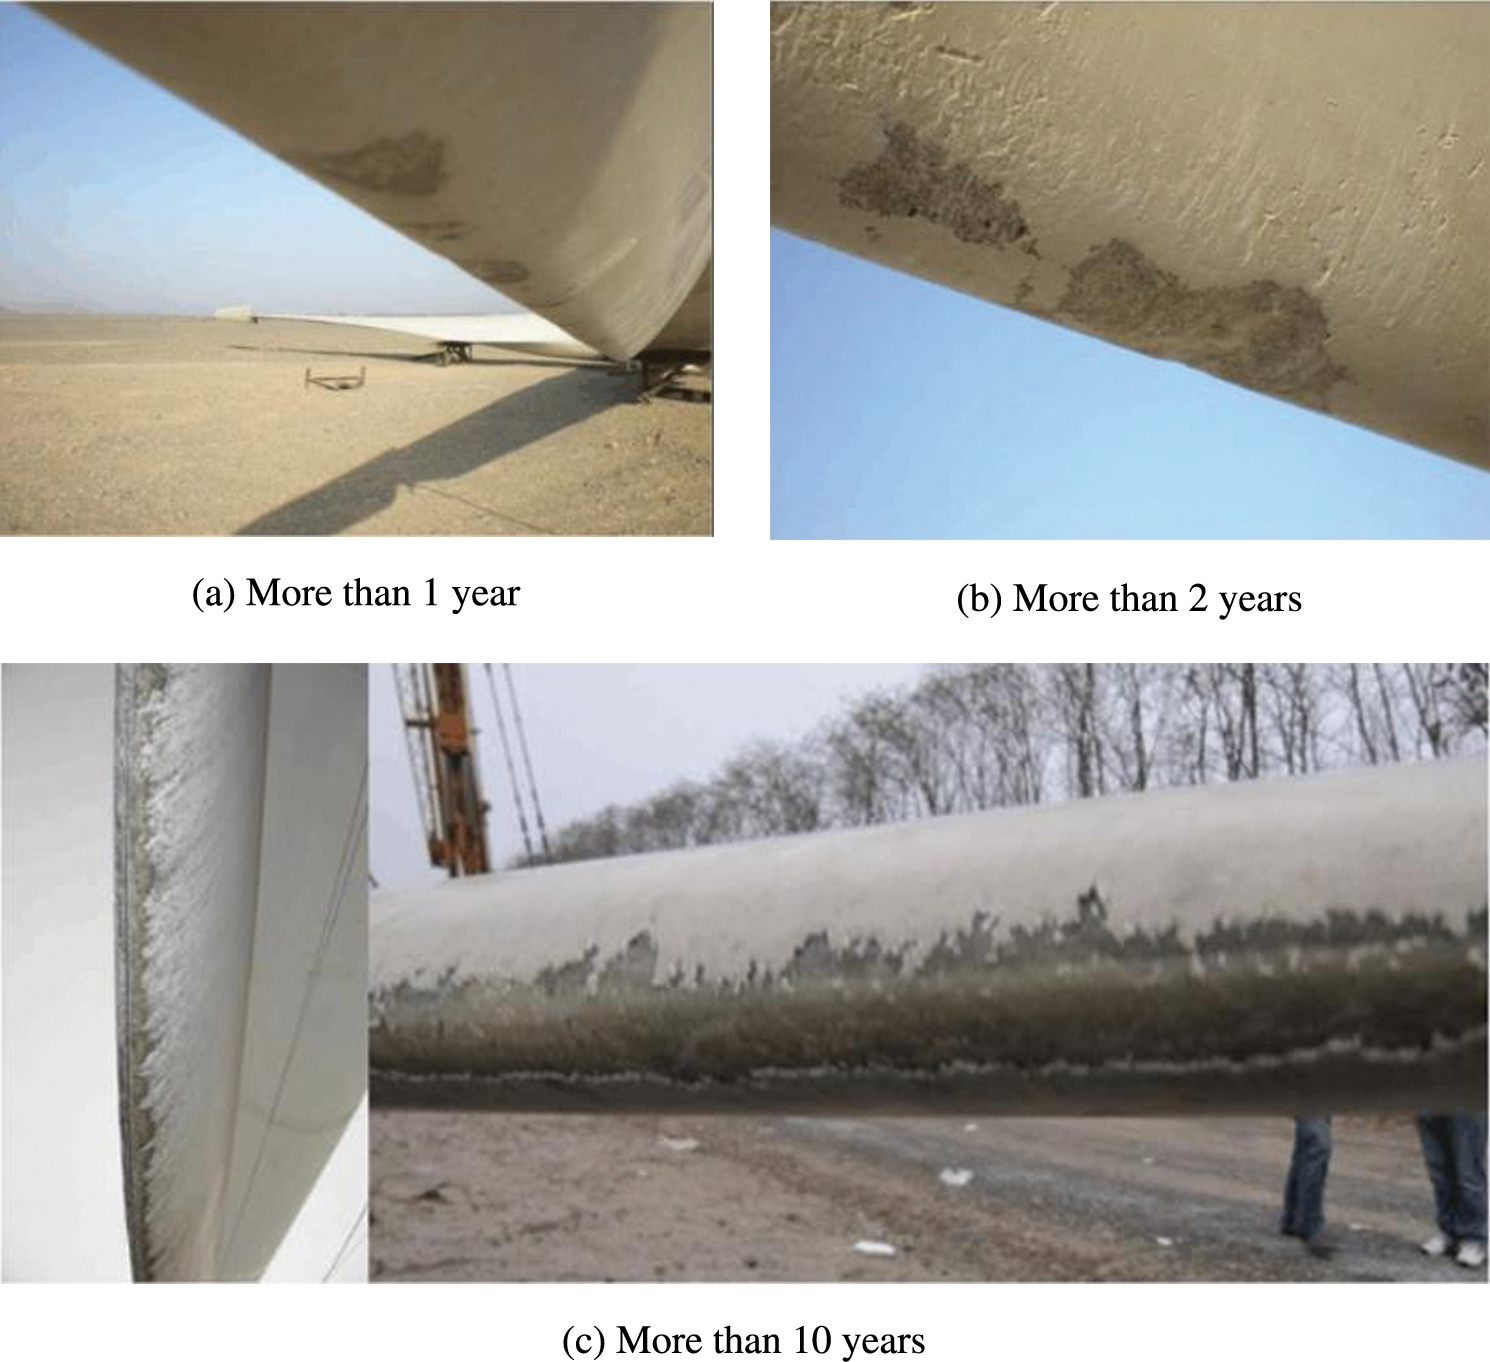
Figure 2: Erosion of blades according to service life
According to Shin’s equivalent particle roughness height model [31], the icing process of a wind turbine blade depends on convective heat transfer, which in turn is affected by surface roughness. If the model is applied to the entire airfoil, the empirical formula can be revised as follows:
where (ks/c)base = 0.001177, ks is the surface roughness height, MVD is the median diameter of a water drop, LWC is the liquid water content, Ts is the ambient temperature, and c is the airfoil chord length.
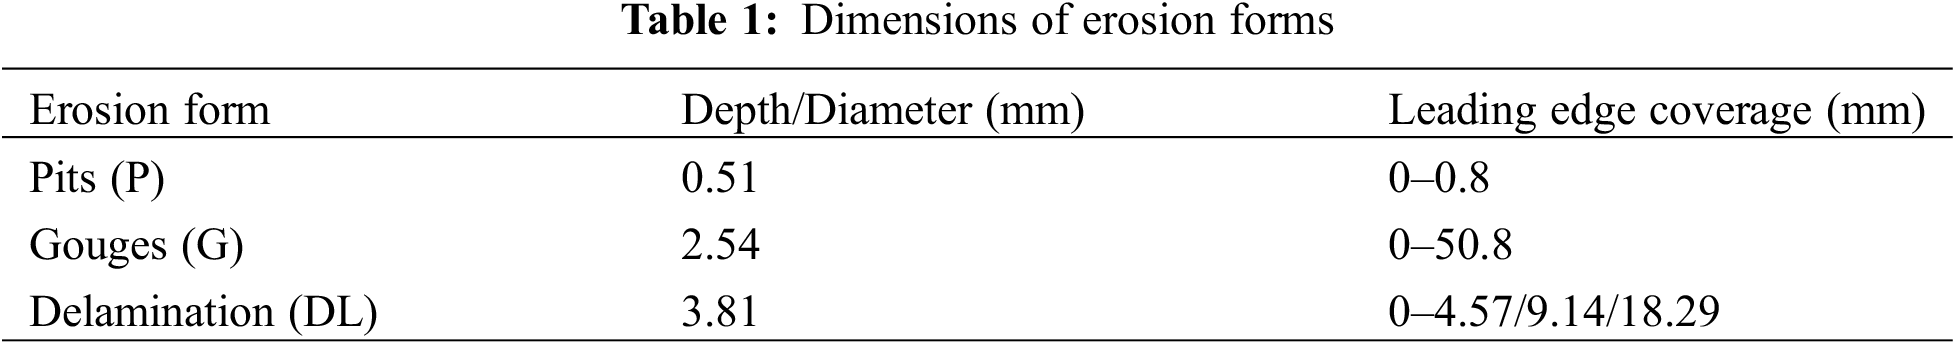
Based on the pictures of wind turbine blades at different erosion stages shown in Fig. 1, the erosion morphology of the leading edge was defined as having three forms: pit, gouges, and delamination. The dimensions of the pits, gouges, and delamination and their coverage on the leading edge of the airfoil were shown in Table 1. Pits, gouges, and delamination were defined as having depths of 0.51, 2.54, and 3.81 mm, respectively, with pits and grooves having the same average diameter and depth. The coverage area was defined as the chordal distribution range of erosion characteristics starting from the leading edge. Erosion was classified into three types: (A) only pits; (B) pits and gouges; and (C) pits, gouges, and delamination. Each erosion type was subdivided into three distinct erosion phases, each with twice as many pits, gouges, and delamination cover as the previous phase. The number of holes and pits on the pressure surface should be twice as large as on the suction surface because the degree of erosion and the extent of erosion at the leading edge is greater than on the suction surface. Table 2 presents the details of the erosion types and stages.
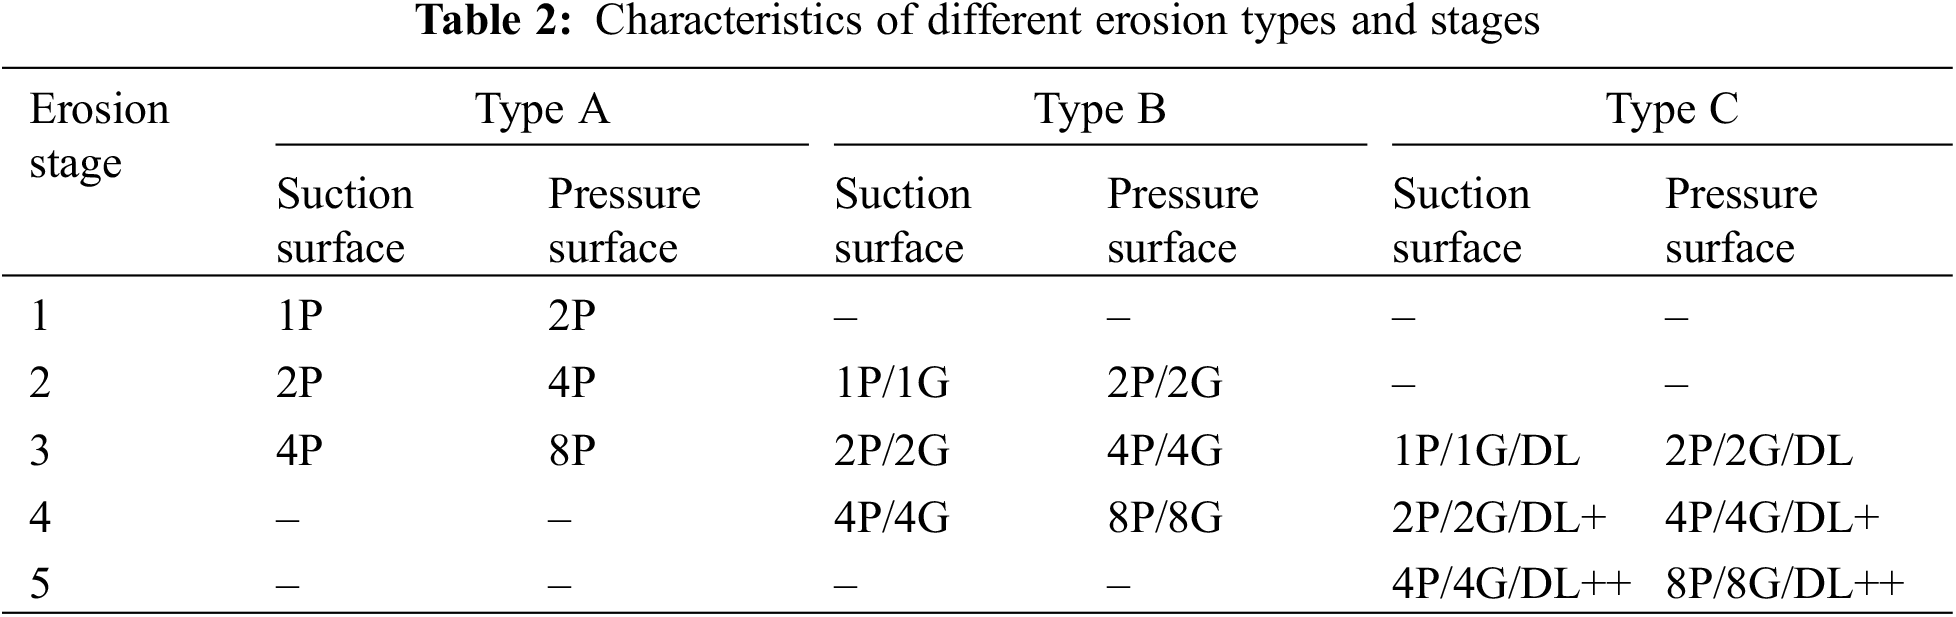
The airfoil pressure surfaces, the total number of pits and grooves on the suction surfaces, and the area covered by delamination at each erosion stage are shown in Table 2. The degree of erosion is gradually increasing, where the number represents the number of pits and gouges. For example, as shown in Fig. 3, the C3 airfoil (i.e., Type C Stage 3) had one pit (1P) and one gouge (1G) on the suction surface of the blade, two pits (2P) and two gouges (2G) on the pressure surface, and slight delamination (DL) on the leading edge. All numerical simulations were performed at a Reynolds number of 1 × 10⁶.
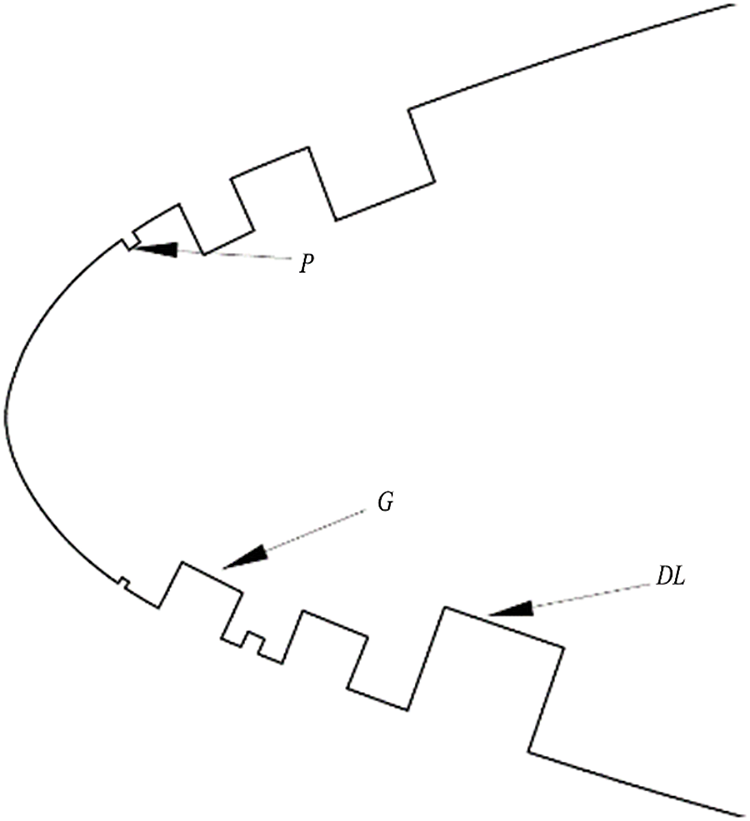
Figure 3: Model of erosion type C stage 3
2.2 Computing Domain and Meshing
Fig. 4 shows the calculation domain. The distance between the semicircular inlet and the trailing edge was 12.5 times the length of the string (c), and the distance between the trailing edge and exit was 15 times the chord length. The computing domain adopted a C-shaped structure grid.
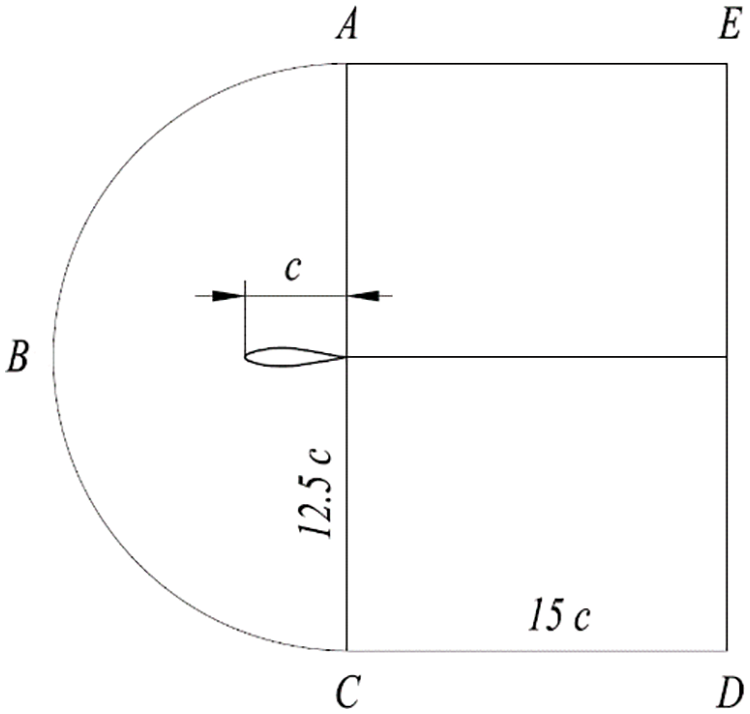
Figure 4: Computing domain
In CFD-based numerical simulations, the distribution of mesh nodes affects the accuracy of the fluid flow around the airfoil, and the gradient of the fluid velocity and pressure changes in the vicinity of the airfoil is much larger than that in the far field. Therefore, the mesh on and around the airfoil surface was appropriately encrypted with 913 nodes distributed in the circumferential direction of the airfoil. The height of the first layer of the boundary layer was 0.02 mm. Increasing the mesh density greatly affected the calculated grid displacement error of the lift coefficient Cl and drag coefficient Cd of the airfoil. The results of the grid sensitivity analysis were presented in Table 3.
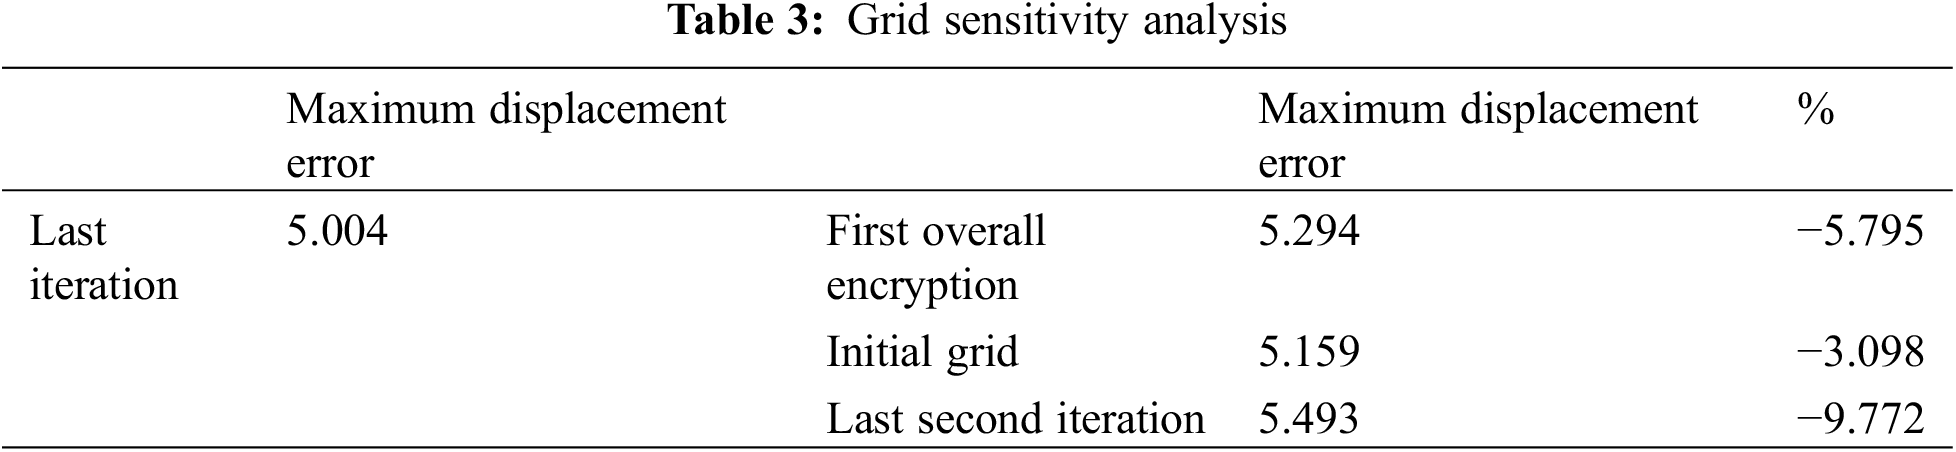
The time required for grid generation was much shorter than the simulation time, and the computational overhead for grid encryption was almost negligible. However, the large change in the grid displacement error highlighted the impact of grid encryption on the calculation accuracy.
Erosion damages the aerodynamic shape of an airfoil and increases its surface roughness. The change in shape of the airfoil affects the nearby airflow. The application of the SST k-ω turbulence model can more accurately capture the airflow state around the eroded region. Two-dimensional incompressible Reynolds-averaged Navier–Stokes (RANS) equations were incorporated into the model to solve for turbulence and to investigate the effect of leading edge erosion on the aerodynamic performance of the airfoil. The viscous underflow near the wall was accurately captured by applying the SST k-ω turbulence model. The sensitivity of the SST k-ω turbulence model to the incoming flow can be overcome by using the SST k-ω turbulence model in the main flow region.
The unsteady and incompressible RANS equations including the turbulent pulsation kinetic energy and dissipation rate equations are solved numerically. The mass and momentum equations as well as the turbulence model are derived from the exact equations, but the dissipation rate equation is derived from physical reasoning and mathematical simulations of similar prototype equations.
The balance equations for mass and momentum of turbulence model are as follows:
where CV indicates the control volume; CS indicates the total area of the surface delimiting the control volume; t is time;
The model assumes that the flow is completely turbulent and the effect of molecular viscosity is negligible. Therefore, the equations of turbulent pulsation kinetic energy k and dissipation rate
where
Turbulent pulsation kinetic energy is defined as
The kinetic energy dissipation rate of turbulent pulsation, that is, the rate at which the mechanical energy of the isotropic small-scale vortices is converted into thermal energy, is defined as
where
Turbulent viscosity is a function of spatial coordinates, dependent on the flow state rather than physical parameters, and is calculated by
where
The inlet boundary condition was set by the velocity at the semicircular boundary ABC, as shown in Fig. 4. The inlet air speed was determined from the effective wind speed and the running speed of the wind turbine during the icing process. When the angle of attack was greater than zero, CD was the entrance boundary; when the angle of attack was less than zero, AE was the entrance boundary; and when the angle of attack was zero, the entrance boundary was at CD and AE. The inlet boundary was set to a velocity of 23.084 m/s, with a Reynolds number of 1 × 10⁶. The turbulence intensity was 0.05, and the turbulence viscosity ratio was 10. The outlet boundary condition was set by the pressure at DE, as shown in Fig. 4. The gouge pressure was zero. When the incoming flow had a positive angle of attack, the outlet boundary was at AE; when the incoming flow had a negative angle of attack, the outlet boundary was at CD. A solid wall with no slip was adopted for the wall boundary conditions.
3 Calculation Method and Reliability Verification
The CFD-based numerical simulation of the DU 96-W-180 airfoil employed a second-order upwind scheme and used the SIMPLEC algorithm to couple pressure and velocity. The experimental values and numerical simulation results of the variation of lift coefficient with angle of attack for the smooth DU 96-W-180 airfoil were shown in Fig. 5. The experimental values were taken from Sareen et al. [6], who performed tests in a low-turbulence subsonic wind tunnel at the University of Illinois at Urbana-Champaign. This wind tunnel had a rectangular test section with dimensions of 0.853 m × 1.219 m and a length of 2.438 m, and it was capable of achieving wind speeds of up to 71.53 m/s corresponding to Reynolds numbers (Re) of 1 × 10⁶ and 1.5 × 10⁶. The lift and drag coefficients of the wing were calculated by measuring the normal and axial forces on the airfoil (see literature [6] for the calculation method). The lift and drag coefficients from the numerical simulations were in general agreement with the experimental data. The maximum error of the lift coefficient was 7% for attack angles of −5.3° to −10.3°. Therefore, the numerical model was concluded as reliable.
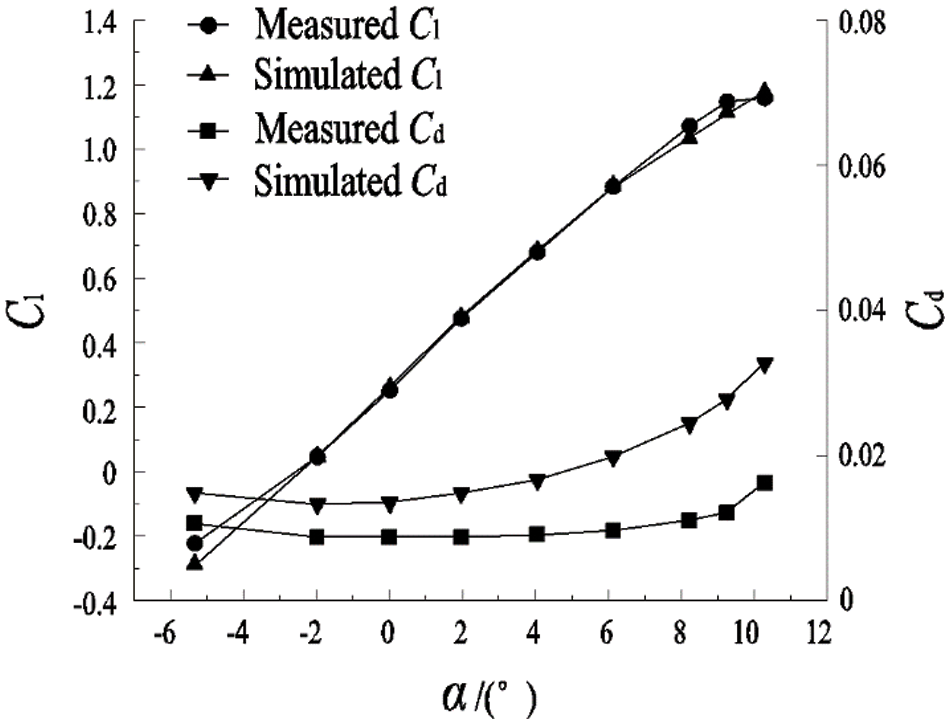
Figure 5: Comparison between experimental and numerical simulation results for the lift and drag characteristics of a smooth airfoil according to the angle of attack
Note: Cl is the lift coefficient, Cd is the drag coefficient, α is the angle of attack.
4.1 Lift and Drag Characteristics
Fig. 6 compares the variation of lift, drag coefficient and lift-to-drag ratio for airfoils with different degrees of erosion according to the variation of angle of attack. The blade wear was measured according to GB/T 25384–2018 [32]. For the Type A airfoils (Fig. 6a), the lift force, drag coefficient, and lift–drag ratio did not change with increasing number of pits, and the drag coefficient was slightly higher than that of the smooth airfoil. At angles of attack of −5.3° to 0°, the lift coefficient and lift–drag ratio were almost the same as those of the smooth airfoil. The lift and drag coefficients of the smooth airfoil decreased as the angle of attack increased above 0°. At an angle of attack of 10.3°, the lift coefficient of the Type A airfoils was about 2.7% less than that of the smooth airfoil.
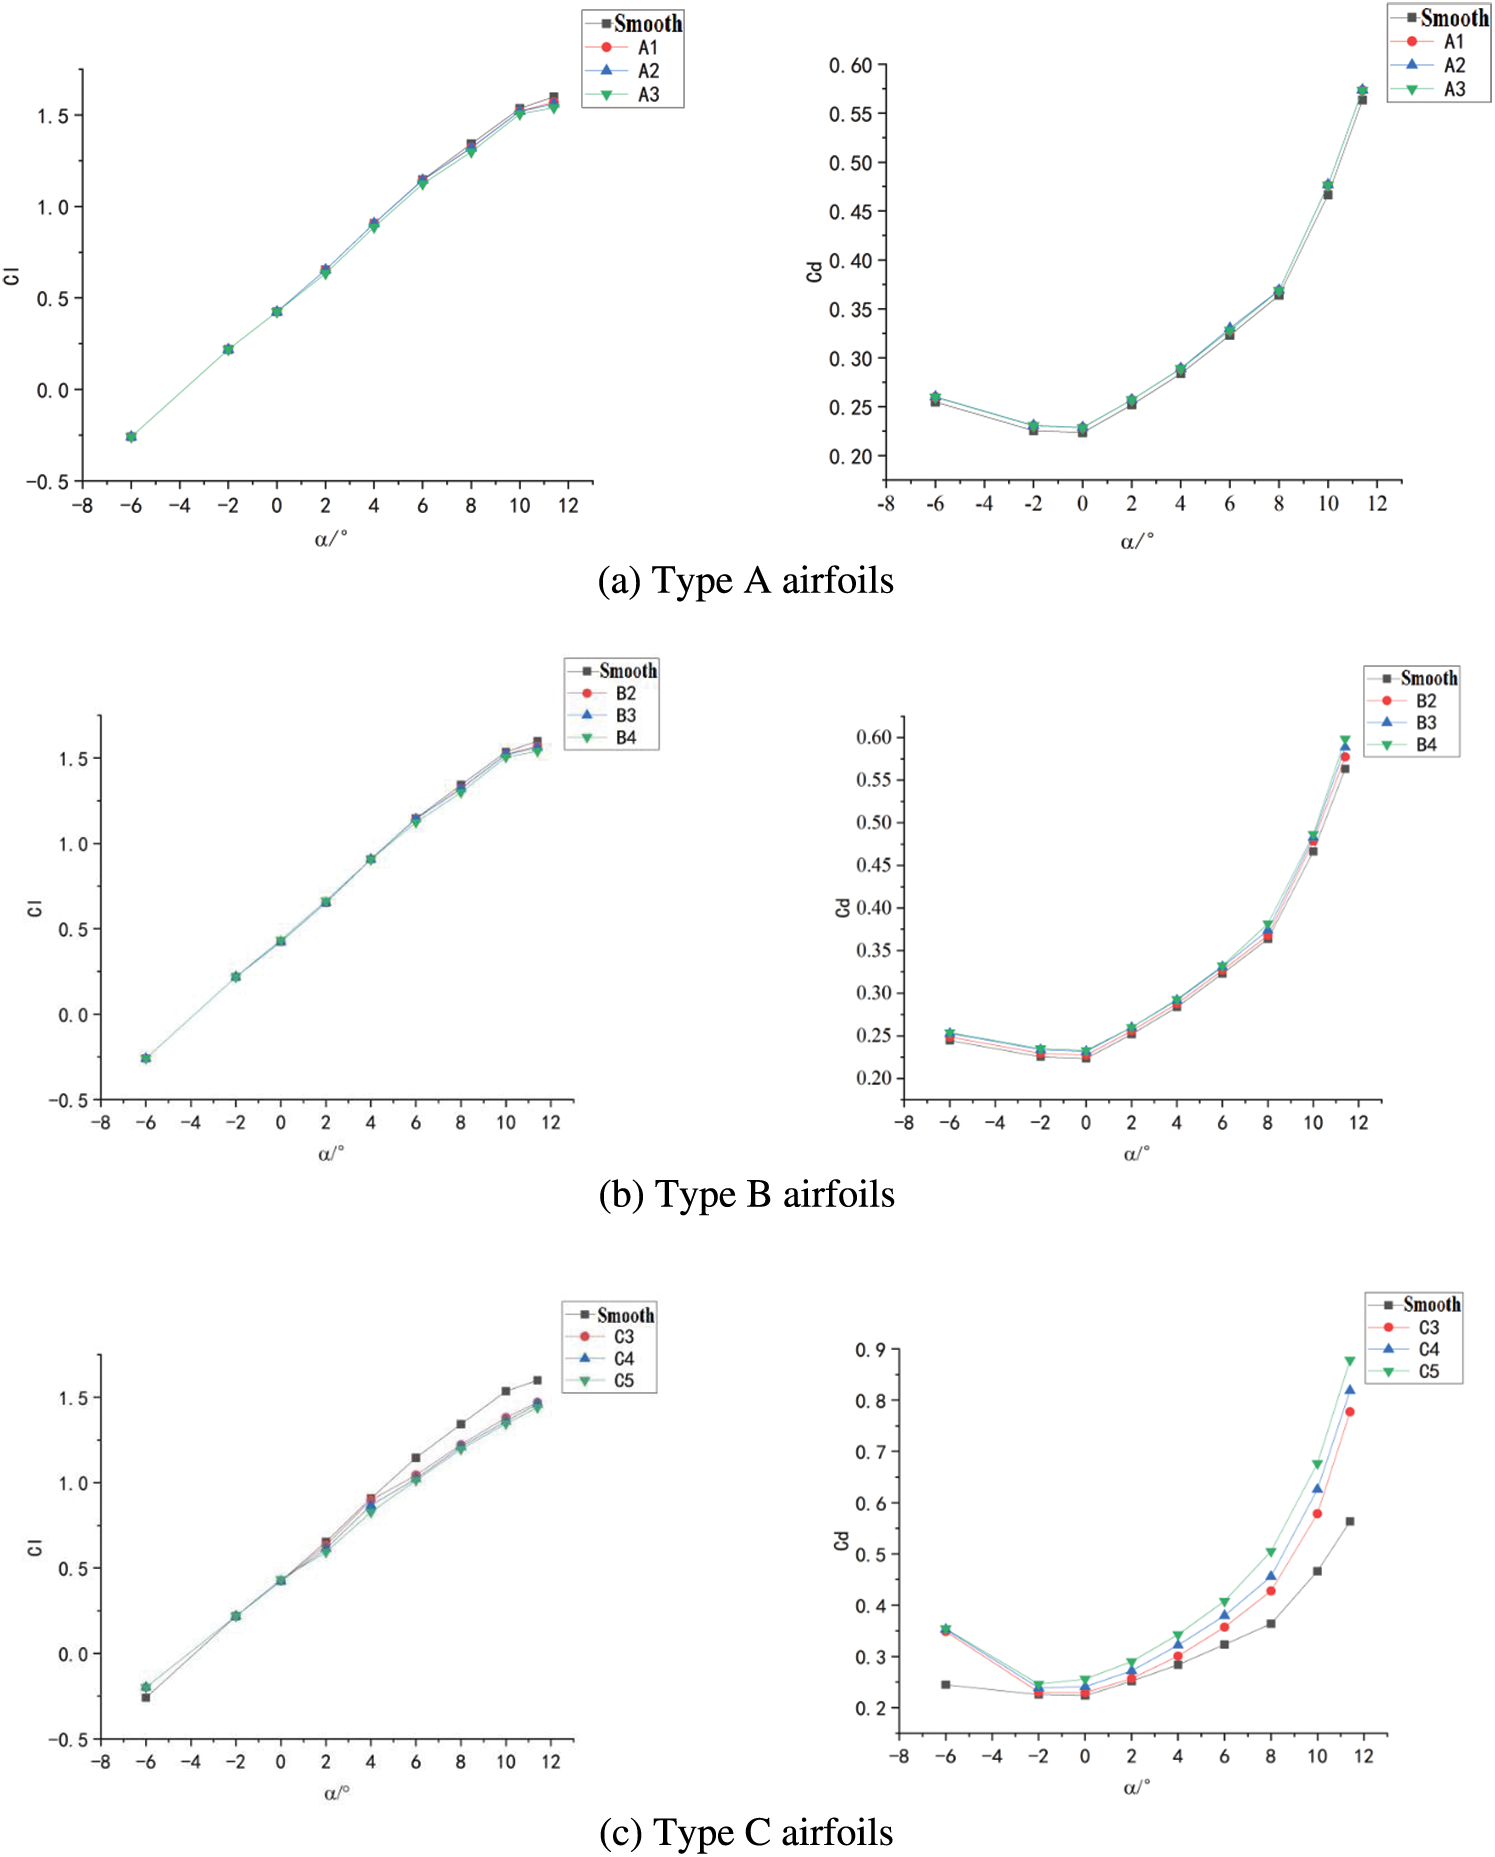
Figure 6: Lift and drag characteristics of Types A, B, and C airfoils
For the Type B airfoils (Fig. 6b), the variations in the lift and drag coefficients showed similar trends as the Type A airfoils, but the changes increased at larger angles of attack. The lift coefficient decreased and the drag coefficient increased from the B1 airfoil to the B2 airfoil. At an angle of attack of 10.3°, the lift coefficients of the Type B airfoils were approximately 5.8% less than that of the smooth airfoil, and the lift–drag ratio decreased by approximately 10%.
As the angle of attack approaches 0°, for the C airfoil (Fig. 6c), the lift coefficient did not change much compared to the smooth airfoil. As the angle of attack increased, the drag coefficient increased and the lift coefficient decreased. When the angle of attack was greater than −2°, the decrease in the lift coefficient became more obvious. The C2 airfoil showed a slightly lower lift coefficient and a more obvious increase in the drag coefficient compared with the C1 airfoil. At an angle of attack is 10.3°, the lift coefficients of the Type C airfoils were approximately 14.3% less than that of the smooth airfoil.
In summary, pits and small gouges had less of an effect on the aerodynamic performance of the airfoils. However, delamination of the leading edge greatly decreased the lift coefficient, increased the drag coefficient, and degraded the aerodynamic performance of the airfoil.
Fig. 7 compares the flow diagrams of smooth and eroded airfoils at an angle of attack of 9.3°. Erosion of the leading edge exacerbated airflow separation near the trailing edge of the suction surface, thus moved the point of airflow separation forward. This increased the vortex region that formed after separation, which decreased the lift and increased the drag of the airfoil.
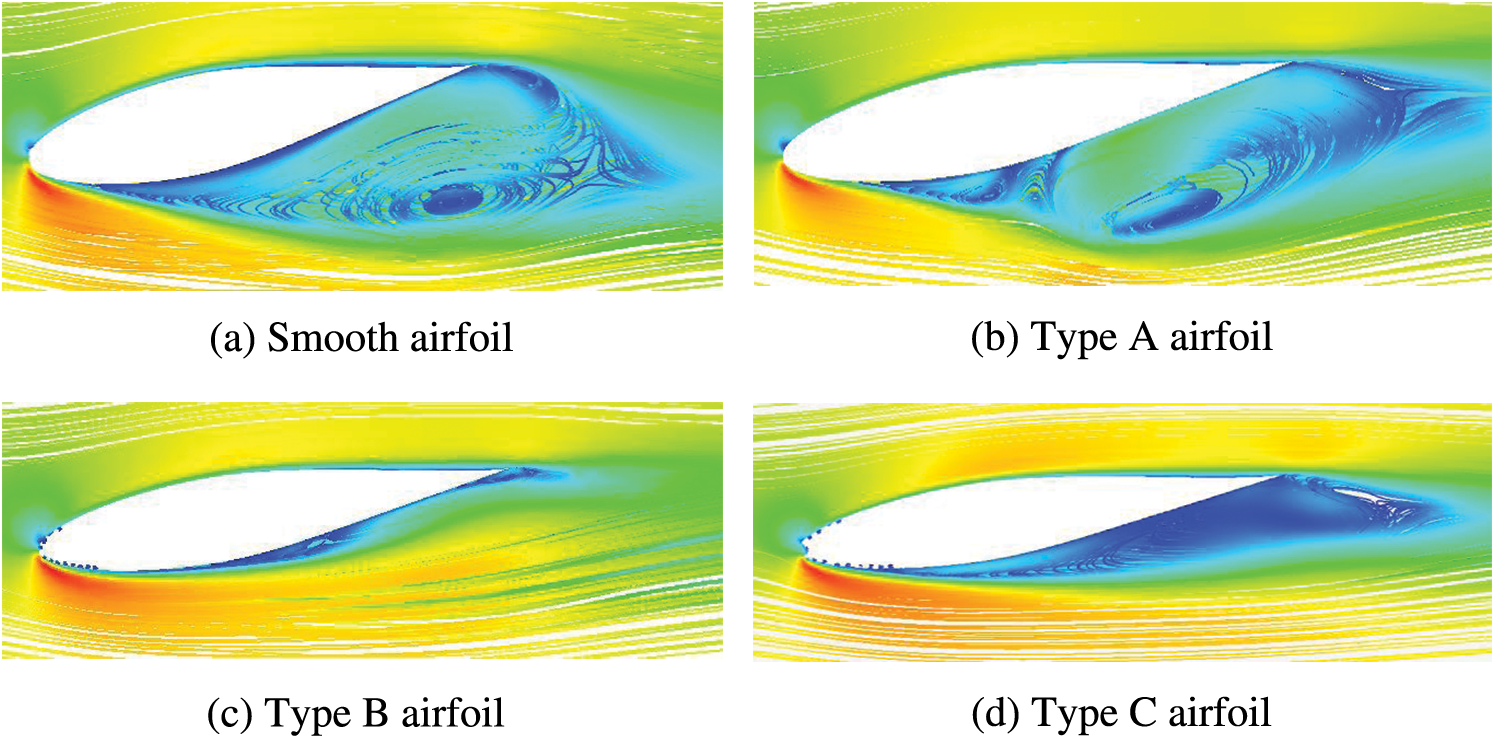
Figure 7: Flow diagrams of smooth and eroded airfoils for angle of attack of 9.3°
When particles hit the leading edge of the wing, some of the surface material was abraded which changed the geometry of the airfoil and affecting the surrounding airflow. Fig. 8 compares the leading edge flow diagrams of smooth and eroded airfoils at an angle of attack of 9.3°. The airflows around the Type A and Type B airfoils (Fig. 8b,c) were almost the same as that around the smooth airfoil (Fig. 8a), because the aerodynamic performance was not affected by the small effect of the pits and gouges on the boundary layer flow. The Type C airfoil (Fig. 8d) showed a clear step at the delamination boundary, where the flow state near the leading edge was altered. Boundary layer flow separation occurred after the airflow bypassed the delamination step. The flow separation of the air flow through the suction surface of the pressure surface and the step creates vortices in front of and behind the step. The airflow then separated and re-adhered to the airfoil surface. These results, together with Fig. 7d, show that leading edge delamination caused airflow to separate from the leading and trailing edges of the airfoil surface, thereby decreased the lift force.
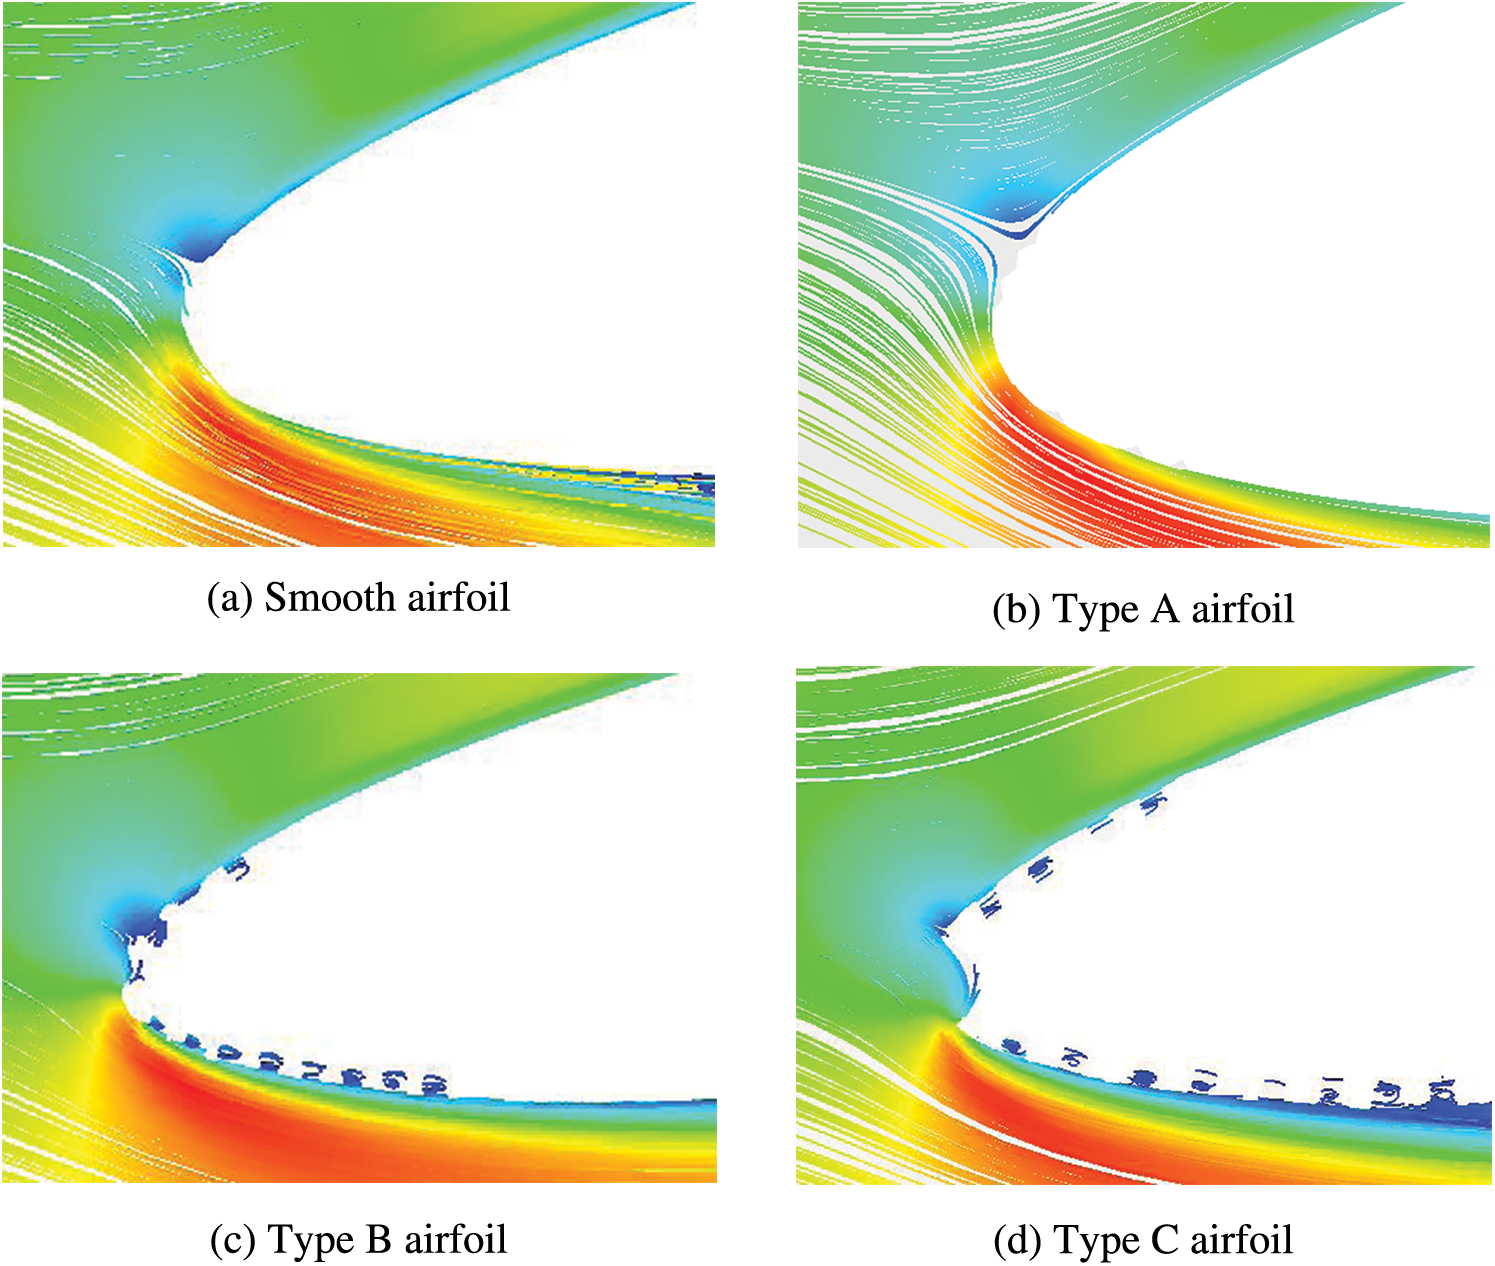
Figure 8: Leading edge flow diagrams of smooth and eroded airfoils at an angle of attack of 9.3°
4.3 Flow Field Characteristics
The resultant force of friction stress and pressure on the airfoil surface causes lift and drag, and the aerodynamic characteristics of the airfoil are affected by the pressure and velocity fields around the airfoil. Therefore, the influence of leading edge erosion on the aerodynamic characteristics was analyzed by comparing the pressure and velocity fields around the eroded and smooth airfoils. Figs. 9 and 10 compare the flow field characteristics around smooth and Type C airfoils at an angle of attack of 10°. For the smooth airfoil (Figs. 9a and 10a), the airflow over the airfoil surface generated a stagnation point at the leading edge where the pressure reached its maximum and the velocity reached its minimum. As the airflow passed through this point, a shunt occurred: a portion of the flow passed through the leading edge and flowed along the suction surface to the trailing edge, while another portion flowed downstream along the pressure surface. The velocity of the airflow initially increased and then decreased, and it reached its maximum at the leading edge of the airfoil. The pressure initially decreased and then increased, and it reached its minimum at the leading edge. For the Type C airfoil (Figs. 9b and 10b), delamination greatly changed the flow field around the airfoil, especially near the pressure surface. Steps appeared on the surface of the airfoil, and the velocity and pressure of the airflow pulsed and accelerated at each step. As the flow passed over a step, not only did the pressure decreasd dramatically, it increased the pressure gradient and caused the boundary layer to separate. It also caused the separation point to move. The pressure fields of the Type C airfoil and smooth airfoil show that leading edge delamination increased the static pressure range of the suction surface, but the negative pressure on the pressure surface decreased over most of the area except for a small portion behind the step, which reduced the wing lift and increased drag.
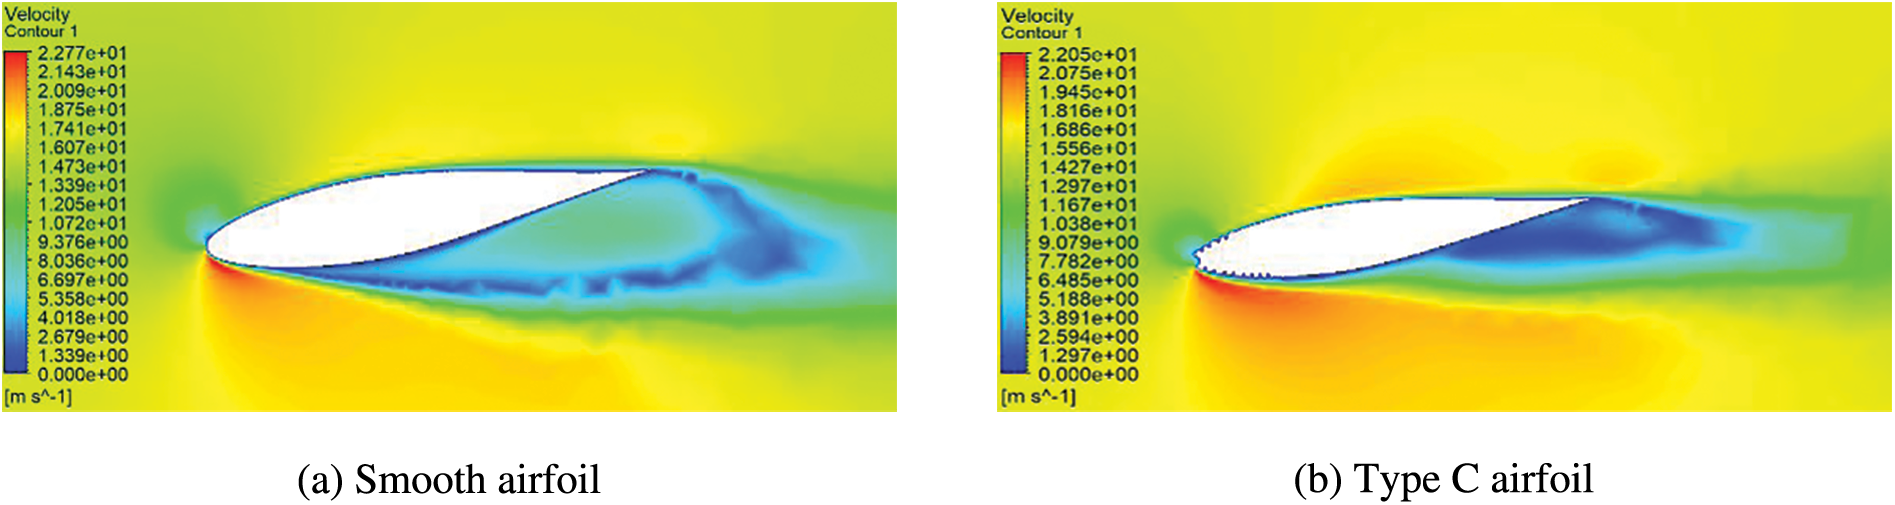
Figure 9: Velocity flow field diagrams of smooth and eroded airfoils at an angle of attack of 9.3°
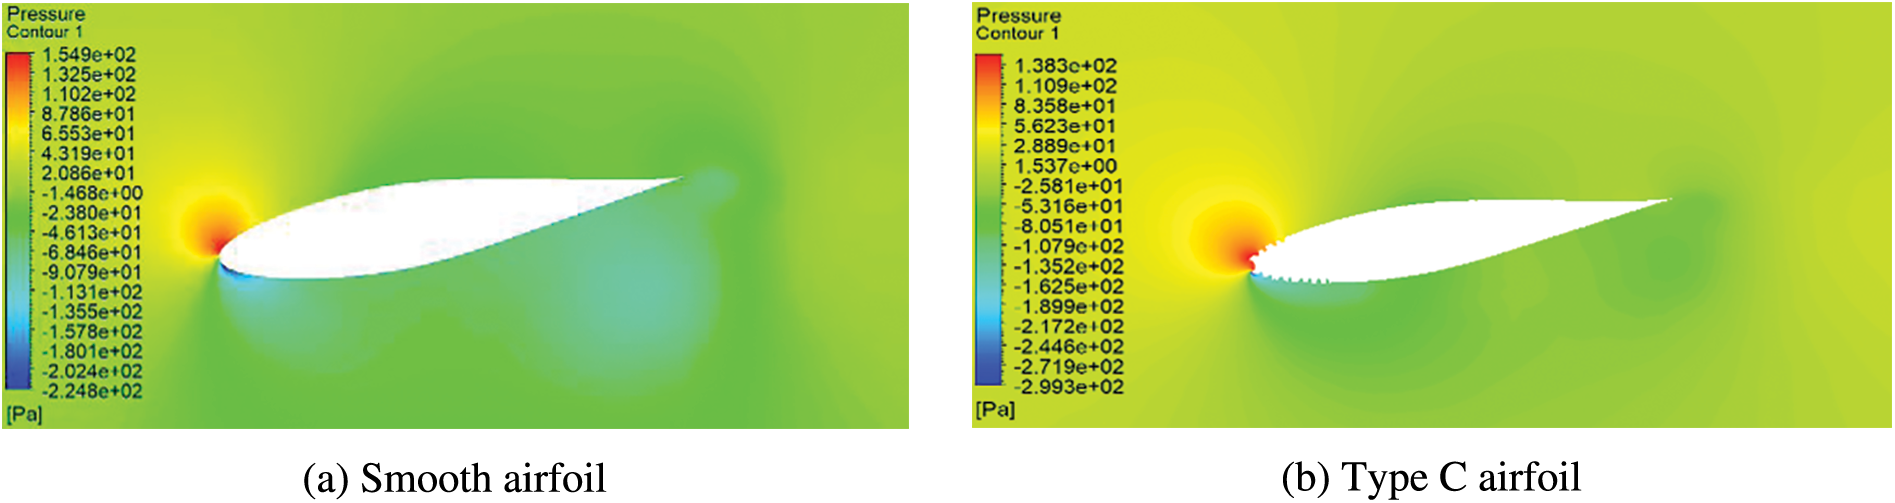
Figure 10: Pressure flow field diagrams of smooth and eroded airfoils at an angle of attack of 9.3°
The above results show that erosion occurs first at the leading edge. With the gradual increase in the degree of erosion, the aerodynamic performance also changes considerably, thus affecting the operation and service life of the blade. Therefore, wind turbine blades should be designed to use more robust materials at the leading edge, or a polyurethane protective film should be installed over blades with pits and gouges to extend the service life.
In this study, the effect of leading edge erosion on the lift coefficient, drag coefficient and flow characteristics of wind turbine blades was analyzed through CFD-based numerical simulations. The study reached the following conclusions:
1) Eroded airfoils with pits and gouges had almost the same lift coefficient as smooth airfoils at angles of attack less than 0°. As the angle of attack increased, the lift coefficient of the eroding airfoil decreased slightly, the drag coefficient increased slightly, and the lift-to-drag ratio decreased slightly. At an angle of attack of 10.3°, the lift–drag ratio of the eroded airfoils was approximately 10% less than that of the smooth airfoil.
2) Delamination of the leading edge had major effects on the lift coefficient, drag coefficient, and lift–drag ratio of the airfoils. Especially at large angles of attack, delamination caused a substantial decrease in the lift coefficient, an increase in the drag coefficient, and a decrease in the lift–drag ratio. At an angle of attack of 10.3°, the lift–drag ratio decreased by up to 60% compared with that of the smooth airfoil. As the degree of erosion was increased, the lift coefficient decreased, and the drag coefficient increased.
3) Erosion of the leading edge aggravated flow separation near the trailing edge of the suction surface of the airfoil, which caused the separation point to move forward. Pits and gouges had little effect on leading-edge airflow. However, delamination had a significant effect on airflow near the leading edge and results in a stepped flow of air along the airfoil surface. The airflow separated around a step and then re-adhered to the airfoil surface.
Acknowledgement: Thanks to the co-authors for their efforts in the completion of this paper, and thanks to the New Energy Institute of Shenyang Institute of Technology for providing experimental conditions for the completion of this paper.
Funding Statement: Natural Science Foundation of Liaoning Province (2022-MS-305); Foundation of Liaoning Province Education Administration (LJKZ1108).
Author Contributions: The authors confirm contribution to the paper as follows: study conception and design: Xin Guan, Mingyang Li, Shuaijie Wang; data collection: Xin Guan, Shiwei Wu, Yuqi Xie; analysis and interpretation of results: Mingyang Li, Shuaijie Wang; draft manuscript preparation: Xin Guan, Yuqi Xie. All authors reviewed the results and approved the final version of the manuscript.
Availability of Data and Materials: The data used in the analysis and calculation in this paper comes from the publicly available data, and the final analysis result data is obtained through laboratory analysis and calculation.
Conflicts of Interest: The authors declare that they have no conflicts of interest to report regarding the present study.
References
1. Keegan MH, Nash DH, Stack MM. On erosion issues associated with the leading edge of wind turbine blades. J Phys D Appl Phys. 2013;46(38):383001. doi:10.1088/0022-3727/46/38/383001. [Google Scholar] [CrossRef]
2. Soltani MR, Birjandi AH, Moorani MS. Effect of surface contamination on the performance of a section of a wind turbine blade. Sci Iran. 2011;18(3):349–57. doi:10.1016/j.scient.2011.05.024. [Google Scholar] [CrossRef]
3. Li R, Chen Y. Effects of surface roughness and Reynolds number on aerodynamic performance of wind turbine airfoil. J Nanjing Univ Aeronaut Astronaut. 2021;43(5):693–6 (In Chinese). [Google Scholar]
4. Madsen HA. Aerodynamics of a horizontal-axis wind turbine in natural conditions. Denmark: Riso National Laboratory for Sustainable Energy, Technical University of Denmark; 1991. [Google Scholar]
5. Castorrini A, Barnabei VF, Domenech L. Impact of meteorological data factors and material characterisation method on lifetime predictions of leading edge erosion of wind turbine blades. Renew Energy. 2024;227:120549. doi:10.1016/j.renene.2024.120549. [Google Scholar] [CrossRef]
6. Sareen A, Sapre CA, Selig MS. Effects of leading edge erosion on wind turbine blade performance. Wind Energy. 2014;17(10):1531–42. doi:10.1002/we.1649. [Google Scholar] [CrossRef]
7. Gaudern N. A practical study of the aerodynamic impact of wind turbine blade leading edge erosion. J Phys. 2014;524(1):12031. doi:10.1088/1742-6596/524/1/012031. [Google Scholar] [CrossRef]
8. Gharali K, Johnson DA. Numerical modeling of an 5809 airfoil under dynamic stall erosion and high reduced frequencies. Appl Energy. 2012;93:45–52. [Google Scholar]
9. Zhang J, Yuan Q, Wu C. Numerical simulation on the effect of surface roughness for large wind turbine blades. Proc CSEE. 2020;34(20):3384–91 (In Chinese). [Google Scholar]
10. Ren N, Ou J. Dust effect on the performance of wind turbine airfoils. J Electromagn Anal Appl. 2009;1(2):102–7 (In Chinese). [Google Scholar]
11. Keegan MH, Nash DH, Stack MM. Numerical modelling of hailstone impact on the leading edge of a wind turbine blade. In: EWEA Annual Wind Energy Event 2013;2013. p. 498–502. [Google Scholar]
12. Zhang S, Dam-Johansen K, Norkjar S. Erosion of wind turbine blade coatings: design and analysis of jet-based laboratory equipment for performance evaluation. Prog Org Coat. 2015;2015:103–15. [Google Scholar]
13. Jiang CH. Aerodynamic performance analysis and optimization design of wind turbine with Iced airfoil. China: Chongqing University; 2021. [Google Scholar]
14. Li CR, Li GW, Chen W. Effect of attachment of blade surface on wind turbine. Acta Energiae Solaris Sinica. 2012;33(4):540–4. [Google Scholar]
15. Elham FS, Farzin D, Shirazi Siamack A. A method to determine the uncertainties of solid particle erosion measurements utilizing machine learning techniques. Wear. 2023;522:204688. doi:10.1016/j.wear.2023.204688. [Google Scholar] [CrossRef]
16. Andrea C, Javier I, Souto Ricardo M. In-situ measurement of electrochemical activity related to filiform corrosion in organic coated steel by scanning vibrating electrode technique and scanning micropotentiometry. Corros Sci. 2024;227:111669. doi:10.1016/j.corsci.2023.111669. [Google Scholar] [CrossRef]
17. Zhou AG, Zeng ZJ, Wu JZ. Neural network PID decoupling control for multi-point static test of wind turbine blades. Meas Control Technol. 2021;14:2041 (In Chinese). [Google Scholar]
18. Liu PH, Deng H, Xie HJ. Load disturbance analysis of full-scale static loading test for wind turbine blades. Meas Control Technol. 2022;12(6):1026. [Google Scholar]
19. Moreno-Casas PA, Bombardelli FA. Computation of the Basset force: recent advances and environmental flow applications. Environ Fluid Mech. 2016;16:193–208. doi:10.1007/s10652-015-9424-1. [Google Scholar] [CrossRef]
20. Klinkenberg J, de Lange HC, Brandt L. Linear stability of particle laden flows: the influence of added mass, fluid acceleration and Basset history force. Meccanica. 2014;49(4):133–43. [Google Scholar]
21. Fan ZL. Research on surface roughness detection method of slender parts based on machine vision. Hangzhou, China: Zhejiang University of Science and Technology; 2021. [Google Scholar]
22. Wei WZ, Tian JY, Jiang Q. Support vector machine detection model of part surface roughness based on image technology. Mod Manuf Eng. 2022;4(1):15029. [Google Scholar]
23. Major D, Palacios J, Maughmer M. A numerical model for the analysis of leading-edge protection tapes for wind turbine blades. J Phys: Conf Series. 2020;1452(1):12058. [Google Scholar]
24. Doagou-Rad S, Mishnaevsky L. Rain erosion of wind turbine blades: computational analysis of parameters controlling the surface degradation. Meccanica. 2020;55(4):725–43. [Google Scholar]
25. Verma S, Castro SGP, Jiang ZY. Numerical investigation of rain droplet impact on offshore wind turbine blades under different rainfall conditions: a parametric study. Compos Struct. 2020;2020(2):112096. [Google Scholar]
26. Ravi Chandran KS. Review: fatigue of fiber-reinforced composites, damage and failure. J Indian Inst Sci. 2022;102(1):439–60. doi:10.1007/s41745-021-00280-y. [Google Scholar] [CrossRef]
27. Cheng XQ, Du XY. Research development of fatigue life prediction and damage analysis model of fiber-reinforced composite. J Beijing Univ Aeronaut Astronaut. 2021;47(7):1311–22 (In Chinese). [Google Scholar]
28. Fu SF, Li Z, Zhu WJ, Han XX, Liang XL, et al. Study on aerodynamic performance and wake characteristics of a floating offshore wind turbine under pitch motion. Renew Energy. 2023;205:317–25. doi:10.1016/j.renene.2023.01.040. [Google Scholar] [CrossRef]
29. Gao JX, An ZW, Ma Q. Experimental evaluation of fatigue life and reliability of wind turbine blade subjected to random load. J Lanzhou Univ Technol. 2019;182:112–22 (In Chinese). [Google Scholar]
30. Timmer WA, Rooij RPJOM. Summary of the delft University wind turbine dedicated airfoils. ASME J Solar Energy Eng. 2003;125(4):488–96. doi:10.1115/1.1626129. [Google Scholar] [CrossRef]
31. Shin J. Characteristics of surface roughness associated with leading-edge ice accretion. J Aircr. 2015;33(2):316–21 (In Chinese). [Google Scholar]
32. China National Standards Committee. GB/T 25384-2018 wind turbines-full scale structural testing of rotor blade; 2018. [Google Scholar]
Cite This Article
 Copyright © 2024 The Author(s). Published by Tech Science Press.
This work is licensed under a Creative Commons Attribution 4.0 International License , which permits unrestricted use, distribution, and reproduction in any medium, provided the original work is properly cited.
 Downloads
 Citation Tools