
 Submit a Paper
 Propose a Special lssue
 Open Access
ARTICLE

A Novel Model for the Prediction of Liquid Film Thickness Distribution in Pipe Gas-Liquid Flows
1 School of Thermal Engineering, Shandong Jianzhu University, Jinan, 250101, China
2 Shandong Technology Innovation Center of Carbon Neutrality, Shandong Jianzhu University, Jinan, 250101, China
3 Weihai Haihe Technology Co., Ltd., Weihai, 264200, China
* Corresponding Author: Yubo Wang. Email:
Fluid Dynamics & Materials Processing 2024, 20(9), 1993-2006. https://doi.org/10.32604/fdmp.2024.049510
Received 09 January 2024; Accepted 22 April 2024; Issue published 23 August 2024
 View Full Text
 Download PDF
Abstract
A model is proposed for liquid film profile prediction in gas-liquid two-phase flow, which is able to provide the film thickness along the circumferential direction and the pressure gradient in the flow direction. A two-fluid model is used to calculate both gas and liquid phases’ flow characteristics. The secondary flow occurring in the gas phase is taken into account and a sailing boat mechanism is introduced. Moreover, energy conservation is applied for obtaining the liquid film thickness distribution along the circumference. Liquid film thickness distribution is calculated accordingly for different cases; its values are compared with other models and available experimental data. As a result, the newly proposed model is tested and good performances are demonstrated. The liquid film thickness distribution in small pipes and inclined pipes is also studied, and regime transition is revealed by liquid film profile evolution. The observed inflection point demonstrates that the liquid film thickness decreases steeply along the circumference, when the circle angle ranges between 30° and 50° for gas-liquid stratified flow with small superficial velocities.Keywords
Abbreviation
| Nomenclature | |
| A | Cross-sectional area, projected area |
| c | Coefficients |
| D | Cylinder diameter |
| f | Friction factor |
| F | Forces |
| g | Gravity |
| h | Film height |
| P | pressure |
| Re | Reynolds number |
| s | Integral curve |
| S | Perimeter |
| t | Time |
| v | Liquid velocity in the film |
| VGS | Gas superficial velocity |
| VLS | Liquid superficial velocity |
| x | x-axis of Cartesian coordinate system |
| y | y-axis of Cartesian coordinate system |
| Greek Symbols | |
| τ | Shear stress |
| ρ | Density |
| α | Liquid holdup |
| β | Pipe inclination |
| σ | Surface tension |
| Subscripts | |
| G | Gas phase |
| I | Interface |
| L | Liquid phase |
| w | Wall |
Two-phase flow is commonly encountered in processing industries (e.g., petroleum transportation and chemical processes). Fluid properties [1,2] and flow regimes [3,4] are the primary factors considered to assess and reveal pipe and equipment failure in petroleum refining. As a consequence, it is of great importance to obtain these characteristics for industrial control and optimization of parameters, such as void fraction and pressure drop in gas-liquid two-phase flow. In recent years, considerable efforts have been made to theoretically and experimentally analyze the gas-liquid two-phase flow in horizontal and inclined pipes for both stratified and annular flows [5–7].
Compared to direct numerical simulation (DNS), the two-fluid model efficiently predicts the pressure drop and void fraction in gas-liquid two-phase flow, with its multiple variations deducing different flow regime transitions [8–10]. This model utilizes shear stress and drag forces to simplify the calculation of interaction forces in DNS. Agrawal et al. [11–13] experimentally studied the shear stress and drag forces in gas-liquid two-phase flow and proposed various models for the fluid-wall and interfacial friction factors. Theoretically, the friction can be determined by using the fluid local velocity and Reynolds number. Li [14] proposed an alternate model to test and verify the relationship between the liquid film level and characteristic shear stress, which was used to determine the liquid-wall friction. However, they encountered considerable errors (~25%) in the hydraulic calculation of gas-liquid two-phase flow.
Void fraction is closely correlated with the liquid film profile, which accordingly influences the interactions between the fluids and the pipe wall. Different liquid film profile models, such as the FLAT, ARS, and MARS models, have been developed to precisely predict the void fraction (Fig. 1). Cioncolini et al. [15] and Mauro et al. [16] studied the liquid film thickness for annular flow in horizontal circular macro-channels, with the assumption of asymmetric liquid film thickness in the pipe cross-section to experimentally investigate fluid flows. Comparing various experiments for tube diameters in the range of 8.2–95.3 mm, a mean absolute error of ~25% for pressure gradient was observed for the asymmetric liquid film thickness model. However, the models mentioned above are empirical and do not reveal the liquid film formation mechanism, which is necessary for flow regime transition model analysis.

Figure 1: (a) FLAT, (b) ARS, (c) MARS film profile models in gas-liquid stratified flow
The liquid film profile is impacted by the physical properties of both fluids and their interactions. The liquid film is smooth and can be assumed to be flat when both gas and liquid superficial velocities are sufficiently low; waves appear on the interface with increasing fluid superficial velocities. The waves can become large and intermittently wet the pipe wall, changing the flow regime from stratified to intermittent. When the wave frequency increases and the circumference expands, the flow in the pipes becomes annular. Several studies developed the entrainment-deposition mechanism for the stratified-annular flow regime transition [17–19]. Moreover, secondary flow, wave mixing, and the sailing boat mechanism have been successfully applied to account for the above-described wave behaviors [20–22]. Li et al. [23] studied the influence of pumping action on disturbance waves, gas phase secondary flow, entrainment, and droplet deposition, and established a new model for circumferential liquid film thickness distribution, correlated with the stress balance analysis. Bonizzi et al. [24] solved the energy conservation equation to precisely determine the momentum conservation equation, which was further employed to accurately predict film thickness. Sahu et al. [25] studied the influence of fluid physical properties, such as viscosity and surface tension, on liquid film thickness and increased its prediction accuracy.
Wang et al. [26] studied the air-water two-phase flow in a horizontal pipe for a range of high pressures and obtained the flow pattern maps. Obviously, the flow pattern is impacted by the fluid velocities that the liquid expansion in circumference in the annular flow test; the flow regime transitions to stratified or intermittent flow with the changing gas/liquid phase velocity. Therefore, the liquid film profile can be reasonably employed to interpret the flow regime transition mechanism, and hence, to precisely calculate void fraction.
In this study, we developed a novel model for film thickness prediction by employing both gas phase secondary flow and sailing boat mechanism to reveal its distribution. We further analyzed the film profile of annular flow in small pipes and inclined pipes and tested the model’s accuracy. Besides, it is analyzed that the influence of both pipe diameter and pipe inclination on film profile, and the stability of the stratified flow pattern is studied.
Liquid drop entrainment can be neglected for most flow regimes, such as the annular (Fig. 2), stratified, and intermittent flows, where it exerts little influence on pressure loss [14]. We analyzed interface mechanisms, such as gas phase secondary flow and sailing boat mechanism. The following assumptions were made to establish the liquid film profile model:

Figure 2: Illustration of the interfacial film profile in a circle pipe for annular flow
(1) Symmetry of the liquid film about the vertical axial plane.
(2) A constant velocity gradient in the liquid film velocity boundary.
(3) No velocity slip on the interfaces.
(4) Constant gas and liquid densities.
(5) Fully developed pipe flow.
The balance of mass, momentum, and energy equations of both gas and liquid phases make up the one-dimensional (1D) two-fluid model. Both area and body forces are introduced to simplify the calculation of shear stress terms in the Navier-Stokes (N-S) equations. Ignoring the mass transfer between the two phases, the two-fluid model can be expressed as follows [14]:
Shear stresses working on both phases are functions of fluid physical properties and flow characteristics and can be expressed as follows [14]:
Friction factors are introduced to relate shear stresses and fluid flow parameters and are proven to be dominantly influenced by the Reynolds numbers [14]. Typically, the equivalent Reynolds number based on the fluid channel equivalent diameter is applied for the fluid flow calculation; the equivalent diameters of the liquid and gas phases can be defined as
The stratified-annular flow transition emerges with the increasing gas phase superficial velocity and the liquid film roughens accordingly. Agrawal et al. [11] observed that the liquid film thickness played an important role in influencing the interfacial shear stress and established a more complex model for the interfacial friction factor, expressed as follows:
We analyzed the influence of the gas phase secondary flow on the liquid film to reveal its propagation mechanism. The liquid phase in the film is acted upon by various area and body forces, such as shear stress, difference pressure, and gravity (Fig. 3).

Figure 3: Fluid movement in the inertial frame of reference
Assuming VGS and VLS to be the velocities of the gas and liquid phases (the two sides of the interface), respectively, along the circumference, the energy conservation equations of the two fluids can be expressed as follows:
Wongwises et al. [28] suggested liquid film velocity to be a function of the gas and liquid velocities in a horizontal pipe, expressed as follows:
Both gas-phase secondary flow velocity and shear stress are related to the gas bulk velocity in the axial direction of the pipeline as follows [29]:
Both gas-phase secondary flow and sailing boat mechanism were introduced to establish the new model for predicting liquid film thickness, using which both the transfer direction and velocity magnitude of the fluids on the interface could be calculated.
We applied an iteration method to calculate the proposed model, detailed as follows:
1. We applied the FLAT model in the two-fluid model to obtain the void fraction and friction factors at the interfaces. Both gas and liquid velocities in the axial direction of the pipeline were calculated.
2. Fluid flow parameters at the interface were obtained by solving the proposed model (Eqs. (6)–(8)). Both liquid velocity vector and film thickness were determined accordingly.
3. Steps (1) and (2) were repeated while increasing the average liquid film thickness till the error reached a certain value.
4.1 Film Thickness Distribution
4.1.1 Film Profile Comparison for Different Models
We compared the liquid film thickness distribution predictions of the proposed model with the Bonizzi et al. [24] and Cioncolini et al. [15] models against the experimental data of Pitton et al. [30] (Fig. 4). Firstly, it is easy to see that the models give proof that there is a singular point in film thickness distribution curve, which is about 40° in the situation. The proposed model predicted the liquid film thickness distribution with a higher accuracy compared to the Bonizzi model. A steep decrease in the film thickness was observed for circle angles <40° for both Bonizzi and Thome models; both these models underestimated the film thickness for a circle angle of 0°. However, the proposed model achieved a much smoother and evasive prediction curve compared to those of the abovementioned models, with a smaller error. These results indicated that the gas secondary flow plays a significant role in liquid film thickness distribution.
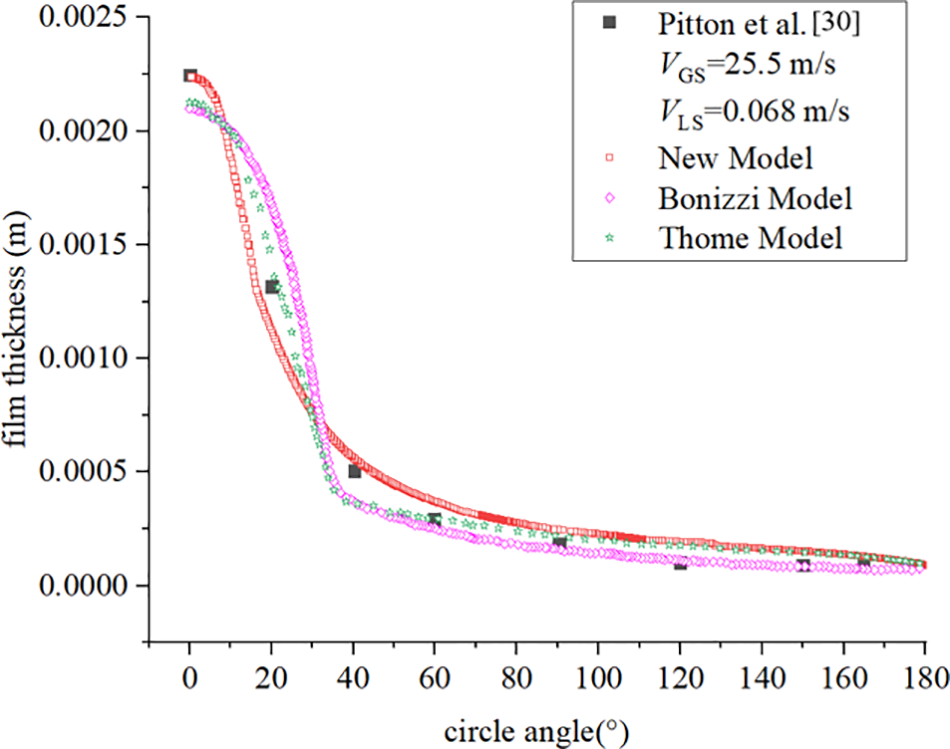
Figure 4: Liquid film thickness distribution against circle angle for various models compared to experimental data
Both eddy and turbulent viscosities were taken into consideration to model the liquid film profile in the Bonizzi model. The eddy diffusivity discontinuity employed in this model could account for the inflection point circle angle of ~35° (Fig. 4). In the proposed model, we instead introduced the influence of gas-phase secondary flow and liquid surface tension to obtain the liquid film thickness distribution mechanism. The predictions were well in accordance with the experimental data; the inflection point circle angle was found to be smaller than 40°.
4.1.2 Film Profile in a Horizontal Circle Pipe
We analyzed the liquid film thickness distribution in a horizontal pipe as predicted by different models for a range of fluid flow velocities (Fig. 5); we further compared the model predictions with the experimental data of Pitton et al. [30] (Fig. 6).
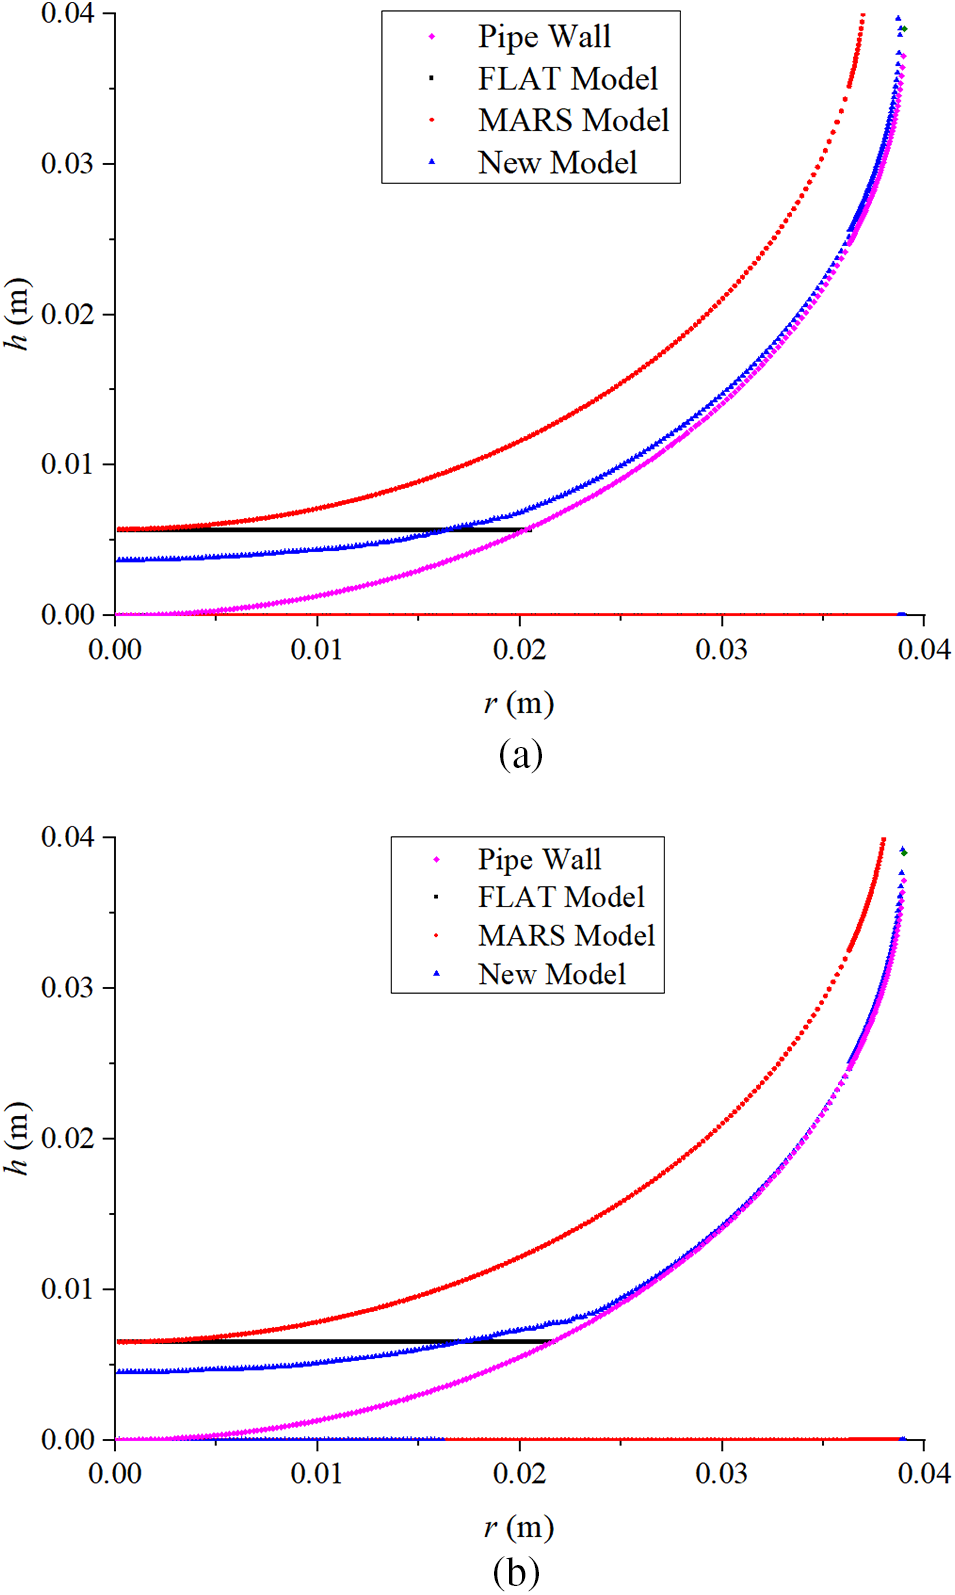
Figure 5: Comparison of horizontal pipe liquid film thickness distribution predictions for various models at (a) VGS = 20.800 m/s and VLS = 0.068 m/s; and (b) VGS = 17.100 m/s, VLS = 0.068 m/s
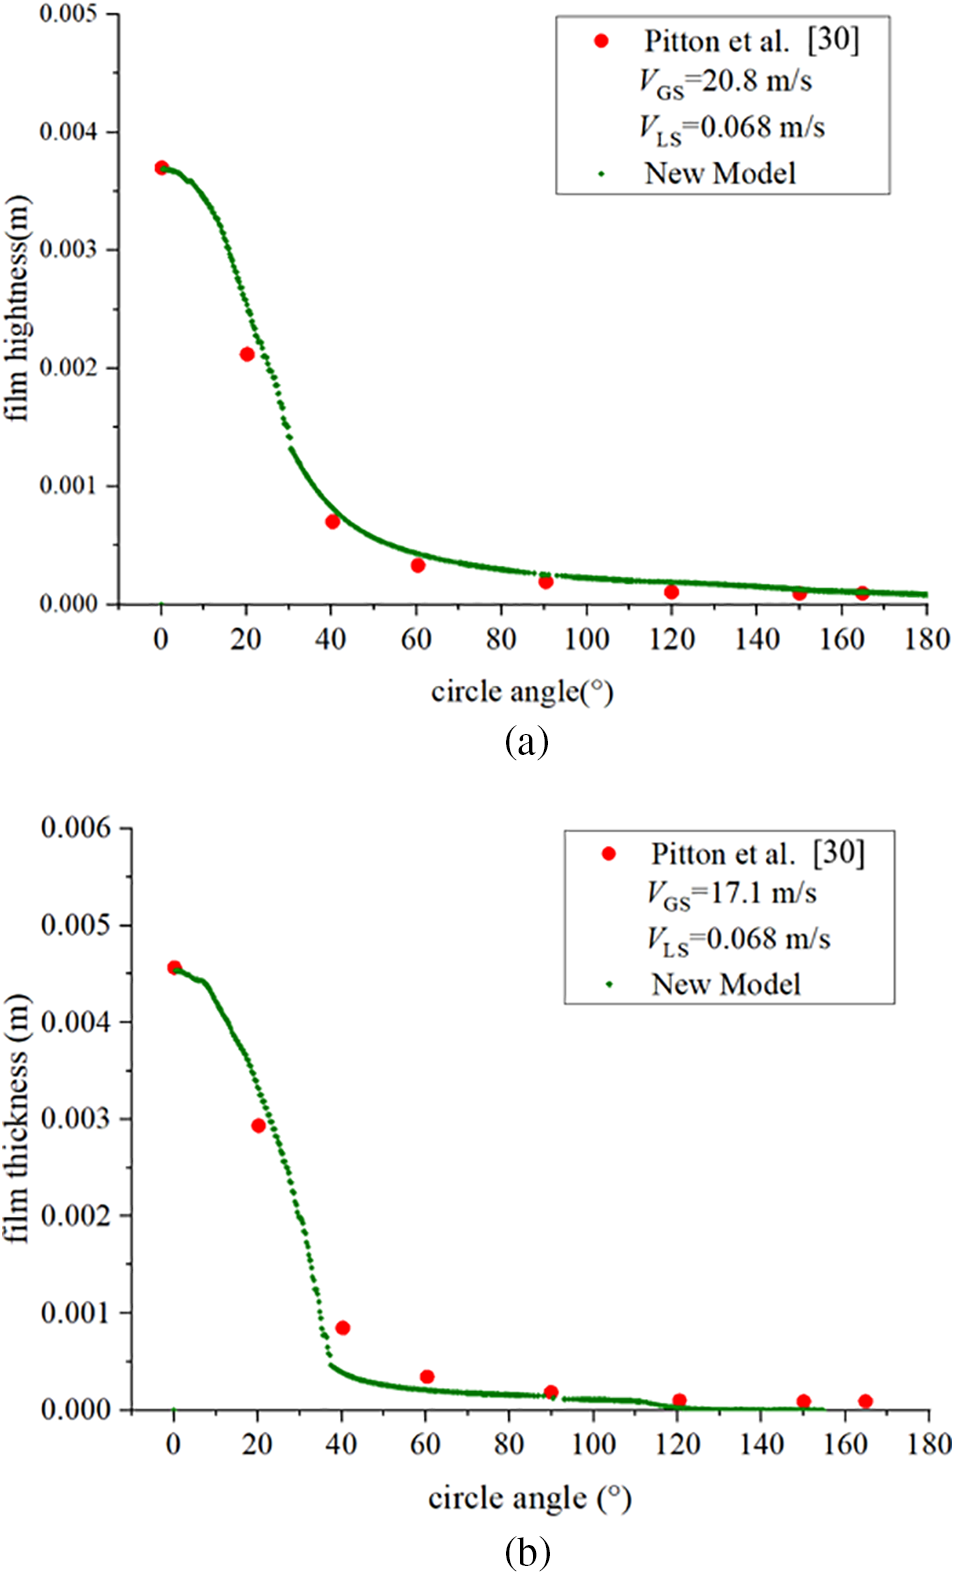
Figure 6: Comparison of horizontal pipe liquid film thickness distribution predictions for the proposed model against experimental data [30] at (a) VGS = 20.800 m/s and VLS = 0.068 m/s; and (b) VGS = 17.100 m/s, VLS = 0.068 m/s
The film thickness distribution curve decreased steeply for circle angles <40° (Figs. 5 and 6). Above 40°, the film thickness decreased gradually with the increasing circle angle. We observed that the fluid parameters influenced the liquid film thickness distribution. For a constant liquid superficial velocity of 0.068 m/s, the film thickness distribution curve became steeper for circle angles ranging from 0–40°. As the gas superficial velocity decreased from 25.5 to 17.1 m/s, the film profile flattened, approaching zero, indicating that the decreased gas-phase secondary flow could not balance the liquid phase gravity and liquid-wall shear stress. For the circle angles in the range of 40–180°, the higher gas velocity led to a greater interfacial shear stress, which balanced the liquid gravity and accounted for the larger film thickness (Fig. 6d). Generally, the results showed that the gas-phase secondary flow was responsible for the circumferential liquid expansion in the circle pipe.
4.1.3 Influence of Inclination Angle on Film Profile
We analyzed the influence of pipe inclination on the liquid film thickness distribution for different fluid superficial velocities. For the air-liquid two-phase flow in a circle pipe with a small inclination, a stratified wave flow was observed for the gas and liquid superficial velocities of 7.50 and 0.05 m/s, respectively. The flow regime approached the stratified-annular flow transition boundary with the gas superficial velocity reaching 10.50 m/s, as the magnitudes of the gas secondary flow increased. As a result, the maximum liquid film level was suppressed.
Compared to fluid flows at high gas superficial velocities (Figs. 5 and 6), liquid expansion along the circle pipe circumference was suppressed and neutralized for the decreased gas secondary flow. Initially, the liquid film thickness decreased steeply with the increasing circle angle, with no inflection points; liquid expansion up to the top wall of the pipe was not observed. The film thickness magnitude increased with the increasing pipe inclination, with significant differences observed in the predictions of the different models. However, the pipe inclination on the liquid expansion circle angle was small and could have been neglected for all models. Compared to the FLAT model, a much wider liquid expansion was predicted by the proposed model, with an inflection point at ~60° for gas and liquid superficial velocities of 10.50 and 0.05 m/s, respectively, suggesting the emergence of stratified-annular flow transition in the fluid flow.
Badie et al. [31] experimentally investigated the influence of fluid physical properties on flow characteristics by testing both air-water and air-oil (Shell Tellus 22 oil) fluid flows in an ID 78 mm circle pipe. The FLAT, MARS, and proposed models were applied for void fraction prediction and compared to the experimental values (Fig. 7).
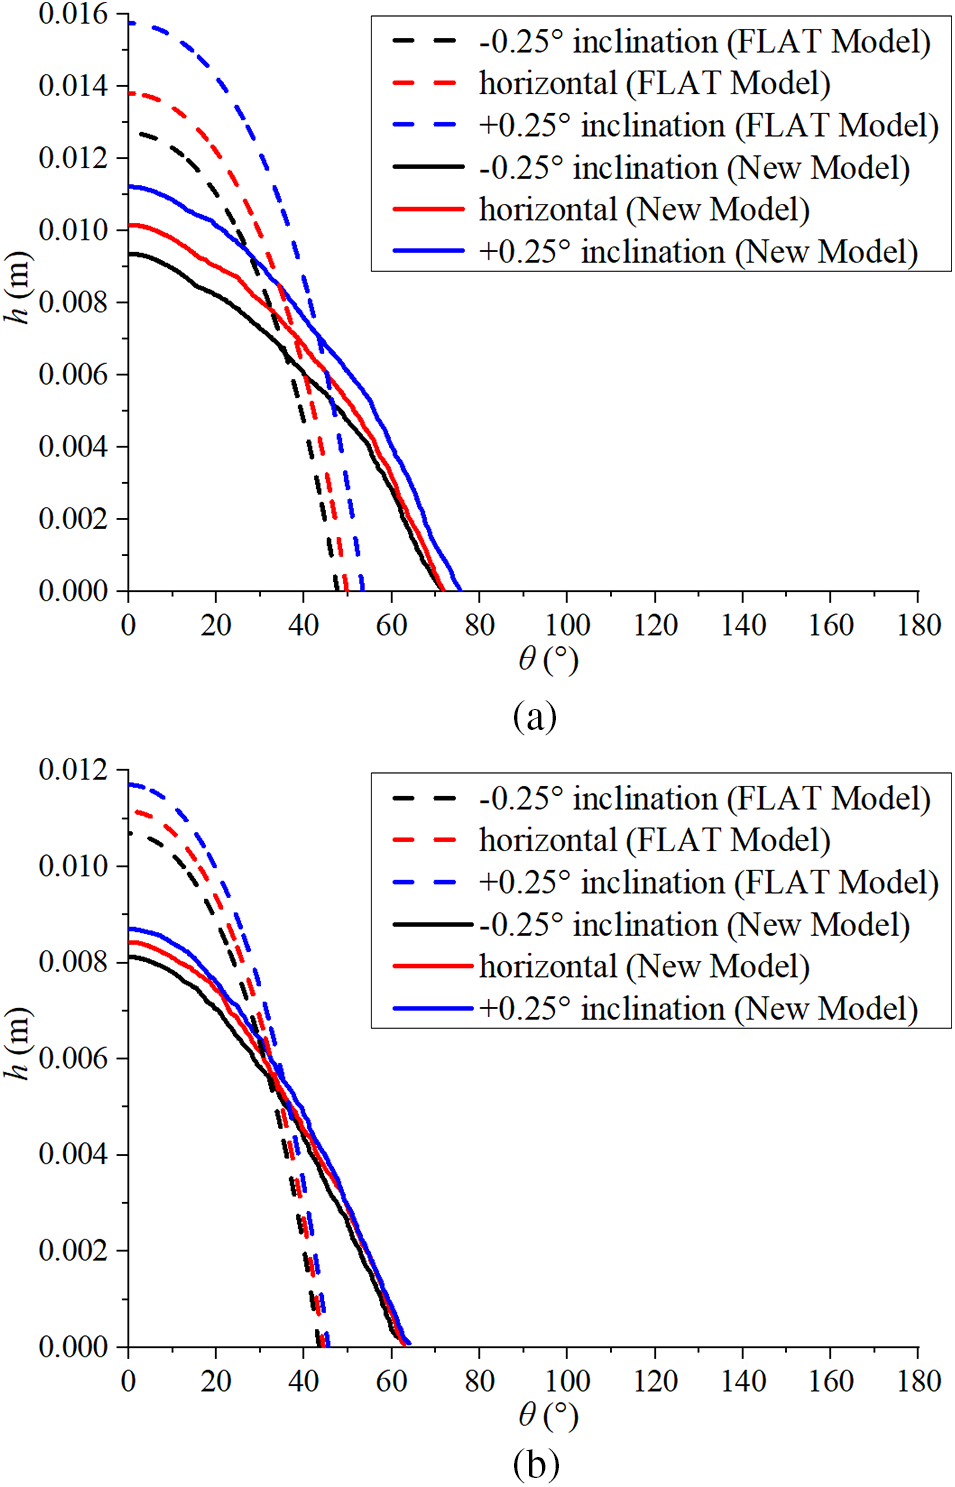
Figure 7: Influence of pipe inclination on liquid film thickness distribution at (a) VGS = 7.50 m/s and VLS = 0.05 m/s; and (b) VGS = 10.50 m/s and VLS = 0.05 m/s
All models predicted the void fraction with good accuracy (Fig. 8), with the proposed model having a better prediction accuracy for a large range of liquid superficial velocities. The air-water two-phase flow encountered the greatest prediction error for a liquid superficial velocity of 0.01 m/s due to the liquid void fraction being too small to be precisely predicted. For the air-Shell Tellus 22 oil two-phase flow, the larger liquid phase viscosity stabilized the interface much better than the air-water two-phase flow, allowing for better prediction accuracy.
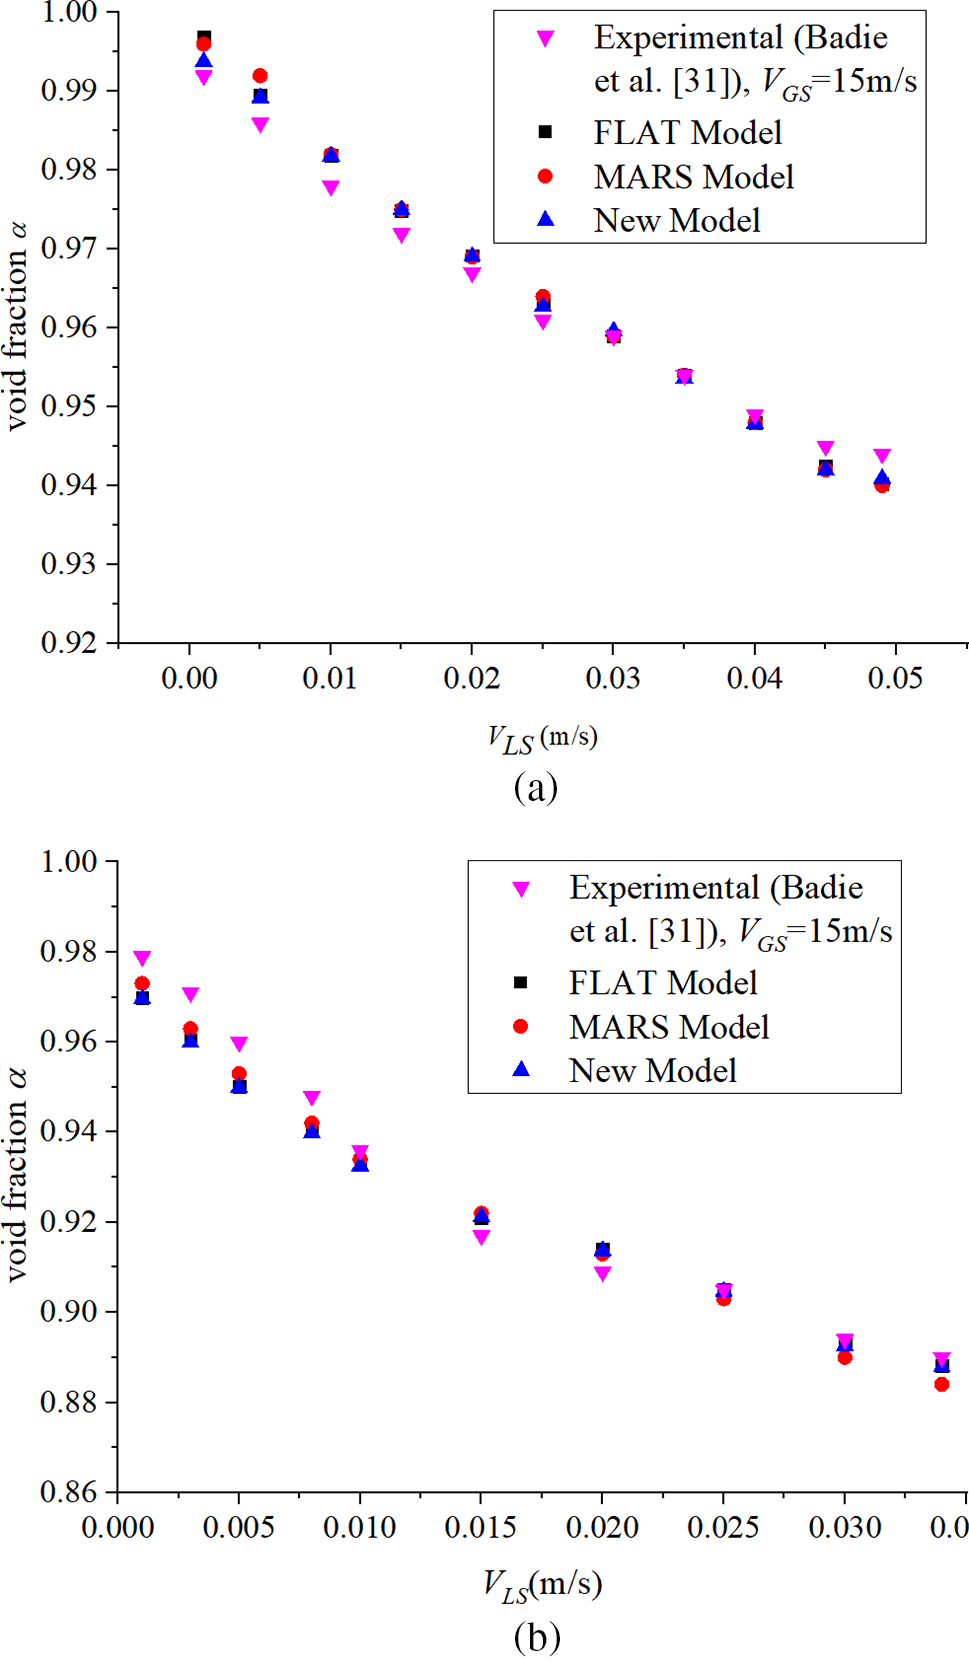
Figure 8: Predicted vs. experimental void fraction values for different models for the (a) air-water and (b) air-Shell Tellus 22 oil two-phase flows
We obtained the pressure gradient by applying the two-fluid model. For the air-water two-phase flow, a wide pressure gradient variation was observed upon using the MARS model, resulting in a much higher prediction error compared to the FLAT model (Fig. 9a). The best predictions were achieved by the proposed model against experimental data. The pressure gradient generally increased with the increasing the liquid superficial velocity. A significant variation in the pressure gradient was observed for the liquid superficial velocity range of 0.03–0.04 m/s (Fig. 9a), possibly influenced by the differential pressure measurement instrument accuracy. Compared with experimental pressure gradient values, the proposed model provided a reasonable prediction of a monotonically increasing pressure gradient.
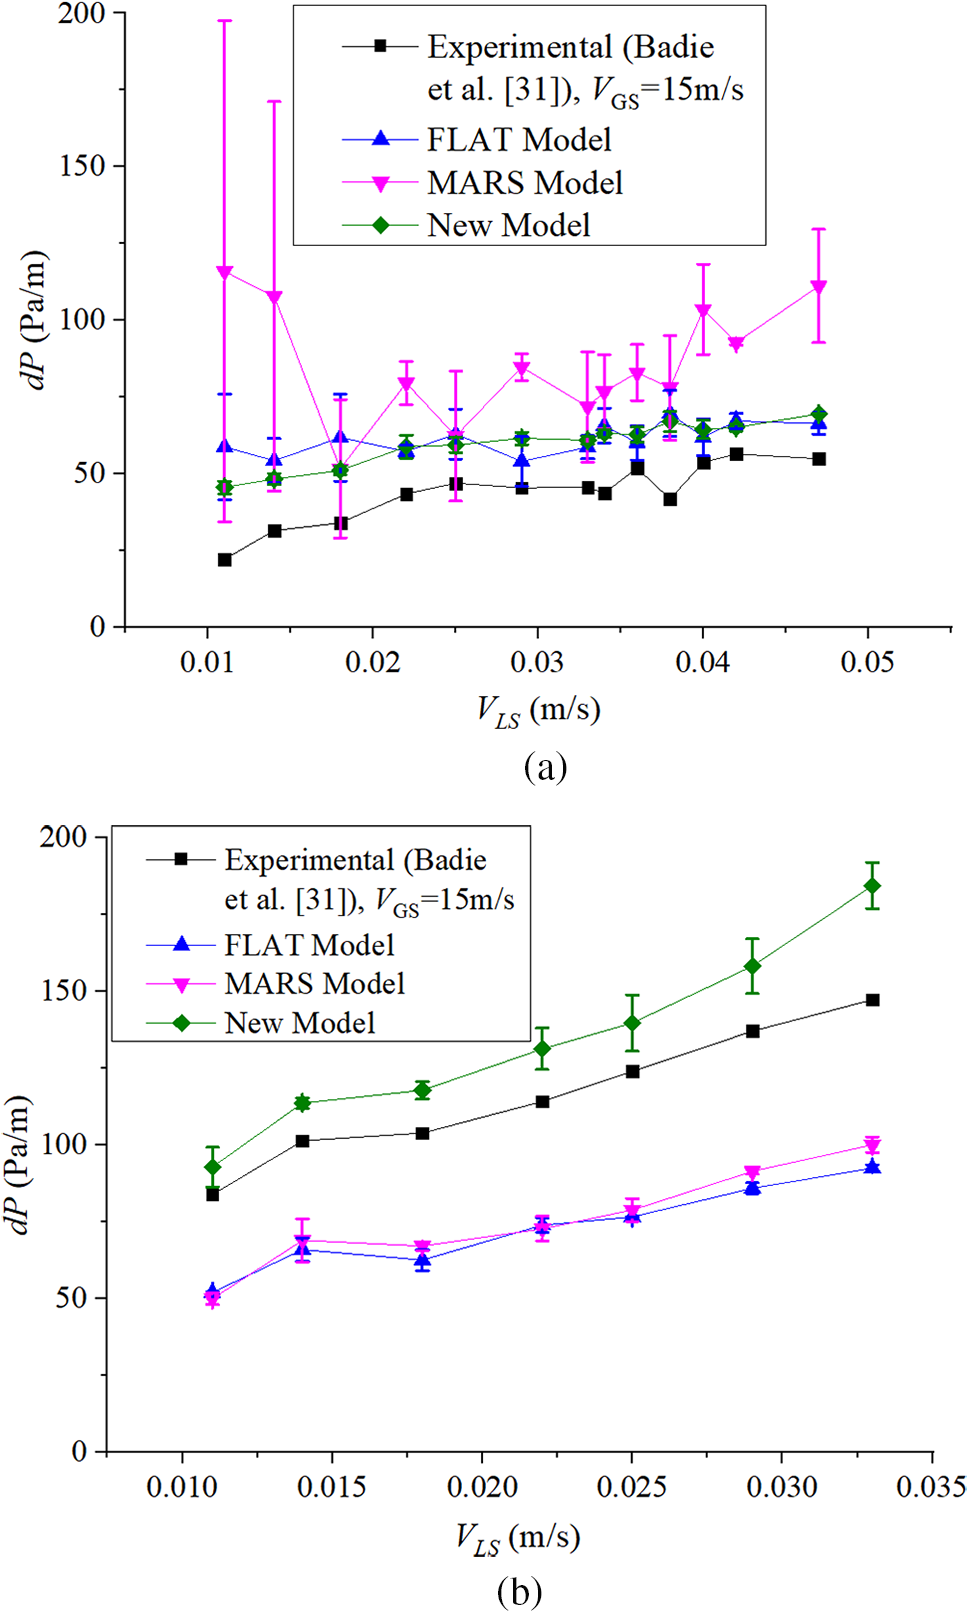
Figure 9: Pressure gradient against liquid phase superficial velocity for (a) air-water and (b) air-Shell Tellus 22 oil two-phase flows for a gas phase superficial velocity of 15.0 m/s
We examined the influence of fluid physical properties on the pressure gradient with Shell Tellus 22 oil adopted as the liquid phase. Both FLAT and MARS models underestimated the pressure gradient; the proposed model provided comparatively more accurate predictions (Fig. 9b). Considering the relationship between the film profile and liquid-wall shear stress, the curved film profile demonstrated a much higher pressure gradient. The circumferential liquid expansion resulted in more accurate pressure gradient predictions for the proposed model compared to that of the MARS model.
4.4 Film Thickness Distribution in a Small Pipe
The liquid phase surface tension influences fluid flow parameters, such as pressure gradient and void fraction (Eq. (8)). Particularly, the liquid-wall interface curvature radius starkly reduces for pipes with small inner diameters, greatly increasing the influence of liquid surface tension on the fluid flow.
Luninski et al. [32] experimentally analyzed the annular flow in a horizontal pipe with a diameter of 8.15 mm and observed a highly even film thickness distribution compared to a pipe with an inner diameter of 50.0 mm. We calculated the air-water annular flow in a horizontal pipe at atmospheric pressure for the proposed model at gas and liquid phase superficial velocities of 10.0 and 0.1 m/s, respectively. The proposed model demonstrated a high film thickness distribution accuracy (Fig. 10).
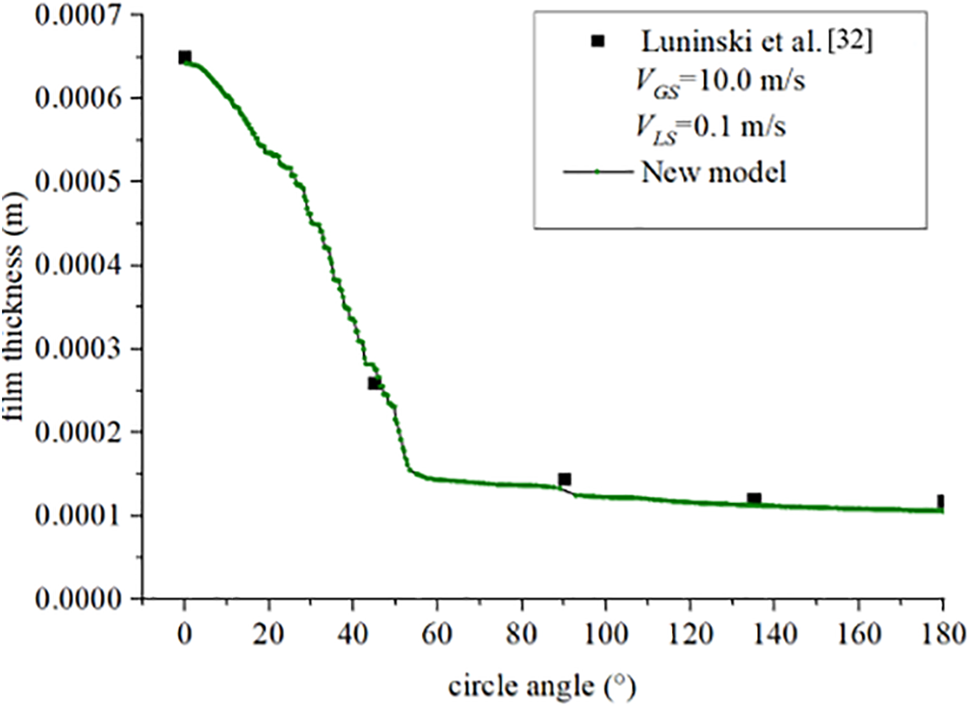
Figure 10: Liquid film thickness distribution for annular flow in a horizontal pipe with a diameter of 8.15 mm
By comparing the liquid film thickness curve illustrated in both Figs. 6b and 9, we can observe that the liquid film expansion inflection point increased remarkably from 38–50° as the pipe inner diameter decreased from 50.00–8.15 mm. Additionally, the film thickness magnitude ratio (i.e., the ratio of the maximum value with that at the inflection point) decreased rapidly from 11.30 to 4.64. The liquid film thickness decreased slightly with the increasing liquid expansion, with the liquid film uniformity increasing within the small pipe. The forces acting on the liquid phase accounted for the differences mentioned above: (i) The significance of gravity degraded compared to the shear stress and (ii) the surface tension acting at the interface crucially impacted the film thickness distribution.
In this study, we propose a novel model for predicting the liquid film thickness distribution in gas-liquid two-phase flow by introducing the gas-phase secondary flow and sailing boat mechanism. The circumferential liquid film distribution computed using the new model demonstrated the highest prediction accuracy against two sets of experimental data [30,31], compared to the FLAT and MARS models.
We analyzed the influence of pipe inclination on the film thickness distribution. Both the highest film thickness level and distribution range defined against the circle angle decrease with the increasing pipe inclination. The acceleration due to gravity suppresses the liquid fraction, and hence, the film thickness distribution along the circumference.
Both the void fraction and pressure gradient predictions for the gas-liquid two-phase flow in the horizontal pipe were estimated against experimental data to test the influence of fluid properties on the flow characteristics. Compared to the FLAT and MARS models, the proposed model better predicts these parameters, indicating highly accurate calculations of shear stresses acting on the two phases.
Finally, we examined the influence of the pipe’s inner diameter on the film thickness distribution. The proposed model again provided accurate predictions of the film thickness distribution against experimental data. The film thickness magnitude ratio decreased steeply as the inner diameter decreased from 50.00 to 8.15 mm.
These results confirmed that the gas-phase secondary flow and sailing boat mechanism plays an important role in the liquid film asymmetrical distribution about the circumference. As a result, the newly proposed model would be promoted by precise calculation of the gas-phase secondary flow, which is related to the gas-liquid two-phase flow regime. The other work is undergoing to establish a new model for the gas-phase secondary flow for different regimes, and the experiment setup is upgrading to finish the tests.
Acknowledgement: The authors wish to acknowledge the reviewers for their helpful remarks on improving this paper.
Funding Statement: The authors would like to acknowledge the support provided by Shandong Provincial Science and Technology Plan Project (No. 2023TSGC0625) and Natural Resources Defense Council (NRDC, K94).
Author Contributions: The authors confirm their contribution to the paper as follows: study conception and design: Y. Wang; analysis and interpretation of results: Y. Wang, Y. Yu, Q. Wang, A. Liu. All authors reviewed the results and approved the final version of the manuscript.
Availability of Data and Materials: The data that support the findings of this study are available on request from the corresponding author.
Conflicts of Interest: The authors declare that they have no conflicts of interest to report regarding the present study.
References
1. Zhu FH, Zhou ZP, Wu XH. Optimization of direct assessment technology for internal corrosion of gathering and transmission pipelines in Changqing gas field. Oil & Gas Storage and Transp. 2021;40(8):925–31 (In Chinese). doi:10.6047/j.issn.1000-8241.2021.08.014. [Google Scholar] [CrossRef]
2. Gong Y, Tang D, Ai G. Internal corrosion direct assessment methodology application in multiphase flow gathering and transportation pipeline. Petrol Plan Eng. 2021;32(1):54–7 (In Chinese). [Google Scholar]
3. Han X. Research progress of gas-liquid two-phase flow corrosion in pipelines. Corros Res. 2022;36(12):101–4 (In Chinese). [Google Scholar]
4. Zhang Y, Liu Z, Geng G. Study on corrosion of pipeline by multiphase flow. J Salt Sci Chem Ind. 2021;50(12):5–10 (In Chinese). [Google Scholar]
5. Zhang R, Liu H, Sheng D, Liu M. A probability model for fully developed annular flow in vertical pipes: film thickness, interfacial shear stress, and droplet size distribution. J Heat Transf. 2017;139(3):032001. doi:10.1115/1.4034900. [Google Scholar] [CrossRef]
6. Xu Q, Chu X, Yao T, Liu W, Guo L. Characteristics of interfacial oscillation caused by condensation of steam jet in subcooled water flow. Exp Therm Fluid Sci. 2019;109:109864. doi:10.1016/j.expthermflusci.2019.109864. [Google Scholar] [CrossRef]
7. Wang R, Lee B, Lee JS. Analytical estimation of liquid film thickness in two-phase annular flow using electrical resistance measurement. Appl Math Model. 2012;36:2833–40. doi:10.1016/j.apm.2011.09.069. [Google Scholar] [CrossRef]
8. Jiang F, Li H, Pourqui M, Ooms G, Henkes R. Simulation of the hydrodynamics in the onset of fouling for oil-water core-annular flow in a horizontal pipe. J Petrol Sci Eng. 2021;207:109084. doi:10.1016/j.petrol.2021.109084. [Google Scholar] [CrossRef]
9. Aan D, Hudaya AZ, Indarto I, Soegiharto K. Wetted wall fraction of gas-liquid stratified co-current two-phase flow in a horizontal pipe with low liquid loading. J Nat Gas Sci Eng. 2019;70:102967. doi:10.1016/j.jngse.2019.102967. [Google Scholar] [CrossRef]
10. Fan D, Gong J, Zhang S, Shi G, Wu C. Transient simulation of gas-condensate two-phase flow in pipes. J Petrol Sci Eng. 2020;185:106609. doi:10.1016/j.petrol.2019.106609. [Google Scholar] [CrossRef]
11. Agrawal SS, Gregory GA, Govier GW. An analysis of horizontal stratified two-phase flow in pipes. Can J Chem Eng. 1973;51:280–7. doi:10.1002/cjce.v51:3. [Google Scholar] [CrossRef]
12. Abegunde M, Briggs T, Abam F, Awolola T. Evaluation of interfacial friction models in stratified flow: gas-liquid two-phase flow. In: SPE Nigeria Annual International Conference and Exhibition; 2019 Aug 5; Lagos, Nigeria. [Google Scholar]
13. Schubring D, Shedd TA. Prediction of wall shear for horizontal annular air-water flow. Int J Heat Mass Tran. 2009;52:202–9. [Google Scholar]
14. Li G. Investigation on the characteristics of interfacial waves in gas-liquid two-phase flow through channels (Ph.D. Thesis). Xi’an Jiaotong University: China; 1996. [Google Scholar]
15. Cioncolini A, Thome JR. Liquid film circumferential asymmetry prediction in horizontal annular two-phase flow. Int J Multiphase Flow. 2013;51:44–54. doi:10.1016/j.ijmultiphaseflow.2012.12.003. [Google Scholar] [CrossRef]
16. Mauro AW, Cioncolini A, Thome JR, Mastrullo R. Asymmetric annular flow in horizontal circular macro-channels: basic modeling of liquid film distribution and heat transfer around the tube perimeter in convective boiling. Int J Heat Mass Tran. 2014;77:897–905. doi:10.1016/j.ijheatmasstransfer.2014.06.021. [Google Scholar] [CrossRef]
17. Alekseenko S, Antipin V, Cherdantsev A, Kharlamov S, Markovich D. Two-wave structure of liquid film and wave interrelation in annular gas-liquid flow with and without entrainment. Phys Fluids. 2009;21(6):061701. doi:10.1063/1.3151999. [Google Scholar] [CrossRef]
18. Liu Y, Upchurch ER, Ozbayoglu EM. Experimental study of single taylor bubble rising in stagnant and downward flowing non-newtonian fluids in inclined pipes. Energies. 2021;14:578. doi:10.3390/en14030578. [Google Scholar] [CrossRef]
19. Liu Y, Upchurch ER, Ozbayoglu EM. Experimental and theoretical studies on taylor bubbles rising in stagnant non-newtonian fluids in inclined non-concentric annuli. Int J Multiphas Flow. 2022;147:103912. doi:10.1016/j.ijmultiphaseflow.2021.103912. [Google Scholar] [CrossRef]
20. Butterworth D, Hewitt GF. Two-phase flow and heat transfer. New York: Oxford University Press; 1997. p. 50–63. [Google Scholar]
21. Baea B, Kim H, Kim K, Jeong JJ, Yun B. Force balance droplet entrainment model for the horizontal stratified flow condition. Int J Heat Mass Tran. 2021;165:120726. doi:10.1016/j.ijheatmasstransfer.2020.120726. [Google Scholar] [CrossRef]
22. Vollestad P, Angheluta L, Jensena A. Experimental study of secondary flows above rough and flat interfaces in horizontal gas-liquid pipe flow. Int J Multiphas Flow. 2020;125:103235. doi:10.1016/j.ijmultiphaseflow.2020.103235. [Google Scholar] [CrossRef]
23. Li W, Li R, Wang Y, Zhou F. Model for prediction of circumferential distribution of film thickness in horizontal gas-liquid annular flow. CIESC J. 2001;52(3):204–8 (In Chinese). [Google Scholar]
24. Bonizzi M, Andreussi P. Prediction of the liquid film distribution in stratified-dispersed gas-liquid flow. Chem Eng Sci. 2016;142:165–79. doi:10.1016/j.ces.2015.11.044. [Google Scholar] [CrossRef]
25. Sahu AK, Kumar S. Thin-liquid-film flow on a topographically patterned rotating cylinder. Phys Fluids. 2014;26(4):042102. doi:10.1063/1.4869208. [Google Scholar] [CrossRef]
26. Wang Y, Chang Y, Liu Z, Zhao X, Guo L. Experimental and theoretical study of interface characteristics of gas-liquid stratified flow in horizontal pipe at high pressure. Flow Turbul Combust. 2020;105(4):1249–75. doi:10.1007/s10494-020-00116-2. [Google Scholar] [CrossRef]
27. Spedding PL, Hand NP. Prediction in stratified gas-liquid co-current flow in horizontal pipelines. Int J Heat Mass Tran. 1997;40(8):1923–35. doi:10.1016/S0017-9310(96)00252-9. [Google Scholar] [CrossRef]
28. Wongwises S, Kalinitchenko V. Mean velocity distributions in horizontal air-water flow. Int J Multiphas Flow. 2002;28(1):167–74. doi:10.1016/S0301-9322(01)00056-8. [Google Scholar] [CrossRef]
29. Laurinat JE, Hanratty TJ, Jepson WP. Film thickness distribution for gas-liquid annular flow in horizontal pipe. Physicochem Hydrodyn. 1985;6:179–95. [Google Scholar]
30. Pitton E, Ciandri P, Margarone M, Andreussi P. An experimental study of stratified-dispersed flow in horizontal pipes. Int J Multiphas Flow. 2014;67:92–103. doi:10.1016/j.ijmultiphaseflow.2014.05.018. [Google Scholar] [CrossRef]
31. Badie S, Hale CP, Lawrence CJ, Hewitt GF. Pressure gradient and holdup in horizontal two-phase gas-liquid flows with low liquid loading. Int J Multiphas Flow. 2000;26:1525–43. doi:10.1016/S0301-9322(99)00102-0. [Google Scholar] [CrossRef]
32. Luninski Y, Barnea D, Taitel Y. Film thickness in horizontal annular flow. Can J Chem Eng. 1983;61:621–6. doi:10.1002/cjce.v61:5. [Google Scholar] [CrossRef]
Cite This Article
 Copyright © 2024 The Author(s). Published by Tech Science Press.
This work is licensed under a Creative Commons Attribution 4.0 International License , which permits unrestricted use, distribution, and reproduction in any medium, provided the original work is properly cited.
 Downloads
 Citation Tools