
 Submit a Paper
 Propose a Special lssue
 Open Access
ARTICLE

Influence of Surface Ice Roughness on the Aerodynamic Performance of Wind Turbines
1 School of New Energy, Shenyang Engineering College, Shenyang, 110136, China
2 Shenyang Key Laboratory Clean Energy Fine Comprehensive Utilization and Scheduling Energy Storage, Shenyang, 110136, China
* Corresponding Authors: Xin Guan. Email: ,
(This article belongs to the Special Issue: Advanced Problems in Fluid Mechanics)
Fluid Dynamics & Materials Processing 2024, 20(9), 2029-2043. https://doi.org/10.32604/fdmp.2024.049499
Received 09 January 2024; Accepted 16 May 2024; Issue published 23 August 2024
 View Full Text
 Download PDF
Abstract
The focus of this research was on the equivalent particle roughness height correction required to account for the presence of ice when determining the performances of wind turbines. In particular, two icing processes (frost ice and clear ice) were examined by combining the FENSAP-ICE and FLUENT analysis tools. The ice type on the blade surfaces was predicted by using a multi-time step method. Accordingly, the influence of variations in icing shape and ice surface roughness on the aerodynamic performance of blades during frost ice formation or clear ice formation was investigated. The results indicate that differences in blade surface roughness and heat flux lead to disparities in both ice formation rate and shape between frost ice and clear ice. Clear ice has a greater impact on aerodynamics compared to frost ice, while frost ice is significantly influenced by the roughness of its icy surface.Keywords
Wind energy is one of the most extensively developed renewable energy sources worldwide. However, with the rapid expansion of the global wind power industry, several issues arise during wind turbine operation, including ice accumulation on blades in cold regions. The presence of ice alters not only the aerodynamic profile and surface roughness but also reduces the lift coefficient and hinders blade efficiency in capturing wind energy output. Furthermore, icing can cause blade quality imbalance leading to additional torque on the main shaft that changes natural frequency and reduces operational reliability while potentially triggering resonance between tower and turbine resulting in safety accidents [1].
A considerable number of studies have been conducted in the world on the icing type and aerodynamic performance of wind turbine airfoils, however, limited research has been carried out on the impact of ice surface roughness on the aerodynamic performance of these airfoils. In the study on the effect of icing on the aerodynamic characteristics of blade, Huang et al. [2] put forward the superposition calculation method of icing surface roughness of aircraft airfoil, and analyzed the influence of different ice microscopic characteristic parameters on aircraft wing stall characteristics. Homola et al. [3] focused on the NREL 5MW wind turbine, conducting frost simulations on five-blade sections using CFD methods to analyze the aerodynamic characteristics and performance loss caused by ice-covered airfoil sections. Guo-te et al. [4] predicted wind turbine airfoil icing types based on FENSAP-ICE software, examining changes in airflow field and lift resistance characteristics before and after icing using Fluent. In the study of the blade surface icing process, the icing type and aerodynamic performance of wind airfoil have also been studied. Mo et al. [5] discussed the effects of blade shape, heat load distribution, and energy transfer mode on blade surface icing, based on the energy distribution theory and blade surface temperature rise characteristics. Kong et al. [6] studied the development law of the main external environmental factors such as ambient temperature, incoming flow speed, and water droplets on the surface icing of wind turbine blades. Li et al. [7] used Lagrange method to numerically calculate the collision process between water droplets and blade surface, analyzed the change of flow field during the icing process, and studied the influence of water droplets collision velocity on the physical process of icing. Ibrahim et al. [8] utilized FENSAP-ICE software to investigate liquid water content and temperature as sensitive factors, analyzing their effects on icing speed and aerodynamic performance of wind turbine blades.
In summary, many scholars have conducted extensive research on the icing process of airfoil and the influence of blade icing on its aerodynamic characteristics. In the icing process of wind turbine blades, studies mainly focus on the influence of external environmental factors (such as temperature, humidity, and water drop impact) on the formation of ice coating. However, considering the influence of surface roughness on secondary ice formation after blade surface icing. In addition, the research on the effect of blade shape change after ice solidification on the aerodynamic characteristics of wind turbine blades, especially the effect of ice surface roughness on the aerodynamic performance of wind turbine airfoils is very limited. Therefore, based on the actual working conditions of wind farms and considering the impact of water droplet impact reflux, this paper puts forward the analysis and calculation of the icing mechanism based on frost ice and clear ice, in order to study the change of airfoil surface roughness during the icing process, predict the type of ice formation, and then discuss how the change of ice roughness affects the aerodynamic performance of airfoil. It is designed to improve the energy output in the high cold area and ensure the safe operation of the equipment [9–13]. This paper presents an analysis and calculation based on the frosting ice and clear ice icing mechanisms to investigate the variation in airfoil surface roughness during the icing process, predict ice formation types, and subsequently explore how changes in ice roughness affect airfoil aerodynamic performance. The present study employs the software FLUENT and FENSAP-ICE to conduct an analysis on the aerodynamic performance of offshore wind turbine blades under icing conditions in cold regions. The ice growth process is simulated through iterative calculations and ice shape reconstruction, thereby establishing a model for wind turbine blade ice growth and examining the impact of different wind speeds on such growth. Furthermore, this research investigates the effects of various types of icing on the aerodynamic performance of wind turbine blades in cold offshore areas. The findings from this study hold practical engineering significance for enhancing control over wind turbine operation reliability and power generation efficiency in future endeavors.
2.1 Blade Flow Field Calculation
The mathematical model of the blade flow field is formulated based on the principles of mass, momentum, and energy conservation, resulting in a nonlinear partial differential equation governing the blade flow field.
where,
The blade surface roughness model is based on the equivalent particle roughness height model, and its impact on icing primarily lies in the correlation between the convective heat transfer coefficient of a rough surface and the ice growth process on the blade surface. However, since the equivalent particle roughness height model is only applicable to numerical analysis of single airfoils, this study focuses on investigating wind turbine blades as a whole. Therefore, we have made two revisions to the original roughness mathematical model, resulting in a refined mathematical model [14,15].
Including
2.2 Calculation of Water Droplet Trajectory
The droplet motion trajectory was solved using the DROP3D module in FENSAP-ICE software, while the Eulerian gas-liquid two-phase control equation was solved using the finite volume method. The continuous equation and momentum equation were as follows:
where,
The blade surface thermodynamic model was solved through numerical calculation using the Bourgault icing model in the ICE3D module. The mass conservation equation and energy conservation equation in formulas (1) and (3) were employed for this purpose. The modified mass conservation equation in formula (1) is as follows:
In the mathematical equation,
The energy conservation equation in formula (3) has been revised.
where,
3 Verification of Icing Calculation and Analysis Methods
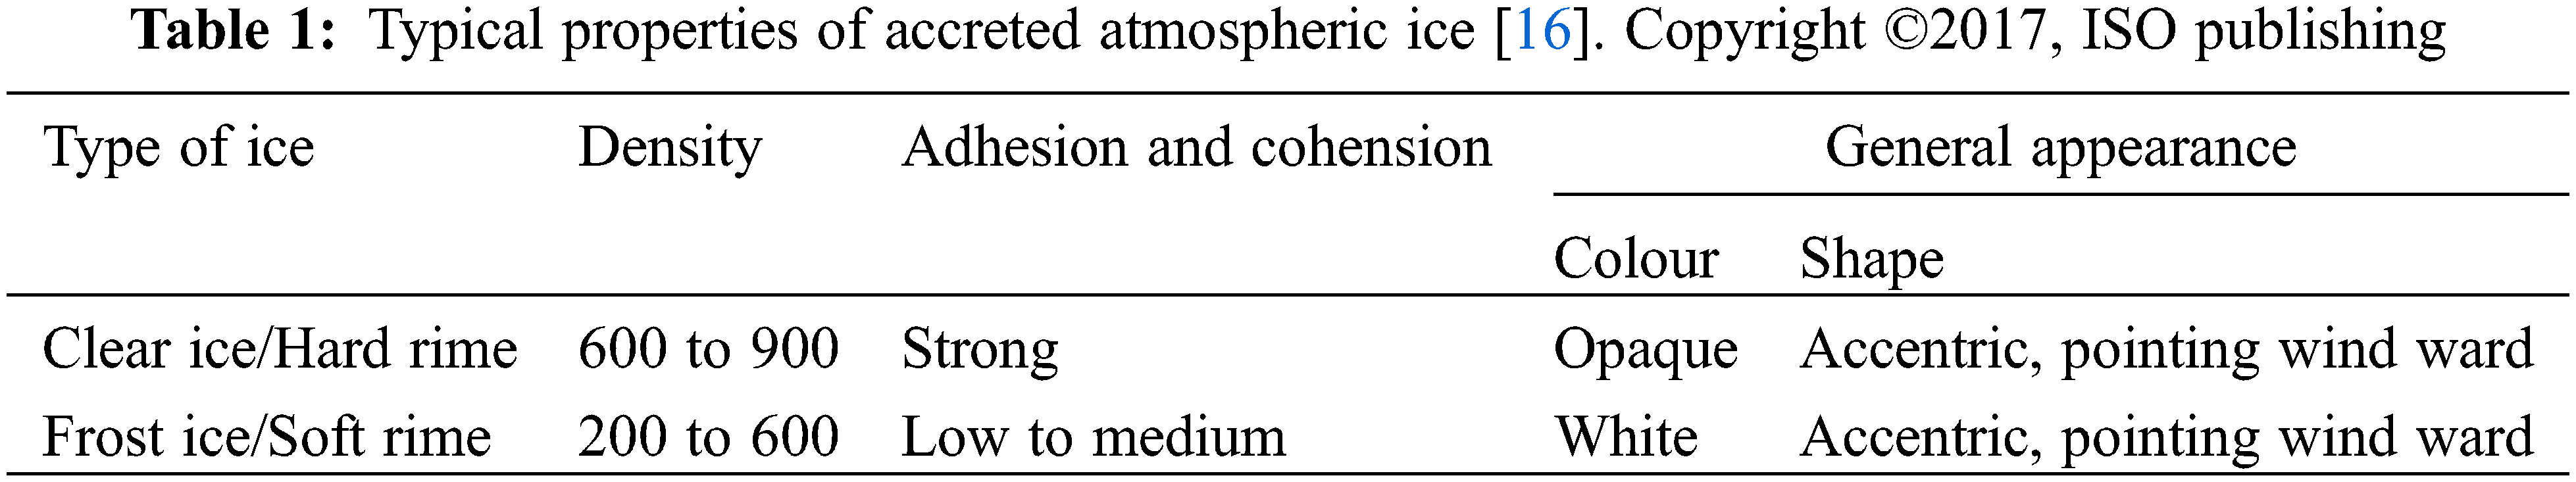
Using the NACA0012 airfoil as the verification object, this study selects two sets of test results for comparative analysis, and ice type is calculated according to “ISO 12494 Atmospheric icing of structures” [16] and the characteristics of wind turbine icing in cold areas of our country. The specific parameters of frost ice and clear ice are shown in Table 1. The NACA0012 airfoil features a base chord length of 3600 mm, a tip chord length of 1500 mm, and a leading edge sweep angle of 5 degrees. This particular type of airfoil incorporates a robust spar, fin, and skin structure to ensure the necessary strength and stiffness required for optimal performance in fluid dynamics applications such as wind turbines.
The calculation conditions from the literature [17] are adopted, with an airfoil chord length of 0.5334 m, angle of attack of 4°, total air pressure of 1.01325 × 10⁵ Pa, inflow velocity of 67 m/s, temperatures of −26.11°C and −2.22°C respectively, liquid water content of 1.0 g/m3, droplet diameter of 20 μm, and freezing time of 360 s. For numerical analysis in this study, both single-time step and multiple-time step methods are employed for freezing simulation calculations to compare against the experimental results obtained. Fig. 1 presents a comparison chart between calculated data using the single-time-step method and multiple-time-step method with measured data during the formation process of clear ice and frost ice.
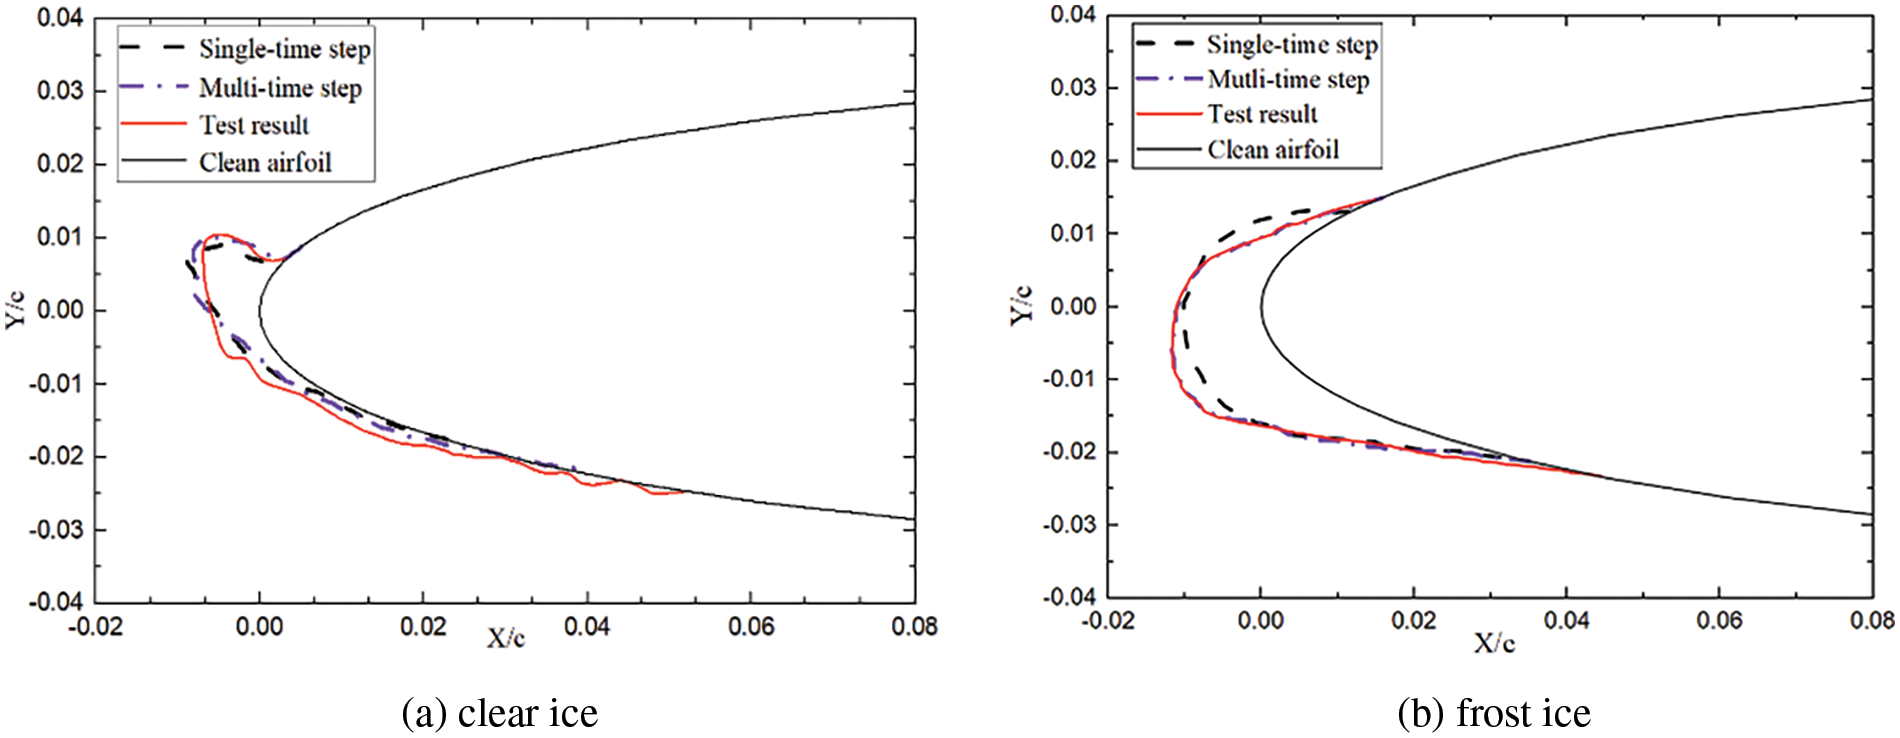
Figure 1: Comparison analysis of calculated results and experimental results for multi-time step and single-time step ice types
As depicted in Fig. 1 through comparative analysis, both the single-time step method and the multi-time step method were employed to analyze clear ice formation. Upon comparing the calculated data with experimental results, it was observed that these two methods exhibited similar calculation accuracy, with relative deviations of less than 5%. However, when investigating frost ice formation, the multi-time step method demonstrated significantly superior accuracy in analyzing and calculating results compared to the single time step method. The relative deviation between calculated data using the multi-time step method and experimental data was less than 8%, indicating a close agreement between calculation results and experimental findings. Therefore, this paper adopts the multi-time step method for related research during analysis and computation.
4.1 Grid Independence Verification
According to the literature [18,19], The icing is predominantly concentrated in the leading edge area of the blade airfoil, accounting for 95% to 100% of its coverage. This localized icing has a significant impact on the overall aerodynamic performance of the blade. The rotation process of wind turbine blades generates centrifugal force, which, combined with the inertial force acting on the blades, causes water droplets to move towards the blade tip after impact. However, due to this deviation from the flow line trajectory, ice formation occurs on both the tip and leading edge of the blades. The thickness of ice accumulation increases with higher wind speeds primarily because of an increasing local water collection coefficient on the blade surface. Nevertheless, when the amount of collected water droplets at the tip and leading edge exceeds their freezable capacity, unfrozen water droplets exhibit characteristics of a flowing film resulting in the gradual expansion of frozen areas on the blade surface as depicted in Fig. 2. The research subject of this study is a 5 MW wind turbine blade located in Zhangdong Wind Farm, while the focus of analysis is the representative airfoil positioned at 70% wingspan distance from the blade root along the wingspan direction. The selected airfoil is NACA0012 with a chord length of 2130 mm.
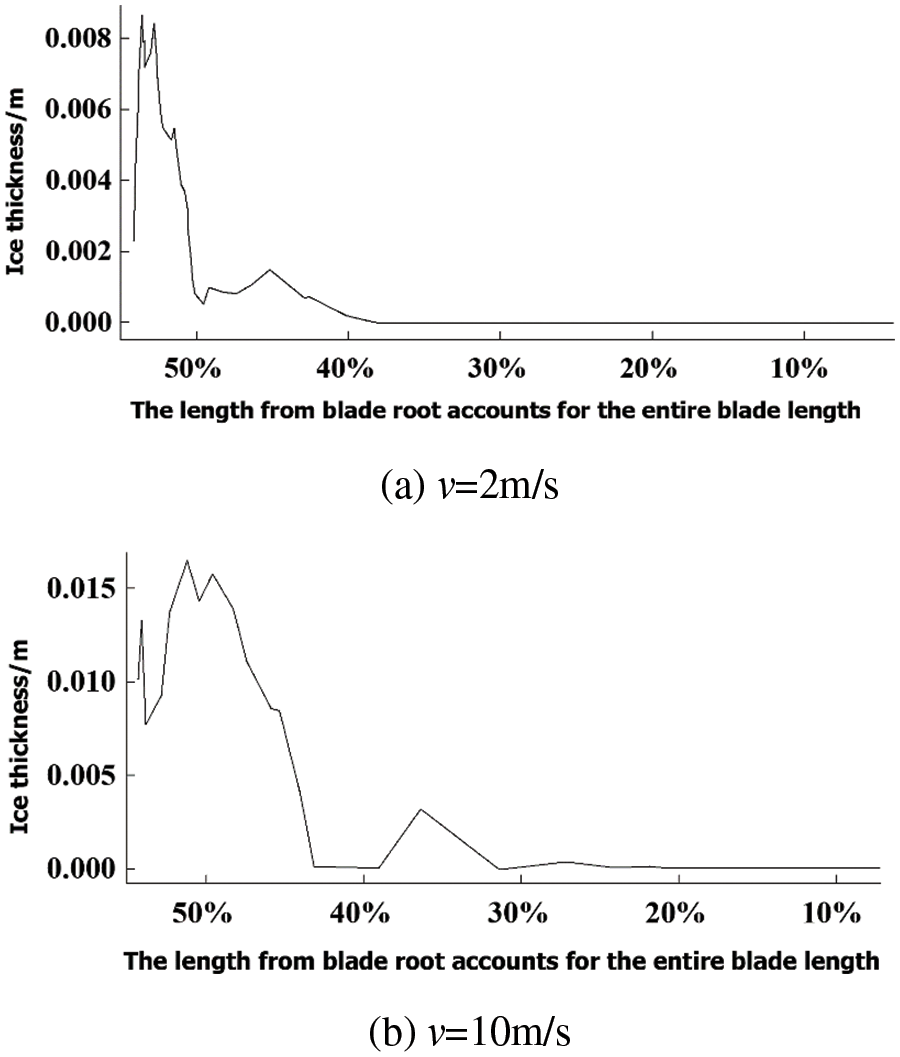
Figure 2: Ice thickness distribution in blade at different wind speeds
The 2D computational flow field is established, and the structured grid division of the computational domain is performed using ICEM. A no-slip condition is applied to the fixed wall of the airfoil. The fluid domain grid division is illustrated in Fig. 3, employing a quadrilateral grid scheme.
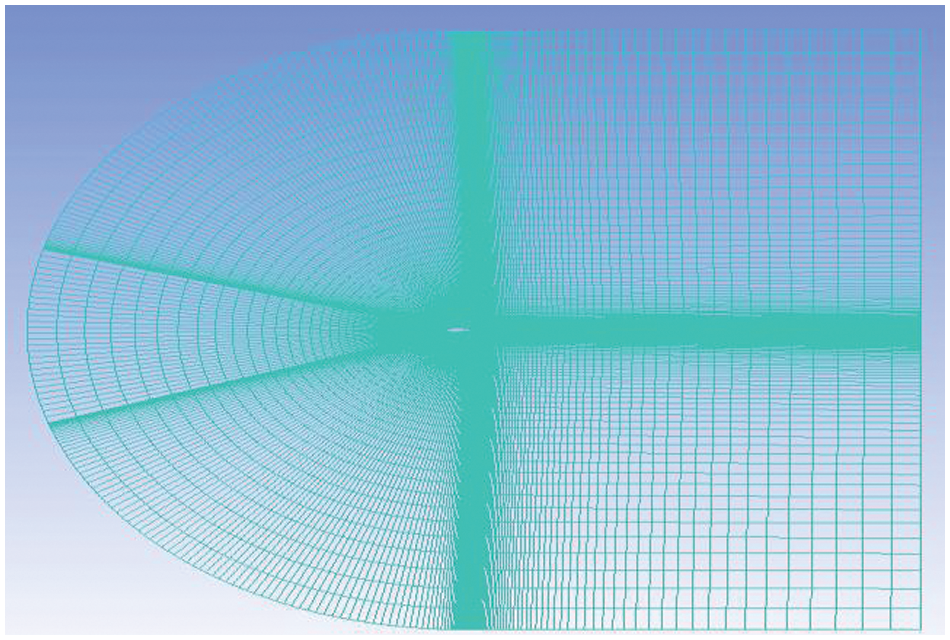
Figure 3: Airfoil mesh division
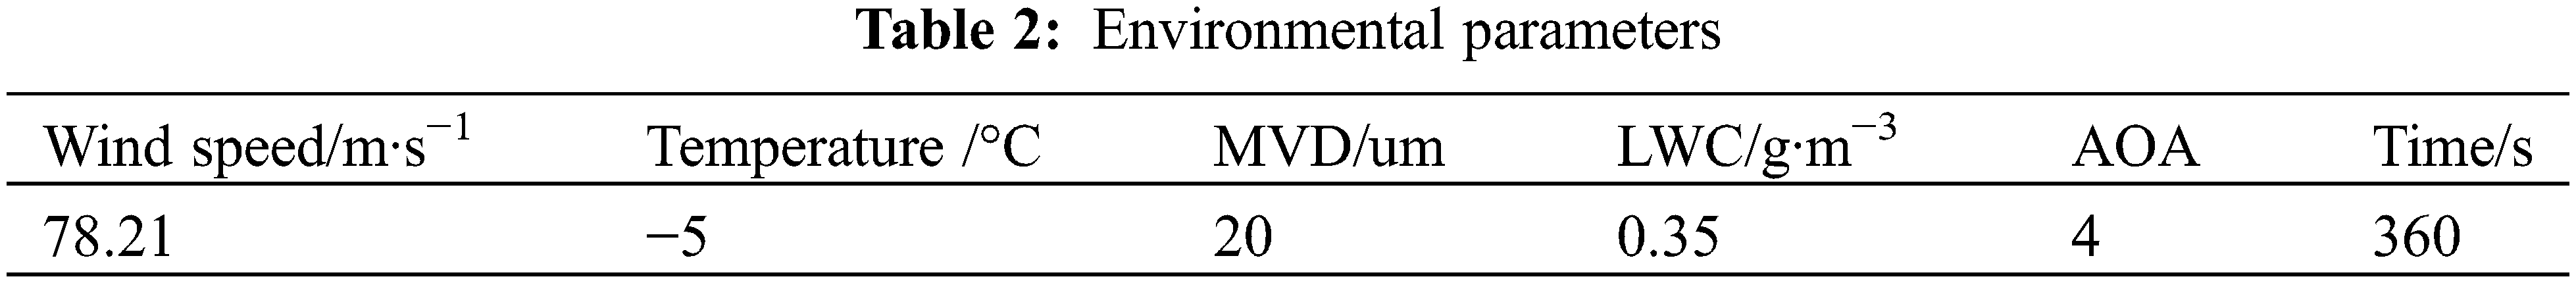
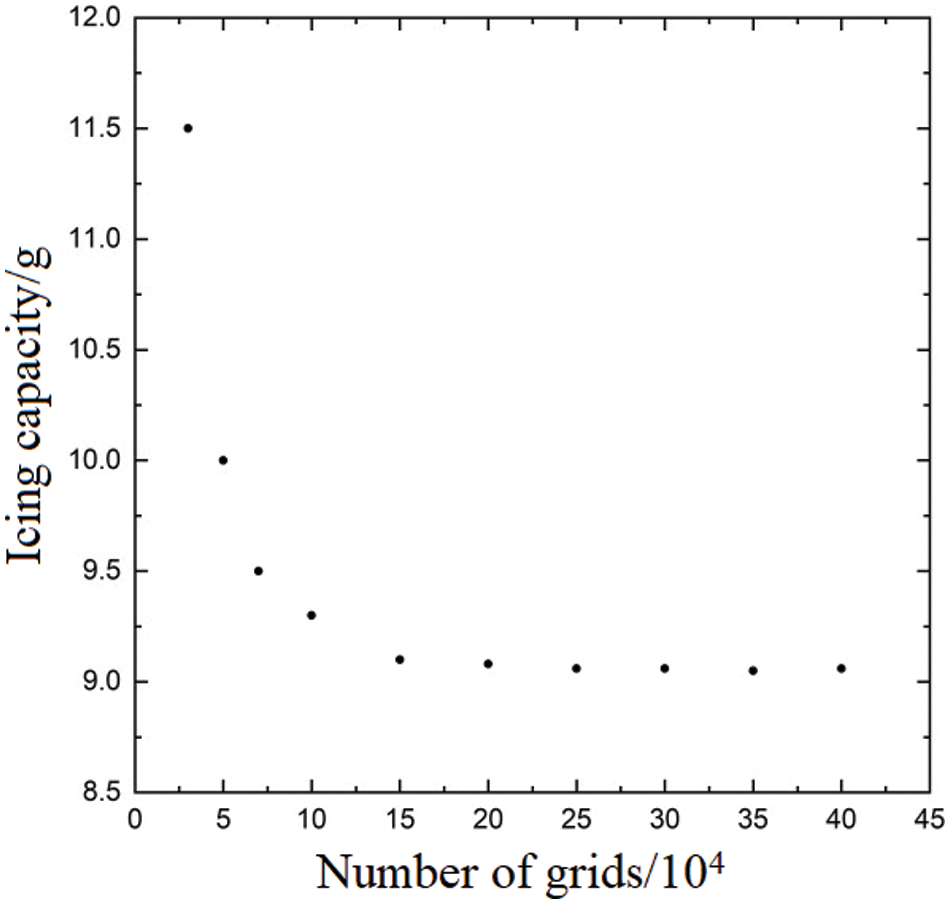
Figure 4: Relationship between the number of grids and the amount of ice formation
4.2 Analysis of Icing Pattern of Airfoil
The calculation of the air phase must precede that of the water phase. The numerical method for the air phase involves using a steady-state pressure-based solver and implementing the SIMPLE algorithm with second-order upwind style for the solution. The turbulence model utilized is the
(1) Water droplet impact characteristics and ice mass distribution
The analysis of droplet collision efficiency under different time intervals reveals a decrease in efficiency with increasing condensation time during the formation of frost ice and clear ice on the airfoil. Fig. 5 illustrates the variation in droplet collision efficiency at different time intervals during the formation of clear ice and frost ice. As depicted in the figure, initial freezing stages exhibit high droplet collision efficiency. However, as the ice gradually forms and alters the external shape of the airfoil, there is a narrowing of the droplet contact area accompanied by a reduction in impact angle, leading to a gradual decline in droplet collision efficiency. Notably, due to its high initial efficiency at the leading edge, significant accumulation of ice occurs in this region.
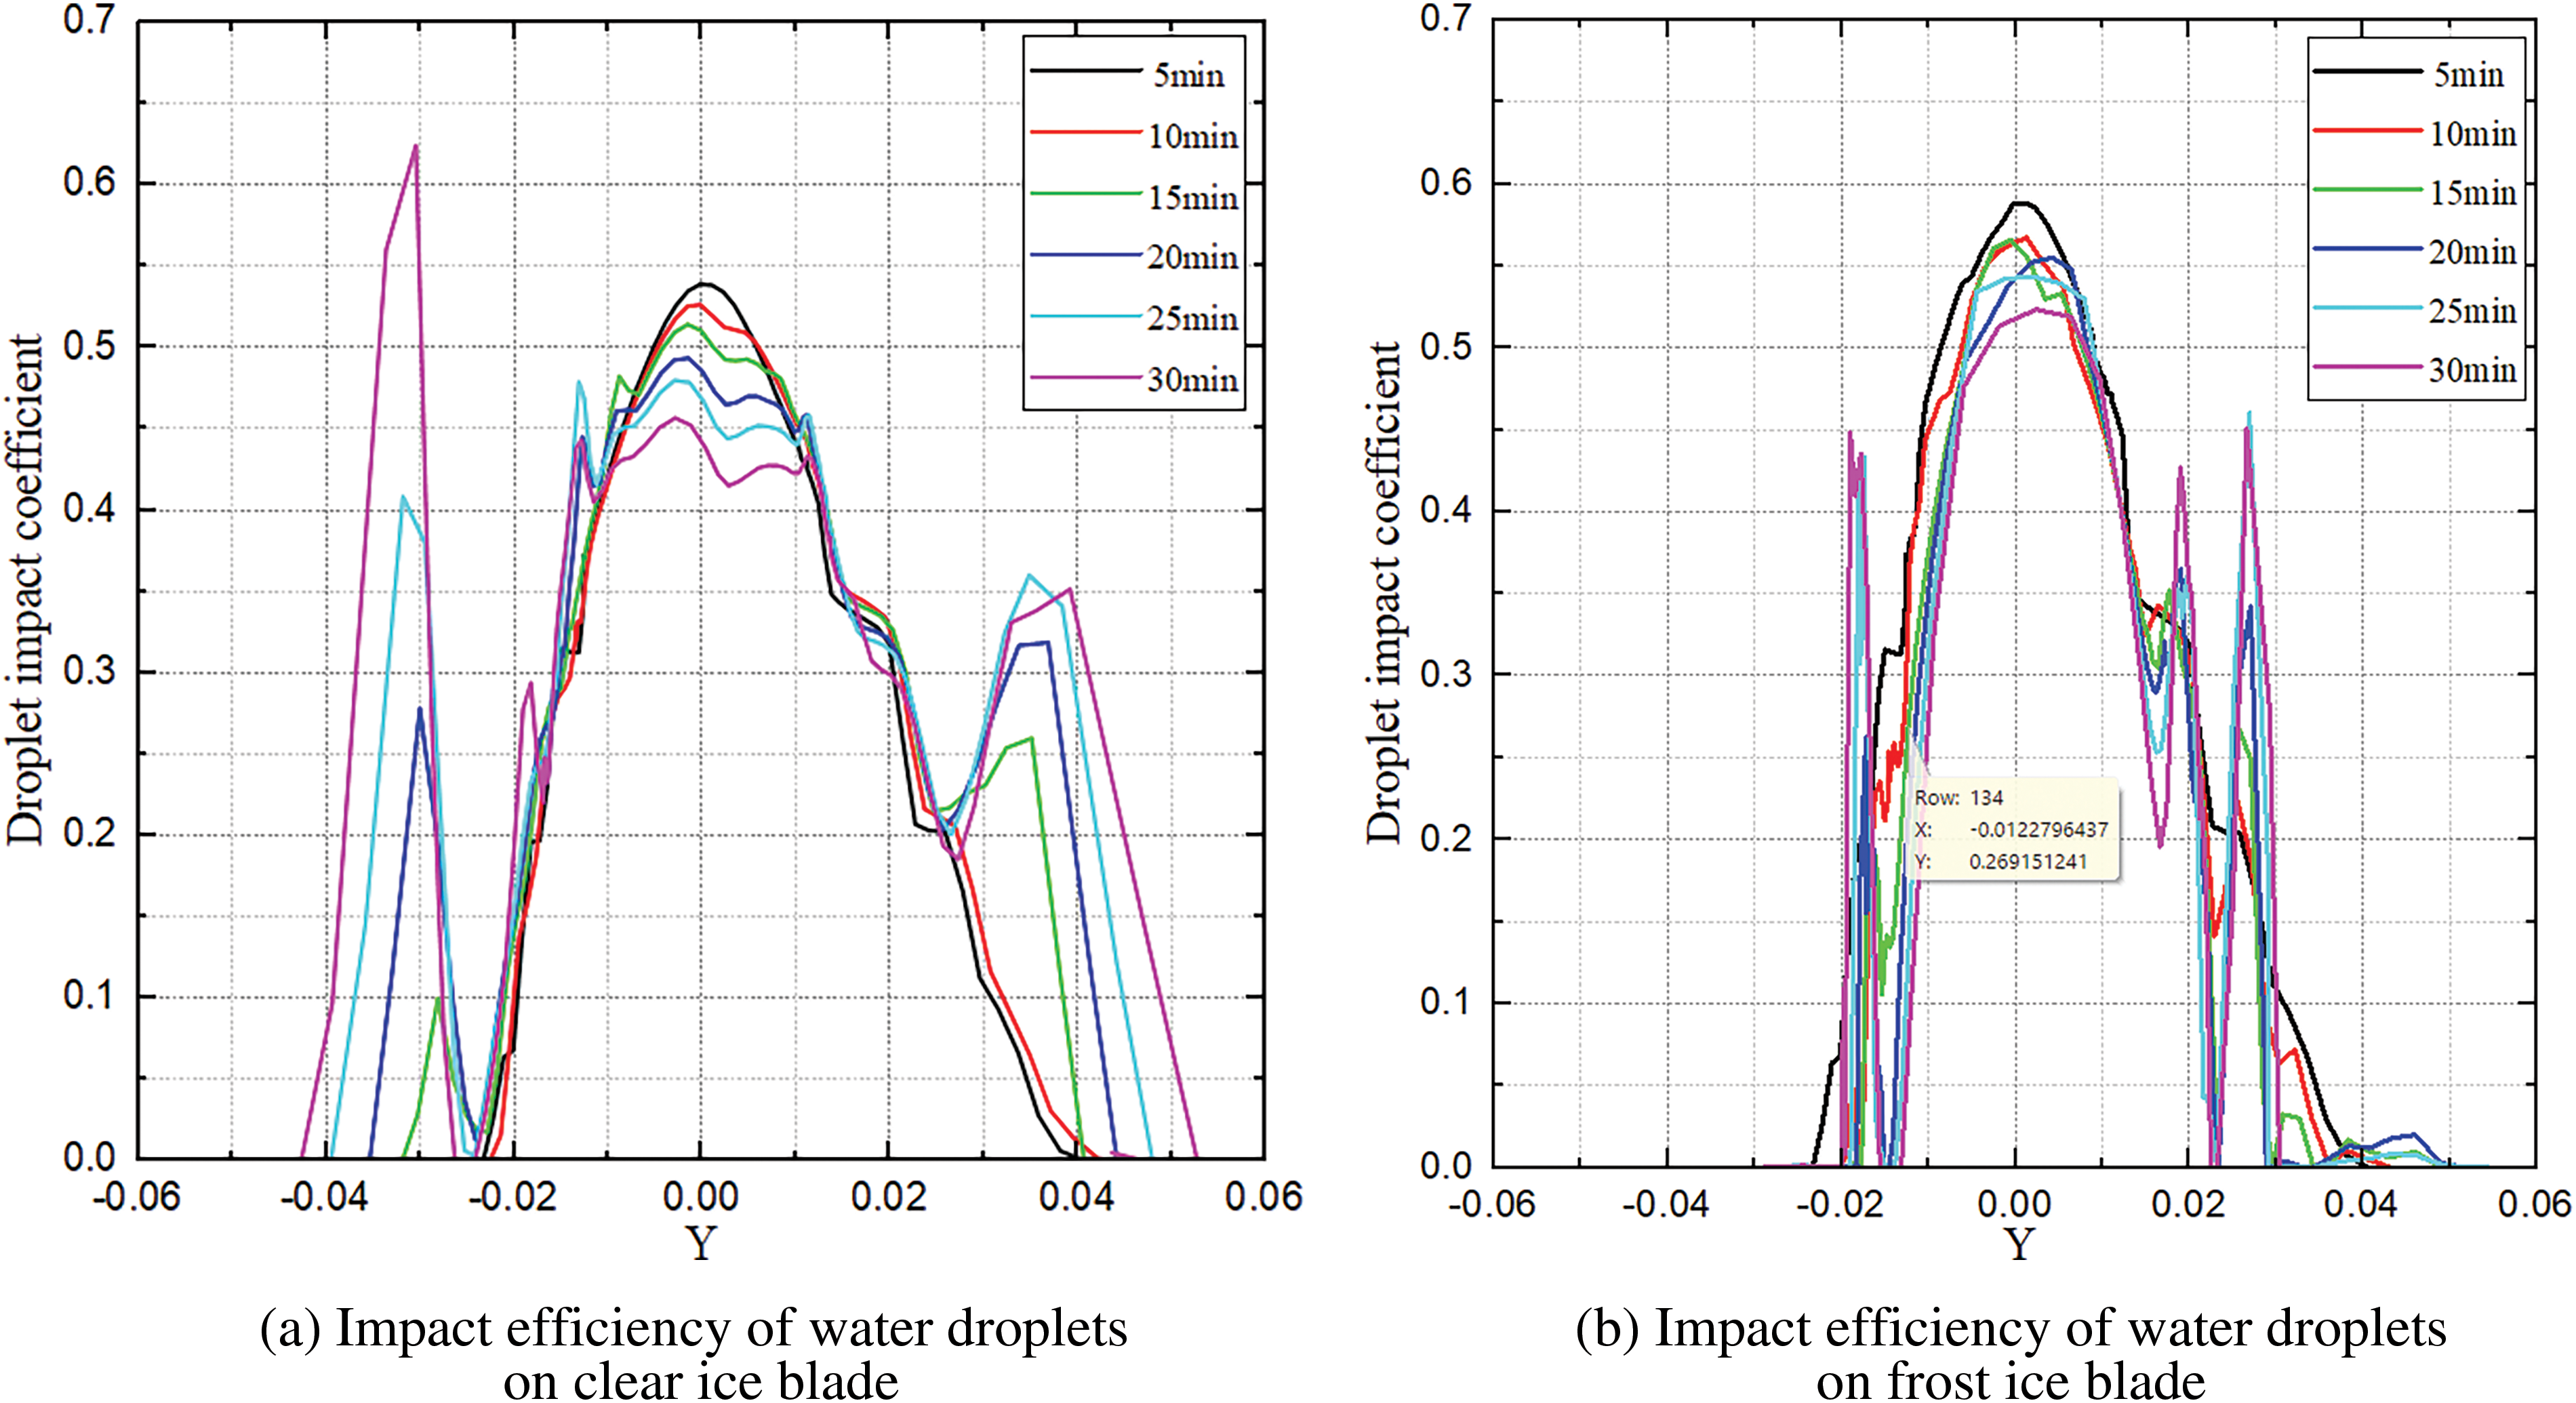
Figure 5: Comparative analysis of droplet impact efficiency on blades with frost ice and clear ice
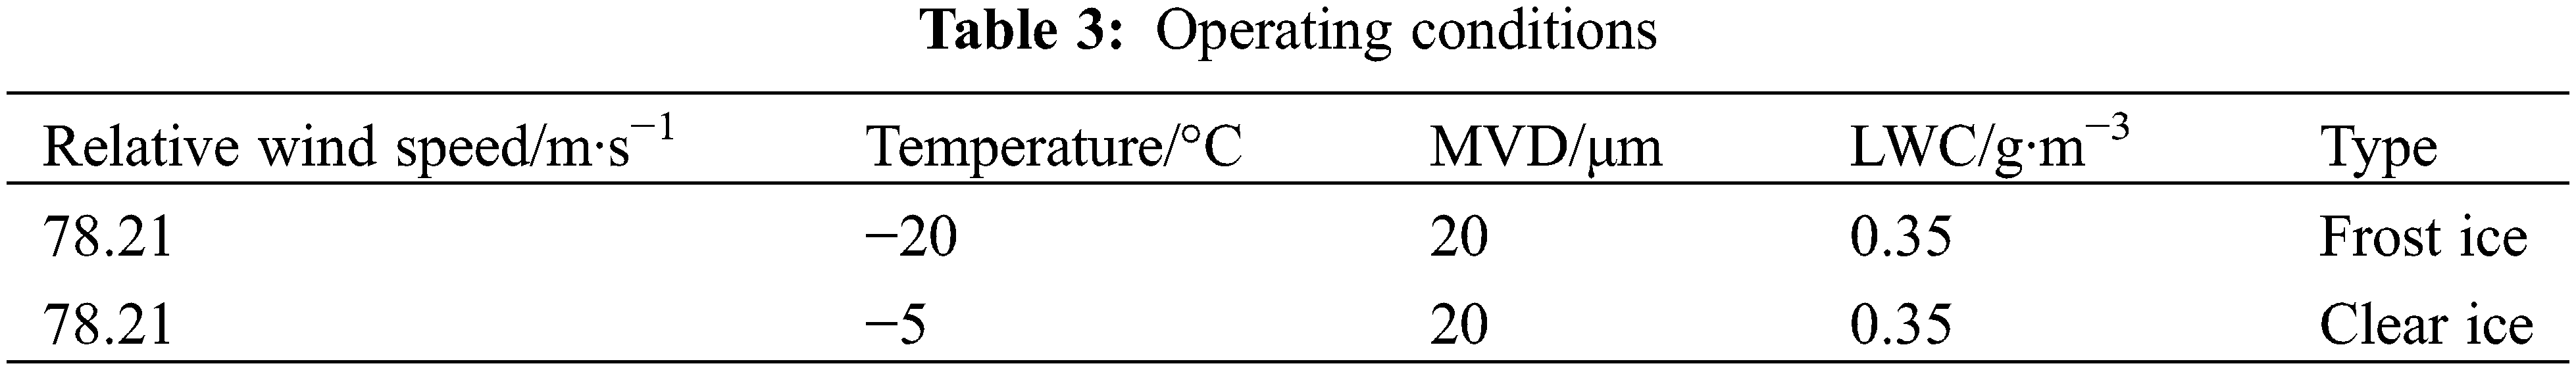
(2) Icing type
In the formation of clear ice, due to the elevated ambient temperature, not all liquid water droplets in the air immediately coagulate upon impact with the blade surface. Furthermore, a small amount of water droplets will reflow along the upper and lower arcs of the airfoil under the combined action of centrifugal force from blade rotation and aerodynamic force from flow field. During this process, uncondensed water droplets gradually begin to coagulate. Additionally, wind rotor rotation increases airflow velocity on the outer surface of the blade, intensifying heat loss from these droplets. Insufficient time for coagulation occurs when these droplets collide with the blade surface and subsequent impacts lead to accumulation along upper and lower arcs of airfoil forming a thin water film. The thickness and distribution pattern of this film further promote clear ice shape formation while enhancing complexity at the leading edge of airfoil where angular ice is present (Fig. 6 illustrates changes in water film thickness during freezing process on clear ice surface). In this Fig. 6, axis X represents direction along chord line originating from stationary point at leading edge; axis Y represents direction perpendicular to chord line originating from stationary point at leading edge (i.e., perpendicular to axis X).
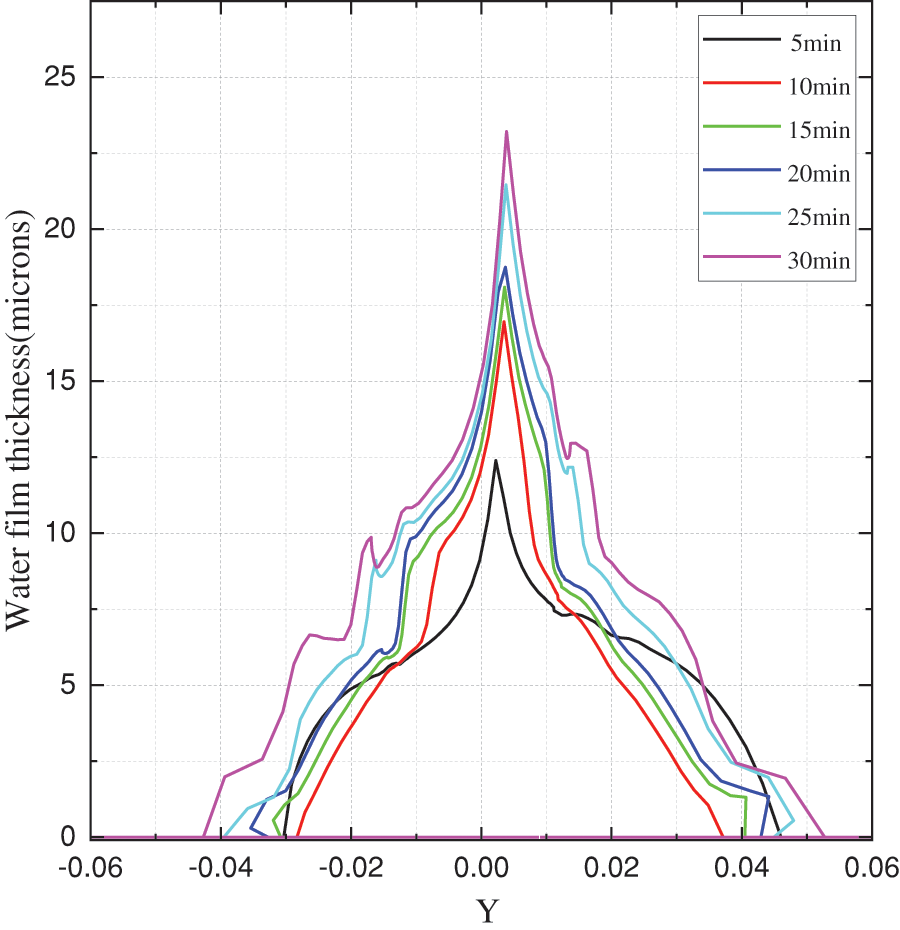
Figure 6: Variation in water film thickness on the surface of clear ice during airfoil icing process
Uncondensed water flows from windward stationary point towards both sides of leading edge and trailing edge of airfoil, resulting in angular ice formation as depicted in Fig. 7a. The shape of frost ice observed in Fig. 7b exhibits regular and streamlined characteristics. This can be attributed to the low atmospheric freezing temperature during frost ice formation, causing immediate freezing of liquid water upon contact with the blade surface. As a result, the freezing rate of water droplets reaches 100%, eliminating any possibility of condensed water reflow and ensuring the consistent regular and streamlined shape of frost ice.
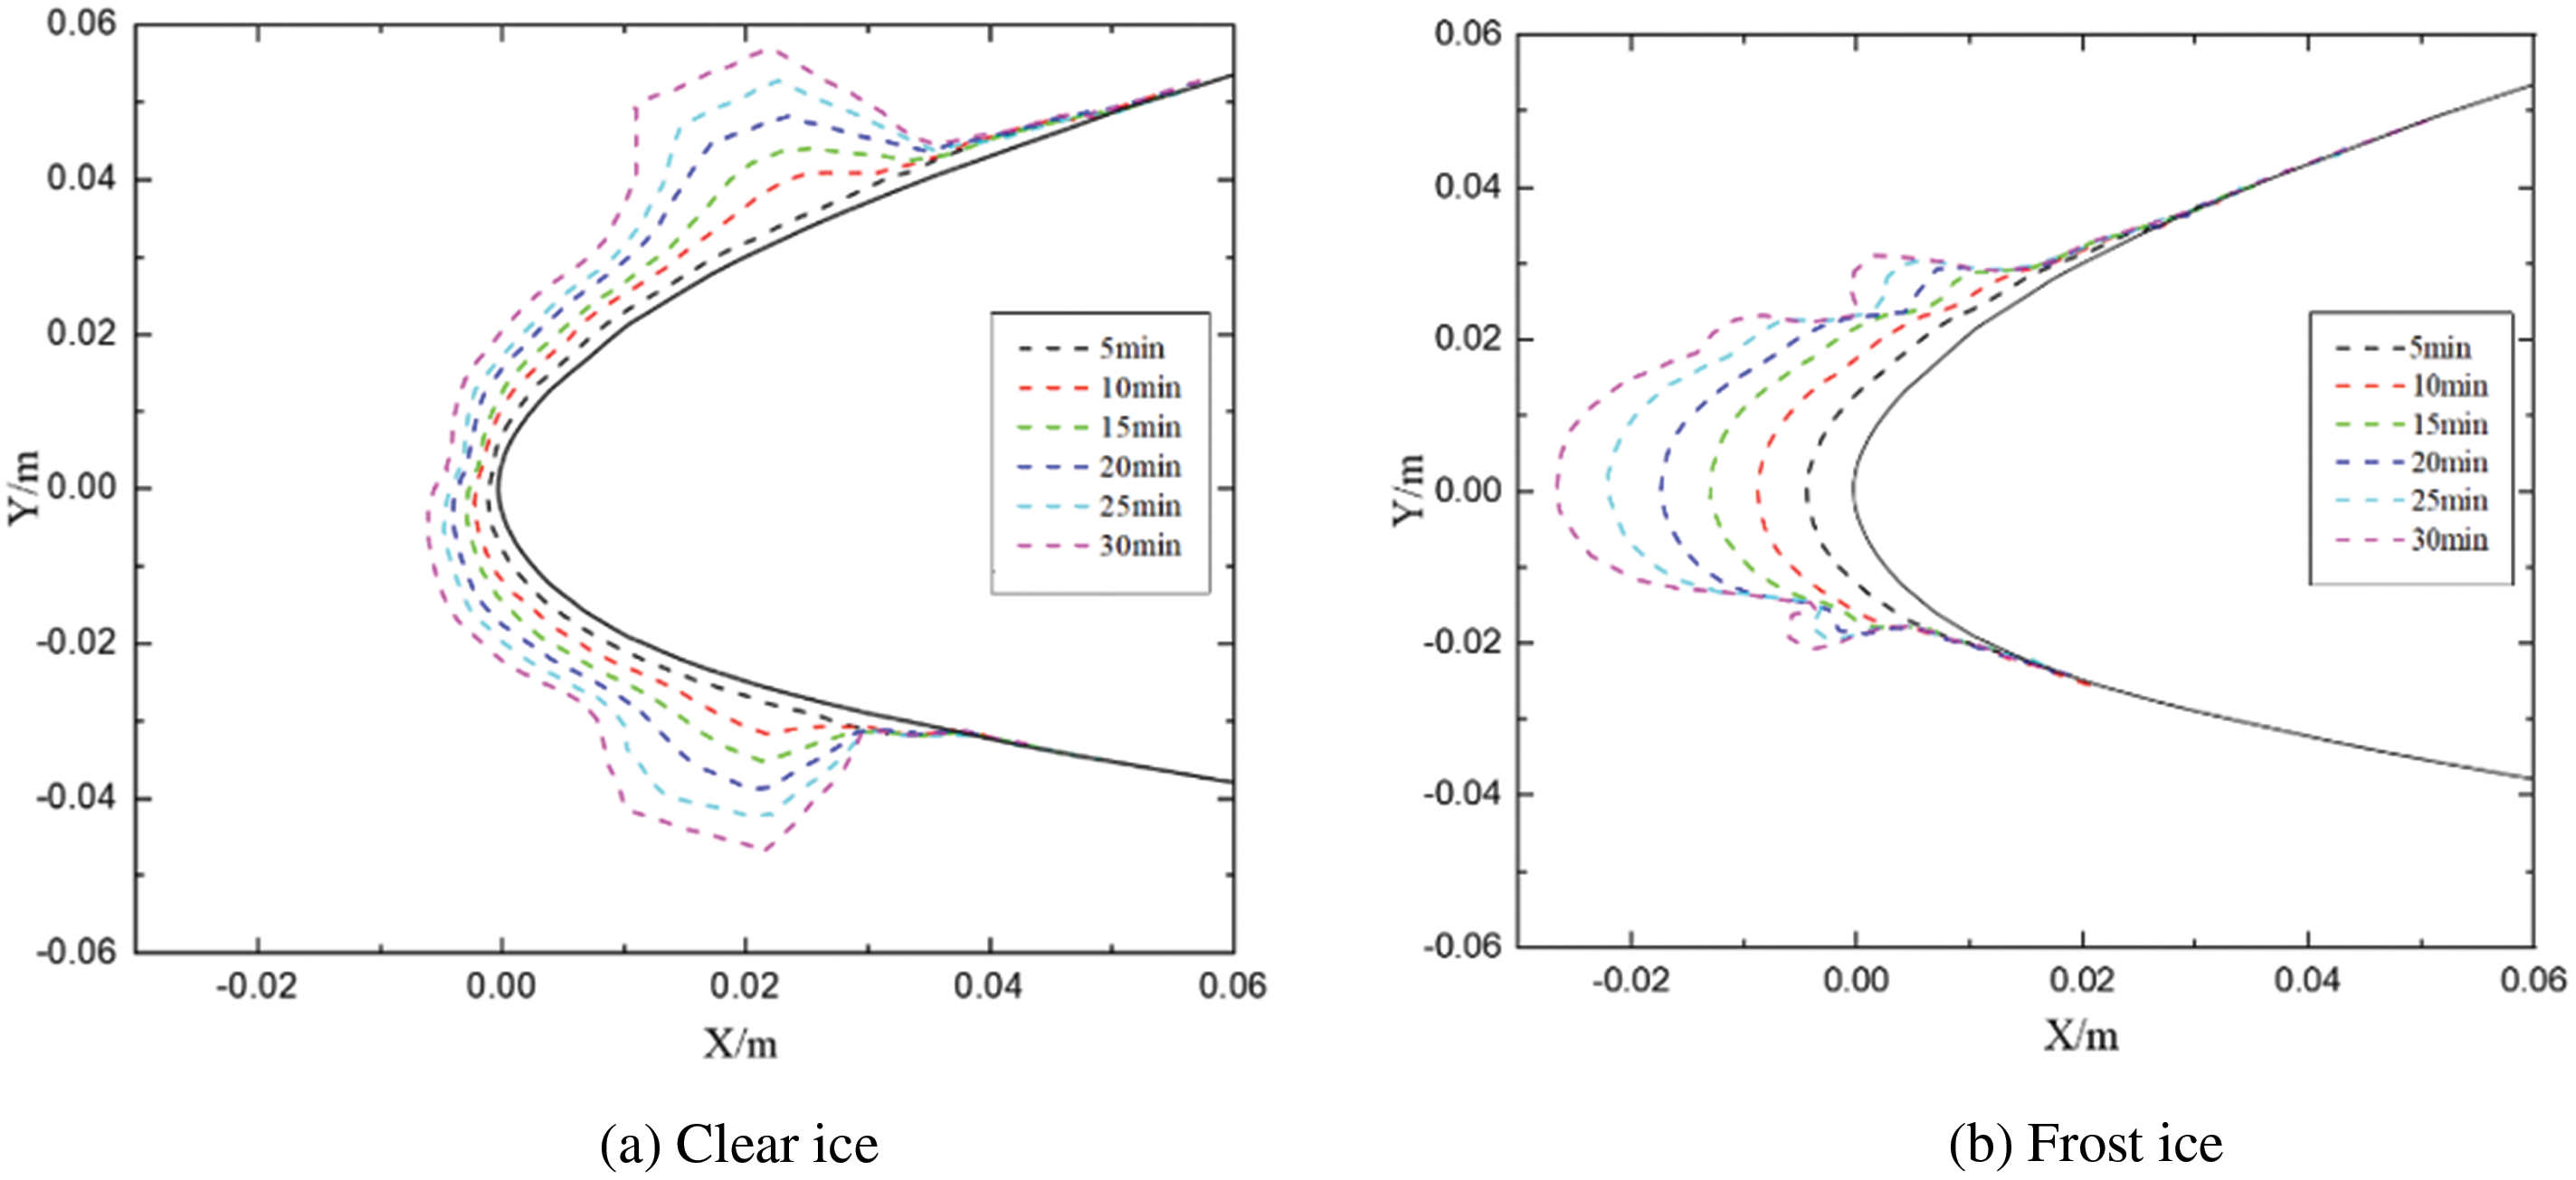
Figure 7: Shapes comparison of ice accumulation under clear ice and frost ice conditions
(3) Ice surface roughness and heat transfer coefficient
To enhance the study of physical characteristics and synthesis rate of frost ice and clear ice formation, the icing surface roughness is selected as a sensitive factor in the calculation process of icing research to analyze variations in blade surface roughness and heat transfer characteristics at each time step during icing. The surface roughness of each ice type is calculated using Eq. (4) after correction by the surface roughness ks. Through calculations, it was found that both frost ice and clear ice have similar surface roughness values, approximately 5 × 10⁻⁴ m. Therefore, for sensitivity analysis, the initial value of icing surface roughness is set as a random distribution around this mean value. During cold climate operation conditions on wind turbine blades, changes in blade surface roughness occur which affect shear stress and heat flux on the blade’s surface leading to variations in boundary layer thickness and convective heat transfer coefficient. Convective heat transfer directly influences icing growth mode, type, growth rate, and freezing coefficient on the blade’s surface. Figs. 8 and 9 illustrate variations in blade surface roughness and heat flux during condensation processes for two types of ice.
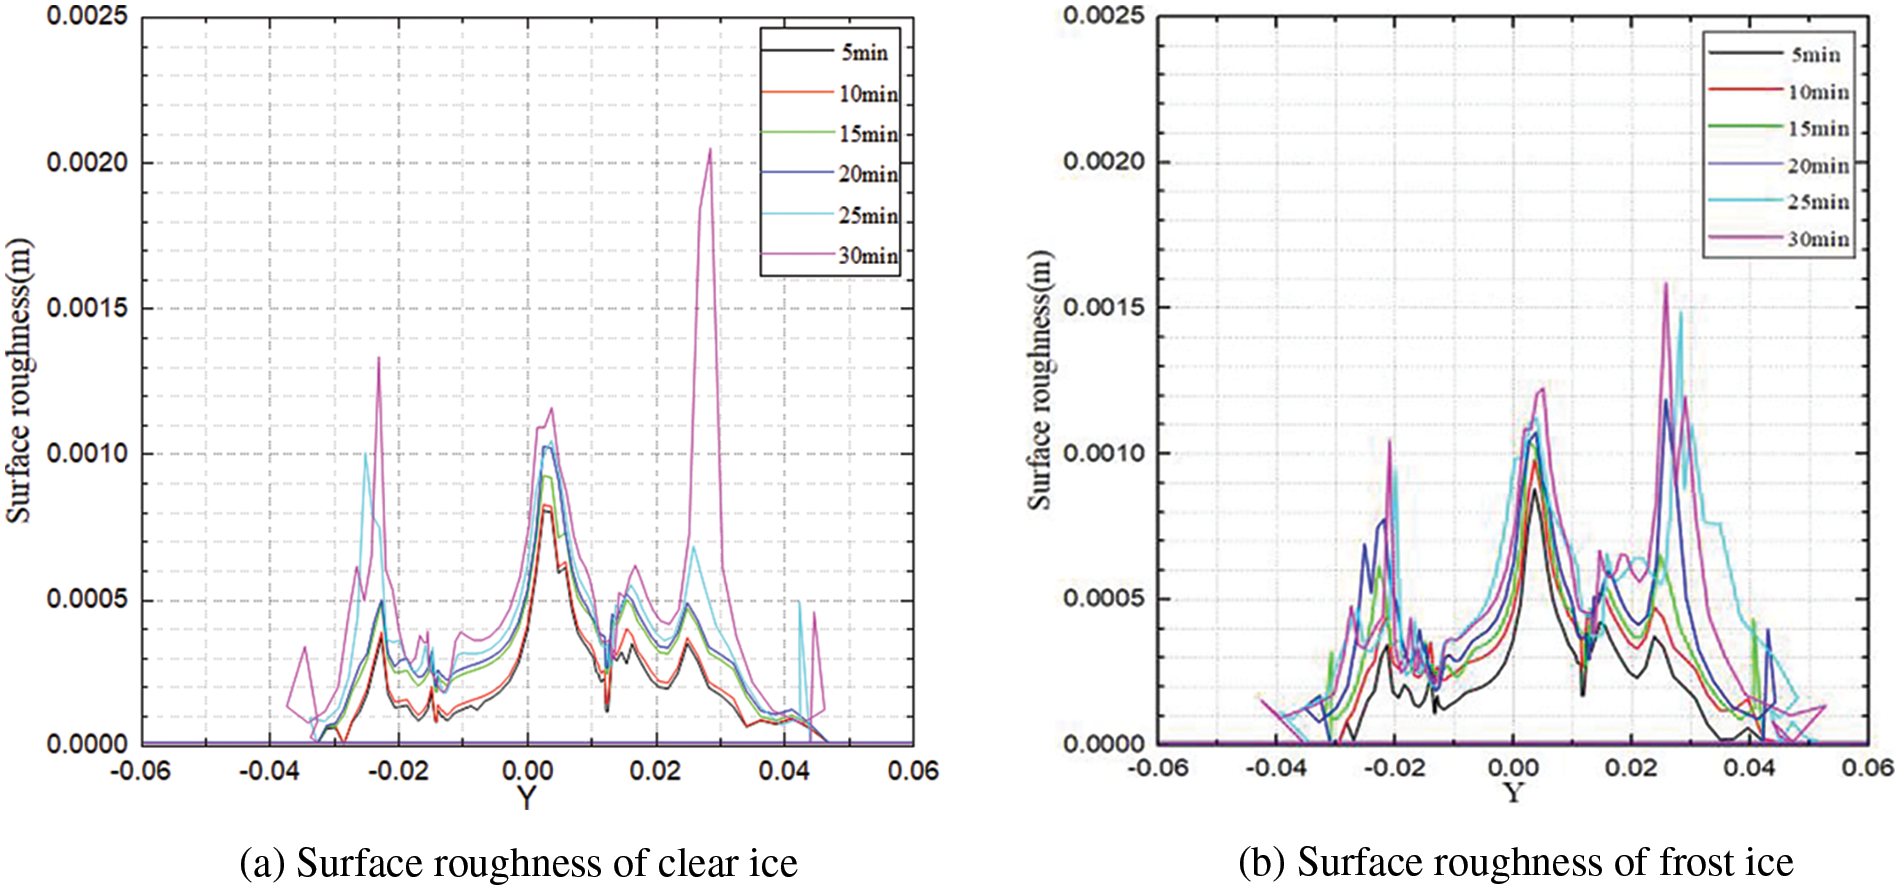
Figure 8: Variation of surface roughness height during icing
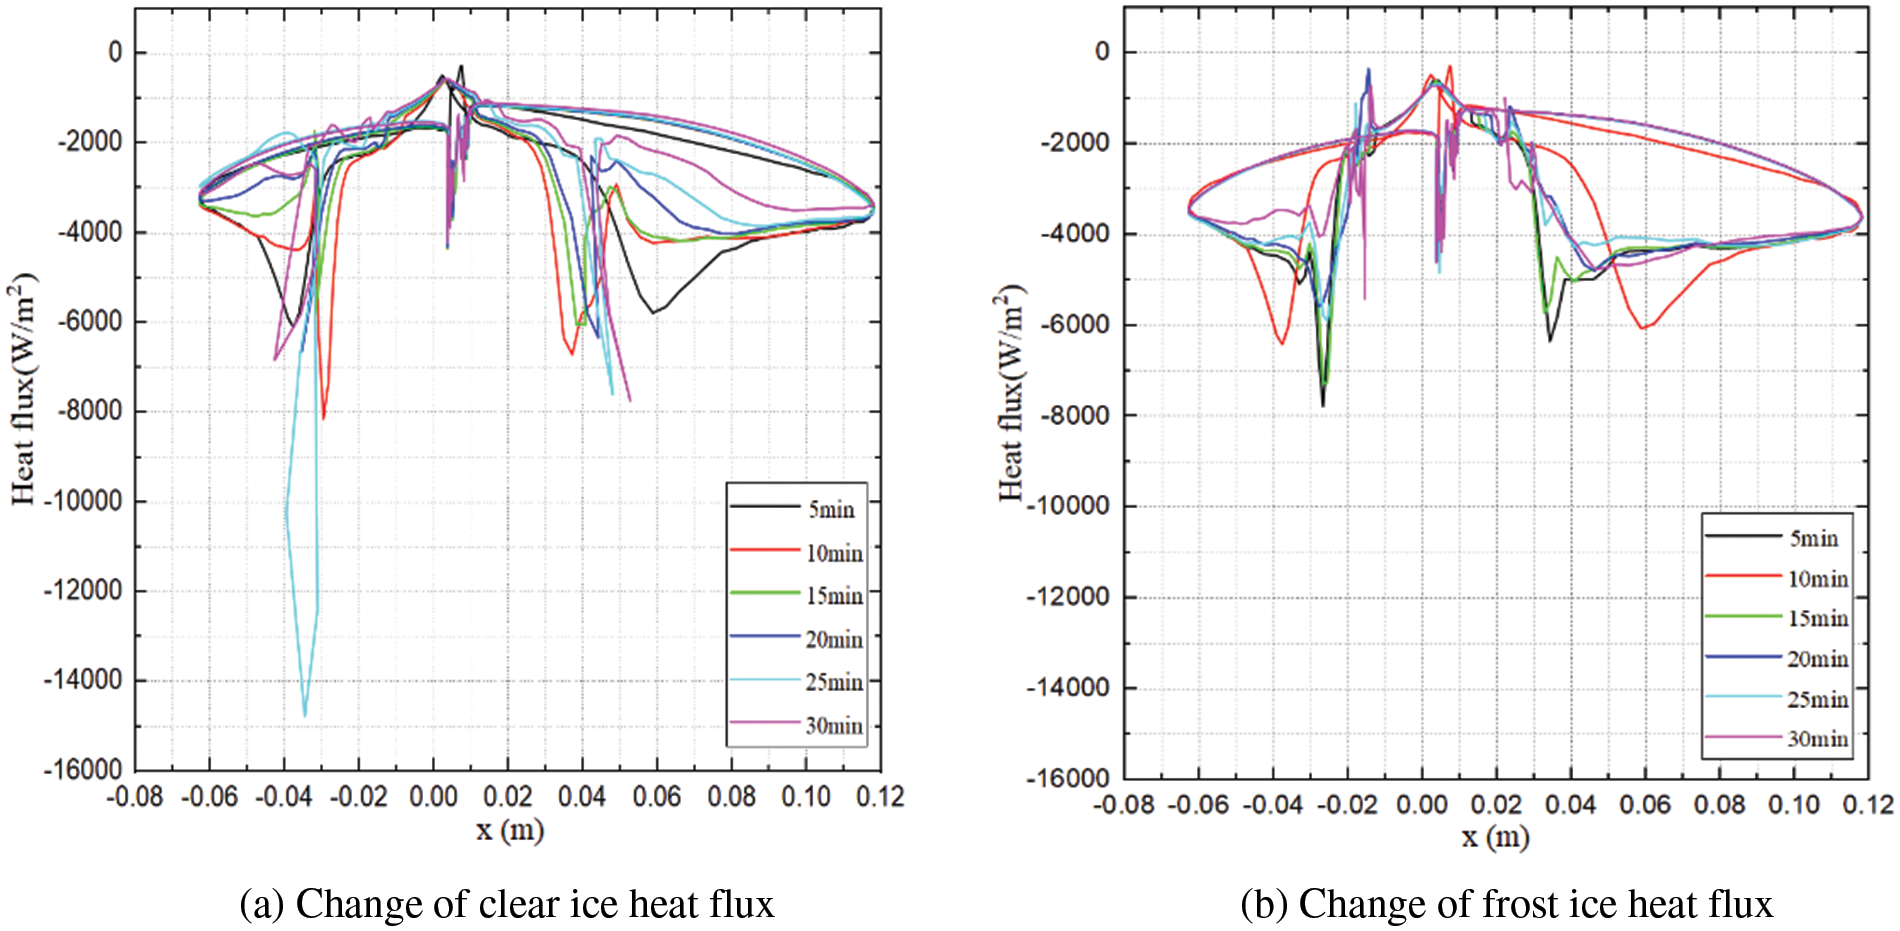
Figure 9: Change in heat flux during icing
Figs. 8 and 9 demonstrate that an increase in freezing time leads to elevated blade surface roughness and heat flux under both freezing conditions. Fig. 8 reveals that after the formation of clear ice and frost ice, the surface roughness of the airfoil’s leading edge increases, with the maximum point of roughness not occurring at the stationary point of the airfoil. This phenomenon primarily arises from water droplets colliding with the leading edge during freezing, resulting in a polishing effect due to their impact force, thereby reducing surface roughness. Fig. 9 illustrates that the highest convective heat transfer coefficient is observed in the leading edge region of the airfoil, while different areas exhibit corresponding changes in blade surface roughness and convective heat transfer coefficient; specifically, an increase in surface roughness corresponds to an increase in convective heat transfer coefficient.
4.3 Influence of Ice Profile Roughness on Aerodynamic Output Effect of Frozen Airfoil
According to the two ice geometry types calculated in Fig. 6, an analysis was conducted on the lift and drag characteristics of frost ice airfoil, clear ice airfoil, and clear/smooth airfoil individually. Furthermore, the variation patterns of roughness and lift and drag coefficients were investigated under multiple angles of attack (−5°~15°).
(1) Influence of ice surface roughness on the aerodynamic performance of frost-ice airfoil
The variation curves of the lift drag coefficient of a frosted airfoil with different ice roughness, along with the angle of attack, are depicted in Fig. 10. When the temperature and humidity of the wind turbine blade are suitable, the surface of the wind turbine blade will form tiny holes, which will lead to an increase in the surface roughness of the blade. Because of the existence of holes, the viscous force of the blade surface will increase. In the model calculation, the geometry of small protrusions and depressions in 2D airfoil modeling will be increased, and the viscosity coefficient at this location will be improved when the boundary conditions are set. The flow field around the clean ice body is treated by this method. In order to clearly distinguish the influence degree of blade surface roughness on the lift coefficient, when calculating the lift coefficient of ice-covered wind turbine blade, the fluid in the flow field is calculated as an ideal fluid, and the velocity direction of the inlet fluid is ensured to be consistent with the angle of the chord length of the blade airfoil (angle of attack), that is, the changing trend of blade surface roughness on the aerodynamic characteristics of the blade can be clearly obtained.
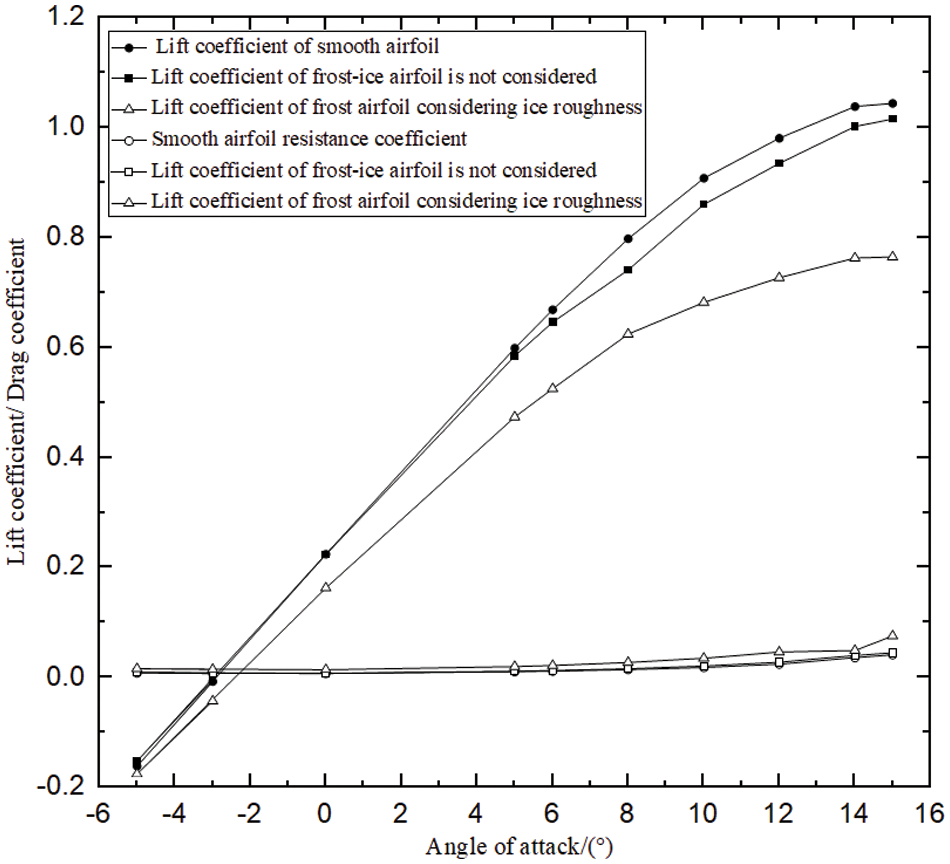
Figure 10: Effect of ice roughness on aerodynamic performance of frost-ice airfoil
The results presented in Fig. 10 demonstrate that the overall aerodynamic performance of the clear/smooth airfoil is relatively less susceptible to frost, with a gradual decline observed. Conversely, when considering variations in surface roughness, the lift coefficient of the frosted airfoil decreases by 36.5% compared to that of the smooth airfoil, while the drag coefficient increases by 84%. However, neglecting the influence of surface roughness on lift coefficient for frosted airfoils leads to only a marginal decrease of 2.8%, accompanied by a slight increase in drag coefficient by 1%. Henceforth, it can be inferred that ice-induced surface roughness significantly impacts the aerodynamic performance of frosted airfoils.
(2) The influence of ice surface roughness on the aerodynamic performance of open ice airfoil
The variation curves of the lift and drag coefficient of an ice airfoil with different levels of ice surface roughness at various angles of attack are presented in Fig. 11.
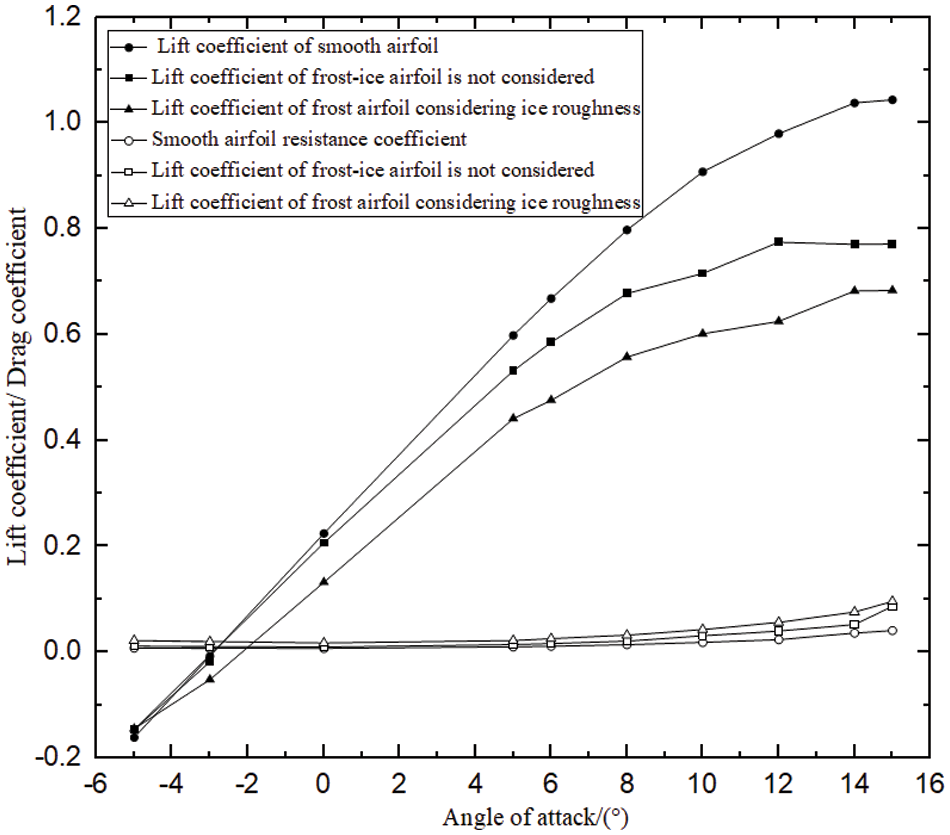
Figure 11: Effect of ice roughness on aerodynamic performance of clear-ice airfoil
The aerodynamic performance of the smooth blade without icing is significantly affected by clear ice, leading to a noticeable decrease in overall performance. This can be attributed to the irregular shape of the ice, which causes premature stall onset on the blade. With surface roughness, the lift coefficient of clear ice is 52.6% lower than that of a smooth airfoil, while the drag coefficient increases by 135%. Neglecting the impact of surface roughness, the lift coefficient decreases by 35.4% compared to a smooth airfoil and the drag coefficient increases by 111%. It can be observed that surface roughness has less influence on the aerodynamic performance of clear ice airfoils.
(3) The influence of two ice types on the stall characteristics of the blades
The numerical analysis model of ice surface roughness for various airfoils was established by integrating the findings from Section 4.2 with computational fluid dynamics theory, aiming to investigate the impact of wind turbine icing on blade stall characteristics. The calculations were performed using a wind turbine operating at an angle of attack of 14° as the reference value. Fig. 12 illustrates the flow velocity distribution in the airfoil flow field under specific blade surface roughness conditions and a wind turbine blade angle of attack set at 14°.
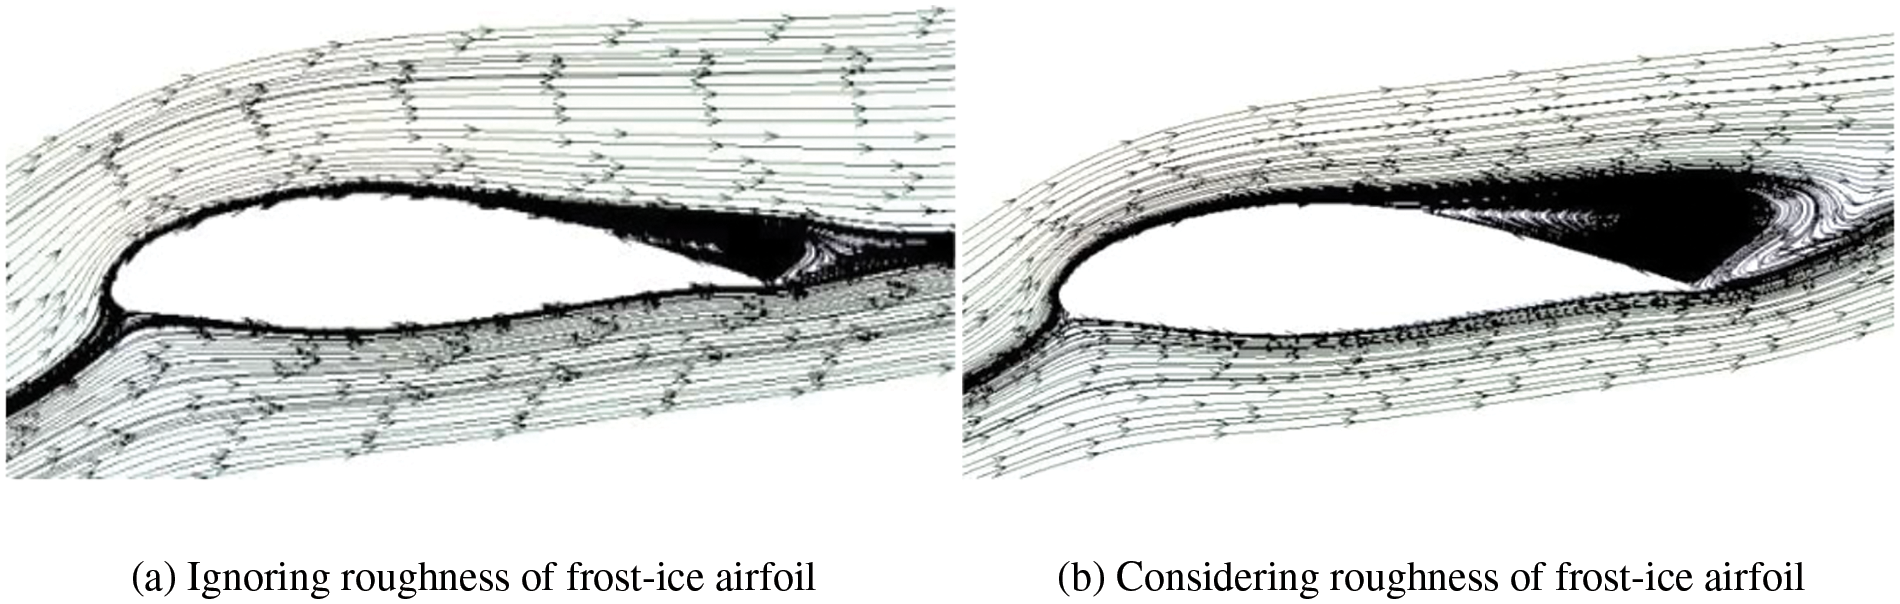
Figure 12: Flow field of frost-ice airfoil at 14° angle of attack
The laminar geometric streamlines of the frosted airfoil outside the flow field, as shown in Fig. 12, have minimal impact on the airfoil’s aerodynamics when roughness is not considered. However, considering the influence of ice surface roughness significantly alters the outside flow field of the frosted airfoil. This alteration leads to an advancement of the flow separation point on the leeward side and results in a large separation vortex at the trailing edge, thereby enhancing blade aerodynamics. Nevertheless, this modification can cause imbalances in lift and resistance between the upper and lower surfaces of the blade, ultimately leading to instability during running.
Fig. 13 illustrates the irregular geometry of ice and numerous protruding corners on the blade surface, which significantly affect the airfoil’s aerodynamics. The flow separation point on the leeward side remains unchanged, resulting in no significant alteration to the flow separation phenomenon. Although ice blade surface roughness has no apparent effect on the outer flow field of an airfoil, it increases separation vortex width at its trailing edge, leading to increased blade vibration during rotation and compromising wind turbine operational reliability.
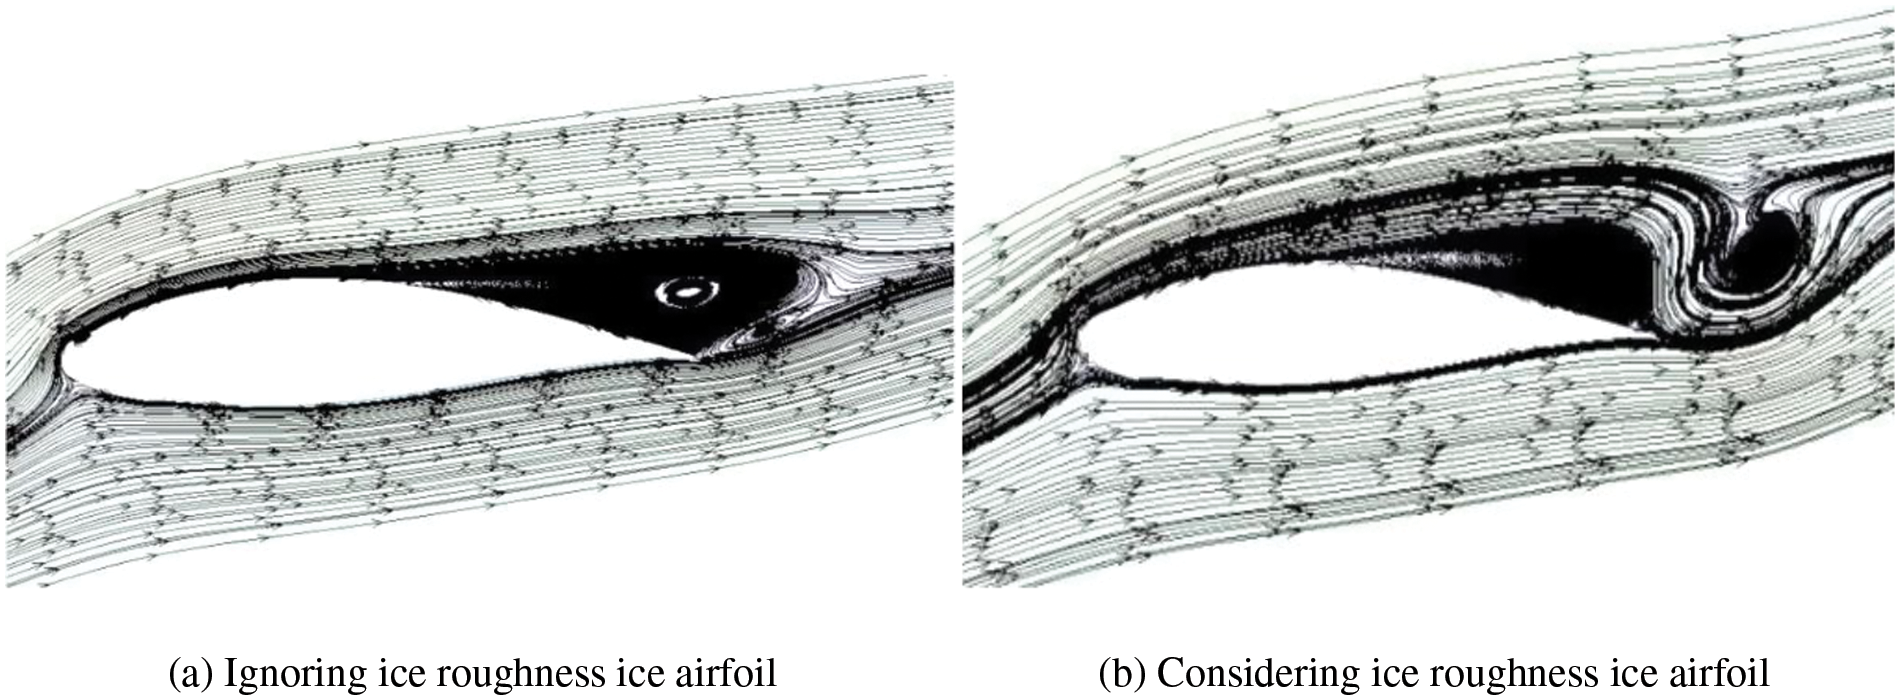
Figure 13: Flow field of ice airfoil with or without roughness at 14° angle of attack
Utilizing the computational fluid dynamics analysis method and the modified equivalent particle roughness height mathematical model, in conjunction with FENSAP-ICE and FLUENT analysis tools, a multi-time step approach is effectively employed to investigate the icing forms of wind turbine blades, encompassing both frost and clear ice.
(1) When wind turbines are in operation under cold and humid conditions, specific circumstances can lead to the formation of water droplet reflux phenomenon due to variations in water droplet quantity, freezing temperature, and impact angle. Consequently, frost ice and clear ice will develop on the surface of the turbine blades. Frost ice exhibits a regular shape with an overall streamlined appearance, while clear ice takes on an irregular form with angular ice formations scattered across the blade surface.
(2) The overall shape of ice-covered blades undergoes changes due to different types of ice condensation, subsequently altering the streamline shape of the outer flow field and significantly impacting the aerodynamic force experienced by wind turbines during running. Among these influences, the shape of clear ice plays a crucial role in determining blade aerodynamics. Regarding the impact of ice surface roughness on blade aerodynamics, considering frost ice’s surface roughness results in a 13.04 times lower lift coefficient compared to neglecting its influence, while the drag coefficient increases by 84 times. Similarly, considering clear ice’s surface roughness leads to a 1.49 times lower lift coefficient and a 1.22 times higher drag coefficient when compared to ignoring its influence. Considering both shape and surface roughness effects on wind turbine blade performance, it is evident that frost ice has a more significant impact on blade aerodynamics.
By considering blade surface roughness as a sensitive analysis factor, this study examines the impact of roughness on the aerodynamic characteristics of airfoils affected by frost and clear ice. During the formation of frost ice and clear ice, the blade surface roughness changes as condensation time increases, primarily concentrated in the leading edge area of the airfoil. Simultaneously, convective heat exchange occurs between the two types of ice and the environment during wind turbine running, accelerating blade surface icing. As ice patterns form on the blade surface, its roughness increases. However, due to the water droplet impact on the trailing edge, the maximum point of blade surface roughness does not occur at the leading edge stationary point.
Acknowledgement: Thanks to the co-authors for their efforts in the completion of this paper, and thanks to the New Energy Institute of Shenyang Institute of Technology for providing experimental conditions for the completion of this paper.
Funding Statement: Natural Science Foundation of Liaoning Province (2022-MS-305); Foundation of Liaoning Province Education Administration (LJKZ1108).
Author Contributions: The authors confirm contribution to the paper as follows: study conception and design: Xin Guan, Mingyang Li, Shiwei Wu; data collection: Xin Guan, Yuqi Xie; analysis and interpretation of results: Mingyang Li, Yongpeng Sun; draft manuscript preparation: Xin Guan, Mingyang Li. All authors reviewed the results and approved the final version of the manuscript.
Availability of Data and Materials: The data used in the analysis and calculation in this paper comes from the publicly available data, and the final analysis result data is obtained through laboratory analysis and calculation.
Conflicts of Interest: The authors declare that they have no conflicts of interest to report regarding the present study.
References
1. Lehtomäki V, Rissanen S, Wadham-Gagnon M, Sandel K, Moser W, Jacob D. Fatigue loads of iced turbines: two case studies. J Wind Eng Ind Aerod. 2016;158(4):37–50. doi:10.1016/j.jweia.2016.09.002. [Google Scholar] [CrossRef]
2. Huang RR, Li D, Liu T. Analysis of effect of ice surface roughness on stall characteristics of airfoil. Chinese J Aerod. 2011;1:59–65 (In Chinese). [Google Scholar]
3. Homola MC, Virk MS, Nicklasson PJ, Sundsbo PA. Performance losses due to ice accretion for a 5 MW wind turbine. Wind Energy. 2012;15(3):379–89. doi:10.1002/we.477. [Google Scholar] [CrossRef]
4. Liu G, Yan C, Lin Y. Research on ice coating morphology and stall characteristics of wind turbine airfoil. Acta Sol Energ Sin. 2016;6:1024–29 (In Chinese). [Google Scholar]
5. Mo QY, Wang GQ, Guo RB, Li L, Liu YY. (2022). Wind turbine blade icing condition and ant-ice deicing measures. Sci Technol Eng, 2022;22(21):9017–24 (In Chinese). [Google Scholar]
6. Kong XY, Zhang BF, Yu DW, Ji Y, Han XY, Liu CY, et al. Analysis of factors influencing ice cover on blade surface of wind turbines. J Dalian Univ Technol. 2023;(1):52–60 (In Chinese). [Google Scholar]
7. Li ZY, Jiang XL, Han XB, Ren XD, Wang YY. Numerical simulation on rime icing of wind turbine blades. J Harbin Inst Technol. 2022;54(3):155–62 (In Chinese). [Google Scholar]
8. Ibrahim GM, Pope K, Muzychka YS. Effects of blade design on ice accretion for horizontal axis wind turbines. J Wind Eng Ind Aerodynamics. 2018;173(1):39–52. doi:10.1016/j.jweia.2017.11.024. [Google Scholar] [CrossRef]
9. Bai X, Yang XY, Li MX. Study on the influence of yaw conditions on the output power and blade load of offshore floating wind turbine, Shipbuild China. 2022;63(1):140–52 (In Chinese). [Google Scholar]
10. Zheng JC, Zhao WW, Wan DC. Large eddy simulation analysis of the performance of a floating wind turbine with a vertical swing plate with a fractal hole, Shipbuild China. 2022;63(2):1–12 (In Chinese). [Google Scholar]
11. Xie SY, He J, Zhang CL, Jin X. Vibration control of offshore wind turbine under wind and wave excitation. J Sol Energy. 2022;43(7):270–5 (In Chinese). [Google Scholar]
12. Wei DZ, Que XL, Fu TN. Dynamic response analysis of a new semi-submersible offshore fan based on aerodynamic and hydrodynamic coupling. Ship Mech. 2022;26(6):843–860 (In Chinese). [Google Scholar]
13. Wang Q, Liu Y, Li WH. Research on aerodynamic performance of ice-covered wind turbine under yaw condition. J Eng Thermophys. 2022;43(4):918–28 (In Chinese). [Google Scholar]
14. Shin J, Bond TH. Experimental and computational ice shapes and resulting drag increase for a NACA 0012 airfoil; 1992. https://xueshu.baidu.com/usercenter/paper/show?paperid=9a15a957094b75579f04ec7c0ac2036e&site=xueshu_se. [Accessed 2024]. [Google Scholar]
15. Shin J. Characteristics of surface roughness associated with leading-edge ice accretion. J Aircr. 2015;33:316–21. [Google Scholar]
16. ISO 12494. Atmospheric icing of structures. Switzerland: IX-ISO; 2017 Mar. [Google Scholar]
17. Shin J, Bond TH. Results of an icing test on a NACA, 0012 airfoil in the NASA lewis icing research tunnel. In: 30th Aerospace Sciences Meeting and Exhibit; 1992a; Reno, NV, USA. [Google Scholar]
18. Barber S, Chokani N, Abhari RS. The impact of ice formation on wind turbine performance and aerodynamics. Eur Wind Energy Conf Exhibit. 2011;135–44. [Google Scholar]
19. Jonkman JM, Butterfield S, Musial W, Scott G. Definition of a 5-MW reference wind turbine for offshore system development. USA: Office of Scientific and Technical Information (OSTI); 2009. [Google Scholar]
20. Tong XL, Luke E. Eulerian simulations of icing collection efficiency using a singularity diffusion model. In: 43rd AIAA Aerospace Sci Meet Exhibit; 2005; Reno, NV, USA. p. 1246. [Google Scholar]
21. ANSYS Inc. ANSYS FLUENT UDF manual. In: ANSYS FLUENT 14.0. CA, USA: ANSYS Inc.; 2011. [Google Scholar]
Cite This Article
 Copyright © 2024 The Author(s). Published by Tech Science Press.
This work is licensed under a Creative Commons Attribution 4.0 International License , which permits unrestricted use, distribution, and reproduction in any medium, provided the original work is properly cited.
 Downloads
 Citation Tools