
 Submit a Paper
 Propose a Special lssue
 Open Access
ARTICLE

An Integrated Optimization Method for CO2 Pre-Injection during Hydraulic Fracturing in Heavy Oil Reservoirs
1 PetroChina Xinjiang Oilfield Company, Karamay, 834000, China
2 National Key Laboratory of Oil and Gas Reservoir Geology and Exploitation, Southwest Petroleum University, Chengdu, 610500, China
3 Department of Modern Mechanics, University of Science and Technology of China, Hefei, 230026, China
* Corresponding Author: Xiding Gao. Email:
Fluid Dynamics & Materials Processing 2024, 20(9), 1971-1991. https://doi.org/10.32604/fdmp.2024.049406
Received 06 January 2024; Accepted 11 March 2024; Issue published 23 August 2024
 View Full Text
 Download PDF
Abstract
CO2 pre-injection during hydraulic fracturing is an important method for the development of medium to deep heavy oil reservoirs. It reduces the interfacial tension and viscosity of crude oil, enhances its flowability, maintains reservoir pressure, and increases reservoir drainage capacity. Taking the Badaowan Formation as an example, in this study a detailed three-dimensional geomechanical model based on static data from well logging interpretations is elaborated, which can take into account both vertical and horizontal geological variations and mechanical characteristics. A comprehensive analysis of the impact of key construction parameters on Pre-CO2 based fracturing (such as cluster spacing and injection volume), is therefore conducted. Thereafter, using optimized construction parameters, a non-structured grid for dynamic development prediction is introduced, and the capacity variations of different production scenarios are assessed. On the basis of the simulation results, reasonable fracturing parameters are finally determined, including cluster spacing, fracturing fluid volume, proppant concentration, and well spacing.Keywords
Nomenclature
| AC | Acoustic compression |
| DTSM | Shear wave sonic log |
| h | Fracture height |
| hi | The height from the bottom layer to the top of the i-th layer |
| KIl | The stress intensity factors at the lower tips of the fracture |
| KIu | The stress intensity factors at the upper tips of the fracture |
| MD | Measured depth |
| pcp | The fracture pressure measured at the reference depth |
| poisson | Poisson’s ratio |
| Pp | Pore pressure |
| RT | Resistivity |
| Shangfu | Overburden stress |
| Sh | Minimum horizontal stress |
| Vp | Compressional wave velocity |
| Vs | Shear wave velocity |
| w(z) | The fracture width at depth z |
| youngsMOD | Young’s modulus |
| z | The position of the fracture |
| Greek Symbols | |
| ρf | The fluid density |
| σi | The overburden stress at the i-th layer |
| σn | The overburden stress at the top layer |
Vast unconventional oil and gas reserves exist globally, with heavy oil reservoirs being particularly significant as a promising alternative energy source for the future [1,2]. However, these unconventional reservoirs typically exhibit low permeability and porosity, high crude oil viscosity, and substantial heat loss during heavy oil thermal recovery, necessitating alternative methods to develop this type of reservoir effectively [3,4]. CO2 has long been widely applied in oilfields [5]. On the one hand, compared to other non-hydrocarbon media, CO2 exhibits better miscibility with crude oil. When dissolved in crude oil, it effectively reduces the interfacial tension and viscosity, enhancing the flow properties of crude oil in the reservoir. Therefore, for heavy oil with poorer flowability, higher viscosity, and greater surface tension, the use of CO2 to enhance recovery is more crucial. On the other hand, the application of CO2 resources in oilfield production development is a significant response to the carbon capture, utilization, and storage (CCUS) policy to mitigate the global climate crisis.
Some scholars [6,7] proposed the application of supercritical CO2 fluids in oil and gas drilling and fracturing. They proposed that using supercritical CO2 fluids for shale reservoir fracturing can avoid a series of issues caused by traditional fracturing fluids, such as water resource utilization, liquid backflow, and waste generation, and conducted theoretical and experimental research, demonstrating its technical feasibility [8]. Subsequently, universities and research institutions in many countries conducted a significant amount of basic research on the application of supercritical CO2 in petroleum exploration and development [9–12].
The pre-stored CO2 fracturing technology utilizes liquid CO2 as a medium, injecting a sufficient amount of CO2 into the reservoir, creating a complex network of fractures near the wellbore to improve reservoir drainage capacity. Meanwhile, under high-temperature and high-pressure conditions in the middle and deep reservoirs, CO2 becomes supercritical and dissolves in the crude oil, resulting in volume expansion and viscosity reduction. In unconventional reservoirs, factors such as stress state, stress anisotropy, rock mechanical properties, and natural fractures can determine the growth of hydraulic fractures and significantly affect well productivity [13–15]. In addition, reservoir physical parameters such as saturation, porosity, matrix permeability, etc., also affect production [16,17]. Therefore, it is important to simulate fracture propagation and evaluate the subsequent productivity.
This study proposes a workflow for the optimization design of pre-CO2 storage hydraulic fracturing for medium and deep heavy oil reservoirs in the Badaowan Formation (Junggar Basin, China). The workflow, implemented by the Petrel integrated platform, holds significant importance for optimizing well spacing and designing of hydraulic fracturing operations in the medium and deep heavy oil reservoirs. In this study, based on the geological understanding of the Badaowan Formation (Junggar Basin, China), a workflow for the optimization design of pre-stored CO2 fracturing in middle and deep heavy oil reservoirs was proposed using the Petrel integrated platform, which is of great significance for optimizing well spacing and reasonable design of fracturing operation. The workflow includes geological modeling, geomechanical modeling, fracturing simulation, and production simulation. Firstly, a geomechanical model using well log curves is established and the model reliability in comparison with field data is validated. Subsequently, hydraulic fracturing simulations utilizing the geomechanical model are conducted. Finally, an unstructured grid is used to discretize the fractures for reservoir numerical simulations [18]. Based on the simulation results, the optimal values for fracturing parameters (cluster spacing, fracturing fluid volume, proppant concentration, well spacing, etc.) are determined and applied into the field.
The studied area is located in the Wuxia Fault Belt at the northwest margin of the Junggar Basin. It is approximately 35 kilometers east of the Urho District in Karamay City. The surface terrain is characterized by desert and desert steppe, with an average elevation of 490.5 m above sea level. The Jurassic Badaowan Formation in the studies area has a calculated petroleum geological reserve of 10.70 million tons, covering an oil-bearing area of 7.95 square kilometers. The natural gas geological reserves are 53 million cubic meters, covering a gas-bearing area of 0.54 square kilometers. The formation thickness ranges from 16 to 52 meters, with an average thickness of about 36 meters. The predominant lithology of the formation includes medium sandstone, fine sandstone, followed by coarse sandstone and pebbly sandstone. Specifically, natural fractures are not well developed. Currently, there is one horizontal well (Well A) in the area, and the operators plan to drill two additional horizontal wells (Well B and Well C). Therefore, it is necessary to enhance the development efficiency of the study area through well layout and fracturing design.
To understand the influencing factors of CO2 pre-storage fracturing and optimize the fracturing parameter design, this paper proposes a numerical simulation workflow based on the concept of geological engineering integration [19]. The workflow consists of the following steps:
(1) Construct the reservoir geological model based seismic and well logging data;
(2) Utilize the three-dimensional refined geological model to obtain key physical parameters, such as porosity, permeability, oil saturation, Young’s modulus, and Poisson’s ratio. Using the geological modeling results as a foundation and constraining it with a one-dimensional geological mechanics model, achieve the accurate characterization of three-dimensional stress distribution through finite element stress simulation;
(3) Simulate the reservoir fracture propagation mechanism using an Unconventional Fracture Model (UFM) to precisely depict the pre-storage CO2 fracturing network in the well area;
(4) Implement both unstructured and structured mesh techniques to represent the fracture and matrix areas in the well region. This allows for an accurate description of the fracture network morphology and proppant migration distribution;
(5) Based on the actual field engineering conditions, perform numerical simulations of key operation parameters, such as well spacing, fracturing stage length, cluster spacing, and the volume of fracturing fluid. Predict the production distribution patterns under different fracturing parameters, providing a theoretical basis for reservoir development management.
Fig. 1 is the workflow chart for Three-Dimensional Geomechanical Modeling. Through this process, we can establish a three-dimensional geological mechanics model of the work area for fracturing simulation or production history fitting and prediction. The fracture network obtained through this process of fracturing simulation is closer to the actual conditions of the reservoir site compared to the fracture network generated directly with given parameters.
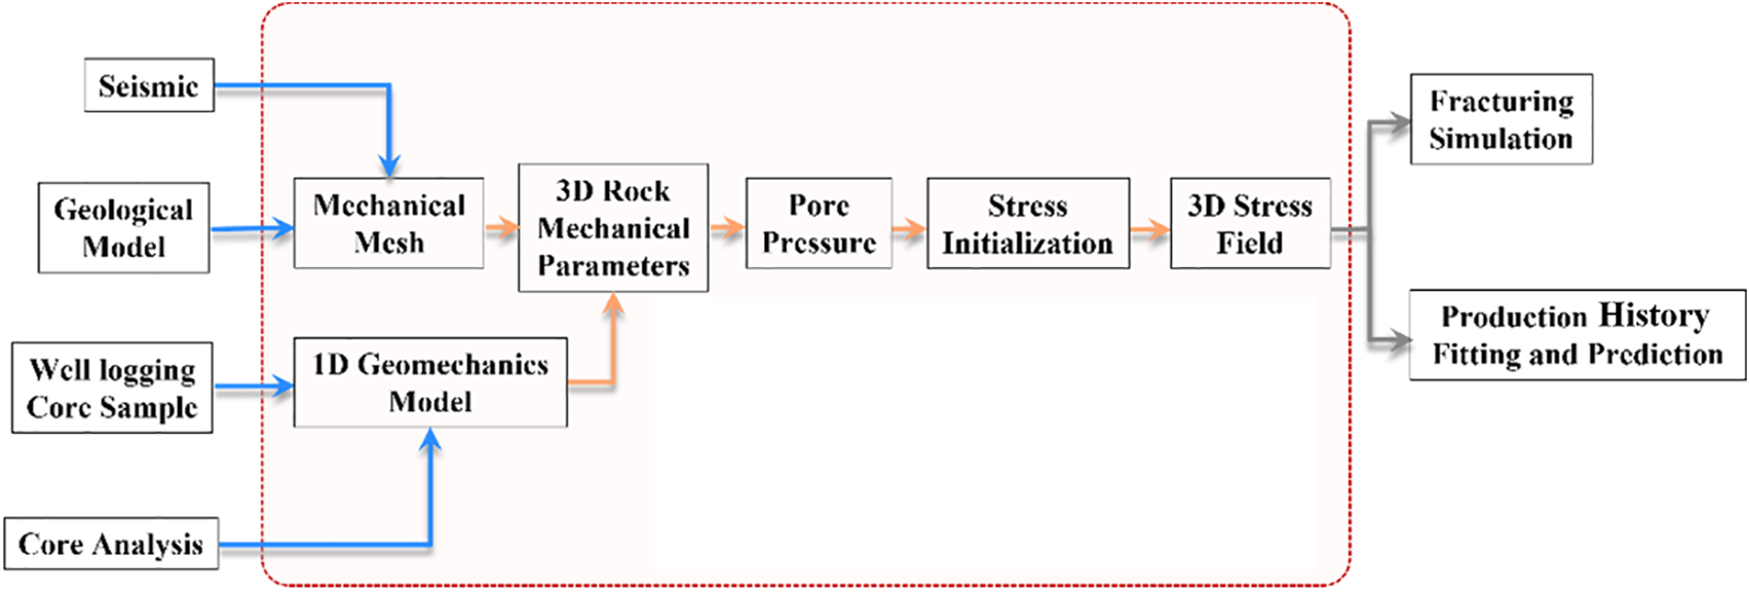
Figure 1: Workflow chart for three-dimensional geomechanical modeling
3.1 Geomechanical Model Construction
3.1.1 One-Dimensional Geomechanical Modeling
The Geological Mechanics Model possesses the ability to describe the stress state and mechanical properties of rocks, which is of significant importance for conducting accurate reservoir-scale fracturing simulations [20]. The primary objective of constructing a one-dimensional rock mechanics model is to acquire essential mechanical parameters of rocks, including Young’s modulus, Poisson’s ratio, as well as the maximum and minimum horizontal principal stresses. Acoustic data serves as a crucial basis for accurately inverting reservoir mechanical property parameters. Thus, utilizing reservoir acoustic compression and shear wave velocity data and integrating methods for rock mechanics parameter inversion, it is feasible to predict dynamic Young’s modulus and dynamic Poisson’s ratio, which is the basis for the construction of a three-dimensional detailed geological mechanics model.
However, for wells lacking acoustic well log data, neural network methods must be employed to predict acoustic information. Simultaneously, to achieve effective conversion of dynamic and static data, corresponding conversions are necessary [21]. This process (shown in Fig. 2) is primarily based on rock core acoustic experiments and triaxial stress test data. Calculations of overburden stress rely on density well log data and are computed using appropriate equations.
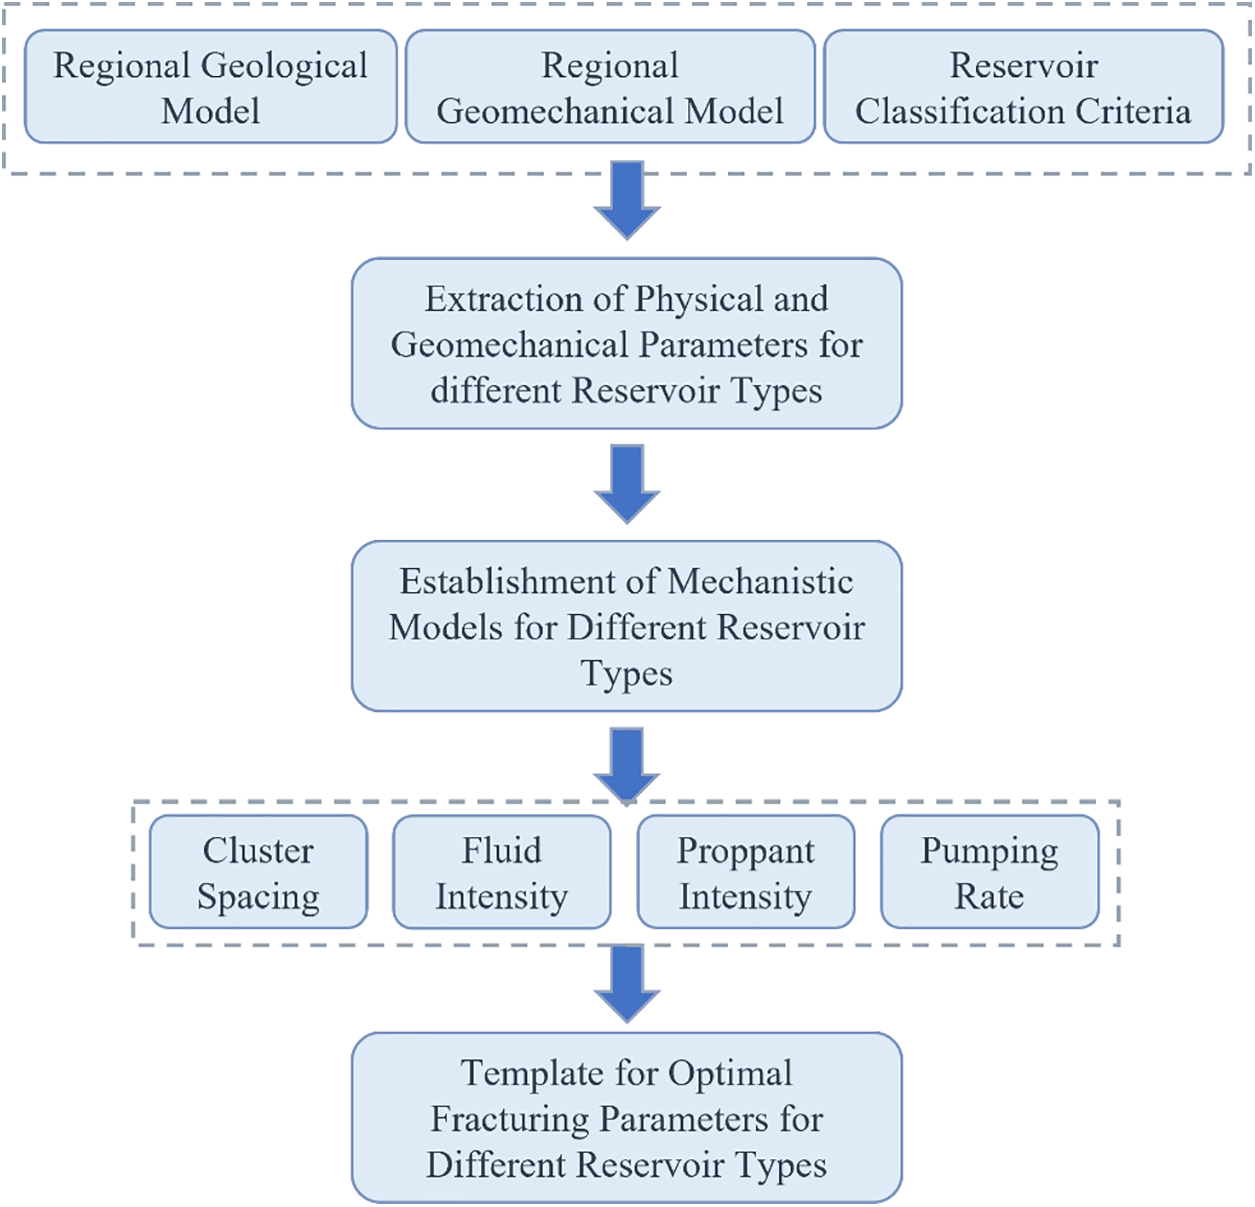
Figure 2: Fracturing design process flowchart
3.1.2 Three-Dimensional Geomechanical Modeling
Using a one-dimensional geological mechanical model as a basis, a three-dimensional mechanical model can be obtained through three-dimensional attribute interpolation. The distribution of the three-dimensional geomechanical stress field in the reservoir controls the initiation and development of fractures in the reservoir. This is an important reservoir property parameter for conducting fracturing simulations. Therefore, it is necessary to carry out detailed verification of the effectiveness and accuracy of the three-dimensional geomechanical model. In this study, based on Schlumberger’s VISAGE plugin, the finite numerical method is used to comprehensively consider the influence of reservoir rock heterogeneity. The three-dimensional stress field distribution in the well area is inverted and compared with field data for validation. Key parameters include the direction of the principal stress, vertical stress, horizontal stress difference, Young’s modulus, and Poisson’s ratio. To avoid boundary effects, the geomechanical grid is expanded laterally to three times the planar size of the geological model. Overburden, underburden, lateral layers, and stress plates are added to cover a range from the surface to a depth of approximately 6000 m. The original grid size of the reservoir is 427 × 206 × 100 (I, J, K), and after expansion, the grid size of the reservoir becomes 1443 × 462 × 155 (I, J, K). In the I and J directions, the grid step sizes are 34 and 33 m, respectively, while in the K direction, it is 50 m [22].
In the absence of on-site operation data, a reference to the adjacent block indicates a maximum fracturing pressure of 50 MPa. A 55% slickwater ratio is used. During the pre-pad stage, a gel is employed to initiate the fractures, while during the sand-carrying stage, low sand concentration is achieved using slickwater, and high sand concentration is achieved using gel, resulting in an equivalent fluid sand ratio of approximately 9.5 m3/m3.
In the hydraulic fracturing process, fracturing fluid is an indispensable working fluid. Before simulating fracture propagation, fracturing fluid characteristics such as viscosity, leak-off, friction, and gel break need to be defined. Field data indicates the use of guar gum-based gels, slickwater, and CO2.
(1) Organic anti-swelling agents are added to the fracturing fluid system to enhance its anti-swelling performance and mitigate potential water sensitivity issues.
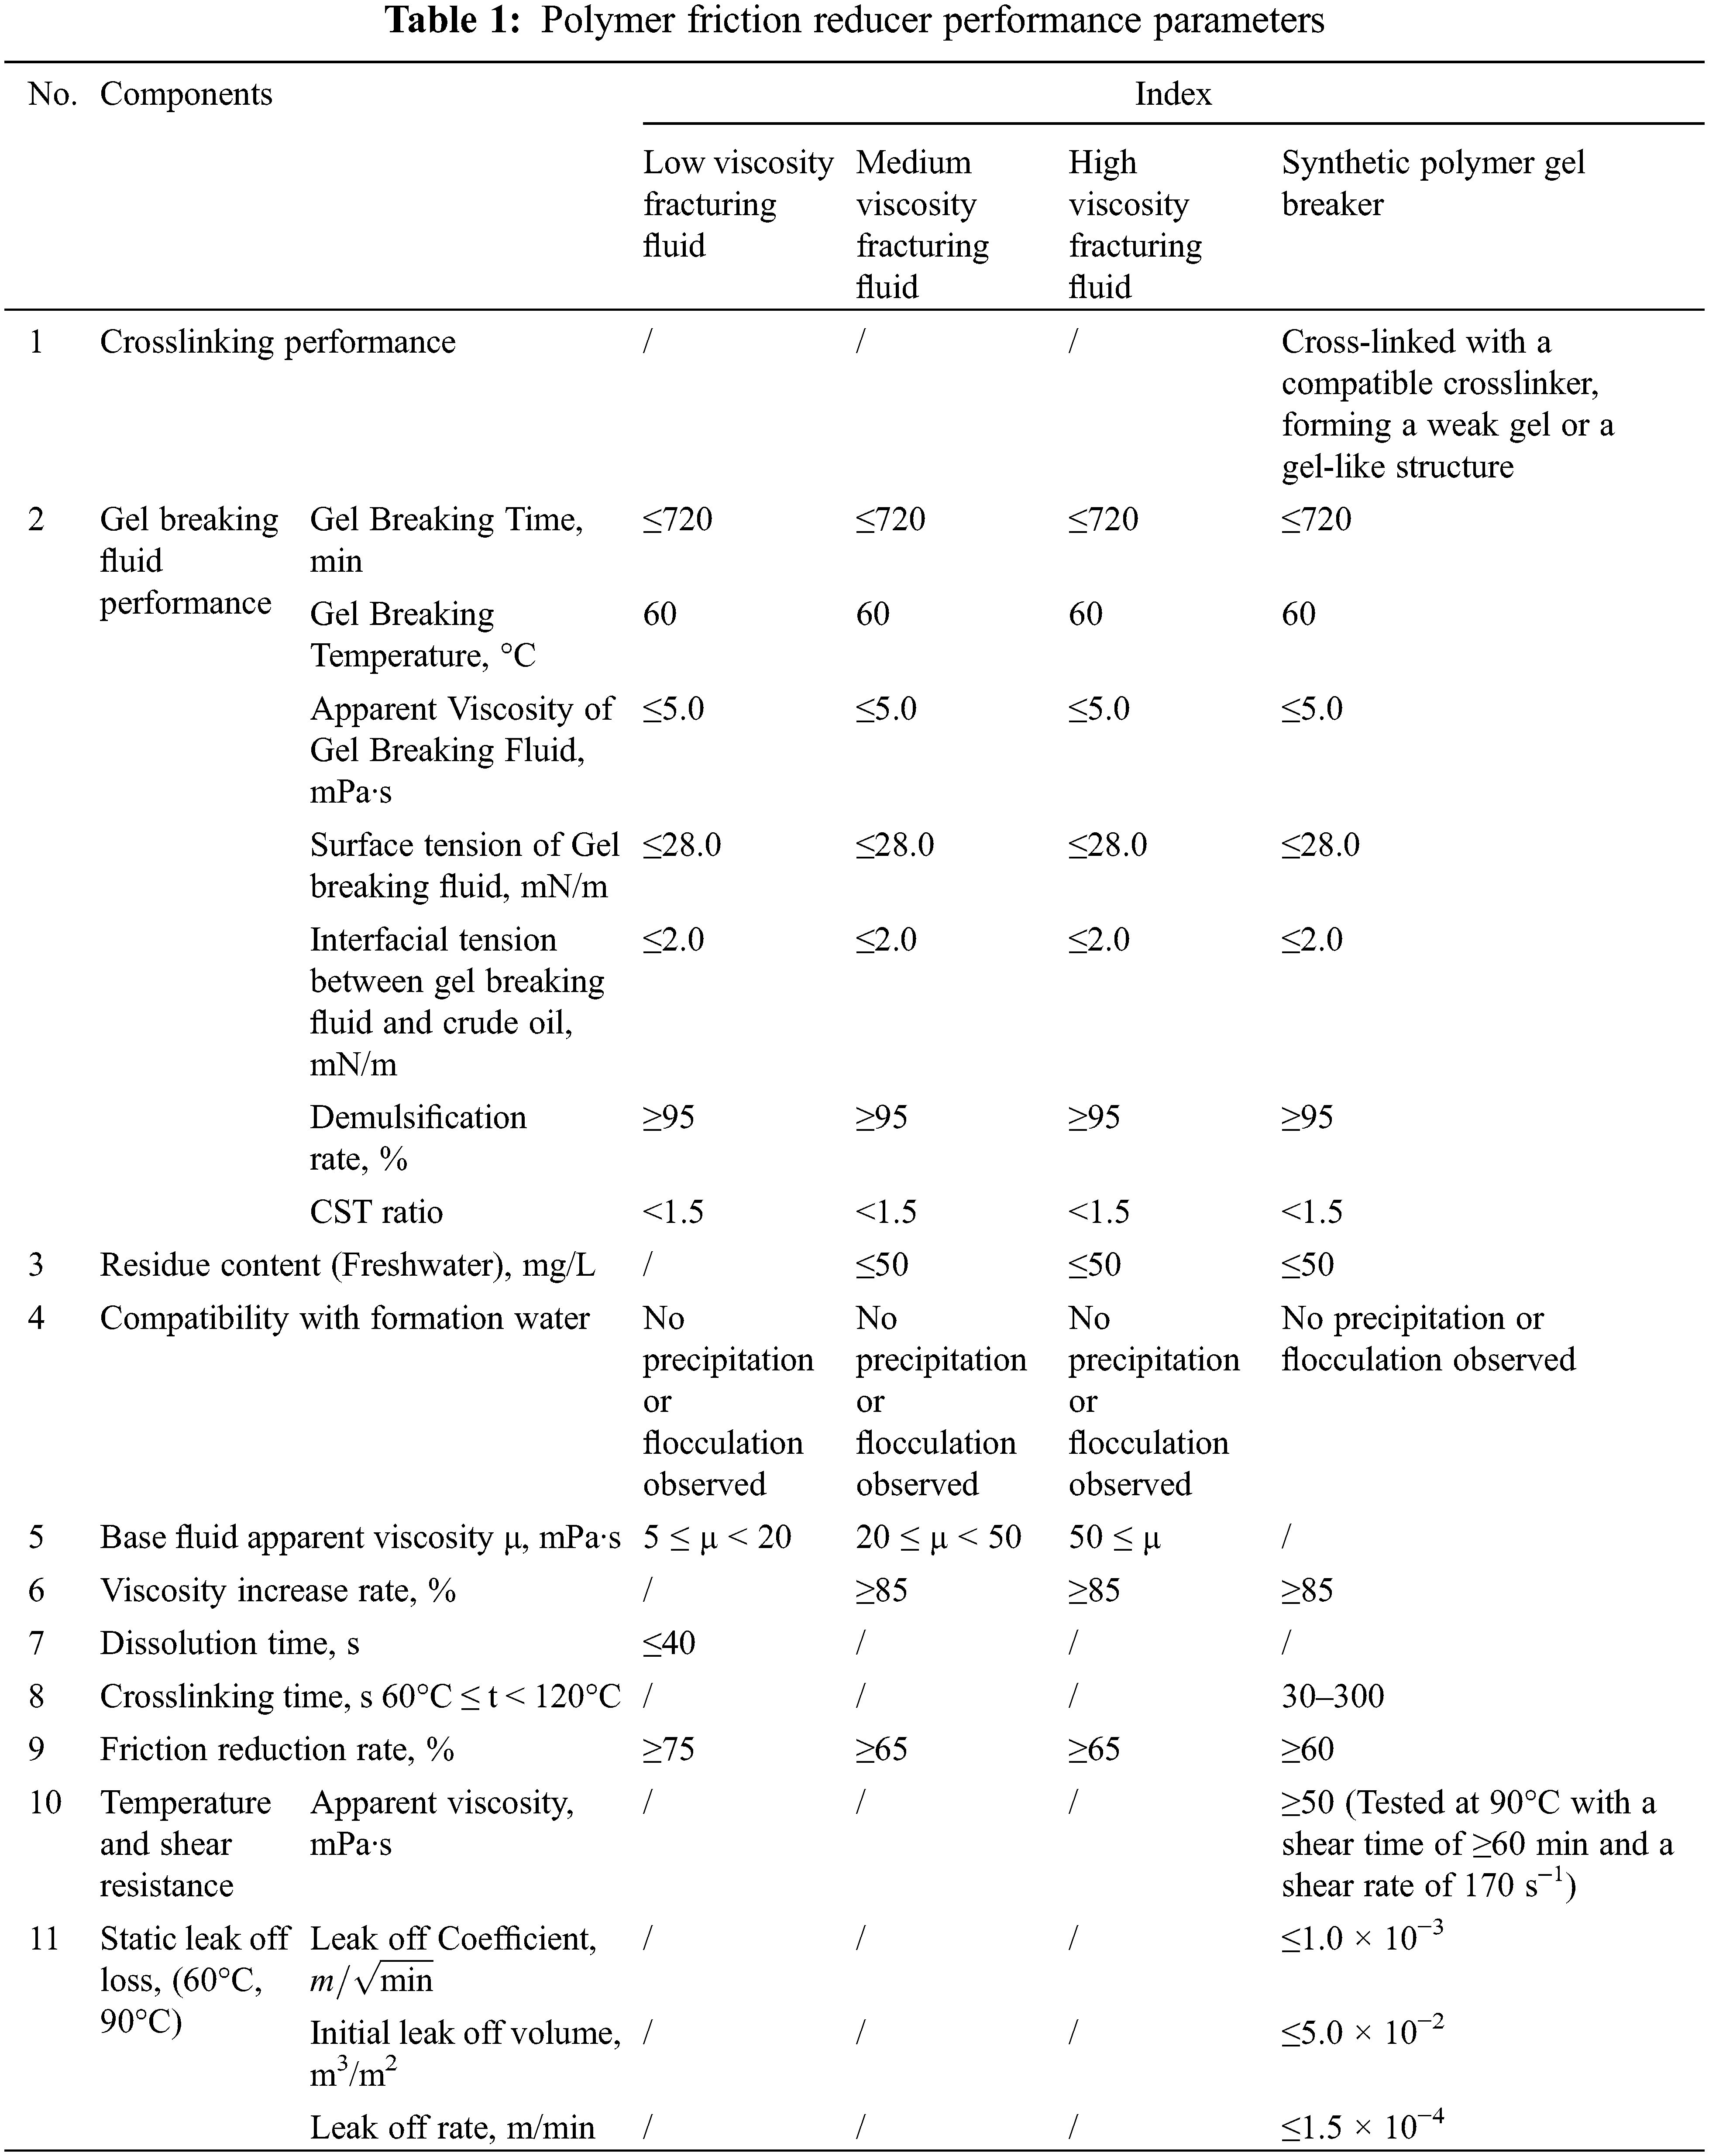
(2) The polymer slickwater system should exhibit excellent friction reduction performance to meet high-volume construction requirements. The required basic performance parameters are as shown in Table 1.
When fracturing fluids or other fluids create fractures, it is necessary to promptly transport a proppant with sufficient strength into the fractures to prevent them from closing. During on-site fracturing, 20/40 mesh silica sand is used.
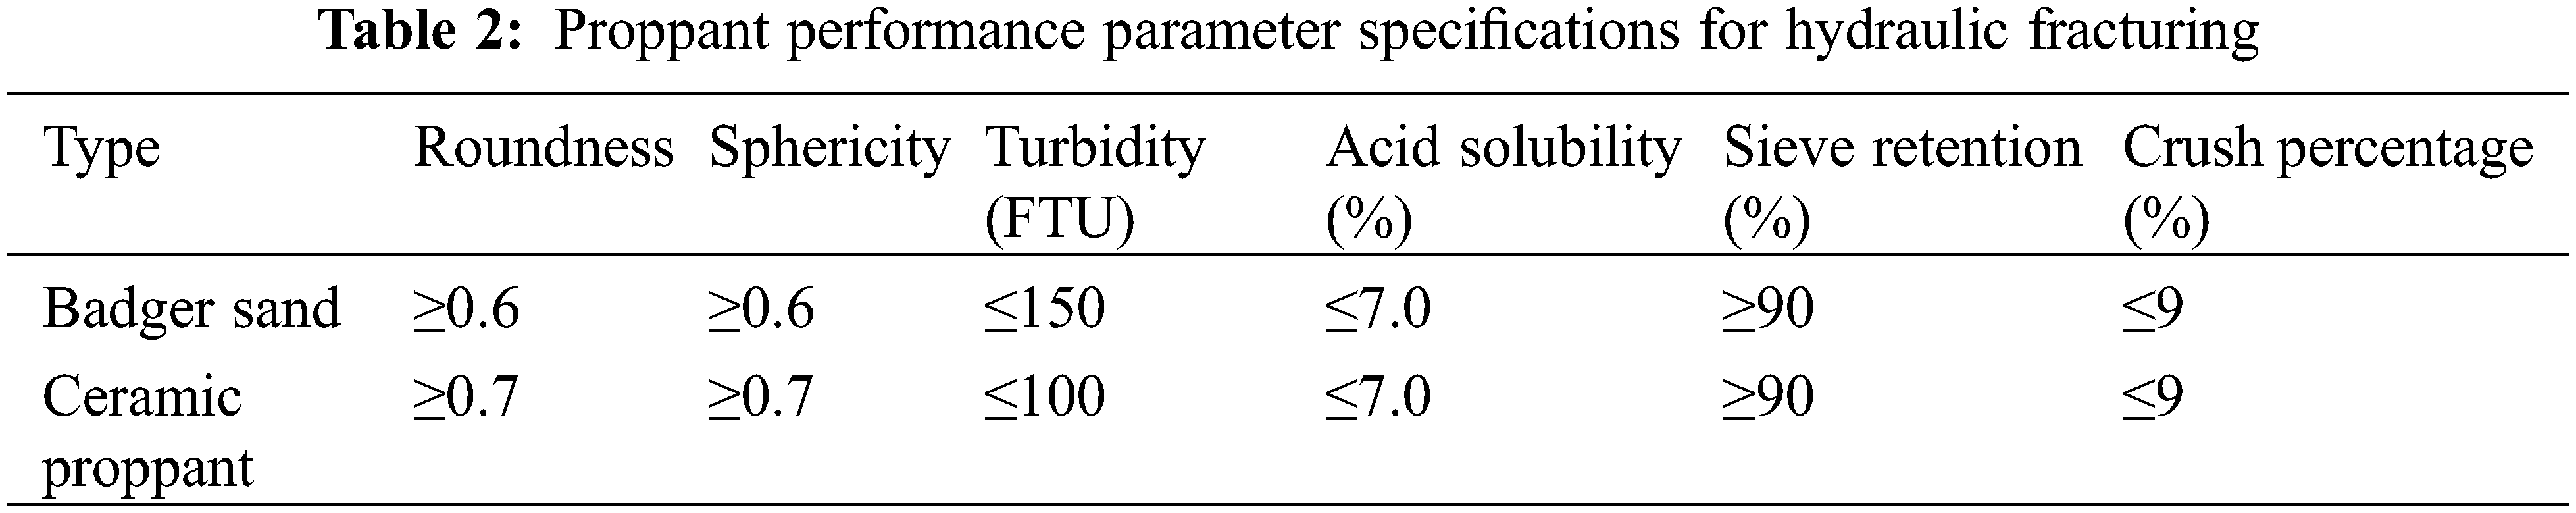
The selection of proppant specifications is primarily based on factors such as the formation’s proppant-carrying capacity, proppant conductivity, and proppant crushing rate under closure stress conditions in the target formation. Other quality parameters that the proppant used in the field must meet are listed in Table 2.
3.2.3 Fracture Propogation Modeling
In 2011, Kresse and colleagues [22] introduced an Unconventional Fracture Model (UFM) that effectively addresses the fully coupled problem of fluid flow within the fracture network and fracture elastic deformation. This model shares similar assumptions and governing equations with traditional quasi-3D fracture models: the fluid flow and the associated pressure gradient in the vertical direction are negligible except near the upper- and lower-fracture-tip region. The UFM calculates the stress intensity factors at the top and bottom tips of the fracture by considering pressure within the fracture, the geometric shape of the fracture, and in-situ stress in the formation. Subsequently, it determines the stable fracture height by matching the stress intensity factors at the tips with the fracture toughness of the layer containing the fracture tips. The specific fracture height equations [22] are as follows:
where pcp represents the fracture pressure measured at the reference depth of hcp, Pa; z denotes the position of the fracture, m; ρf is the fluid density, kg/m3; KIu and KIl are the stress intensity factors at the upper and lower tips of the fracture, respectively, Pa·m0.5; w(z) is the fracture width at depth z, m; σn and σi represent the overburden stress at the top and in the i-th layer, Pa; h signifies the fracture height, m; hi stands for the height from the bottom layer to the top of the i-th layer, m.
Furthermore, it also takes into account processes such as proppant transport between hydraulic fractures and stress shadow effects [23]. Compared to the Pseudo Three-Dimensional (P3D) fracture model, the Unconventional Fracture Model (UFM) considers the heterogeneity and complexity of the geological formation, enabling a more accurate representation of the geometric shape and distribution of fractures. It excels in describing the physical processes of fractures, including propagation and deformation, providing a more profound understanding of fracture behavior. Additionally, UFM allows for finer parameterization, enhancing model flexibility to adapt to different geological conditions and fracturing processes.
3.3 Reservoir Numerical Simulation
Hydraulic fractures require grid generation prior to reservoir numerical simulation. This paper employs an adaptive unstructured grid algorithm for fracture grid generation [24]. Unstructured grids are used in the fracture zone and structured grids in the matrix zone, reducing the grid numbers and improving computational speed. This approach can also identify whether each fracture grid has proppant support, making the simulation results more realistic and reliable.
3.3.2 Description of Model Parameters
Permeability and porosity for the matrix grid are obtained from the geological model. The permeability and porosity of the fracture grid depend on the results of the fracturing simulation. Model parameters are presented in Table 3.
Before hydraulic fracturing design is initiated, the workflow needs to be validated. Geological mechanical parameters, such as Young’s modulus, are verified through laboratory core experiments. Utilizing microseismic data and matching drawdown curves ensures the reliability of the fracturing model. Microseismic data providing information on hydraulic fractures away from the wellbore is the most widely used technique for monitoring hydraulic fractures [25]. The reliability of geological and reservoir numerical simulation models is ensured through historical production data fitting.
4.1 The Results of the Geomechanical Model
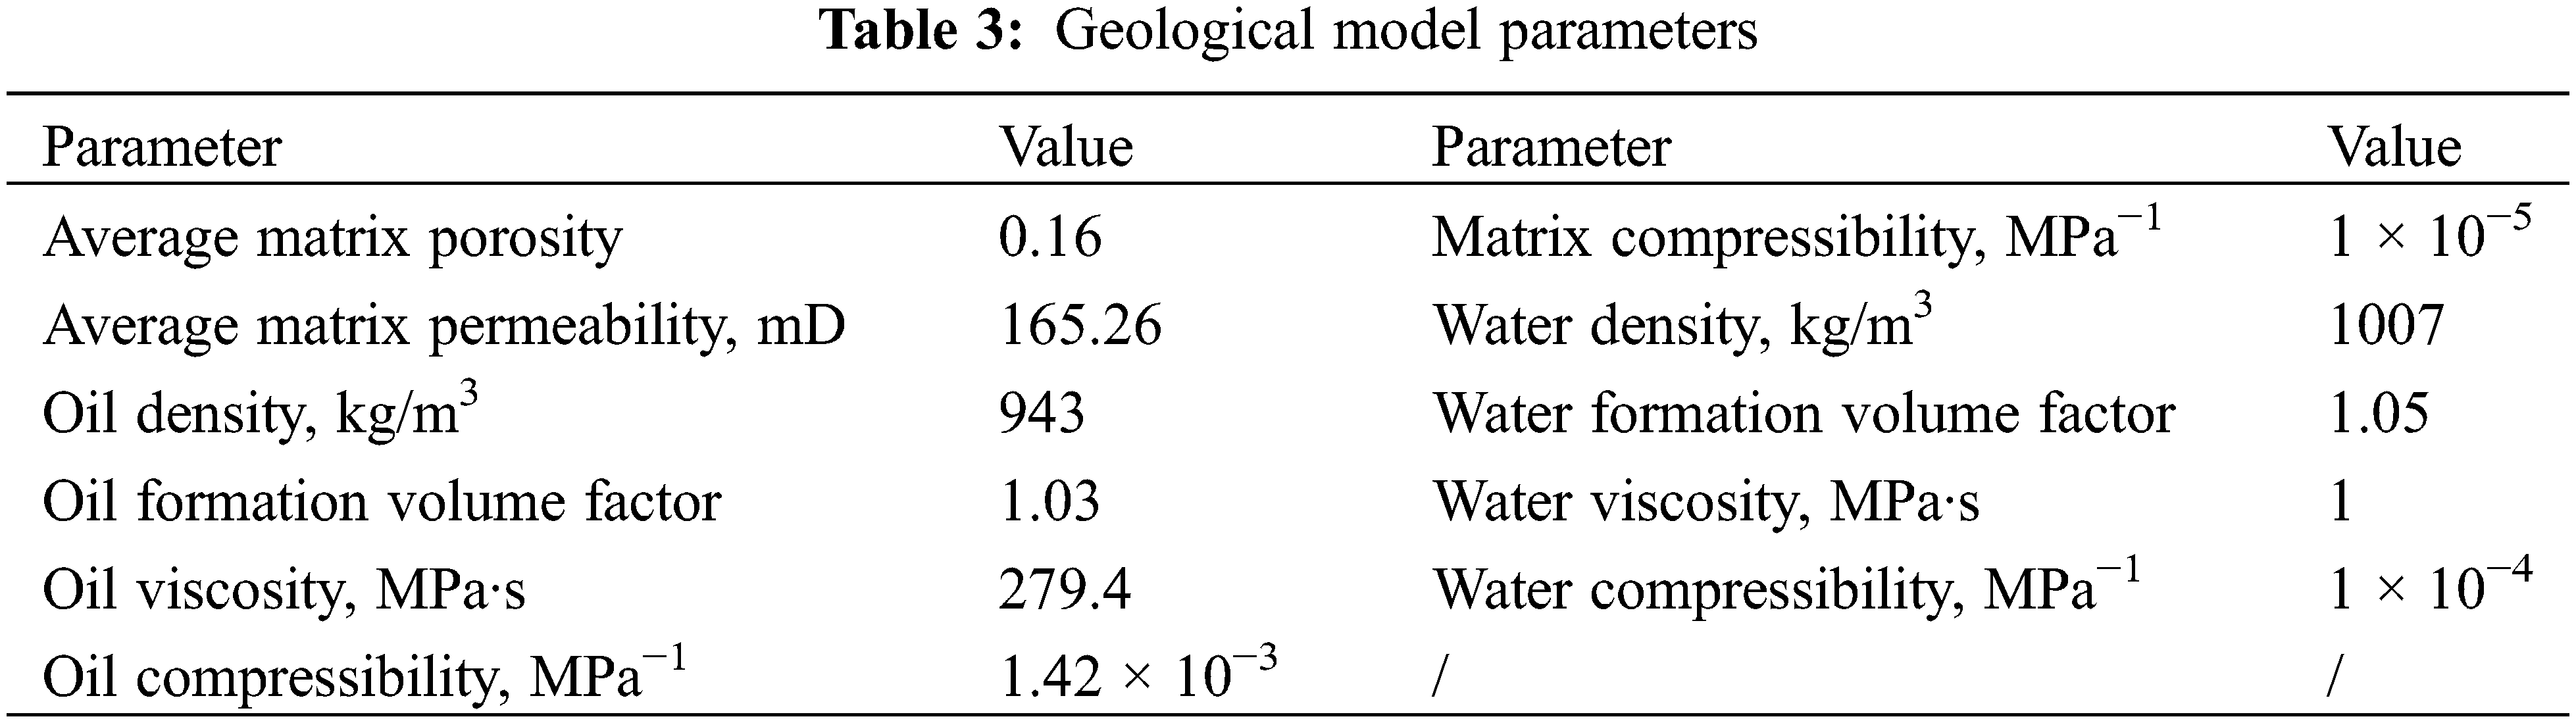
Some one-dimensional geomechanical modeling outcomes are depicted in Fig. 3. From left to right, these include AC (Acoustic Compression), Overburden Stress, σH (Horizontal Stress), Poisson’s Ratio, and Young’s modulus. The exact experimental values for these parameters were not directly provided in the field data. However, using empirical formulas provided on-site, these key parameters in the one-dimensional geomechanical model can be transformed and calculated based on wellbore measurements like RT, DT, and RHOB.
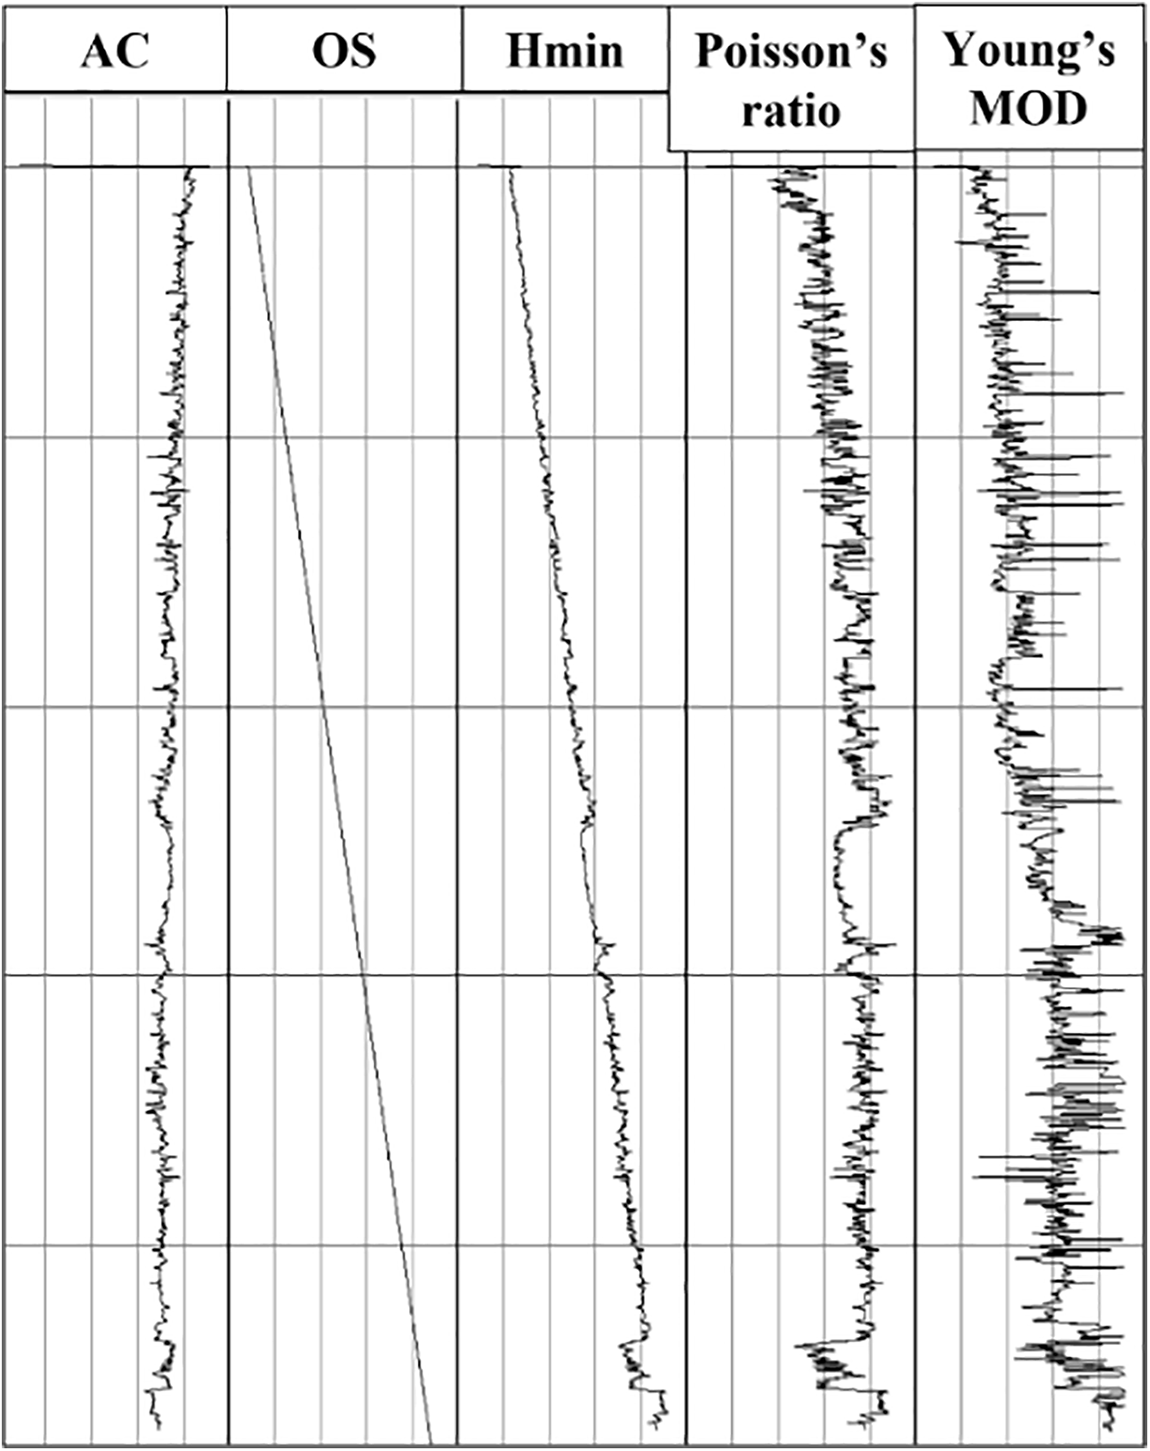
Figure 3: Well-logging curves for the field (OS: overburden stress)
where shangfu represents overburden stress, MPa; MD stands for measured depth, m; Sh signifies minimum horizontal stress, MPa; Pp represents pore pressure, MPa; AC denotes acoustic compressional, μs/m; DTSM stands for shear wave sonic log, μs/m; RT stands for resistivity, Ω·m; youngsMOD is Young’s modulus, GPa; Vs represents shear wave velocity, m/s; Vp represents compressional wave velocity, m/s; poisson stands for Poisson’s ratio.
The color blocks represent the results of one-dimensional geomechanical calculations, while the lines represent the results of three-dimensional geomechanical calculations. As shown in Fig. 4, the results of one-dimensional geomechanical calculations closely match the results of three-dimensional geomechanical calculations, providing validation for the effectiveness and validity of the geomechanical model.
Figure 4: Calibration and fitting of the key parameters
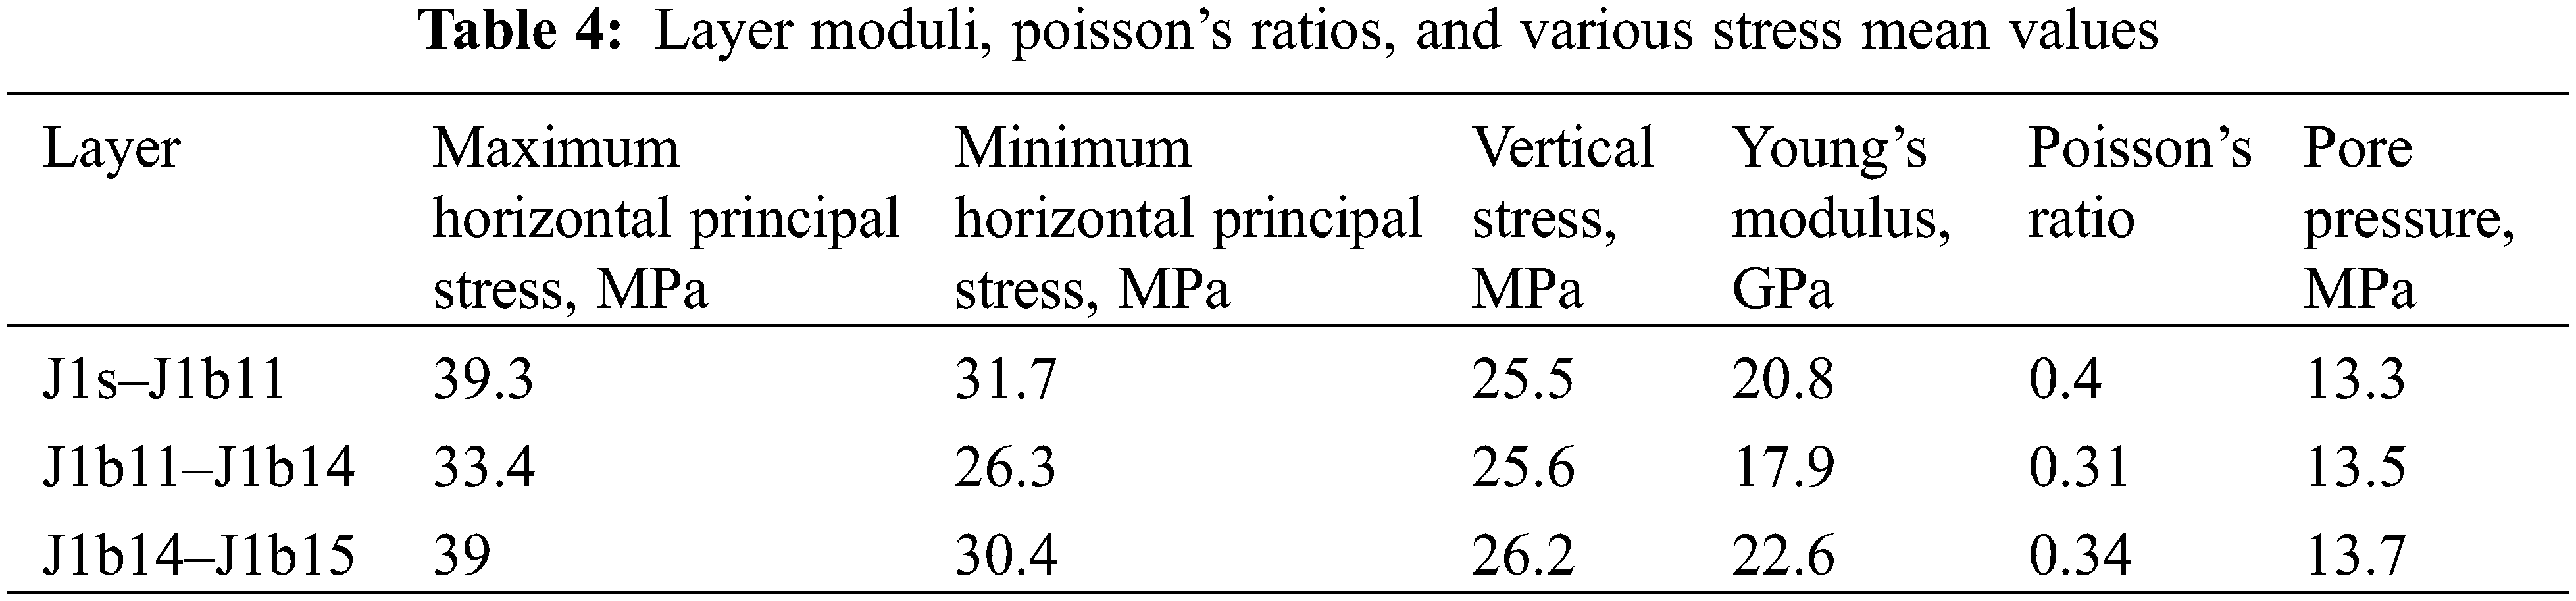
By using the Visage module to establish a three-dimensional geomechanical model [26], the maximum and minimum horizontal principal stresses, vertical stress, and pore pressure are corrected to match the one-dimensional geomechanical model, ultimately obtaining a three-dimensional geomechanical model that aligns with the field data. As shown in Table 4, the stress state of the three-dimensional geomechanical model matches the stress state of the field’s reverse fault and all data falls within the estimated range provided in the field.
4.2 From Fracture Propagation to Reservoir Numerical Simulation
Structured grids make up the matrix, while fractures are represented by unstructured grids. After grid partitioning, and the parameters such as fluid, matrix type, production regime, can be set up [27]. The production grid width is set at 5 m, the unstructured grid permeability is 3.05 mD, with dimensions of 10 m by 10 m (shown in Fig. 5). This paper aims to demonstrate this integrated optimization method, with data sourced from field logging and neighboring well construction experiences, which may decrease the prediction accuracy.
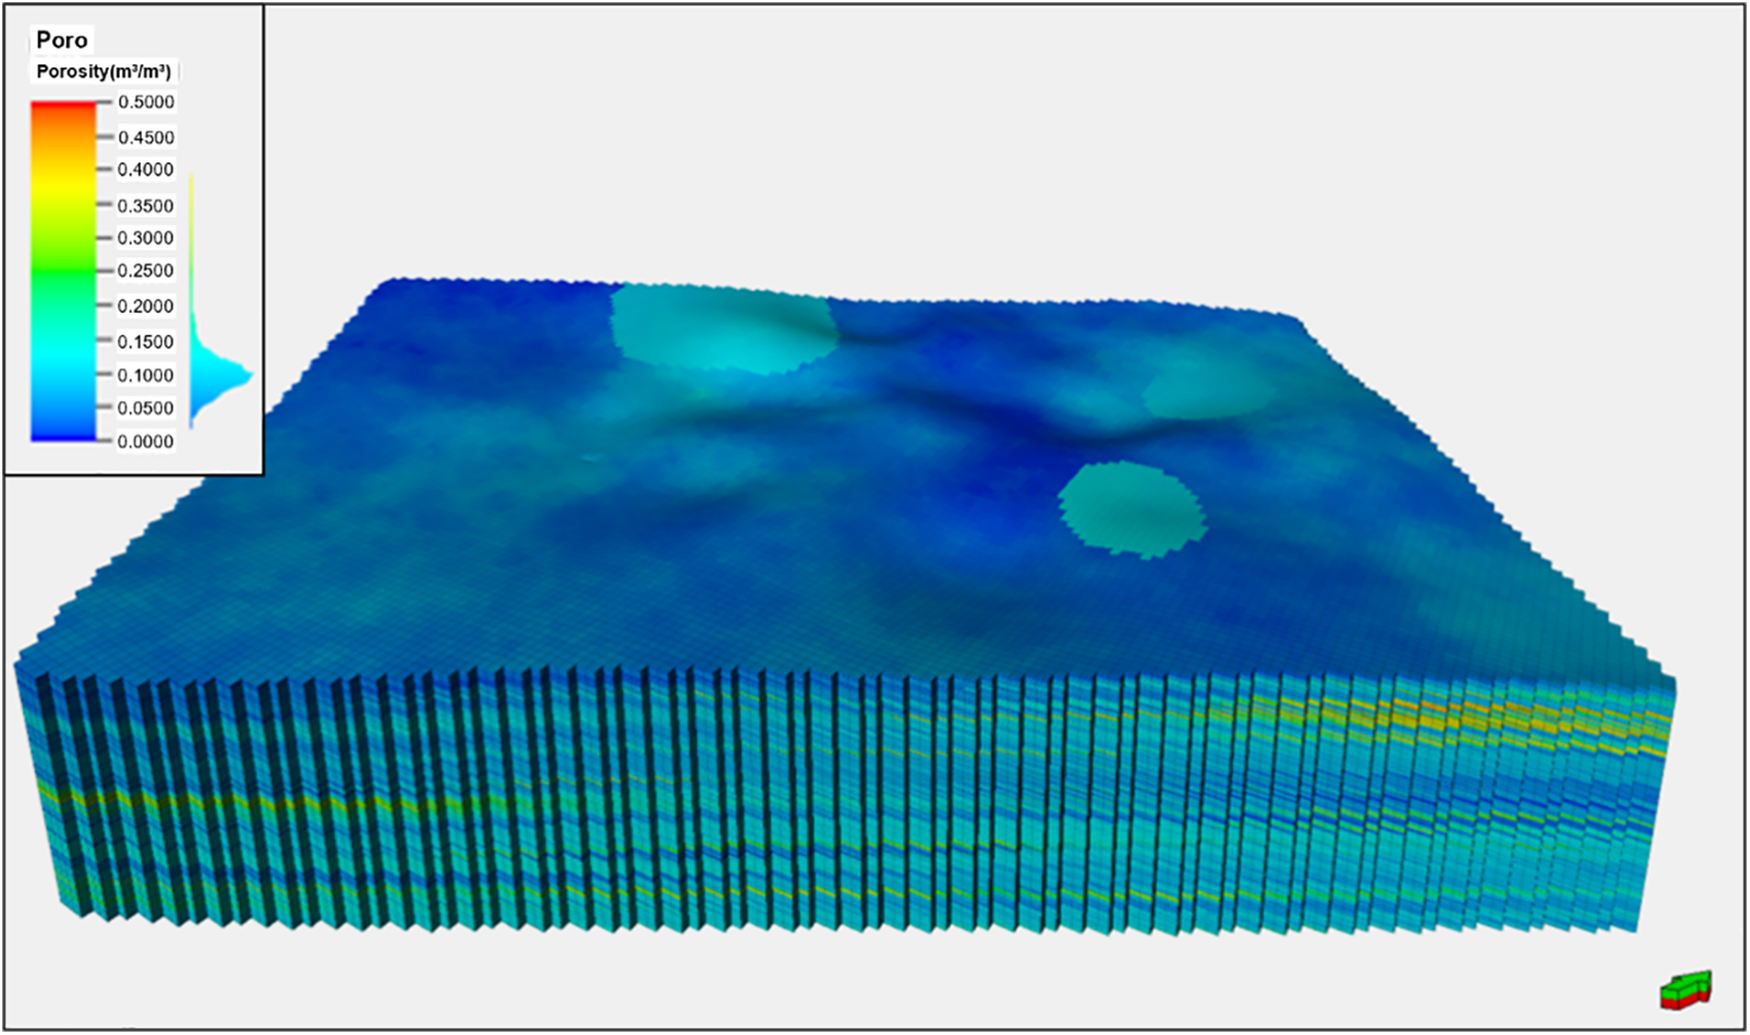
Figure 5: Schematic representation of the grid
Based on the field data, the economic limit method suggests that the horizontal section length should be greater than 500 m, while the cumulative production increment significantly decreases when the length exceeds 1200 m. Considering engineering factors such as the potential plugging after fracturing, the shallow burial depth of the studied area, and the limitations imposed by the self-weight of continuous oil pipes, it is suitable to limit the horizontal length to no more than 1200 m.
In the well spacing design, five well spacing scenarios were considered, ranging from 200 to 275 m, to explore the potential optimal well spacing range. According to the hydraulic fracturing simulation results in Fig. 6, it can be concluded that with a 260 m well spacing, the distance from the two edge wells, Well B and Well C, to the block boundary is approximately 130 m, which is half the well spacing. This configuration provides better reservoir control within the block. This observation is further confirmed in the production simulation results (shown in Fig. 7): when the well spacing is relatively close (200, 225, 250 m), the controlled area of the three wells is relatively small, making it challenging to extract oil and gas resources at the eastern and western boundaries of the target reservoir. Conversely, when the well spacing is relatively large (275 m), due to the narrow north-south extent of the target reservoir, Well C and Well B are too close to the boundary, resulting in less effective oil and gas recovery between the wells.
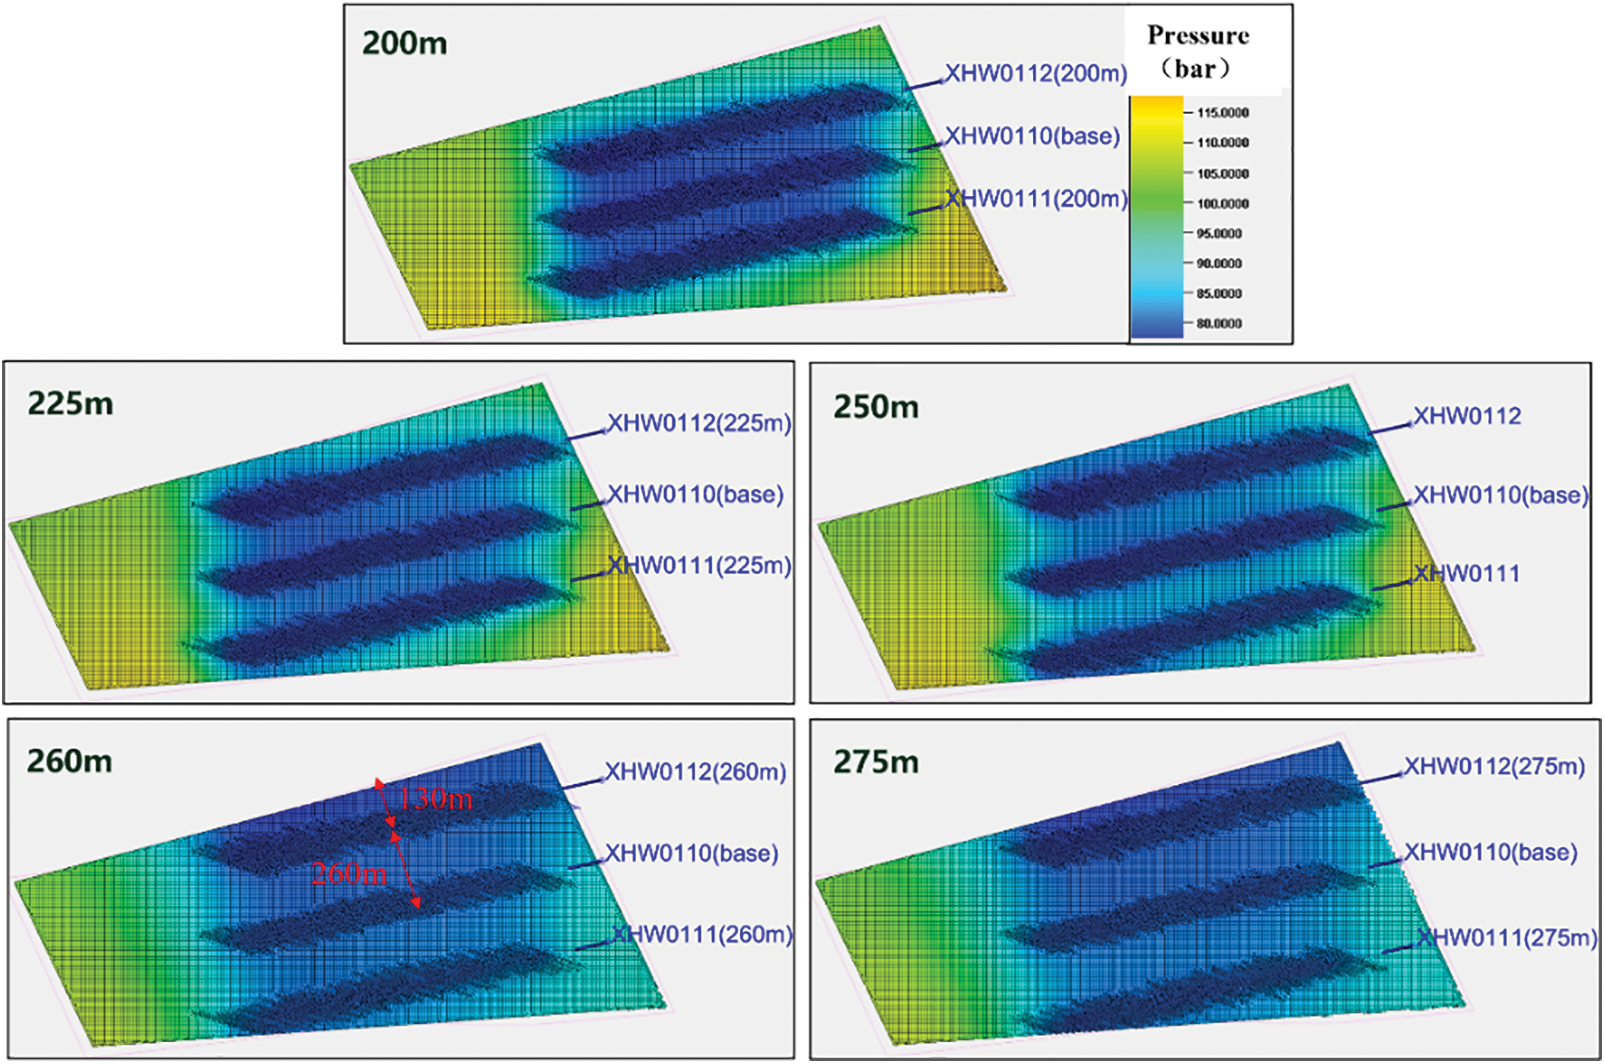
Figure 6: Illustrations of hydraulic fracturing and production simulations at different well spacings (pressure contour maps)
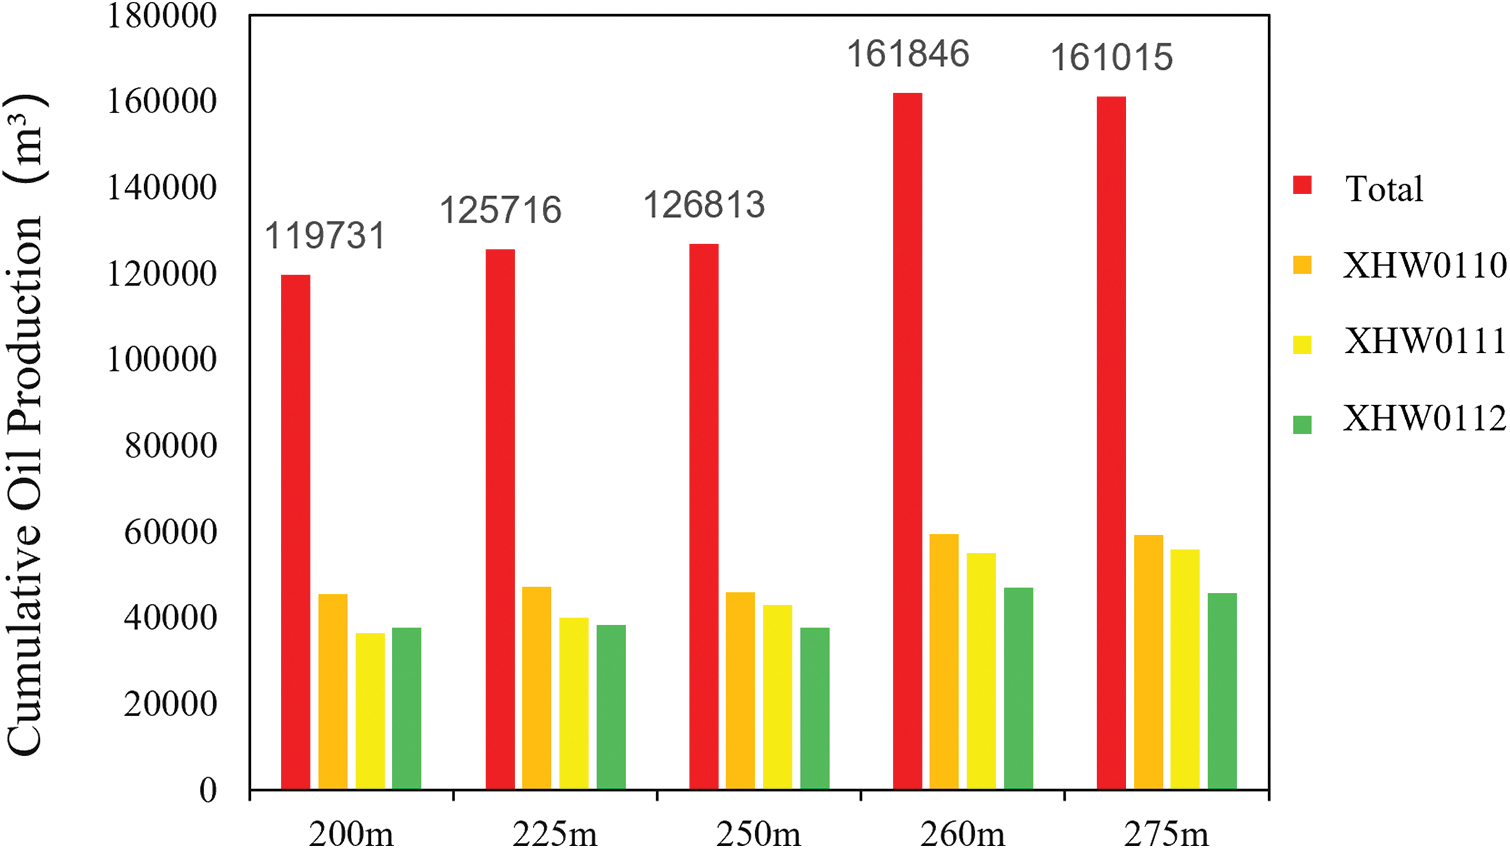
Figure 7: Comparison of cumulative oil production at different well spacings after 10 years
5.2 Design of Hydraulic Fracturing Stage Length
Based on the field data, the economic limit suggests that the length of the horizontal section should be greater than 500 m. However, there is a significant decrease in cumulative production increment after the length exceeds 1200 m. It is necessary to consider the issue of continuous oil pipe plugging after fracturing [28] and the relatively shallow burial depth of the XH018 block. The length of the horizontal section is limited by the self-weight of the continuous oil pipe. The appropriate horizontal length is suggested not to exceed 1200 m.
Taking all the factors into consideration, the appropriate length for the horizontal well in the XH018 block of the Badaowan formation is determined to be in the range of 600 to 1000 m. In the design of the hydraulic fracturing stage length, four sets of lengths are respectively set to 600, 800, 1000, and 1200 m to explore the l optimal length.
According to the hydraulic fracturing simulation results, it can be observed that as the length of the fracturing section increases, the production control range of the horizontal well also increases. Combining this with the production simulation (shown in Fig. 8), it can be concluded that as the length of the hydraulic fracturing section increases, the cumulative production of a single well also increases, but the rate of increase varies. The cumulative production is highest at a 1200-meter fracturing length, but the increment compared to the 1000-meter fracturing length is very small. Considering on-site construction factors, the preferred length for the hydraulic fracturing well is determined to be 1000 m. This is further confirmed by the pressure distribution map in Fig. 9, which indicates that when the fracturing length is 1200 m, there is a relatively small pressure drop around the bottom of the well, suggesting poorer reservoir properties in the western region and lower extraction efficiency.
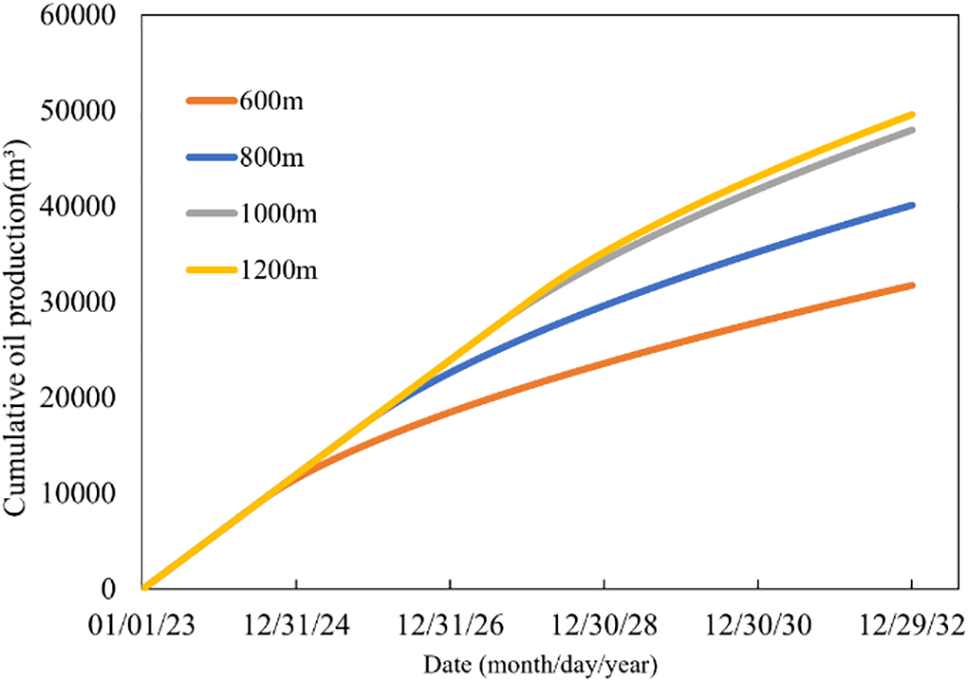
Figure 8: Different hydraulic fracturing stage length production simulation results (using cumulative oil production as an example)
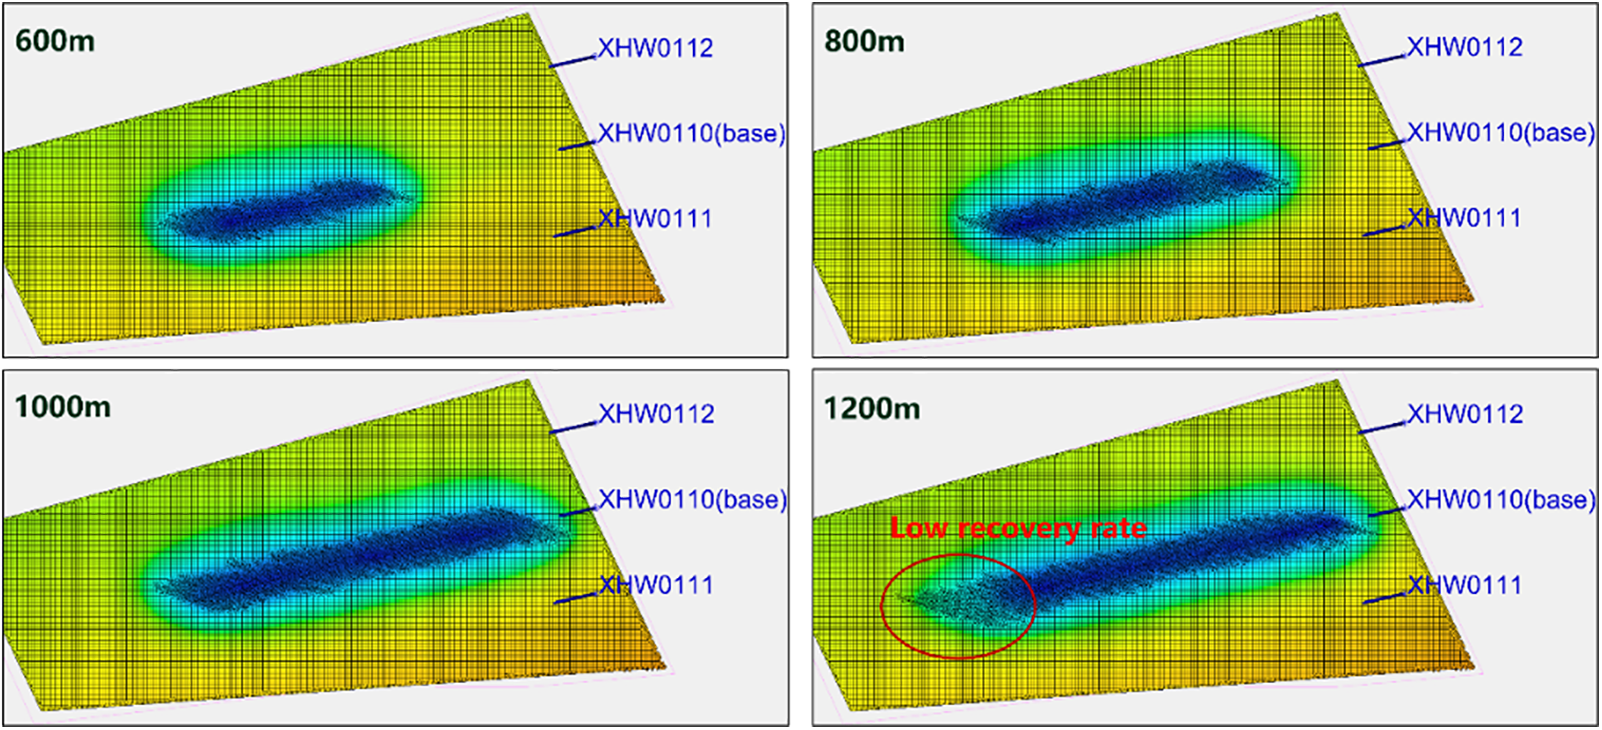
Figure 9: Pressure contour map for different hydraulic fracturing lengths after 10 years production
Based on the field data, the average cluster spacing for nearby horizontal well perforations is set in the range of 20.5 to 21.6 m. Subsequently, fracturing parameter simulations were conducted, and the primary segment cluster configuration was changed from a single segment with 3 clusters to a single segment with 6 clusters. The cluster spacing was set at 10 to 12 m. Therefore, in the cluster spacing design, four sets of basic cluster spacings were considered, which were 10.52, 13.15, 17.53, and 26.3 m, corresponding to single segments with 5 clusters, 4 clusters, 3 clusters, and 2 clusters, respectively.
Fracturing simulation results (shown in Fig. 10) indicate that, with a consistent fracturing fluid scale, having fewer clusters in a single segment (resulting in larger inter-cluster spacing) leads to larger individual cluster injection rates and longer hydraulic fractures. Examining the pressure distribution maps reveals that when only 2 clusters are present in a single segment, the cluster spacing is too large, causing inadequate recovery near the wellbore. On the other hand, using 5 clusters in a single segment leads to excessive stimulations in the near-well zone, resulting in poor fracture communication in the far-field area, thereby impacting overall production. Similarly, this pattern aligns with the findings of Ren et al. [29]. Taking all factors into account, the most optimal performance is achieved with a single segment containing 4 clusters.
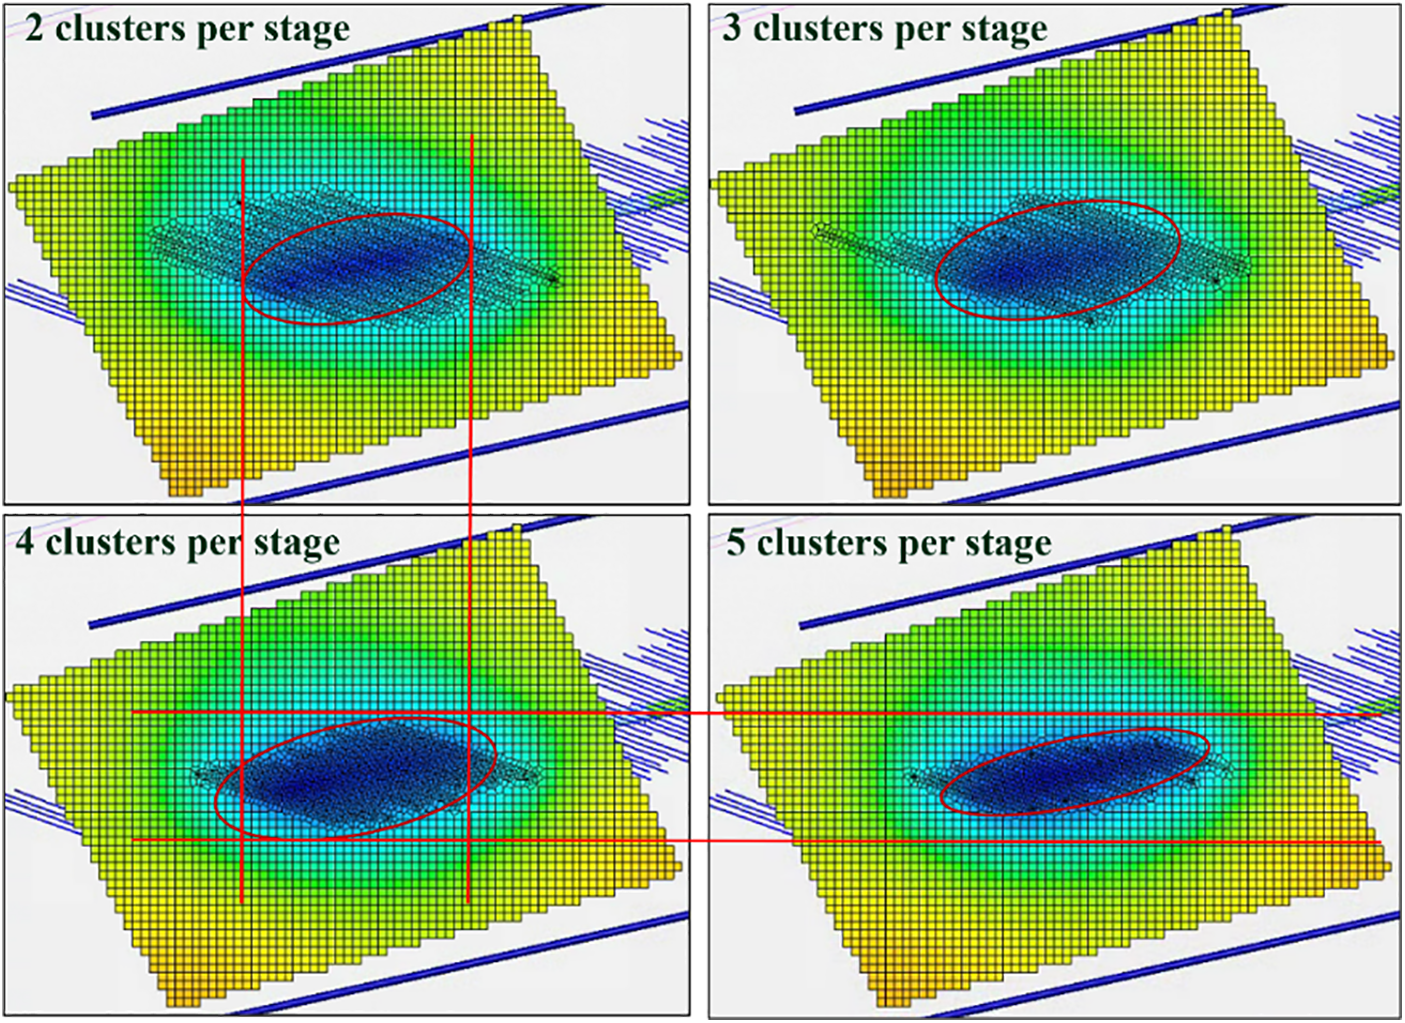
Figure 10: Pressure cloud maps for different cluster spacing after 10 years production
5.4 Fluid Volume and Proppant Design
For the reservoir, fracturing fluid is considered an invading fluid, and any residual fluid can result in further damage to the formation, impacting production performance. Additionally, a significant amount of backflow of fracturing fluid can lead to the return of proppants, reducing the conductivity of the fractures. Therefore, in hydraulic fracturing design, it is not a matter of more is better when it comes to fracturing fluid; instead, it should be considered in combination with the actual sand body size and the backflow of fracturing fluid.
Based on field data, neighboring wells have four different pump programs with varying liquid volume capacities: single-stage programs with 450, 600, 75, and 900 m3 liquid volumes. Therefore, in this study, four sets of liquid volumes were designed as 450, 600, 750, and 900 m3 to analyze their impact. In production simulation (shown in Fig. 11), it is observed that although higher liquid volumes lead to greater cumulative oil production, there is a diminishing rate of increase in cumulative oil production as the liquid volume increases (shown in Table 5 and Fig. 12). This is consistent with the understanding of Guo et al. [30].
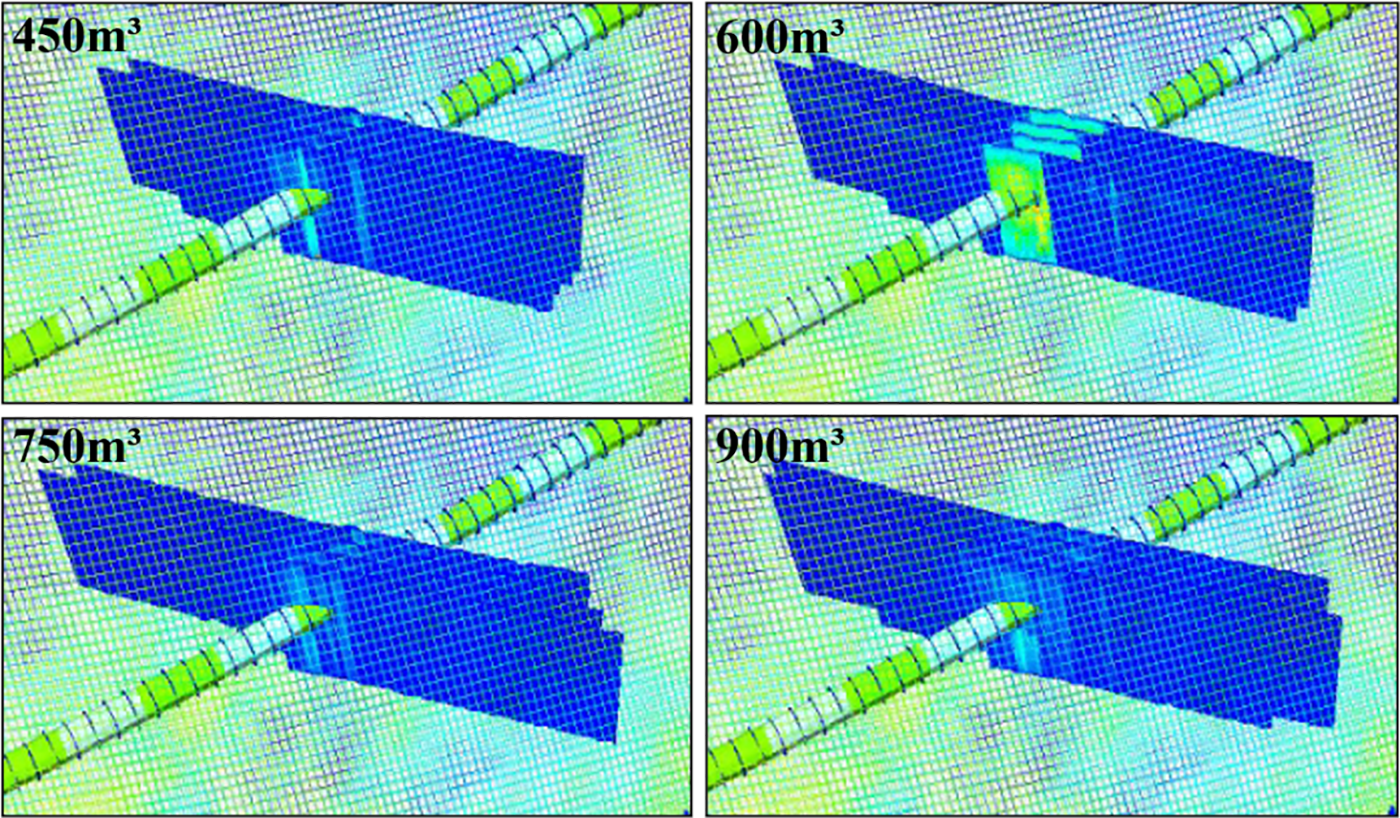
Figure 11: Different fracturing simulation diagrams with varying liquid volumes (3D view)
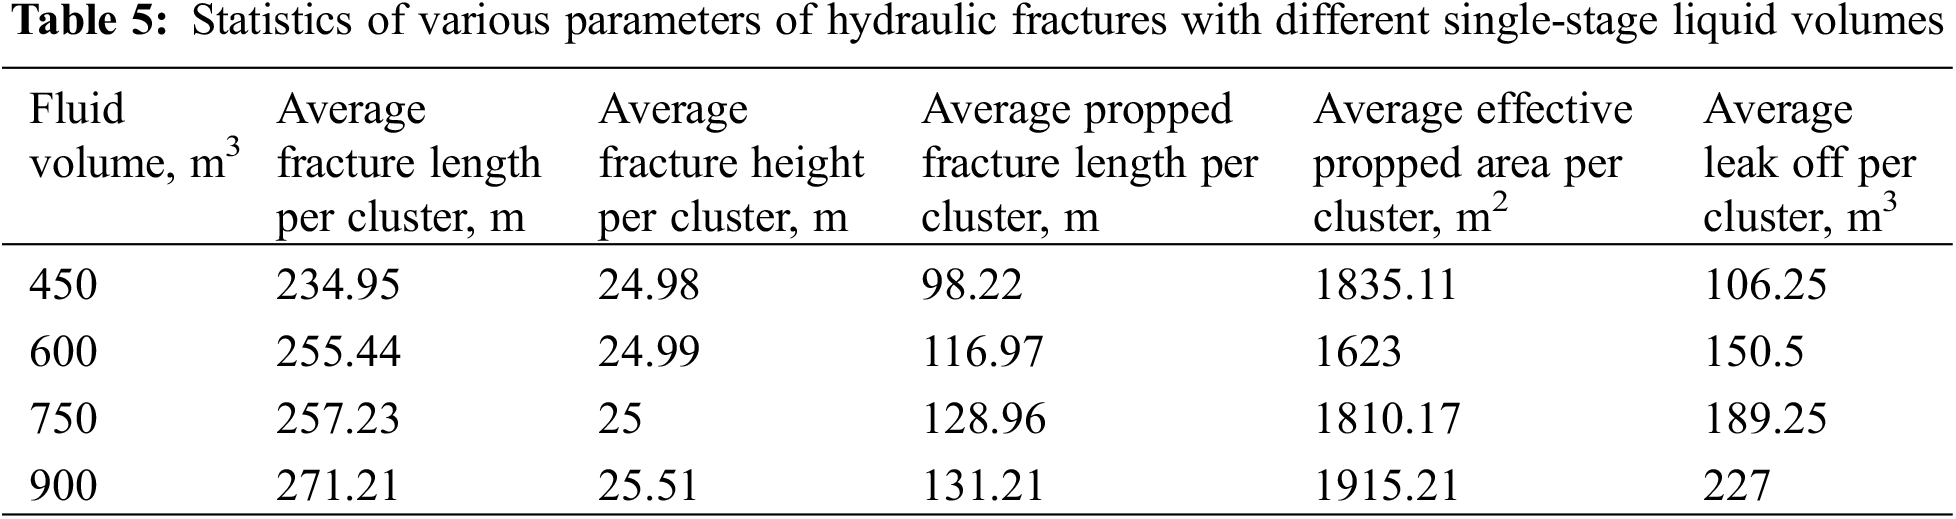
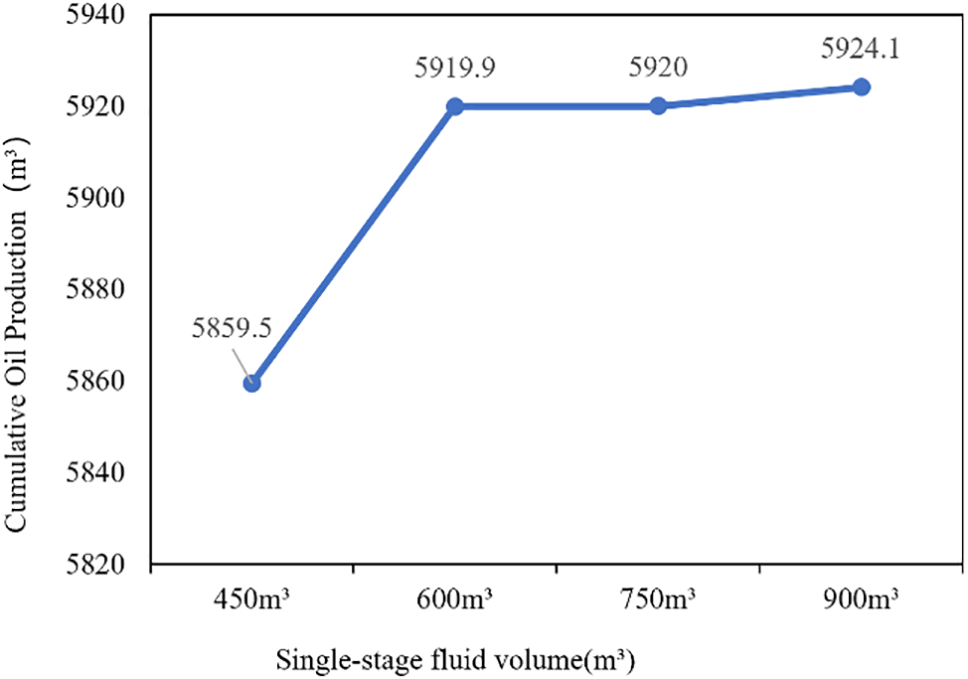
Figure 12: Cumulative oil production for different liquid volumes after 10 years production
The amount of proppant used is related to the expected fracture length, reservoir thickness, etc., and it significantly influences the geometry and conductivity of the fractures. During the fracturing process, proppants enter the fractures along with the fracturing fluid, providing support to prevent fracture closure, keeping the fractures open, and improving the reservoir’s conductivity in the vicinity of the fractures. Typically, higher proppant concentrations have a noticeable effect on the fracture conductivity, leading to improved production results [31–33].
Based on field data, neighboring well have four different proppant pump programs with varying proppant volume capacities, specifically single-stage programs with 65, 85, 105, and 125 m3 proppant volumes (shown in Table 6). Therefore, in this study, the proppant volume was also designed as single-stage programs with 65, 85, 105, and 125 m3. Similar to the pattern observed in the liquid volume design, it is observed that higher proppant intensity leads to increased cumulative oil production. However, beyond a certain point, increasing proppant volume results in a diminishing rate of increase in cumulative oil production (shown in Figs. 13 and 14).
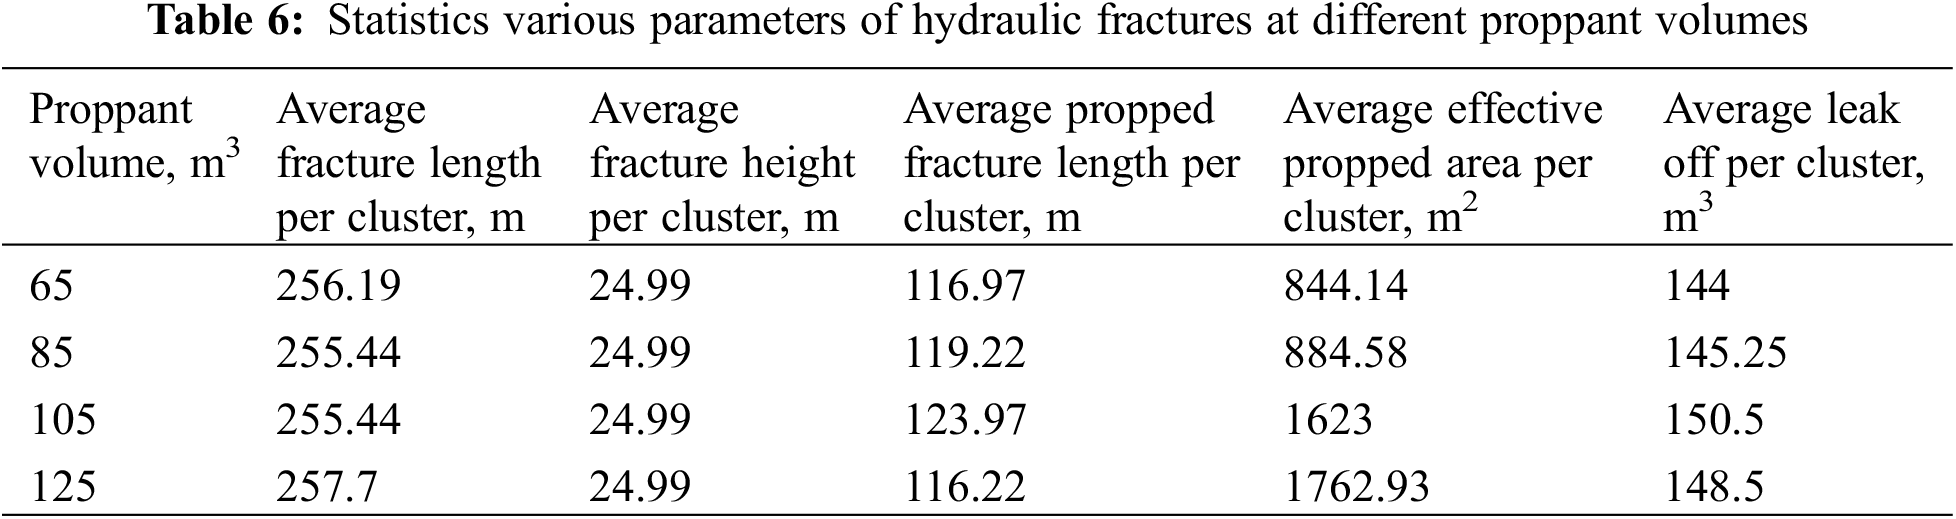
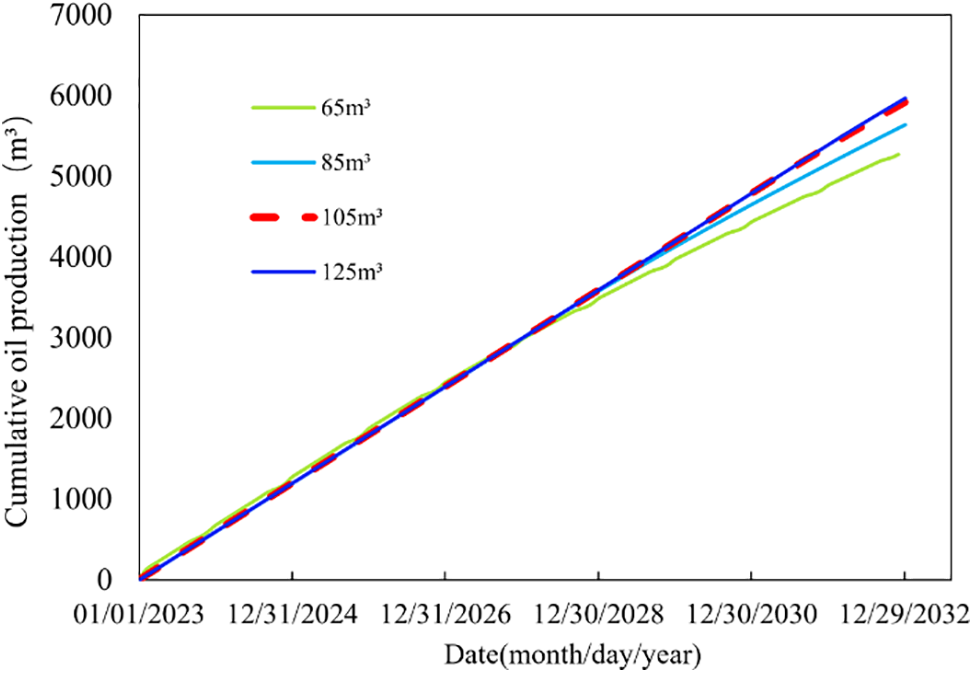
Figure 13: Production simulation results at different proppant volumes (using cumulative oil production as an example)
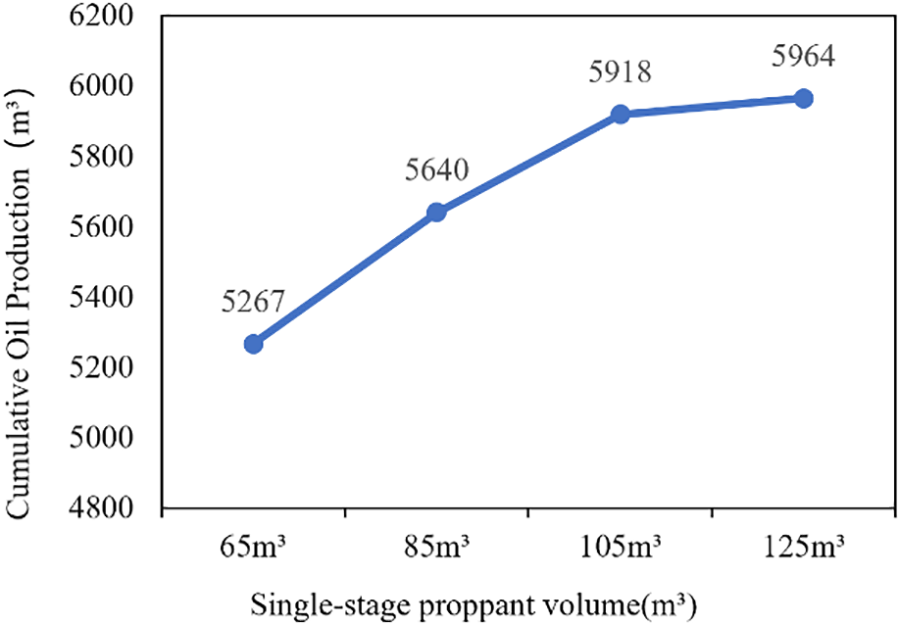
Figure 14: Cumulative oil production for different proppant volumes after 10 years prodution
5.5 Design of CO2 Injection Volume in the Pre-Fracturing Fluid
The relationship between the injection volume of CO2 for each segment in the horizontal well is obtained based on reservoir parameters. After the injection volume for each segment exceeds 120 m3, the increase in cumulative production from additional injection becomes marginal. Referring to the preliminary CO2 injection in the horizontal wells in the Ji7 area, which was around 200 m3 for alternate segments, and taking into account the on-site CO2 supply and transportation capabilities, an injection volume of approximately 90–120 m3 of CO2 for each segment is determined in the horizontal well.
Therefore, this paper sets the pre-fracturing CO2 injection volume for each segment as 90, 100, 110, and 120 m3, respectively. Using the 10th segment of well XHW0110 as an example for fracturing simulation, the fracturing results are shown in Fig. 15. With an increasing CO2 injection volume, the fracture extension becomes longer, and the SRV (Stimulated Reservoir Volume) becomes larger. Among the four design options, the single-segment injection of 120 m3 CO2 achieves the largest SRV, but the improvement in fracture volume from 110 to 120 m3 is relatively small (shown in Table 7 and Fig. 16). This is generally consistent with the relationship between pre-injection CO2 liquid volume and stimulated volume studied by Tong [34]. Considering on-site factors, it is advisable to choose 110 m3 of CO2 injection.
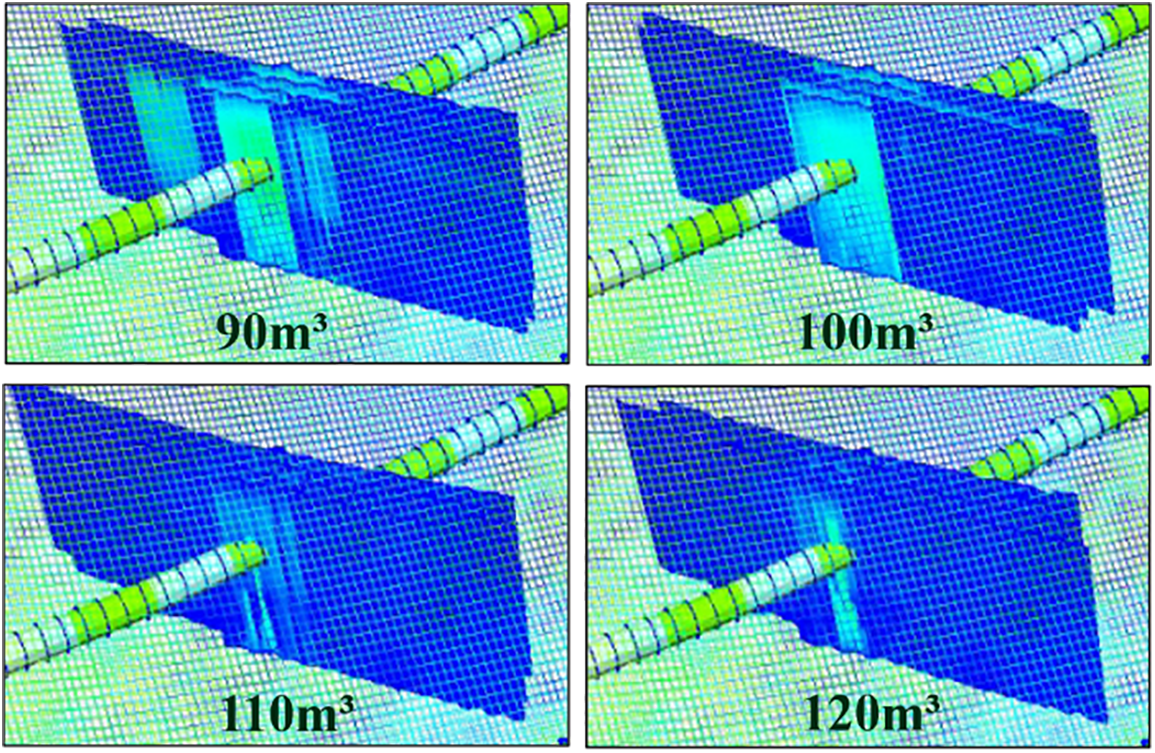
Figure 15: Hydraulic fracturing simulation with different single-segment CO2 injection volumes (3D view)
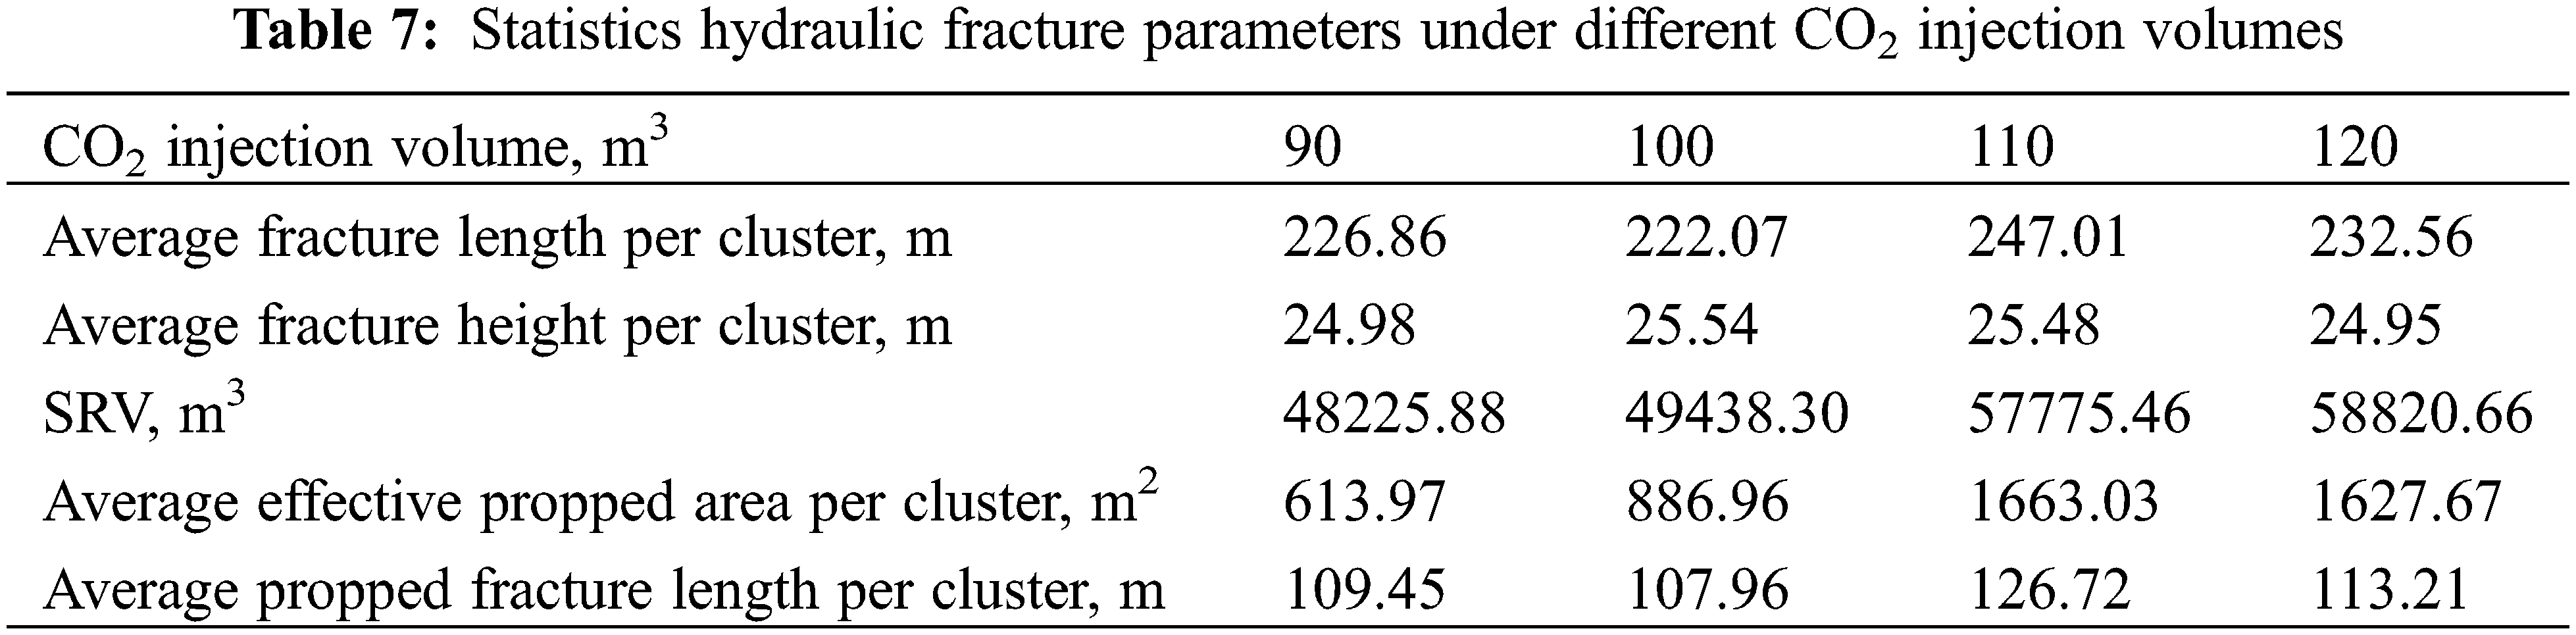
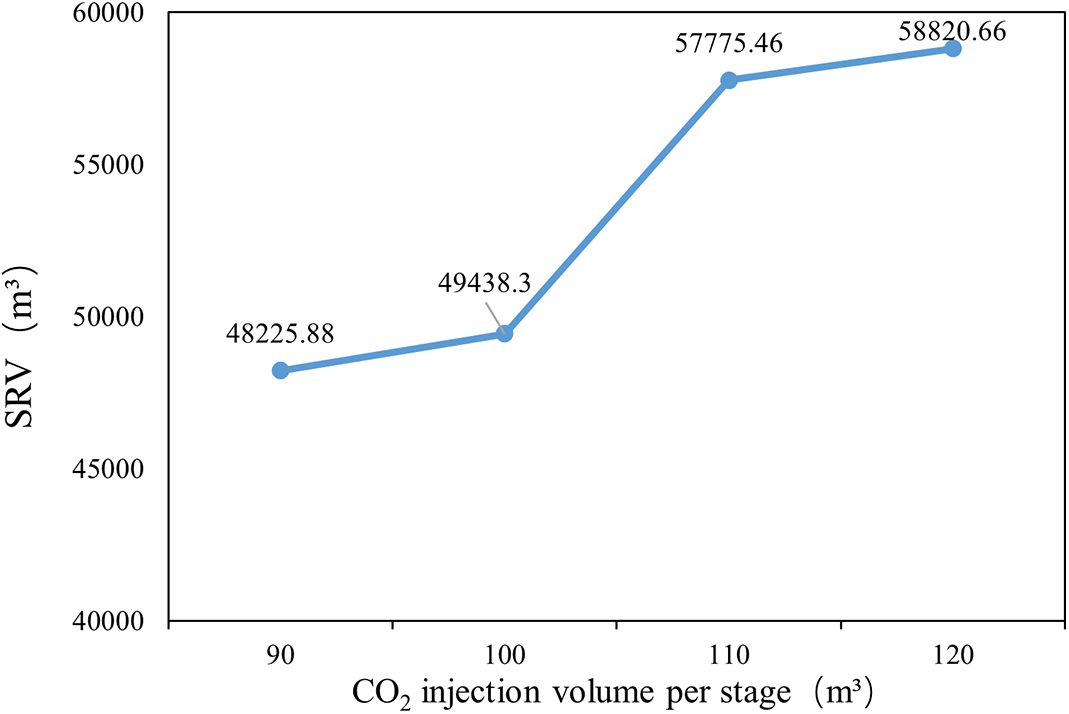
Figure 16: Stimulated reservoir volume (SRV) under different single-stage CO2 injection volumes
However, due to the commercial nature of the Petrel platform which lack its technical documentation regarding the mechanistic aspects of CO2 as fracturing fluid, the mechanistic understanding of the effects of CO2 fracturing is not clear. This limitation introduces a certain level of constraint in our study.
This study investigates the optimization design process of pre-CO2 energy storage hydraulic fracturing in heavy oil reservoir development and applies it in the Wuxia Fault Zone area on the northwestern margin of the Junggar Basin. The following are the main conclusions of this study:
1. The optimization design process proposed in this study, based on the Petrel platform, includes steps such as geological modeling, geomechanical modeling, hydraulic fracturing simulation, and production simulation. It contributes to the efficiency of on-site well placement and fracturing design. Through this process, reasonable fracturing parameters, such as cluster spacing, fracturing fluid volume, proppant intensity, and well spacing, can be determined to enhance production efficiency. This study utilized Petrel as an integrated simulation platform, offering enhanced visualization of simulation results compared to other platforms.
2. Over 60 different cases were established for optimizing well spacing, horizontal well segment fracturing length, cluster spacing, fracturing fluid volume, proppant volume, and CO2 injection volume. The final optimized results are as follows: well spacing of 260 meters; horizontal well segment length of 1000 meters; cluster spacing of 13.15 meters; single-stage fracturing fluid volume of 600 m3; single-stage proppant volume of 105 m3; and single-stage CO2 injection volume of 110 m3. These conditions resulted in the highest cumulative oil production according to production simulations.
3. This research provides a systematic optimization design method for the pre-fracturing CO2 storage in heavy oil reservoirs, offering robust support for future unconventional reservoir development and CO2 management. Through the comprehensive integration of geology, geomechanics, and numerical simulation, we aim to make contributions to the sustainable development of the oil and gas industry and environmental protection.
Acknowledgement: None.
Funding Statement: This work is supported by the Cutting-Edge Project Foundation of Petro-China (Cold-Based Method to Enhance Heavy Oil Recovery) (Grant No. 2021DJ1406) and Open Fund (PLN201802) of National Key Laboratory of Oil and Gas Reservoir Geology and Exploitation (Southwest Petroleum University).
Author Contributions: The authors confirm contribution to the paper as follows: study conception and design: Xiding Gao, Binrui Wang, Hong Dong; data collection: Hong Dong, Xinqi Zhang, Qian Wang, Haipeng Xu, Chengguo Gao; analysis and interpretation of results: Xiding Gao, Binrui Wang; draft manuscript preparation: Xiding Gao. All authors reviewed the results and approved the final version of the manuscript.
Availability of Data and Materials: The datasets generated during and/or analyzed during the current study are available upon request from the corresponding author. For additional materials and inquiries, please contact 202221000833@stu.swpu.edu.
Conflicts of Interest: The authors declare that they have no conflicts of interest to report regarding the present study.
References
1. Zou CN, Yang Z, He DB, Wei YS, Li J, Jia AL, et al. Theory, technology and prospects of conventional natural gas. Petrol Explor Dev. 2018;45(4):575–87 (in Chinese). [Google Scholar]
2. Guo QL, Wu N, Yan W, Chen NS. An assessment method for deep gas resources. Acta Petrolei Sinica. 2019;40(4):383–94 (in Chinese). doi:10.7623/syxb201904001. [Google Scholar] [CrossRef]
3. Zou CN, Dong DZ, Wang YM, Li XJ, Huang JL, Wang SF, et al. Shale gas in China: characteristics, challenges and prospects. Petrol Explor Dev. 2015;42(6):689–701. [Google Scholar]
4. Yang ZC, Lu YB, Yang G, Huang C, Yi DL, Jia S, et al. Pre-CO2 energy storage fracturing technology in horizontal wells for medium-deep heavy oil. Lithol Reserv. 2024;36(1):178–84. [Google Scholar]
5. Mollaali M, Ziaei-Rad V, Shen Y. Numerical modeling of CO2 fracturing by the phase field approach. J Nat Gas Sci Eng. 2019;70:102905. doi:10.1016/j.jngse.2019.102905. [Google Scholar] [CrossRef]
6. Wang HZ, Li GS, Zheng Y, Sepehrnoori K, Shen ZH, Yang B, et al. Research status and prospects of supercritical CO2 fracturing technology. Acta Petrolei Sinica. 2020;41(1):116–26 (in Chinese). [Google Scholar]
7. Shen Z, Wang H, Li G. Feasibility analysis of coiled tubing drilling with supercritical carbon dioxide. Petrol Explor Dev. 2010;37(6):743–7. doi:10.1016/S1876-3804(11)60008-6. [Google Scholar] [CrossRef]
8. Wang HZ, Shen ZH, Li GS. Feasibility analysis on shale gas exploitation with supercritical CO2. Petrol Drill Tech. 2011;39(3):30–5 (in Chinese). [Google Scholar]
9. Denny D. Thirty years of gas-shale fracturing: what have we learned? J Petrol Tech. 2010;62(11):88–90. doi:10.2118/1110-0088-JPT. [Google Scholar] [CrossRef]
10. Zhang DX, Yang TY. Environmental impacts of hydraulic fracturing in shale gas development in the United States. Petrol Explor Dev. 2015;42(6):801–7. [Google Scholar]
11. Clark CE, Horner RM, Harto CB. Life cycle water consumption for shale gas and conventional natural gas. Environ Sci Tech. 2013;47(20):11829–11836. doi:10.1021/es4013855. [Google Scholar] [PubMed] [CrossRef]
12. Hyman JD, Jimenez-Martinez J, Viswanathan HS, Carey JW, Porter ML, Rougier E, et al. Understanding hydraulic fracturing: a multi-scale problem. Philosoph Trans Royal Soc A: Math, Phys Eng Sci. 2016;374(2078). doi:10.1098/rsta.2015.0426. [Google Scholar] [PubMed] [CrossRef]
13. Chu H, Liao X, Chen Z, John Lee WJ. Rate-transient analysis of a constant-bottomhole-pressure multihorizontal well pad with a semianalytical single-phase method. SPE J. 2020;25(6):3280–99. doi:10.2118/203842-PA. [Google Scholar] [CrossRef]
14. Li L, Sheng JJ, Sheng J. In optimization of huff-n-puff gas injection to enhance oil recovery in shale reservoirs. In: SPE low perm symposium, society of petroleum engineers. Dencer, Colorado, USA; 2016. [Google Scholar]
15. Li L, Guo X, Zhou M, Chen ZX, Zhao L, Wang LSY. Numerical modeling of fluid flow in tight oil reservoirs considering complex fracturing networks and Pre-Darcy flow. J Petrol Sci Eng. 2021;207:109050. doi:10.1016/j.petrol.2021.109050. [Google Scholar] [CrossRef]
16. Wang S, Chen S. Insights to fracture stimulation design in unconventional reservoirs based on machine learning modeling. J Petrol Sci Eng. 2019;174:682–95. doi:10.1016/j.petrol.2018.11.076. [Google Scholar] [CrossRef]
17. Li X, Xiao K, Li XB, Yu CY, Fan DY, Sun ZX. A well rate prediction method based on LSTM algorithm considering manual operations. J Petrol Sci Eng. 2022;210:110047. doi:10.1016/j.petrol.2021.110047. [Google Scholar] [CrossRef]
18. Salah M, Ibrahim M. Engineered fracture spacing staging and perforation cluster spacing optimization for multistage fracturing horizontal wells. In: SPE Annual Technical Conference and Exhibition; 2018; Dallas, Texas, USA. [Google Scholar]
19. Prévost JH, Sukumar N. Faults simulations for three-dimensional reservoir-geomechanical models with the extended finite element method. J Mech Phys Solids. 2016;86:1–18. doi:10.1016/j.jmps.2015.09.014. [Google Scholar] [CrossRef]
20. Nguyen BN, Hou ZS, Stewart ML, Murray CJ, Bonneville A. Thermal impact of CO2 injection on geomechanical response at the FutureGen 2.0 Site: a three-dimensional thermo-geomechanical approach. Int J Greenh Gas Con. 2016;54:29–49. doi:10.1016/j.ijggc.2016.08.026. [Google Scholar] [CrossRef]
21. Lu CH, Jiang HQ, Qu SY, Zhang M, He JX, Xiao K, et al. Hydraulic fracturing design for shale oils based on sweet spot mapping: a case study of the Jimusar formation in China. J Petrol Sci Eng. 2022;214:110568. doi:10.1016/j.petrol.2022.110568. [Google Scholar] [CrossRef]
22. Weng X, Kresse O, Cohen CE, Wu R, Gu H. Modeling of hydraulic fracture network propagation in a naturally fractured formation. In: SPE Hydraulic Fracturing Technology Conference; 2011; Society of Petroleum Engineers, Woodlands, Texas, USA. [Google Scholar]
23. Olson JE. Predicting fracture swarms—the influence of subcritical crack growth and the crack-tip process zone on joint spacing in rock. Geologic Soc London Special Pub. 2004;231(1):73–88. doi:10.1144/GSL.SP.2004.231.01.05. [Google Scholar] [CrossRef]
24. Cipolla CL, Lewis RE, Maxwell SC, Mack MG. Appraising unconventional resource plays: separating reservoir quality from completion effectiveness. In: International Petroleum Technology Conference; 2011; Bangkok, Thailand. [Google Scholar]
25. Li L, Tan JQ, Wood DA, Zhao ZG, Becker D, Lyu Q, et al. A review of the current status of induced seismicity monitoring for hydraulic fracturing in unconventional tight oil and gas reservoirs. Fuel. 2019;242:195–210. doi:10.1016/j.fuel.2019.01.026. [Google Scholar] [CrossRef]
26. Vo Thanh H, Sugai Y, Nguele R, Sasaki K. Integrated workflow in 3D geological model construction for evaluation of CO2 storage capacity of a fractured basement reservoir in Cuu Long Basin, Vietnam. Int J Greenhouse Gas Con. 2019;90:102826. doi:10.1016/j.ijggc.2019.102826. [Google Scholar] [CrossRef]
27. AlRassas AM, Vo Thanh H, Ren S, Sun RY, Lee KK, Hai NLN. Integrated static modeling and dynamic simulation framework for CO2 storage capacity in Upper Qishn Clastics, S1A reservoir, Yemen. Geomech Geophy Geo-Energy Geo-Res. 2022;8:2. doi:10.1007/s40948-021-00305-x. [Google Scholar] [CrossRef]
28. Zhang HM, Vo Thanh H, Rahimi M, Watheq J, Al-Mudhafar WJ, Tangparitkul S, et al. Improving predictions of shale wettability using advanced machine learning techniques and nature-inspired methods: implications for carbon capture utilization and storage. Sci Total Envir. 2023;877:162944. doi:10.1016/j.scitotenv.2023.162944. [Google Scholar] [PubMed] [CrossRef]
29. Ren L, Lin R, Zhao JZ. Cluster spacing optimal design for staged fracturing in horizontal shale gas wells based on optimal SRV. Nat Gas Ind. 2017;37:69–79. [Google Scholar]
30. Guo J, Liang H, Zhao Z. An optimal design of multi-stage fracking for horizontal shale gas wells: a case study from the western Sichuan Basin. Nat Gas Ind. 2013;33:82–6. [Google Scholar]
31. Vo Thanh H, Sugai Y, Sasaki K. Application of artificial neural network for predicting the performance of CO2 enhanced oil recovery and storage in residual oil zones. Sci Rep. 2020;10:18204. doi:10.1038/s41598-020-73931-2. [Google Scholar] [PubMed] [CrossRef]
32. Cho J, Kim TH, Chang N, Lee KS. Effects of asphaltene deposition-derived formation damage on three-phase hysteretic models for prediction of coupled CO2 enhanced oil recovery and storage performance. J Petrol Sci Eng. 2019;172:988–97. doi:10.1016/j.petrol.2018.09.006. [Google Scholar] [CrossRef]
33. Patel S, Wilson I, Sreenivasan H, Krishna S. Numerical simulations of proppant transportation in cryogenic fluids: implications on liquid helium and liquid nitrogen fracturing for subsurface hydrogen storage. Int J Hydrogen Energ. 2024;56:924–36. doi:10.1016/j.ijhydene.2023.12.268. [Google Scholar] [CrossRef]
34. Tong L. Research on fracturing optimization of horizontal wells in shale oil (Ph.D. Thesis). Northeast Petroleum University: China; 2022. [Google Scholar]
Cite This Article
 Copyright © 2024 The Author(s). Published by Tech Science Press.
This work is licensed under a Creative Commons Attribution 4.0 International License , which permits unrestricted use, distribution, and reproduction in any medium, provided the original work is properly cited.
 Downloads
 Citation Tools