
 Submit a Paper
 Propose a Special lssue
 Open Access
ARTICLE

Impact of Varying Blower Opening Degrees on Indoor Environment and Thermal Comfort
1 UR LASMIS, Université de Technologie de Troyes, 12 Rue Marie Curie, Troyes, 10300, France
2 EPF Campus de Troyes, Rosière-prés-Troyes, 10430, France
3 Construction Engineering Department, École de Technologie Supérieure (ÉTS), University of Québec, 1100 Rue Notre-Dame Ouest, Montreal, QC H3C 1K3, Canada
4 LMT/ENS-Paris-Saclay/CNRS, Université Paris Saclay, Gif-sur-Yvette, 91190, France
* Corresponding Author: Shengqiang Shi. Email:
(This article belongs to the Special Issue: Materials and Energy an Updated Image for 2023)
Fluid Dynamics & Materials Processing 2024, 20(8), 1703-1716. https://doi.org/10.32604/fdmp.2024.050547
Received 09 February 2024; Accepted 11 April 2024; Issue published 06 August 2024
 View Full Text
 Download PDF
Abstract
At present, air handling units are usually used indoors to improve the indoor environment quality. However, while introducing fresh air to improve air quality, air velocity has a certain impact on the occupants’ thermal comfort. Therefore, it is necessary to explore the optimization of air-fluid-body interaction dynamics. In this study, the indoor air flow was changed by changing the opening and closing degree of the blower, and the thermal manikin is introduced to objectively evaluate the human thermal comfort under different air velocities. The main experimental results show that the air change rate increases with the increase of the opening and closing degree of the blower considering an ACH (air changes per hour) range between 3.8 and 10. For a better prediction, a linear correlation with a coefficient of 0.995 is proposed. As the blower’s opening is adjusted to 20%, 25%, 30%, 35%, and 40%, the air velocity sensor positioned directly beneath the air inlet records average velocities of 0.19, 0.20, 0.21, 0.28, and 0.34 m/s over four hours, respectively. Observations on thermal comfort and the average sensation experienced by individuals indicate an initial increase followed by a decline when the blower’s operation begins, with optimal conditions achieved at a 35% opening. These findings offer valuable insights for future indoor air ventilation and heat transfer design strategies.Keywords
Ventilation systems in buildings are currently becoming more popular due to their ability to ensure renewable air [1,2] and the use of advanced airflow systems [3,4]. People are more aware of the extent to which the spread of viruses can be prevented by ventilation systems, more specifically in the post-epidemic era. On the other hand, the use of ventilation systems as an alternative to opening windows and doors can reduce the risk of property damage inside buildings [5,6]. From the point of view of thermodynamics and fluid mechanics, air disturbance can better take away the sensible heat in the room, which has become one of the highlights of the ventilation system [4].
Consequently, an increasing amount of research is being conducted on the performance of ventilation systems, air flow rates, air quality, and the comparison of various ventilation systems to fulfill people’s requirements. Kong et al.’s [7] study compared the performance of the intermittent stratum ventilation (LTR-ISV) system with conventional mixing ventilation. It was found that LTR-ISV indoor CO2 concentrations could be reduced by 400 ppm and the risk of airborne transport could be reduced by a factor of 5.35. The LTR-ISV performance factor during working hours and the exergy efficiency during non-working hours were higher. Song et al. [8] used a combination of questionnaires and physiological experiments to explore the effect of air velocity on thermal comfort in a thermal environment. At a velocity (va) of 1.2 m/s, there is a potential to decrease the percentage of thermal dissatisfaction by up to 20% compared to when va is at 0.6 m/s. Additionally, with the increase in va to 1.2 m/s, the upper limit of the acceptable operating temperature rises by 2°C compared to the condition when va is at 0.6 m/s.
Lin et al. [9] carried out computations of space cooling loads and system energy consumption by using TRNSYS for a typical configuration of offices, classrooms and retail outlets in Hong Kong. The energy-saving potential of stratum ventilation, compared to mixing ventilation and displacement ventilation, primarily arises from three factors: reduced ventilation and transmission loads, along with an improved Coefficient of Performance (COP) of the chillers. Notably, year-round energy savings are considerable, with a minimum reduction of 25% and 44% compared to displacement ventilation and mixing ventilation, respectively.
Cho et al. [10] assessed the effectiveness of a dual-mode ventilation system (incorporating both mechanical and natural ventilation strategies) by tracking indoor air quality indicators (such as temperature, humidity, and CO2 concentrations) and energy usage in a multifamily residential building. Their observations revealed that this humidity-responsive hybrid ventilation system not only preserved high levels of indoor air quality but also used less electricity than other high-efficiency ventilation options, including mechanical ventilation with heat recovery (MVHR).
However, in addition to the consideration of indoor environmental factors and the optimization of energy consumption within the building, it is also important to study the correlation between air fluid and thermal comfort. Based on this, this study introduces different air velocities by turning on the air handling unit system and controlling the blower at different levels of operation. To do so, a thermal manikin is used to objectively assess the indoor environment in order to determine the optimum operating conditions. The research results can provide reference for the use of air handling systems for Indoor Environment Quality (IEQ).
2.1 Experimental Test Cell Facility
Number of experiments were conducted at the EPF engineering school in Troyes, France, utilizing the outdoor experimental platform depicted in Fig. 1. Fig. 1a shows a physical picture of the outdoor platform from an external view, and it can be seen from Fig. 1b that this platform comprises three contiguous chambers: the testing chamber (Fig. 1c), the control chamber (Fig. 1d), and the technical chamber (Fig. 1e). These chambers have respective areas of 17, 10.6, and 10.6 m2, with consistent roof-to-floor heights of 2.5 m across all. Fig. 1f presents a schematic representation of the outdoor experimental platform from various perspectives. The whole platform is equipped with an air handler unit (AHU), a control system managing environmental parameters and orientation of the outdoor experimental platform, an array of measurement sensors, and a data collection system. The specific specifications of the outdoor experimental platform can be found in the [11].
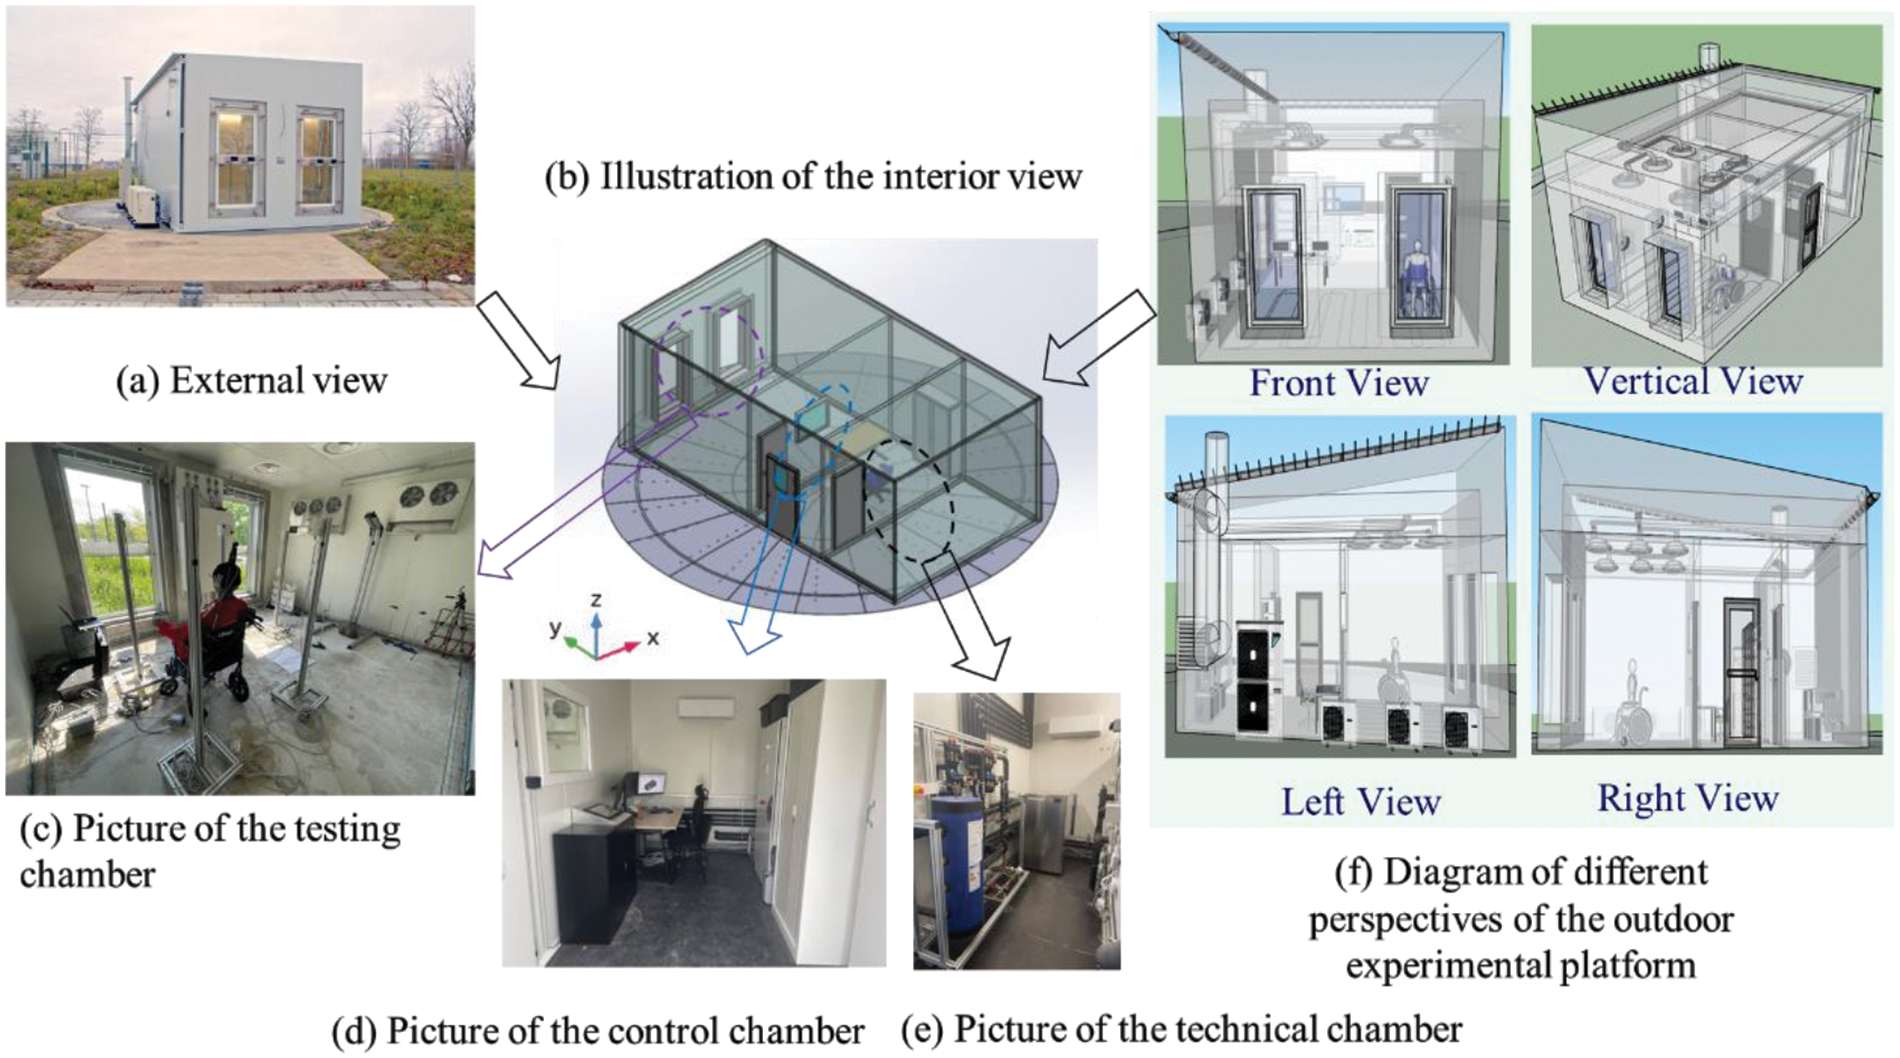
Figure 1: Outdoor experimental platform. (a) External views; (b) outdoor experimental platform; (c) indoor view; (d) testing chamber; (e) control chamber; (f) technical chamber
Fig. 2 shows the AHU and its operating schematic diagram. It consists of two ventilation ducts, louvers that control the air volume, two blowers (one placed at the inlet and the other at the return air outlet), a humidifier, a buffer chilled water tank and other components.
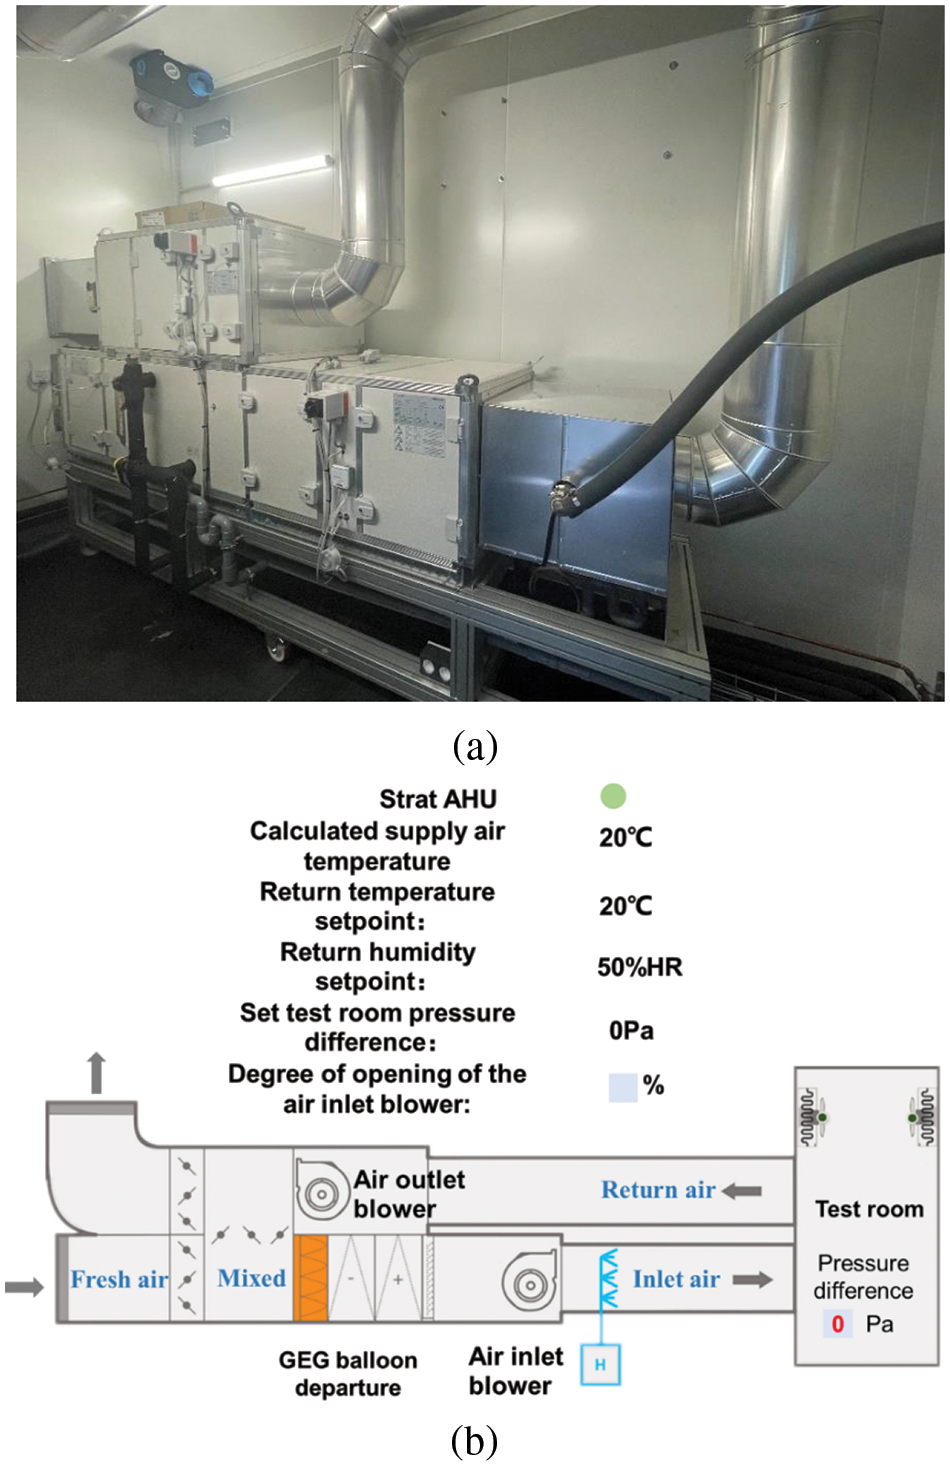
Figure 2: Air handle unit description. (a) Air handle Unit in the technical room; (b) Control panel of AHU system in the control room
The AHU system can set the amount of fresh air (controlling the opening degree of the louvers), total air volume, air temperature and relative humidity entering the test room, the indoor air temperature and indoor air pressure difference through the control panel (Fig. 2b). The supplied air temperature is controlled by means of hot and cool water coils operating as water/air heat exchangers to heat or cool the test room using air flow. In this study, the hot-water coil was activated and the cold-water coil was deactivated to meet the winter indoor air temperature requirements.
The system control is set according to the need for fresh air volume per hour so that fresh air enters the duct through the intake and mixes with the air in the return air duct. Then, according to the demand of the required blowing temperature, the mixed air through the buffer chilled water tank temperature decreased or increased. After that, the air that meets the temperature requirements is supplied into the test room by setting different opening degrees of the inlet blower. The air in the test room is finally partially extracted out of the room due to the suction of the blower in the return air passage, and partially mixed with the newly entered air again.
Individuals perceive heat and cold differently within the same setting, making it challenging to objectively assess indoor comfort solely through human feedback. Utilizing the thermal manikin Newton®, however, offers an accurate and replicable method for evaluating thermal comfort parameters under varying and non-uniform conditions, accommodating both male and female physiological responses. As depicted in Fig. 3a, the manikin responds dynamically to the test room’s environmental changes, boasting 34 independently controlled heat zones. Equipped with heaters and temperature sensors, as illustrated in Fig. 3b, the manikin can simulate metabolic heat output rates. Additionally, for thermal resistance measurements, the system features an electrically heated surface embedded with temperature sensors.
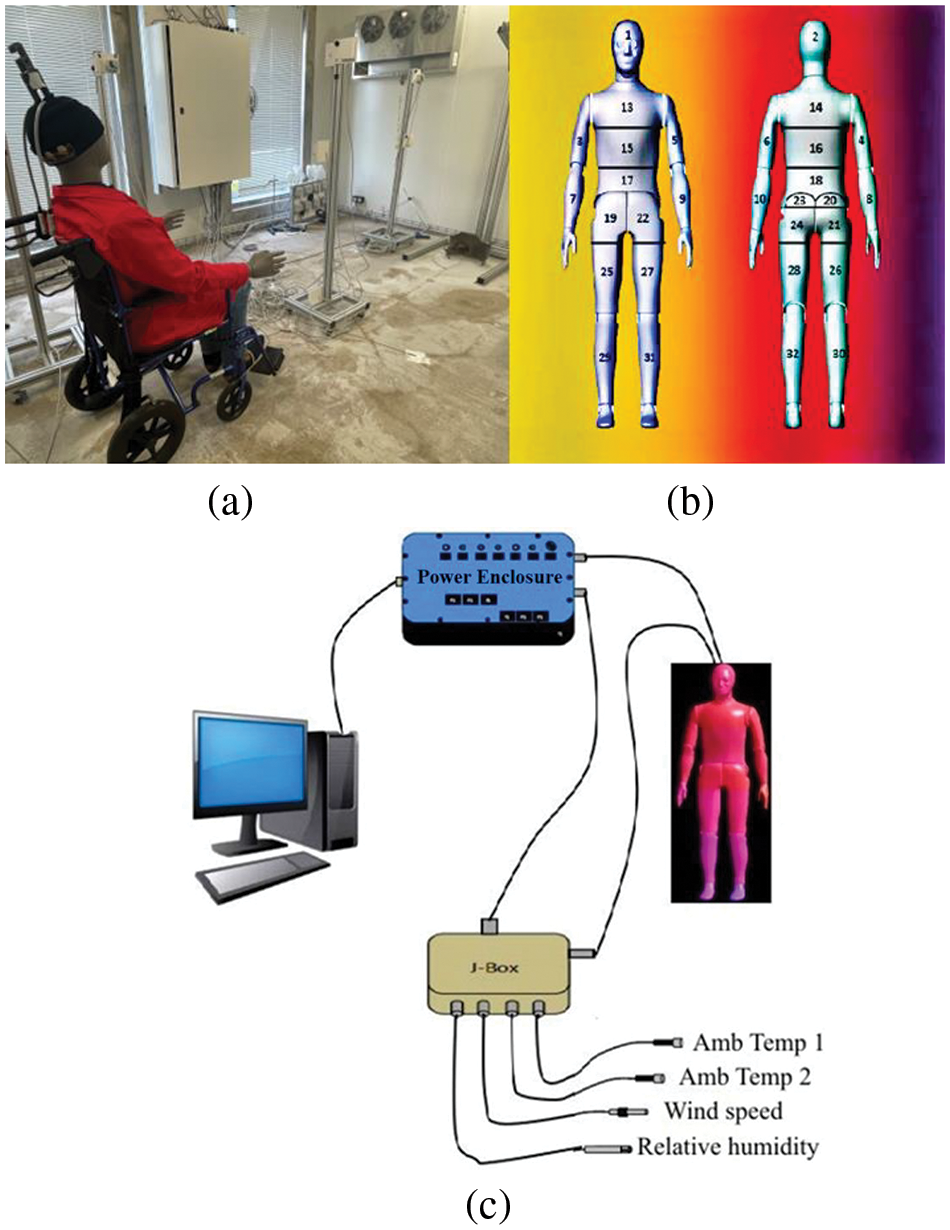
Figure 3: Thermal Manikin Newton® and its various configurations: (a) The thermal manikin is seated in a wheelchair. (b) It showcases the thermal zones of the manikin. (c) A schematic diagram of the monitoring system is presented
Fig. 3c showcases the thermal manikin Newton’s supplementary components, including:
1. Ambient sensors: Consisting of two ambient temperature sensors, a relative humidity sensor, and an air velocity sensor. Table 1 depicts their characteristics.
2. Ambient sensor J-Box: Serving as the data-logger for the ambient sensors.
3. Software:
-ThermDAC8: A Windows-based control and data acquisition software facilitating thermal control, fault detection, system configuration, calibration, real-time data display, and logging.
-ManikinPCTM: Physiological and comfort control software enabling the Newton manikin to simulate human physiological responses [12]. This software utilizes a human body model coupled with real-time data exchange to predict the physiological state in subsequent time intervals [13]. It calculates relative comfort and sensation for each zone and as a total body average, as depicted in Fig. 4.
4. Power enclosure: Housing all power supplies and USB connections.

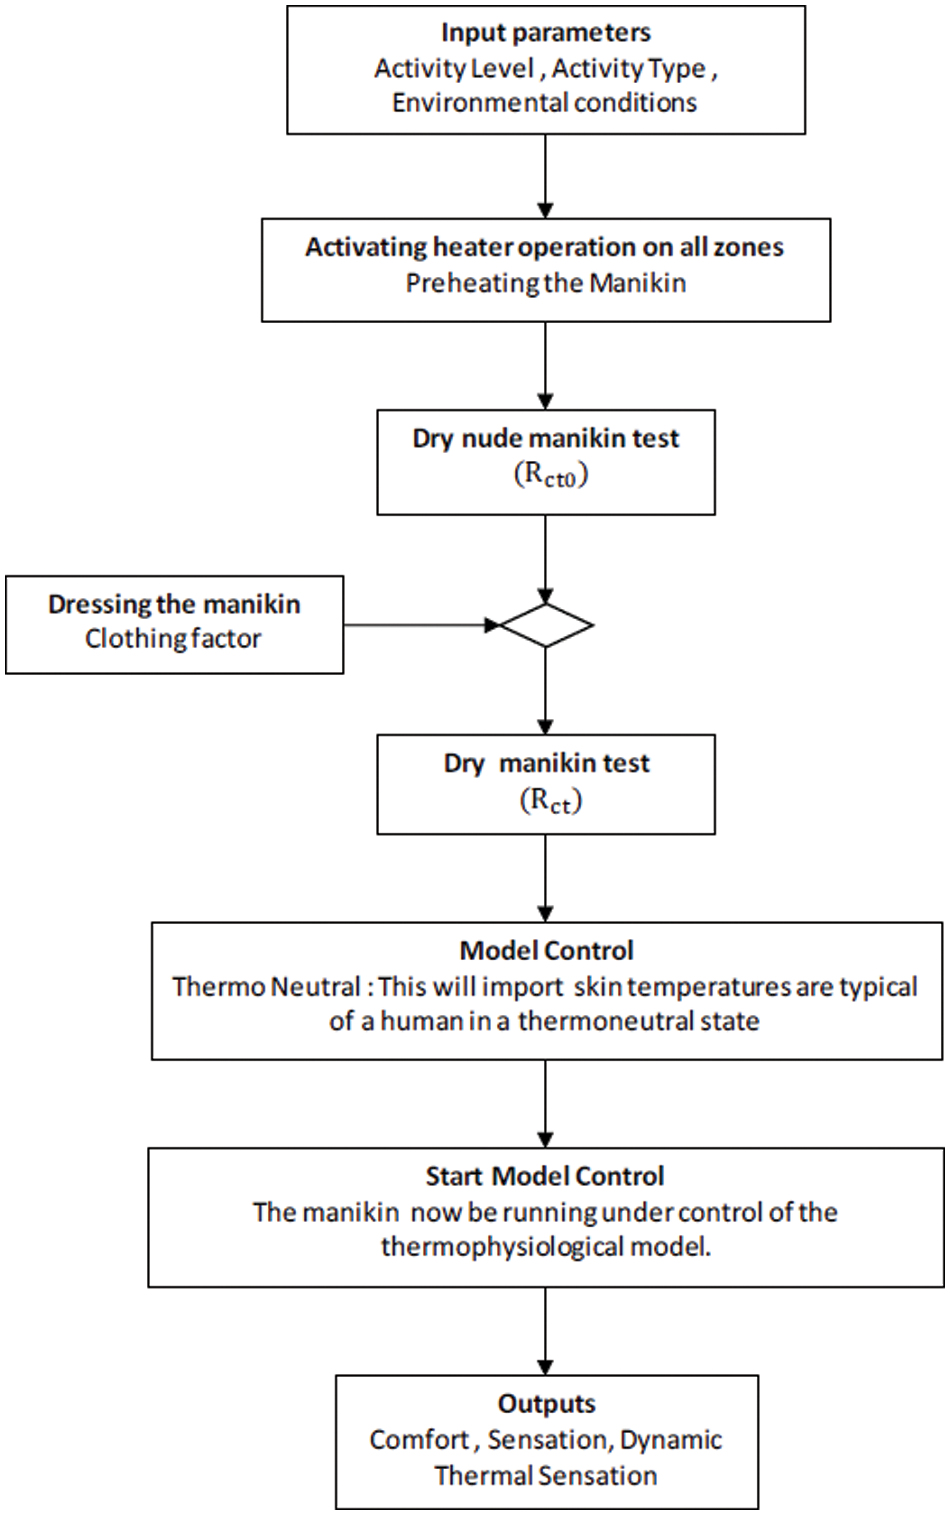
Figure 4: The specific process of obtaining body average comfort and body average sensation during the experiment
The Thermal Manikin facilitates fully automated testing compliant with standards such as ASTM F1291, ASTM F1720, ASTM F2370, ASTM F2371, EN 342, EN 13537, and ISO/DIS 15831. Irrespective of the application or indoor environmental conditions, this system reliably outputs thermal comfort parameters.
When analyzing thermal comfort and thermal sensation, predicted average vote (PMV) and predicted percentage of dissatisfaction (PPD) are commonly used to evaluate [14,15]. Among these, the PMV index is derived from the consideration of human thermal load (TL), which indicates the extent of deviation from thermal balance. When the human body achieves a state of comfort through convection and radiation heat dissipation, it is considered in a comfortable state. Conversely, the human body experiences a thermal load when it deviates from this equilibrium. TL is defined as the rate of heat storage in the body, representing the difference between heat production and dissipation. The theoretical foundation lies in the idea that in a stable thermal environment, a higher heat load leads to a greater deviation from thermal comfort. In other words, a higher positive TL value corresponds to a warmer sensation, while a more negative TL value corresponds to a colder sensation. The formula for PMV is as follows:
with,
In the formula, M is the metabolic rate, W/m2; W is the effective mechanical power, W/m2; Pa is the partial pressure of water vapor in the air around the human body, Pa; ta is the air temperature around the human body, °C; fcl is the ratio of the surface area of a clothed person to the surface area of a naked person; Icl is the clothing thermal resistance, (m2·K)/W; tcl is the temperature of the outer surface of human clothing, °C; tr is the mean radiant temperature of the room (MRT), °C; hc is the surface heat transfer coefficient, W/(m2·K), var is the indoor air velocity, m/s. Among them, the MRT can reflect the degree of radiation heat exchange between the occupant’s body and the indoor environment, which is extremely prominent. On this basis, the operative temperature derived from the air temperature and the MRT takes into account the effects of convection and radiation heat transfer.
PPD is an indicator calculated based on PMV that represents the percentage of people who are likely to feel dissatisfied under a given environmental condition, calculated by Eq. (5).
Based on the aforementioned equations, by utilizing a thermal human body model to calculate and output indicators of thermal comfort and thermal sensation, these results will ultimately be compared with the scales proposed by Zhang to analyze indoor thermal comfort. The thermal comfort and sensation scales are shown in Table 2 [16]. Thermal sensation is a term introduced here to describe the perception of temperature by individuals. Specifically, during hot seasons, individuals seek refreshment, and they tend to feel comfortable when experiencing a cooler sensation, indicated by a negative thermal sensation index. This comfort is reflected by an index close to 0. More details about the manikin are discussed in [17–19].

2.4 Measurement Arrangement and Instruments
Fig. 5 illustrates the dimensions of the test room along with the arrangement of the measuring points. As shown, in the test chamber there are three air supply vents and three air exhaust vents, which are positioned in a straight line. To determine the impact of air velocity change on thermal comfort, in this study we placed the thermal manikin below the exhaust vents. Indeed, in this case, if the comfort of the thermal manikin is unsatisfied, then obviously the impact is more important if it is placed below the supply vents, in the heating season. To monitor the air velocity, one sensor was placed near the shoulder of the thermal manikin, and the second one was placed directly below the air outlet.
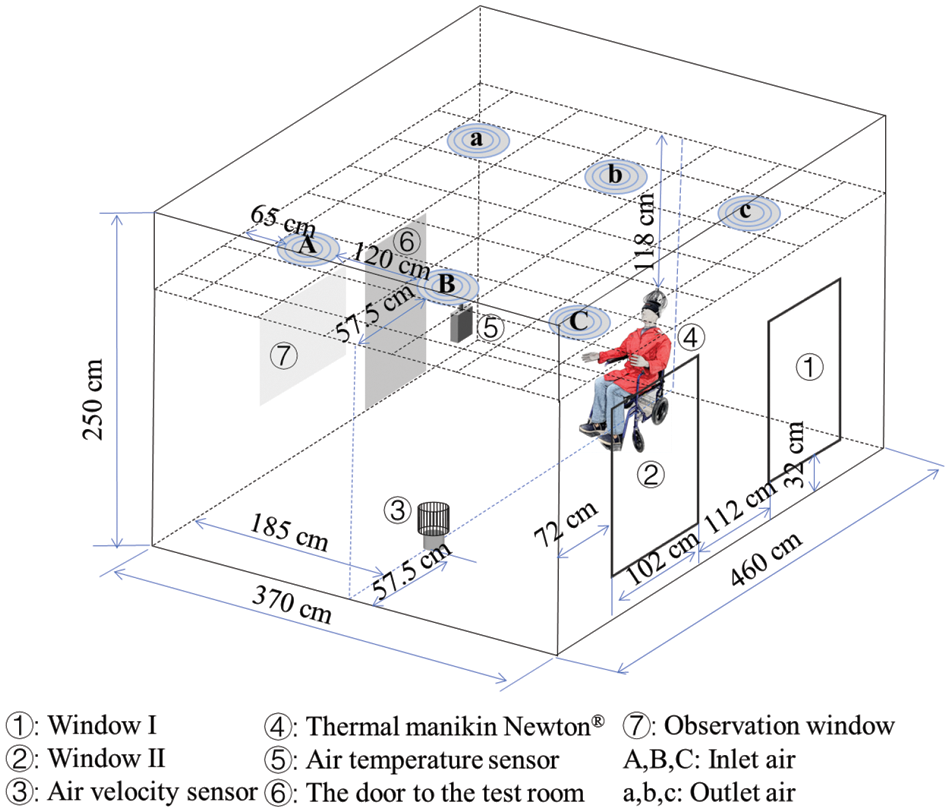
Figure 5: Layout of manikin in outdoor experiment
As depicted in Fig. 6 and in accordance with the ISO standard [20], Ambient temperature 1 and Ambient temperature 2 sensors were positioned 1.1 m from the head and 0.1 m from the ankles of the manikin. This configuration enables the assessment of temperature distribution at both the head and the ankles in a seated posture. Additionally, the relative humidity sensor and air velocity sensor were situated on the shoulder of the manikin to measure humidity and air velocity in close proximity to the manikin, and the specific characteristics of the corresponding instruments are shown in Table 3. Following this setup, the next step involves analyzing the comfort levels of indoor residents during prolonged sitting periods lasting four hours under varying degrees of blower opening.
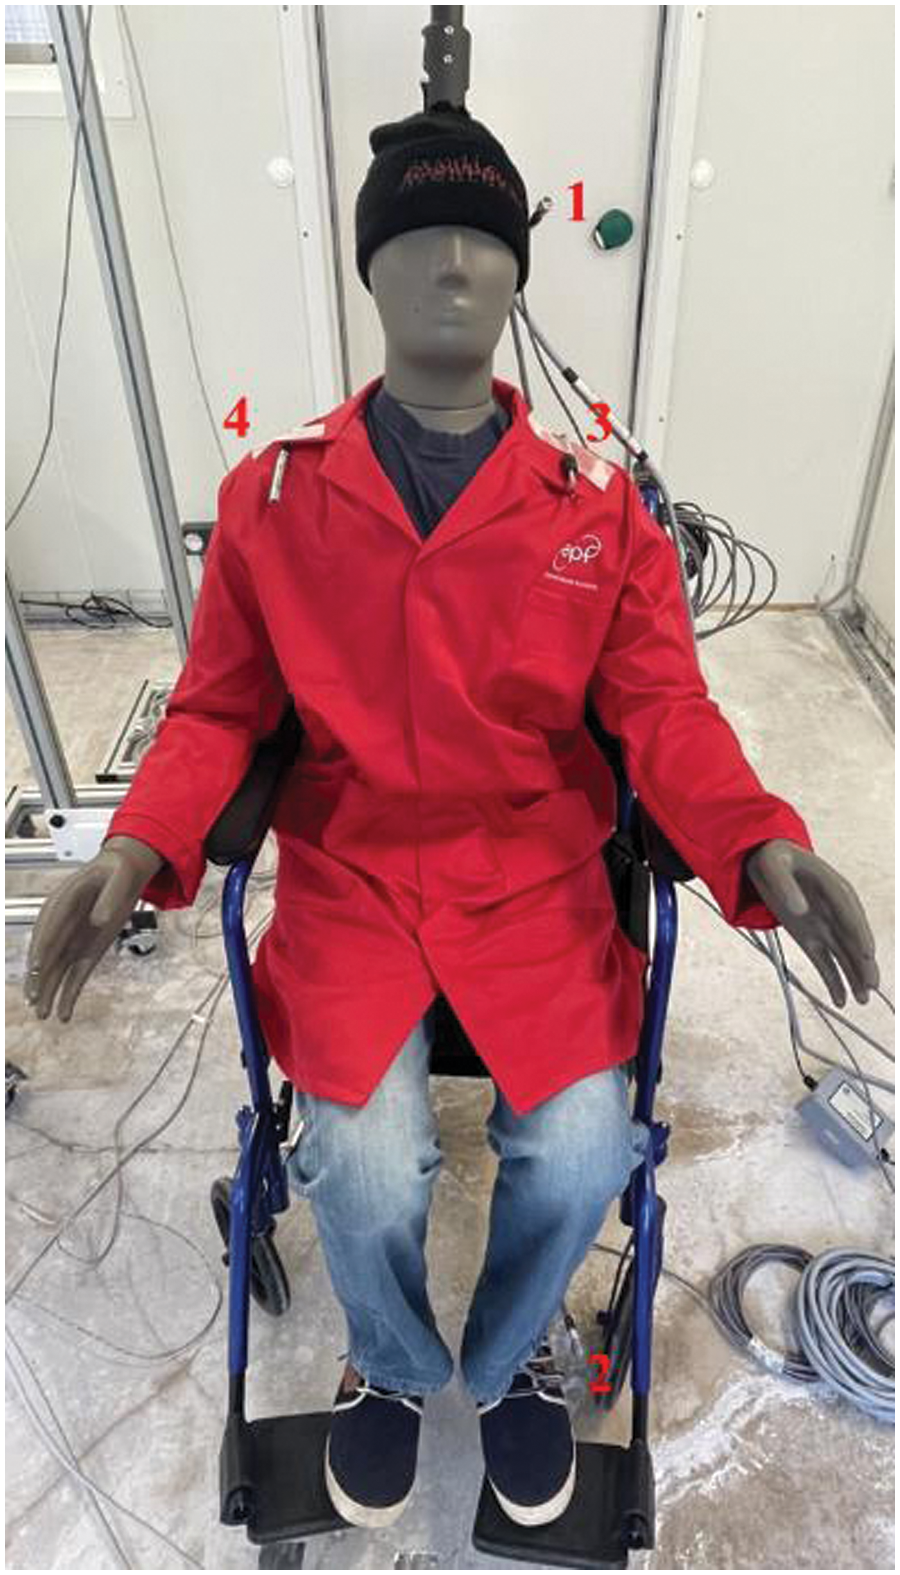
Figure 6: Location of the ambient sensors on the manikin. The Amb Temp1 sensor and Amb Temp2 sensor are placed on the head and ankle of the manikin, corresponding to 1 and 2 in the figure. The air velocity sensor and relative humidity sensor are placed on the shoulder of the manikin, corresponding to 3 and 4 in the figure, respectively

To meet the indoor air quality requirements for winter, in our experiment, we adjusted the temperature and humidity settings through the control panel inside the control room, setting the temperature at 20°C and the relative humidity at 50%. Additionally, to achieve a balance between the inlet and return air, thereby maintaining the pressure inside the laboratory at 0 Pa, we modified the opening degree of the blower to alter the air volume at the air inlet. The experimental flow is illustrated below:
(1) The control panel alarm is used as a basis to determine the limit value of the blower opening under experimental conditions, with a minimum value of 18% and a maximum value of 48%.
(2) Within these limitations, 20%, 25%, 30%, 35%, and 40% blower opening levels were selected for research, and comfort was evaluated using thermal manikin under these five operating conditions.
Obviously, the greater the degree of opening of the blower, the greater the air flow rate into the test room, and the corresponding air exchange volume is also larger. Therefore, the relationship between the opening and closing degree of the blower and the ventilation volume is discussed. By obtaining experimental data, the variation trend between the opening and closing degree of the blower and the air change rate is coupled, as shown in Fig. 7. The correlation coefficient between experimental data and predicted trends is 99.5%, which meets the requirements. Throughout the process, the air change rate increases with the increase of the opening and closing degree of the blower, with an ACH (air changes per hour) range of 3.8~10.
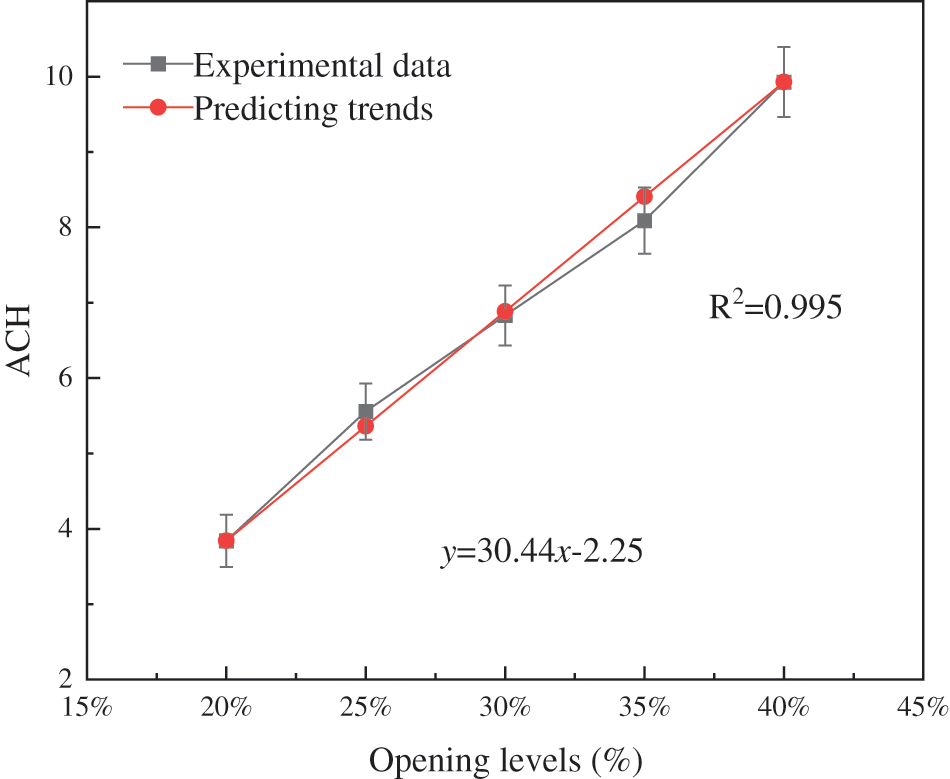
Figure 7: Relationship between the degree of blower opening and the air changes per hour
Fig. 8 shows the air velocity profile against time for several degrees of blower opening. Due to the fact that changes in air velocity can exhibit significant differences over a short period of time, records are made every 5 s during the experimental process. Additionally, when analyzing, sudden increases or decreases in air velocity at a specific point are ignored, focusing instead on the air velocity values within a range interval. To intuitively compare the air velocity at different blower opening degrees, and to correlate the air velocity with the degree of fan opening, we have reconstructed Fig. 8a in three dimensions.

Figure 8: Influence of different opening degree of blower on indoor air velocity
It is clear from Fig. 8a that the overall air velocity at the air inlet increases as the degree of blower opening increases. When the blower is opened to 20%, 25%, 30%, 35%, and 40%, respectively, the average air velocity measured by the sensor located directly below the air inlet over a period of four hours are 0.19, 0.20, 0.21, 0.28, and 0.34 m/s, respectively. Furthermore, the ACH obtained from Fig. 7 allows for the calculation of average air velocity coming out of each vent (three vents in total) at different blower openings, which are respectively 0.19, 0.27, 0.35, 0.42, and 0.5 m/s. A comparison of these figures reveals that as the opening degree of the blower increases, the air velocity at the inlets also increases, resulting in more air escaping in different directions. This leads to an increase in air velocity in the normal direction (as indicated by the air velocity sensor readings), but the rate of increase diminishes.
When the blower is turned on to a lesser extent (20% and 25%, corresponding to an ACH of 4 and 5.3, respectively), the warm air coming in from the blower at this point is not sufficient to meet the set temperature demand, thus causing the wall-mounted internal circulator to automatically turn on and the air velocity to increase for a short period of time, as is also evident in Fig. 8b. However, even with the internal circulation disturbance, the average air velocity around the manikin was only 0.18 and 0.19 m/s. When the blower opened gradually, the average air velocity near the manikin also gradually increased, and more importantly, the growth rate increased at the same time. Excluding the influence of the circulator, the perceived air of indoor occupants is between 0.1 and 0.2 m/s, while the air velocity at the air inlet is between 0.2 and 0.6 m/s. Combined with the changes in air velocity at the inlet, it can be noted that an increase in inlet velocity leads to a greater degree of disturbance and disorder in the indoor air. This results in a reduction in the rate of increase in the air velocity directly below the inlet. On the other hand, it enhances the air velocity and its growth rate near the manikin.
Fig. 9 shows the analysis of the average thermal comfort of indoor occupants within four hours when the blower is at different levels. Five different scenarios where the thermal manikin initially moves from “uncomfortable” to “comfortable”. This is due to the fact that the temperature module was initially controlled so that the optimum satisfactory temperature for the thermal manikin was set at 20°C. As the perceived air velocity is disturbed, the comfort level gradually decreases. In the graph, at 20% and 25% blower opening, the comfort level decreases sharply due to the low inlet air velocity and thus the perturbation of the internal circulation. As for the latter three scenarios, the average physical comfort level is around 0 as time changes. This is best reflected by the 35% opening level.
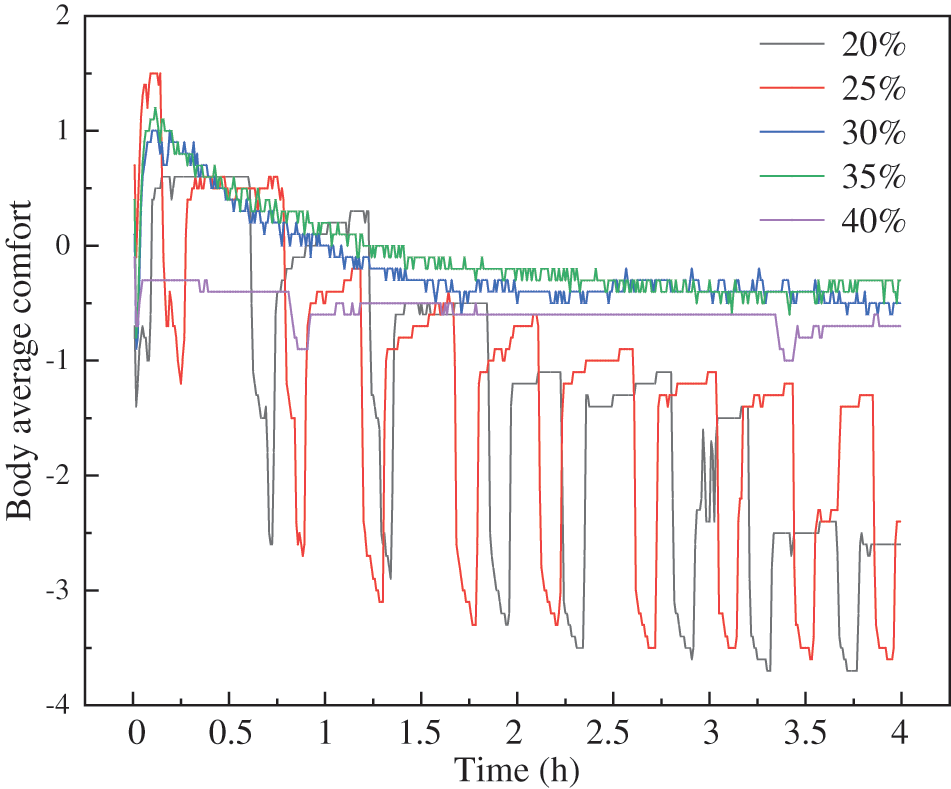
Figure 9: Influence of different opening degree of blower on thermal comfort under test conditions
Fig. 10 shows the effect of different opening degrees of blower on the body average sensation under test conditions. Correspondingly to Fig. 9, the thermal sensation initially increased from “cool” to “natural”, and the reason is consistent with the above. Similarly, due to the disturbance of the inner circulator, the thermal sensation of scenarios 1 and 2 deteriorates over time. The latter three scenarios stabilize between “natural” and “slightly cool” over time. Among them, the best effect is achieved when the blower is turned on at 35%.
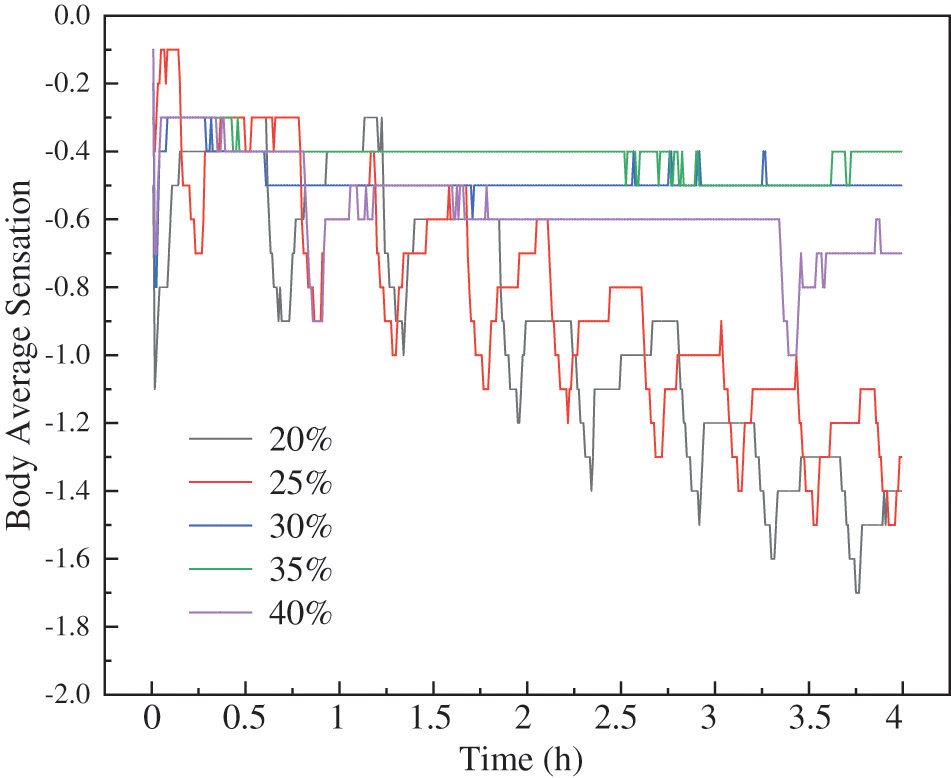
Figure 10: Influence of different opening degree of blower on body average sensation under test conditions
In this work, experimental studies were conducted to investigate the influence of different opening degrees of blower on indoor environment and thermal comfort. The results of the study can be summarized as follows:
1. The overall air velocity at the air inlet increases as the degree of blower opening increases.
2. When the blower is opened to 20%, 25%, 30%, 35%, and 40%, respectively, the average air velocity measured by the sensor located directly below the air inlet over a period of four hours are 0.19, 0.20, 0.21, 0.28, and 0.34 m/s, respectively.
3. As the opening degree of the blower increases, the air velocity at the inlets also increases, resulting in more air escaping in different directions. This leads to an increase in air velocity in the normal direction (as indicated by the air velocity sensor readings), but the rate of increase diminishes. However, the average air velocity near the manikin also gradually increased, and more importantly, the growth rate increased at the same time.
4. The comfort and average body sensation values show an increase and then a decrease as the blower is turned on, reaching an optimum at 35% of the blower.
Based on the relation between indoor air flow and human comfort, this paper quantitatively and qualitatively analyzes the influence of blower opening and closing degree on indoor air disturbance and human comfort. Based on this, the optimum opening degree of the blower is determined. This provides relevant guidance for the later design of indoor ventilation and heat transfer.
Acknowledgement: Authors would like to thank Le Conseil Départemenal de l’Aube and Troyes Champagne Métropole for their funding and help to carry out this study. The authors also gratefully acknowledge the help from Yanwen Lian in guidance on schematic drawing.
Funding Statement: This work was supported by the China Scholarship Council (Grant Number 202208120025).
Author Contributions: The authors confirm contribution to the paper as follows: study conception and design: S.Q.S.; data collection: A.M.; analysis and interpretation of results: S.Q.S., R.B.; draft manuscript preparation: S.Q.S., J.K. All authors reviewed the results and approved the final version of the manuscript.
Availability of Data and Materials: All data are included in this published article.
Conflicts of Interest: The authors declare that they have no conflicts of interest to report regarding the present study.
References
1. Wang J, Huang J, Fu Q, Gao E, Chen J. Metabolism-based ventilation monitoring and control method for COVID-19 risk mitigation in gymnasiums and alike places. Sustain Cities Soc. 2022 May;80:103719. doi:10.1016/j.scs.2022.103719. [Google Scholar] [PubMed] [CrossRef]
2. Moftakhari A, Bourne S, Novoselac A. All-air vs. radiant cooling systems: analysis of design and operation factors that impact building cooling loads (ASHRAE RP 1729). Sci Technol Built Environ. 2023 Apr;29(4):381–401. doi:10.1080/23744731.2023.2183016. [Google Scholar] [CrossRef]
3. Motamedi H, Shirzadi M, Tominaga Y, Mirzaei PA. CFD modeling of airborne pathogen transmission of COVID-19 in confined spaces under different ventilation strategies. Sustain Cities Soc. 2022 Jan;76:103397. doi:10.1016/j.scs.2021.103397. [Google Scholar] [PubMed] [CrossRef]
4. Feng JD, Bauman F, Schiavon S. Experimental comparison of zone cooling load between radiant and air systems. Energy Build. 2014 Dec;84:152–9. doi:10.1016/j.enbuild.2014.07.080. [Google Scholar] [CrossRef]
5. Dogan A, Kayaci N, Demir H, Sevindir MK. An experimental comparison of radiant wall and ceiling cooling system integrated with ground source heat pump and direct expansion fan coil system in a highly glazed office room. Energy Build. 2022 Oct;273:112412. doi:10.1016/j.enbuild.2022.112412. [Google Scholar] [CrossRef]
6. Aryal A, Chaiwiwatworakul P, Chirarattananon S. An experimental study of thermal performance of the radiant ceiling cooling in office building in Thailand. Energy Build. 2023 Mar;283:112849. doi:10.1016/j.enbuild.2023.112849. [Google Scholar] [CrossRef]
7. Kong X, Chang Y, Fan M, Li H. Analysis on the thermal performance of low-temperature radiant floor coupled with intermittent stratum ventilation (LTR-ISV) for space heating. Energy Build. 2023 Jan;278:112623. doi:10.1016/j.enbuild.2022.112623. [Google Scholar] [PubMed] [CrossRef]
8. Song C, Duan G, Wang D, Liu Y, Du H, Chen G. Study on the influence of air velocity on human thermal comfort under non-uniform thermal environment. Build Environ. 2021 Jun;196:107808. doi:10.1016/j.buildenv.2021.107808. [Google Scholar] [CrossRef]
9. Lin Z, Lee CK, Fong S, Chow TT, Yao T, Chan ALS. Comparison of annual energy performances with different ventilation methods for cooling. Energy Build. 2011 Jan;43(1):130–6. doi:10.1016/j.enbuild.2010.08.033. [Google Scholar] [CrossRef]
10. Cho H, Cabrera D, Sardy S, Kilchherr R, Yilmaz S, Patel MK. Evaluation of performance of energy efficient hybrid ventilation system and analysis of occupants’ behavior to control windows. Build Environ. 2021 Jan;188:107434. doi:10.1016/j.buildenv.2020.107434. [Google Scholar] [CrossRef]
11. Shi S, Merabtine A, Bennacer R, Kauffmann J. Experimental evaluation of the impact of real sun patch on radiant floor heating in highly glazed spaces. Build Environ. 2023 Oct;244:110799. doi:10.1016/j.buildenv.2023.110799. [Google Scholar] [CrossRef]
12. Psikuta A, Allegrini J, Koelblen B, Bogdan A, Annaheim S, Martínez N, et al. Thermal manikins controlled by human thermoregulation models for energy efficiency and thermal comfort research—A review. Renew Sustain Energ Rev. 2017 Oct;78:1315–30. doi:10.1016/j.rser.2017.04.115. [Google Scholar] [CrossRef]
13. Psikuta A, Richards M, Fiala D. Single-sector thermophysiological human simulator. Physiol Meas. 2008 Jan;29(2):181. doi:10.1088/0967-3334/29/2/002. [Google Scholar] [PubMed] [CrossRef]
14. Frontczak M, Wargocki P. Literature survey on how different factors influence human comfort in indoor environments. Build Environ. 2011 Apr;46(4):922–37. doi:10.1016/j.buildenv.2010.10.021. [Google Scholar] [CrossRef]
15. Hawila AAW, Merabtine A. A statistical-based optimization method to integrate thermal comfort in the design of low energy consumption building. J Build Eng. 2021 Jan;33:101661. doi:10.1016/j.jobe.2020.101661. [Google Scholar] [CrossRef]
16. Zhang H. Human thermal sensation and comfort in transient and non-uniform thermal environments. Center for environmental design research (CEDR) (Ph.D. Dissertation). University of California: Berkeley; 2003. [Google Scholar]
17. Li T, Merabtine A, Lachi M, Bennacer R, Kauffmann J. Experimental study on the effects of a moving sun patch on heating radiant slabs: the issue of occupants’ thermal comfort. Sol Energy. 2023 May;255:36–49. doi:10.1016/j.solener.2023.03.028. [Google Scholar] [CrossRef]
18. El akili Z, Bouzidi Y, Merabtine A, Polidori G, Kauffmann J. Assessment of thermal comfort of frail people in a sitting posture under non-uniform conditions using a thermal manikin. Build Environ. 2022 Aug;221:109334. doi:10.1016/j.buildenv.2022.109334. [Google Scholar] [CrossRef]
19. El Akili Z, Bouzidi Y, Merabtine A, Polidori G, Kauffmann J. Thermal comfort of frail people under dynamic and non-uniform thermal environments using a thermal manikin with thermoregulatory control: an experimental study. Energy Built Environ. 2023 Aug;4(4):477–91. doi:10.1016/j.enbenv.2022.03.005. [Google Scholar] [CrossRef]
20. ISO 7730:2005(E). Ergonomics of the thermal environment-analytical determination and interpretation of thermal comfort using calculation of the PMV and PPD indices and local thermal comfort criteria. 2005. [Google Scholar]
Cite This Article
 Copyright © 2024 The Author(s). Published by Tech Science Press.
This work is licensed under a Creative Commons Attribution 4.0 International License , which permits unrestricted use, distribution, and reproduction in any medium, provided the original work is properly cited.
 Downloads
 Citation Tools