
 Submit a Paper
 Propose a Special lssue
 Open Access
ARTICLE

Experimental and Three-Dimensional Numerical Simulation of Phenomena Induced by Submerged Oblique Jet Scouring
1 School of Naval Architecture and Maritime, Zhejiang Ocean University, Zhoushan, 316022, China
2 School of Marine Engineering, Guangzhou Maritime University, Guangzhou, 510725, China
* Corresponding Authors: Xianbin Teng. Email: ; Faxin Zhu. Email:
(This article belongs to the Special Issue: Computational Fluid Dynamics: Two- and Three-dimensional fluid flow analysis over a body using commercial software)
Fluid Dynamics & Materials Processing 2024, 20(8), 1799-1821. https://doi.org/10.32604/fdmp.2024.049731
Received 16 January 2024; Accepted 08 April 2024; Issue published 06 August 2024
 View Full Text
 Download PDF
Abstract
Scouring experiments were conducted using a three-dimensional laser scanning technology for angles of the jet spanning the interval from 0° to 30°, and the characteristics of the scour hole in equilibrium conditions were investigated accordingly. The results indicate that the optimal scouring effects occur when the jet angle is in the ranges between 15° and 20°. Moreover, the dimensionless profiles of the scour hole exhibit a high degree of similarity at different jet angles. Numerical simulations conducted using the Flow-3D software to investigate the bed shear stress along the jet impingement surface have shown that this stress is influenced by both the resultant force and the jet impingement surface area. It reaches its maximum value when the jet is vertical, decreases rapidly as the jet starts to tilt, then increases slightly, and decreases again significantly when the angle exceeds 20°.Keywords
Nomenclature
| | Jet velocity at the nozzle exit |
| | Velocity in Z-direction |
| | Diameter of the nozzle |
| | Medium diameter of quartz sand |
| | Impinging distance in the jet direction |
| | Vertical distance from the nozzle outlet center to the sand bed surface |
| | Density of quartz sand |
| | Density of water |
| | Difference in density, as |
| | Pressure difference between inlet and outlet |
| | Scour time |
| | Scour mass |
| | Maximum scour diameter |
| | Maximum scour depth |
| | Coordinates of any point on the outer contour of the jet |
| | Jet angle |
| | Complementary angle of the jet angle |
| | Jet diffusion angle |
| | Gravitational acceleration |
| | Flow rate |
| | Power consumed by the jet |
| | Distance from the jet to the scouring surface along the axis direction |
| | Specific energy |
| | Erosion parameter |
| | Froude number |
| | Resultant force on the scouring surface (Z-direction) |
| | Force at point |
| | Resultant force for vertical scouring |
| | Jet impingement area |
| | Area element at the scouring surface point |
| | Impingement area for vertical scouring |
| | Average bed shear stresses for scouring at a certain angle |
| | Average shear stresses of the jet on the scouring surface |
| | Average bed shear stresses for vertical scouring |
| | Ratio of shear stress, as |
| | Maximum velocity on the scouring surface |
| | Average velocity on the scouring surface |
Submarine trenching is an important aspect of marine engineering [1]. Before laying submarine cables and pipelines, it is usually necessary to place them in trenches to reduce the potential mechanical damage from anchoring ships or other manual activities, while also minimizing the effects of tides, currents, and geological movements of the seabed on the integrity of the pipelines [2]. Water jet technology is an efficient method for scouring and maintaining the seabed, using high-velocity water columns to create an ideal trench for pipeline laying [3]. The success of this work depends on accurately predicting the interaction between seabed sediments and characteristic water jets [4–6].
Many scholars have conducted studies on the scouring phenomenon of submerged jets on erodible sand beds. Yeh et al. [7] conducted physical experiments to investigate the topographic changes caused by the scouring of circular vertical turbulent jets. They investigated the effect of horizontal jet velocity on the scour profile and refined the dimensionless profile previously proposed by Aderibigbe et al. [8]. The characteristic length of the scour profile was determined in the asymptotic region. When the scour profile was scaled with a suitable length scale, self-similarity was observed. Qian et al. [9] constructed a dynamic model for sand scour using a dual nozzle system with adjustable jet angles using Flow-3D software. Their analysis of the flow field characteristics at different jet velocities and movement rates revealed that velocity had a greater effect on scour depth than on scour width. They also determined an optimum medial jet angle to enhance trench excavation efficiency. Huang et al. [10] studied the kinetic performance of water jets at different impinging distances and angles. They provided qualitative descriptions of the relationship between the maximum shear stress on the scouring surface and the impinging pressure distribution.
In practical engineering applications, parameters such as the power of a pump, the size of the nozzle and the working environment are typically predetermined, while the jet angle is one of the few adjustable variables that significantly affect the scouring effects. However, previous studies have primarily focused on the two-dimensional characteristics of scour holes without fully considering the loading conditions on the impingement surface. Underwater scouring represents a complex three-dimensional problem, and it is crucial to consider the bed shear stresses that exceed the shear resistance of the soil on the jet impingement surface.
The scouring effects of oblique water jets on sand bed was systematically investigated through experimental and simulation analyses in this study. The scour depth, scour area and scour mass were evaluated at different jet angles. The effects of varying jet angles on flow structure and bed shear stresses were presented and explained through impingement area and velocity distributions. This study provides some reference for engineering applications.
2 Experiment and Numerical Simulation
The submerged scouring experimental platform is shown in Figs. 1a and 1b. The dimensions of the experimental water tank is 100 cm × 120 cm × 100 cm. Above the frame, there is a fixed guide rail equipped with a calibrated handlebar and slider, which facilitates precise adjustments of the nozzle’s position and inclination angle. Water for the experiment is pumped into the jet pipe using a centrifugal pump. The pump’s speed is controlled by varying the motor’s frequency, which regulates the exit velocity of the jet. In this experiment, the efflux velocity of the jet was set to
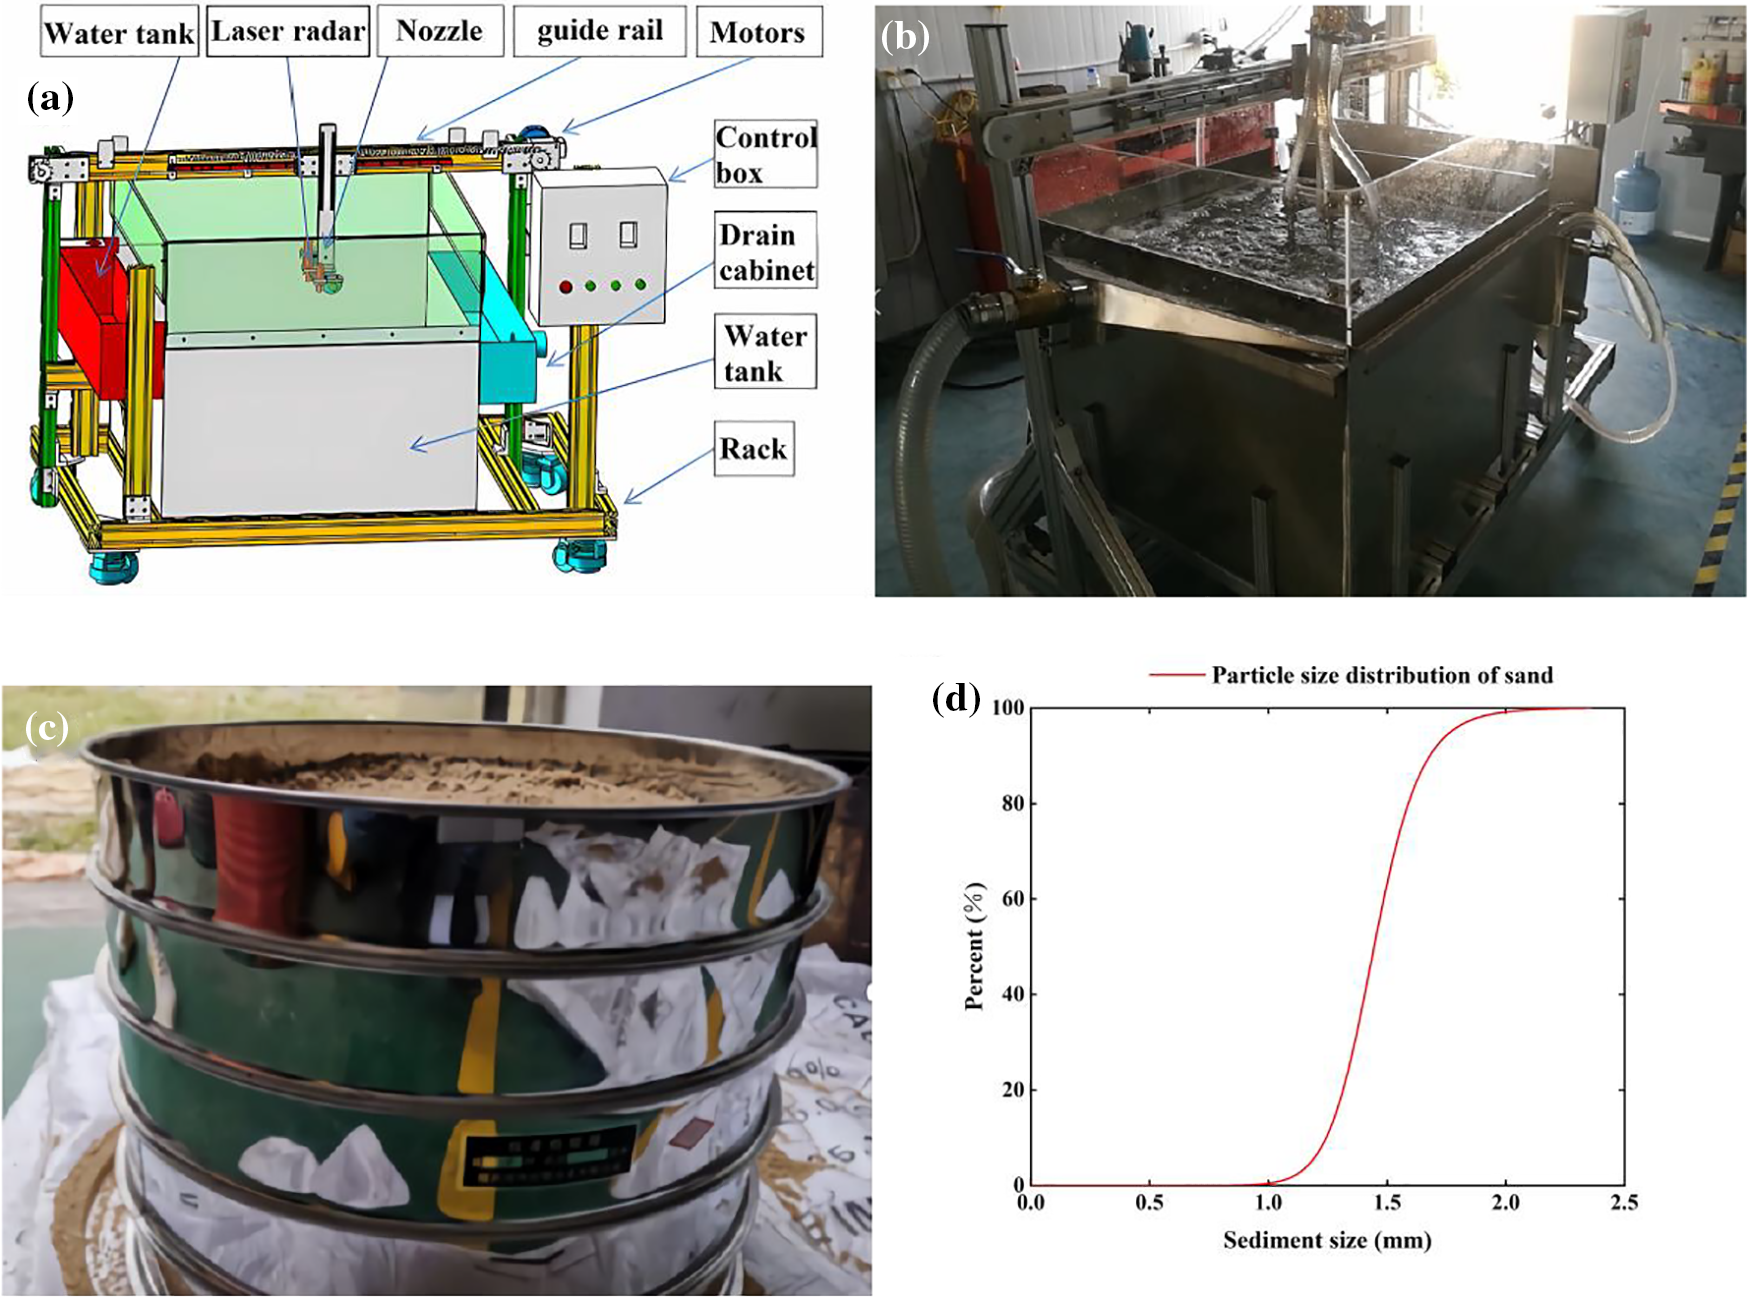
Figure 1: (a) Schematic diagram of the experimental platform; (b) jet scouring test bench; (c) sieving process; (d) sediment size distribution
The diameter of the nozzle
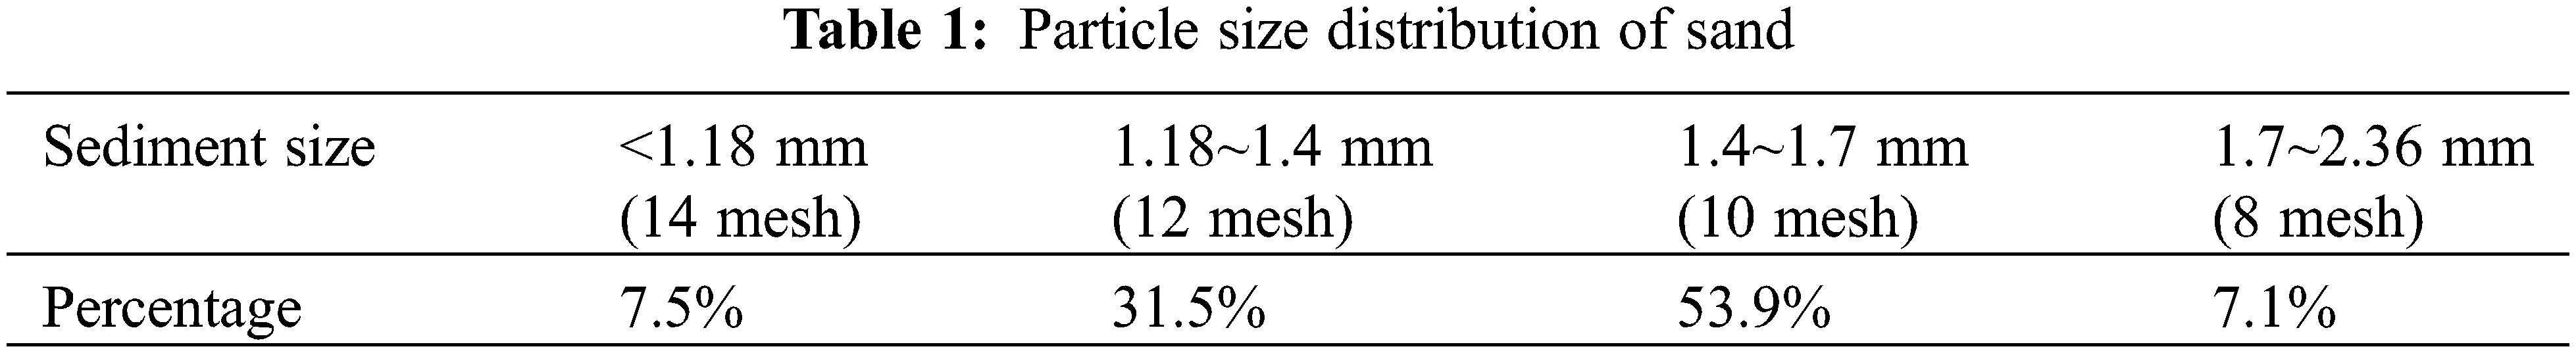
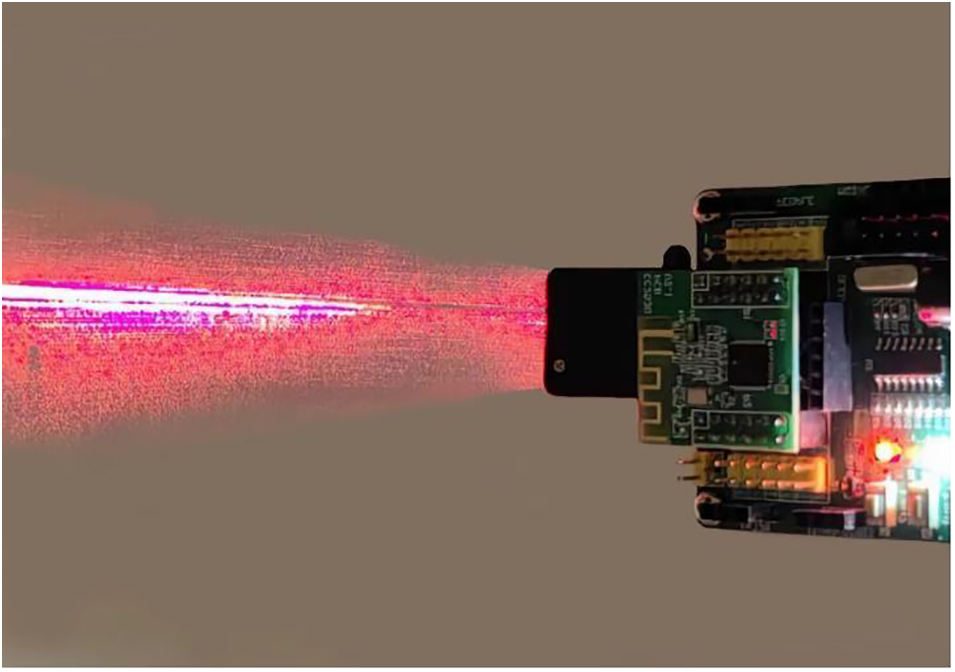
Figure 2: Laser radar
There are two types of submerged scouring: dynamic scouring-when the jet flow is in operating condition, and static scouring-when the jet flow is stopped [8]. And there is a significant difference between dynamic scouring and static scouring, and under certain conditions, the depth of dynamic scouring can be approximately three times that of static scouring [19–21].
Experiments were conducted within a jet angle
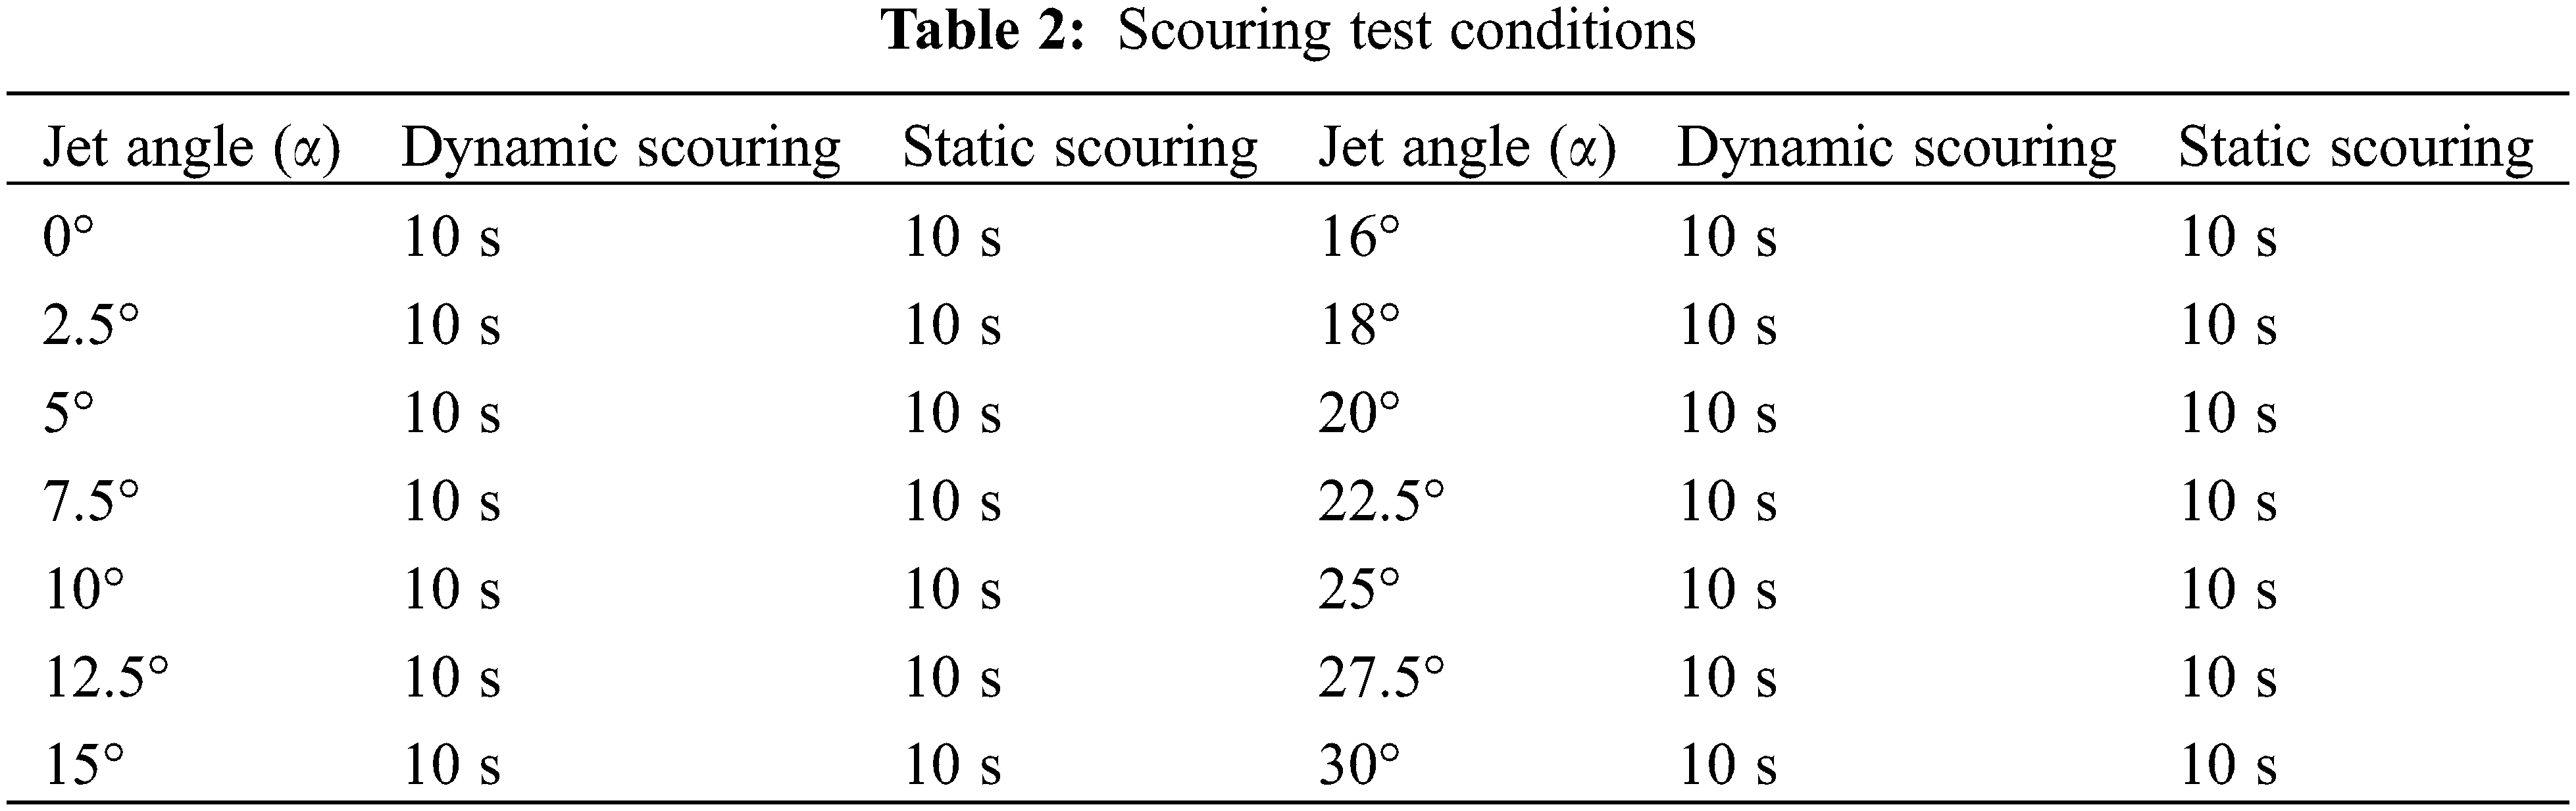
Prior to each experiment, the sand bed was leveled and compacted, and the motor was opened to slowly fill water into the water tank from the side until the water surface exceeded the sand bed by more than 150 mm, ensuring that the nozzle remained submerged during the entire scouring process. The nozzle outlet was blocked, and the jet angle of the nozzle was adjusted. Floating foam on the water surface was removed, and the water was allowed to settle until it became clear. Once a constant head was established, the nozzle was opened to initiate the experiment. The dynamic scouring process lasted for 10 s.
After completion of the dynamic scouring, the jet was switched off and the suspended sediment was allowed to settle, i.e., static scouring. Then, the drainage valve located at the bottom of the platform was gradually opened, allowing for a slow and controlled drainage through the perforated filter on the platform’s bottom surface. The objective was to maintain the shape of the scour hole without significant alterations.
During the experiment, it was difficult to visually represent the three-dimensional contour of the scour hole in the form of images during the scouring process due to the turbulence of the jet and the presence of suspended sediment. Data acquisition in the physical experiment relied on laser radar, it scanned the scouring area at a frequency of 10 Hz and transmitted the resulting data to a computer.
These steps were repeated until all experiments were completed. To ensure measurement accuracy and reliability, each group was standardized by repeating the experiment five times and averaging the results.
Compared to traditional experiments, numerical simulation offers the advantages of cost-effectiveness and high efficiency [23–27]. In engineering, certain data are often challenging to obtain through conventional physical experimental methods, and experimental errors cannot be completely eliminated. Therefore, in this study, Flow-3D software was employed for auxiliary research to gain a better understanding of the physical characteristics of the oblique jet.
A three-dimensional model for submerged scouring was established, as shown in Fig. 3a. The dimensions of the three-dimensional model were 500 mm × 300 mm × 300 mm, with a sand bed thickness of 150 mm and the baffle plate height of 150 mm. The circular nozzle had a diameter of 4 mm. A rectangular coordinate system was established at the center of the three-dimensional model, with the center of the nozzle outlet consistently positioned above the origin, with the impinging distance
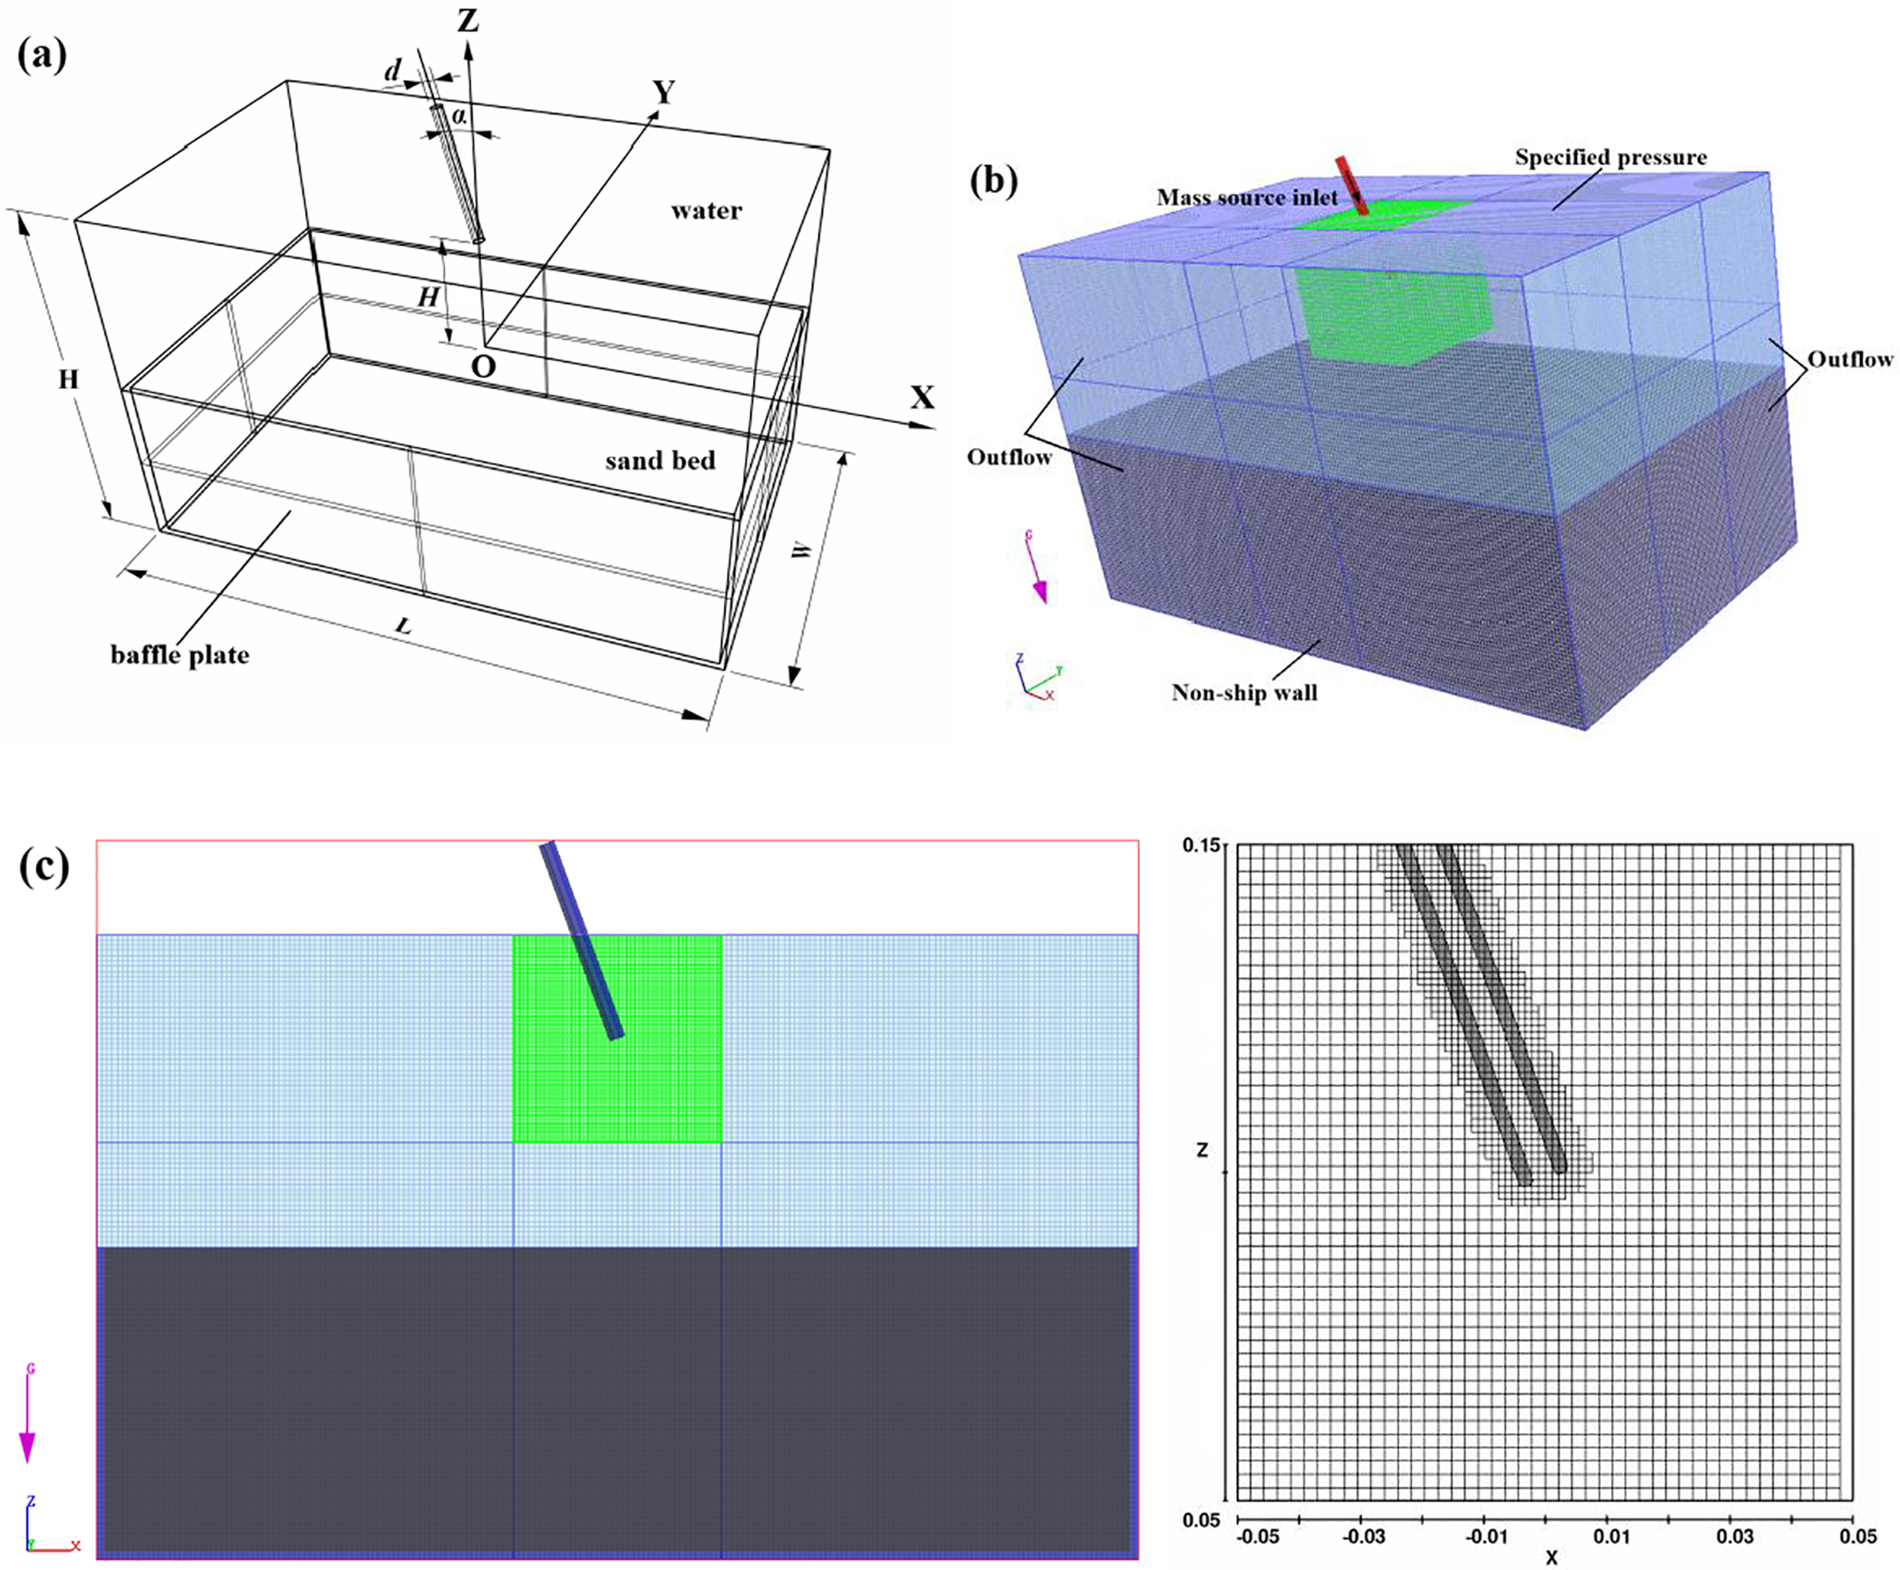
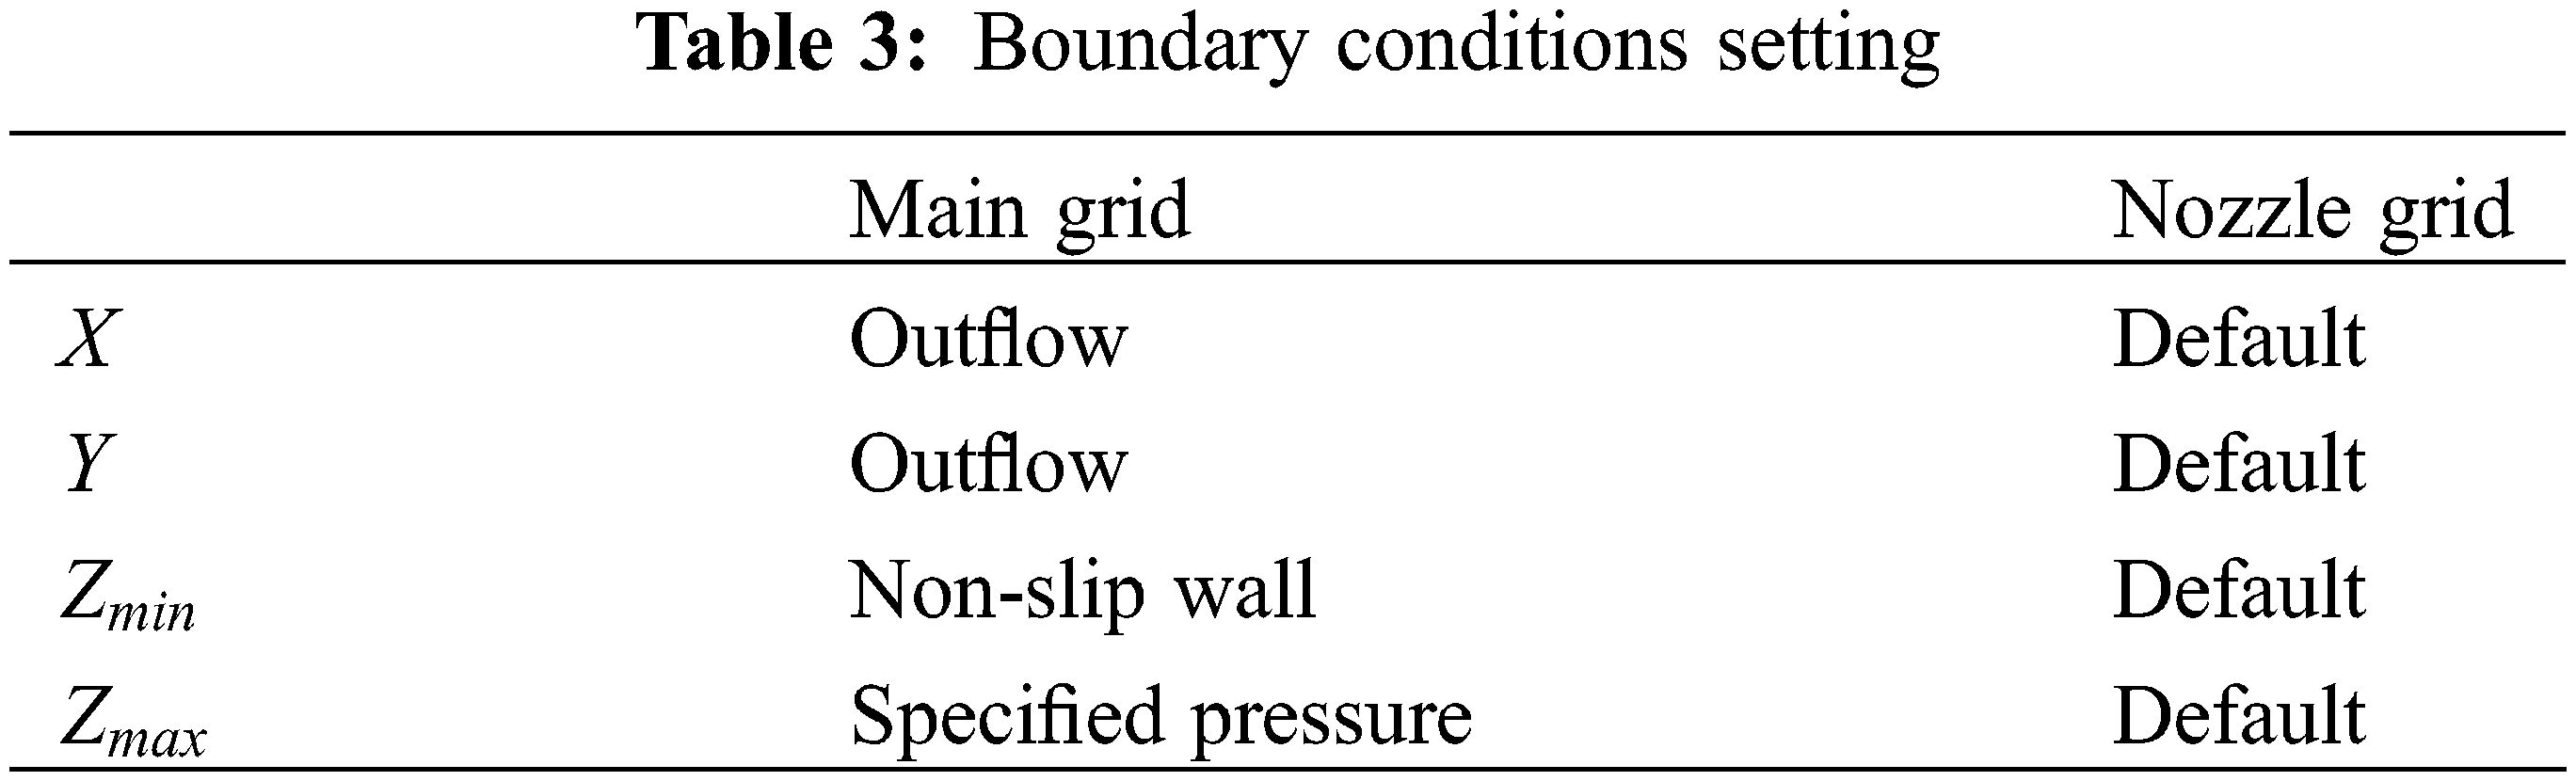
Figure 3: (a) Schematic diagram of three-dimensional model; (b) schematic diagram of grid division; (c) section view of model
Nested structured grids were employed to divide the computational domain. The main grid contained the entire computational domain, while a separate grid block was added for the nozzle region to improve the analytical accuracy in this specific area. The addition of grid nodes in the X, Y, and Z directions ensured that the intersection of the two grid blocks matched, as shown in Figs. 3b and 3c. The structured grid proved effective in mitigating the pseudo-diffusion effect caused by poor grid quality. The nested grid ensured the precision of the geometric shape and resolution of the flow field near the nozzle without impacting the aspect ratio of the main grid.
The boundary conditions for the model are listed in Table 3. During pre-processing, the default boundaries (Symmetry) were automatically modified to linked boundaries [28]. The mass source model allowed for the introduction of a jet with a specific flow velocity at any point in the computational domain. The mass source model was applied in the nozzle’s inlet, resulting in more efficient utilization of computational resources and a more accurate representation of the boundary condition.
Considering the proportions of different sediment particle sizes from Table 1, sedimentation models were configured accordingly, with density
The grid quality has a crucial influence on the accuracy of numerical calculation. In this paper, hexahedral grids were used to partition the computational domain, and a grid sensitivity analysis was carried out to assess the required grid density, as shown in Table 4.
Taking the jet angle
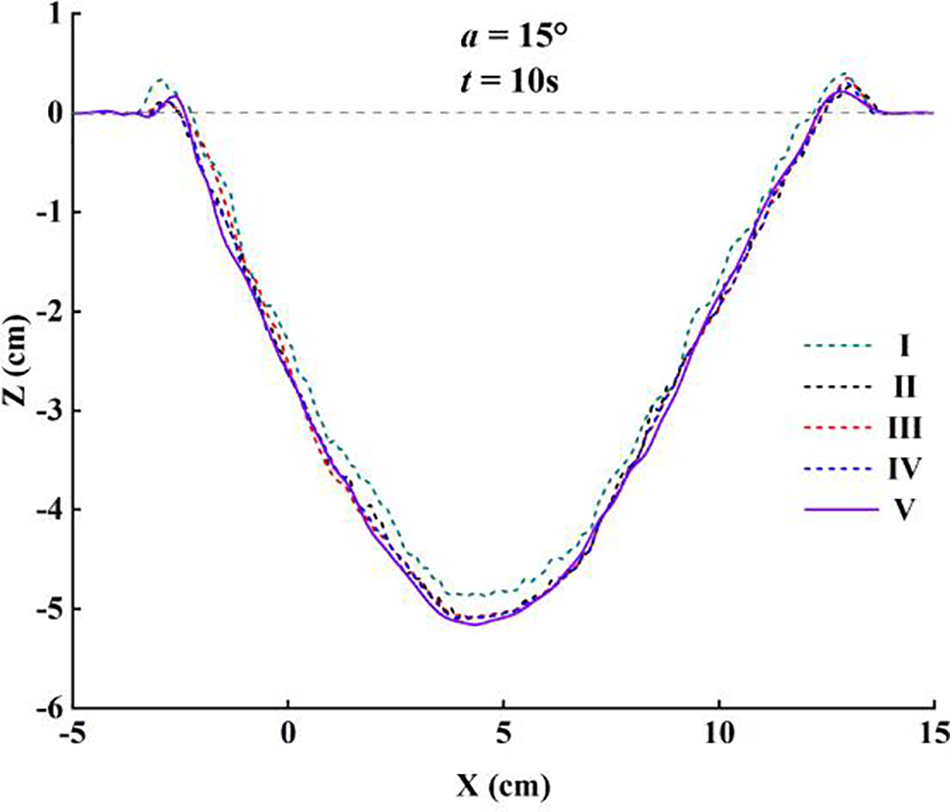
Figure 4: Grid independence test
2.4 Basic Assumptions and Numerical Options
Flow-3D software utilizes the finite volume method for numerical simulation calculations, representing the fluid domain through numerous small control volumes [29]. Each control volume interacts with its surrounding volumes, and the discrete equations guarantee integral conservation for each volume.
In the Cartesian coordinate system, the incompressible water model’s control equations include the continuity equation and N-S equation [30,31], given as follows:
In the equation,
The
In the equation,
The sediment model’s control equations include the transport rate equation and diffusion equation [36,37], given as follows:
In the equation,
For incompressible fluids, it is standard practice to employ an implicit approach for handling the pressure term. This strategy is integral to preserving the fluid’s incompressibility and ensuring the numerical solution remains stable throughout the computational process. The GMRES (Generalized Minimal Residual) algorithm has been selected as the preferred iterative solver due to its demonstrated efficacy in achieving rapid convergence, maintaining symmetry, and accurately capturing velocity fields, thereby making it well-suited for a wide array of fluid flow scenarios [38,39]. In addition, the viscous stress solver, the free surface pressure solver, and the convection solver were solved explicitly. Unlike their implicit counterparts, explicit solvers do not necessitate iterative refinement, which contributes to reduced computational demands enhanced result stability.
In accordance with the Courant-Friedrichs-Lewy (CFL) criterion [40,41], the temporal discretization employed in the simulation must adhere to strict stability constraints. Specifically, the time step must be chosen such that it is less than the critical threshold dictated by the fluid velocity and the grid resolution. Failing to comply with this requirement can lead to unexpected flows or spurious oscillations within the flow field. Consequently, with the grid parameters and jet velocity determined, the individual simulation time step is essentially determined. After comprehensive consideration, the smallest minimum time step was set to 1e-8s to safeguard the integrity and accuracy of the simulation outcomes.
3.1 Explanations on Data Processing
Taking the jet angle
Figure 5: (a) Perspective of the reconstructed model; (b) top of the reconstructed model; (c) front of the reconstructed model
Fig. 6a illustrates the variation of maximum scour depth with time under different jet angles. Whether in simulation or experiment, the results of dynamic scouring development under different conditions exhibited similarities and followed a logarithmic growth pattern.
Figure 6: (a) Evolution of scour depth; (b) variation of sediment mass for simulation (
During the initial stage of scouring, the contour of the scour hole expanded rapidly, and the maximum scour depth reached over two-thirds of the equilibrium state at approximately 2 s [42]. Subsequently, the efficiency of scouring decreased sharply, when the time exceeded 7 s, the scouring gradually approached stability. This equilibrium state indicated a balance between sediment incipience and deposition, resulting in minimal changes to the contour of the scour hole [43].
In the experiments, once the scouring ceased, the turbulence of the water flow rapidly diminished, allowing suspended sediments to settle under the influence of gravity and friction [44]. During this phase, the contour of the scour hole decreased due to sediment deposition, and this process was relatively short-lived. To simulate this sediment deposition process, the Restart model of the software was employed.
Fig. 6b illustrates the variation of sediment mass with time during scouring for simulation (
3.2 Indicators in the Asymptotic State
Fig. 7 gives a schematic representation of a typical scour hole profile generated by an oblique jet.
Figure 7: Sketch of the scour hole generated by an oblique impinging jet
Scour depth is a critical parameter for assessing scouring effects. The trend of scour depth (dynamic scour) is shown in Fig. 8a. The results indicate that scouring at a certain angle has a higher scouring efficiency compared to vertical scouring. This phenomenon can be attributed to the following factors:
1. Scouring is a process involving sediment incipience, transport, and settling. Sediment first becomes suspended sediment, then it moves with the water flow and eventually settles due to gravity and friction. When the jet impacts the sand bed vertically, although the vertical component of the flow is maximized, there is insufficient horizontal diversion to transport the suspended sediment. The influence of the vortex causes a large amount of suspended sediment to be re-covered on the scour hole, diminishing the scouring efficiency. In contrast, when the jet impacts the sand bed at a certain angle, the vertical component of the reaction force decreases, and there is enough energy in the horizontal component to effectively transport the suspended sediment, thereby improving scouring efficiency.
2. It provides a larger scour area. Oblique scouring creates a larger contact area between the jet and the sand bed surface, this trend of change is well presented in Fig. 8b. This means that the jet can cover a larger area and more effectively transport sediment particles. Conversely, vertical scouring only contacts a small portion of the sand bed surface particles, limiting scouring efficiency.
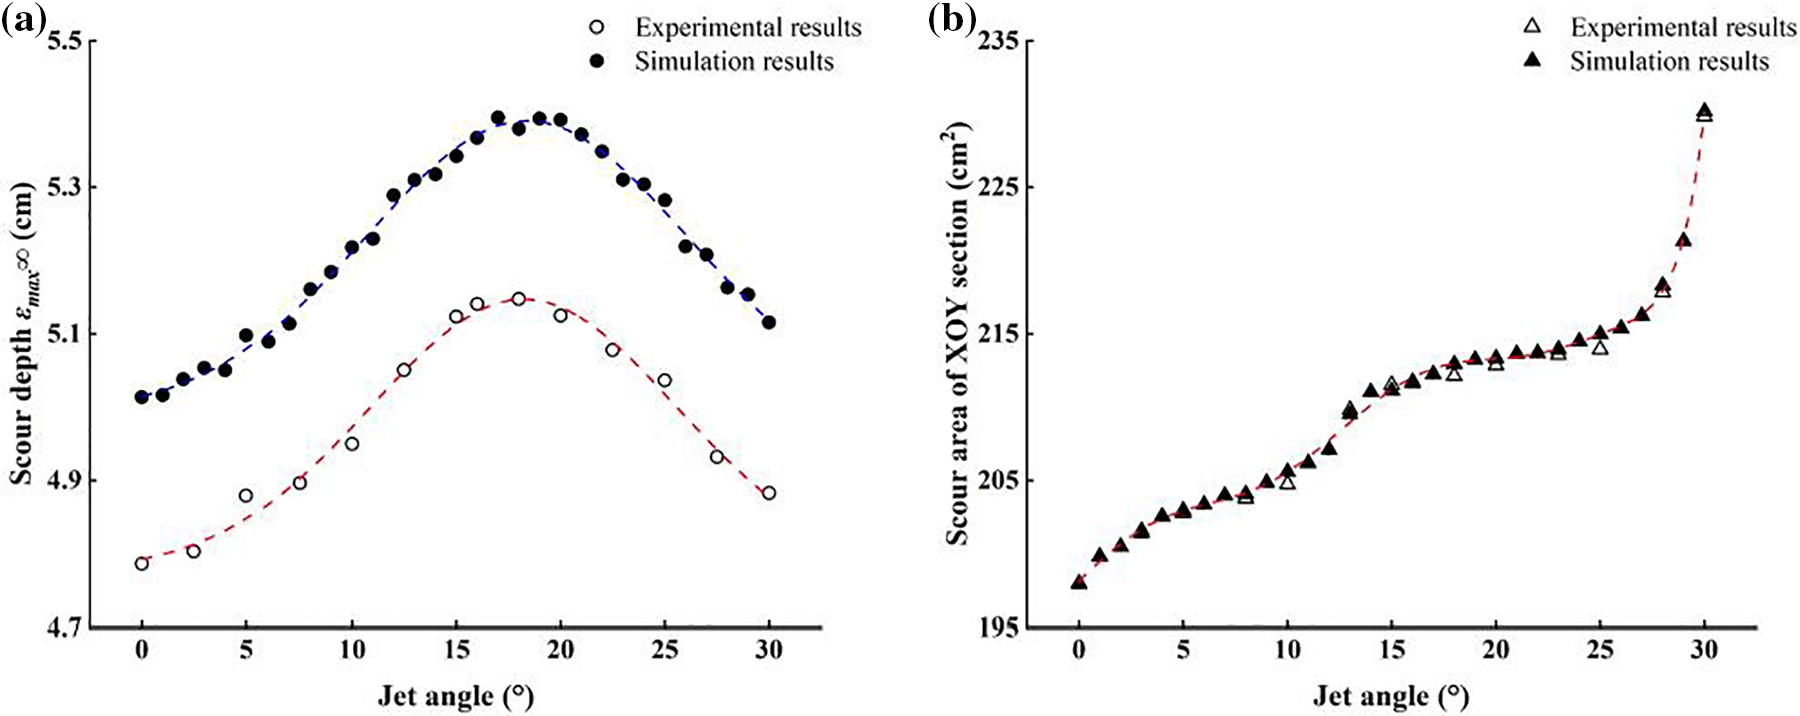
Figure 8: (a) Trend of scour depth variation; (b) trend of scour area variation
In summary, the scour depth reached its maximum value within the range of 15~20°, and initially increased and then decreased with the increase of the jet angle. It can be inferred from the fitting results that as the jet angle continues to increase, the scouring efficiency will decrease continuously. This indicates that the scour hole becomes wider and shallower, and the scour surface becomes irregular rather than forming an effective scour depth.
Scour mass is another crucial index for assessing scouring effects, as it provides a more comprehensive and accurate reflection of material loss during the scouring process. The trend in the variation of scour mass (dynamic scour) is shown in Fig. 9a.
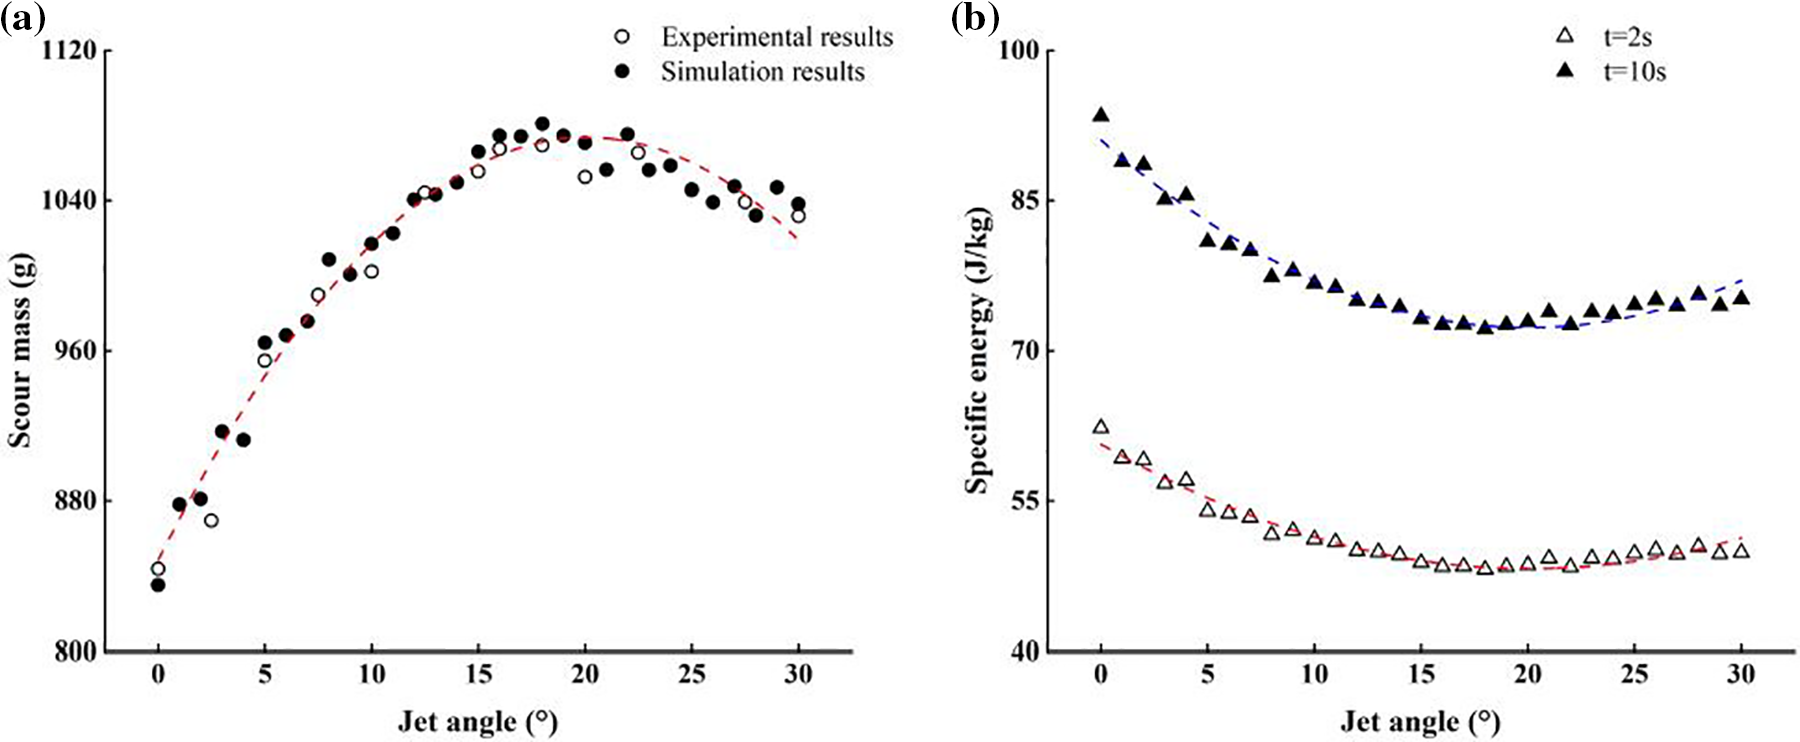
Figure 9: (a) Trend of scour mass variation; (b) trend of specific energy variation for simulation
Similar to the scour depth, the scour mass also reaches its maximum value within the range of 15~20° and then exhibits a gradual decline. The appropriate jet angle ensures a well-matched combination of the vertical diversion’s incipient effect and the horizontal diversion’s transport effect, thereby enhancing the efficiency of scouring.
It should be noted that the decrease in scour mass after reaching its maximum value follows a relatively mild trend. This can be explained as follows: As the jet angle increases, the main energy of the water jet gradually shifts towards the horizontal direction, while the suspended sediment decreases but still maintains a certain quantity. The increased horizontal diversion results in a larger area influenced by the water jet and a wider scour hole, which compensates to some extent for the reduction in scour hole volume due to the decrease in scour depth.
However, based on the fitting results and the analysis of scour depth, it can be predicted that if the jet angle were to be further increased, the horizontal diversion would become the primary energy dissipation direction of the jet, leading to a rugged bed surface rather than effective scouring.
By introducing the concept of specific energy
In the equation,
The specific energy is inversely proportional to the scour mass and reflects the efficiency of energy conversion during the scouring process. The specific energy initially decreases and then increases with variations in the jet angle, reaching its minimum value within the range of 15~20°. Within this range, the jet exhibits a higher scouring efficiency, requiring relatively low energy to scour unit mass of sediment.
Additionally, it can be observed that the specific energy decreases as the scour time increases. This can be explained by the fact that the
3.3 Dimensionless Analysis of Scour Profiles
Rajaratnam et al. [46] proposed the concept of the erosion parameter
In the equation,
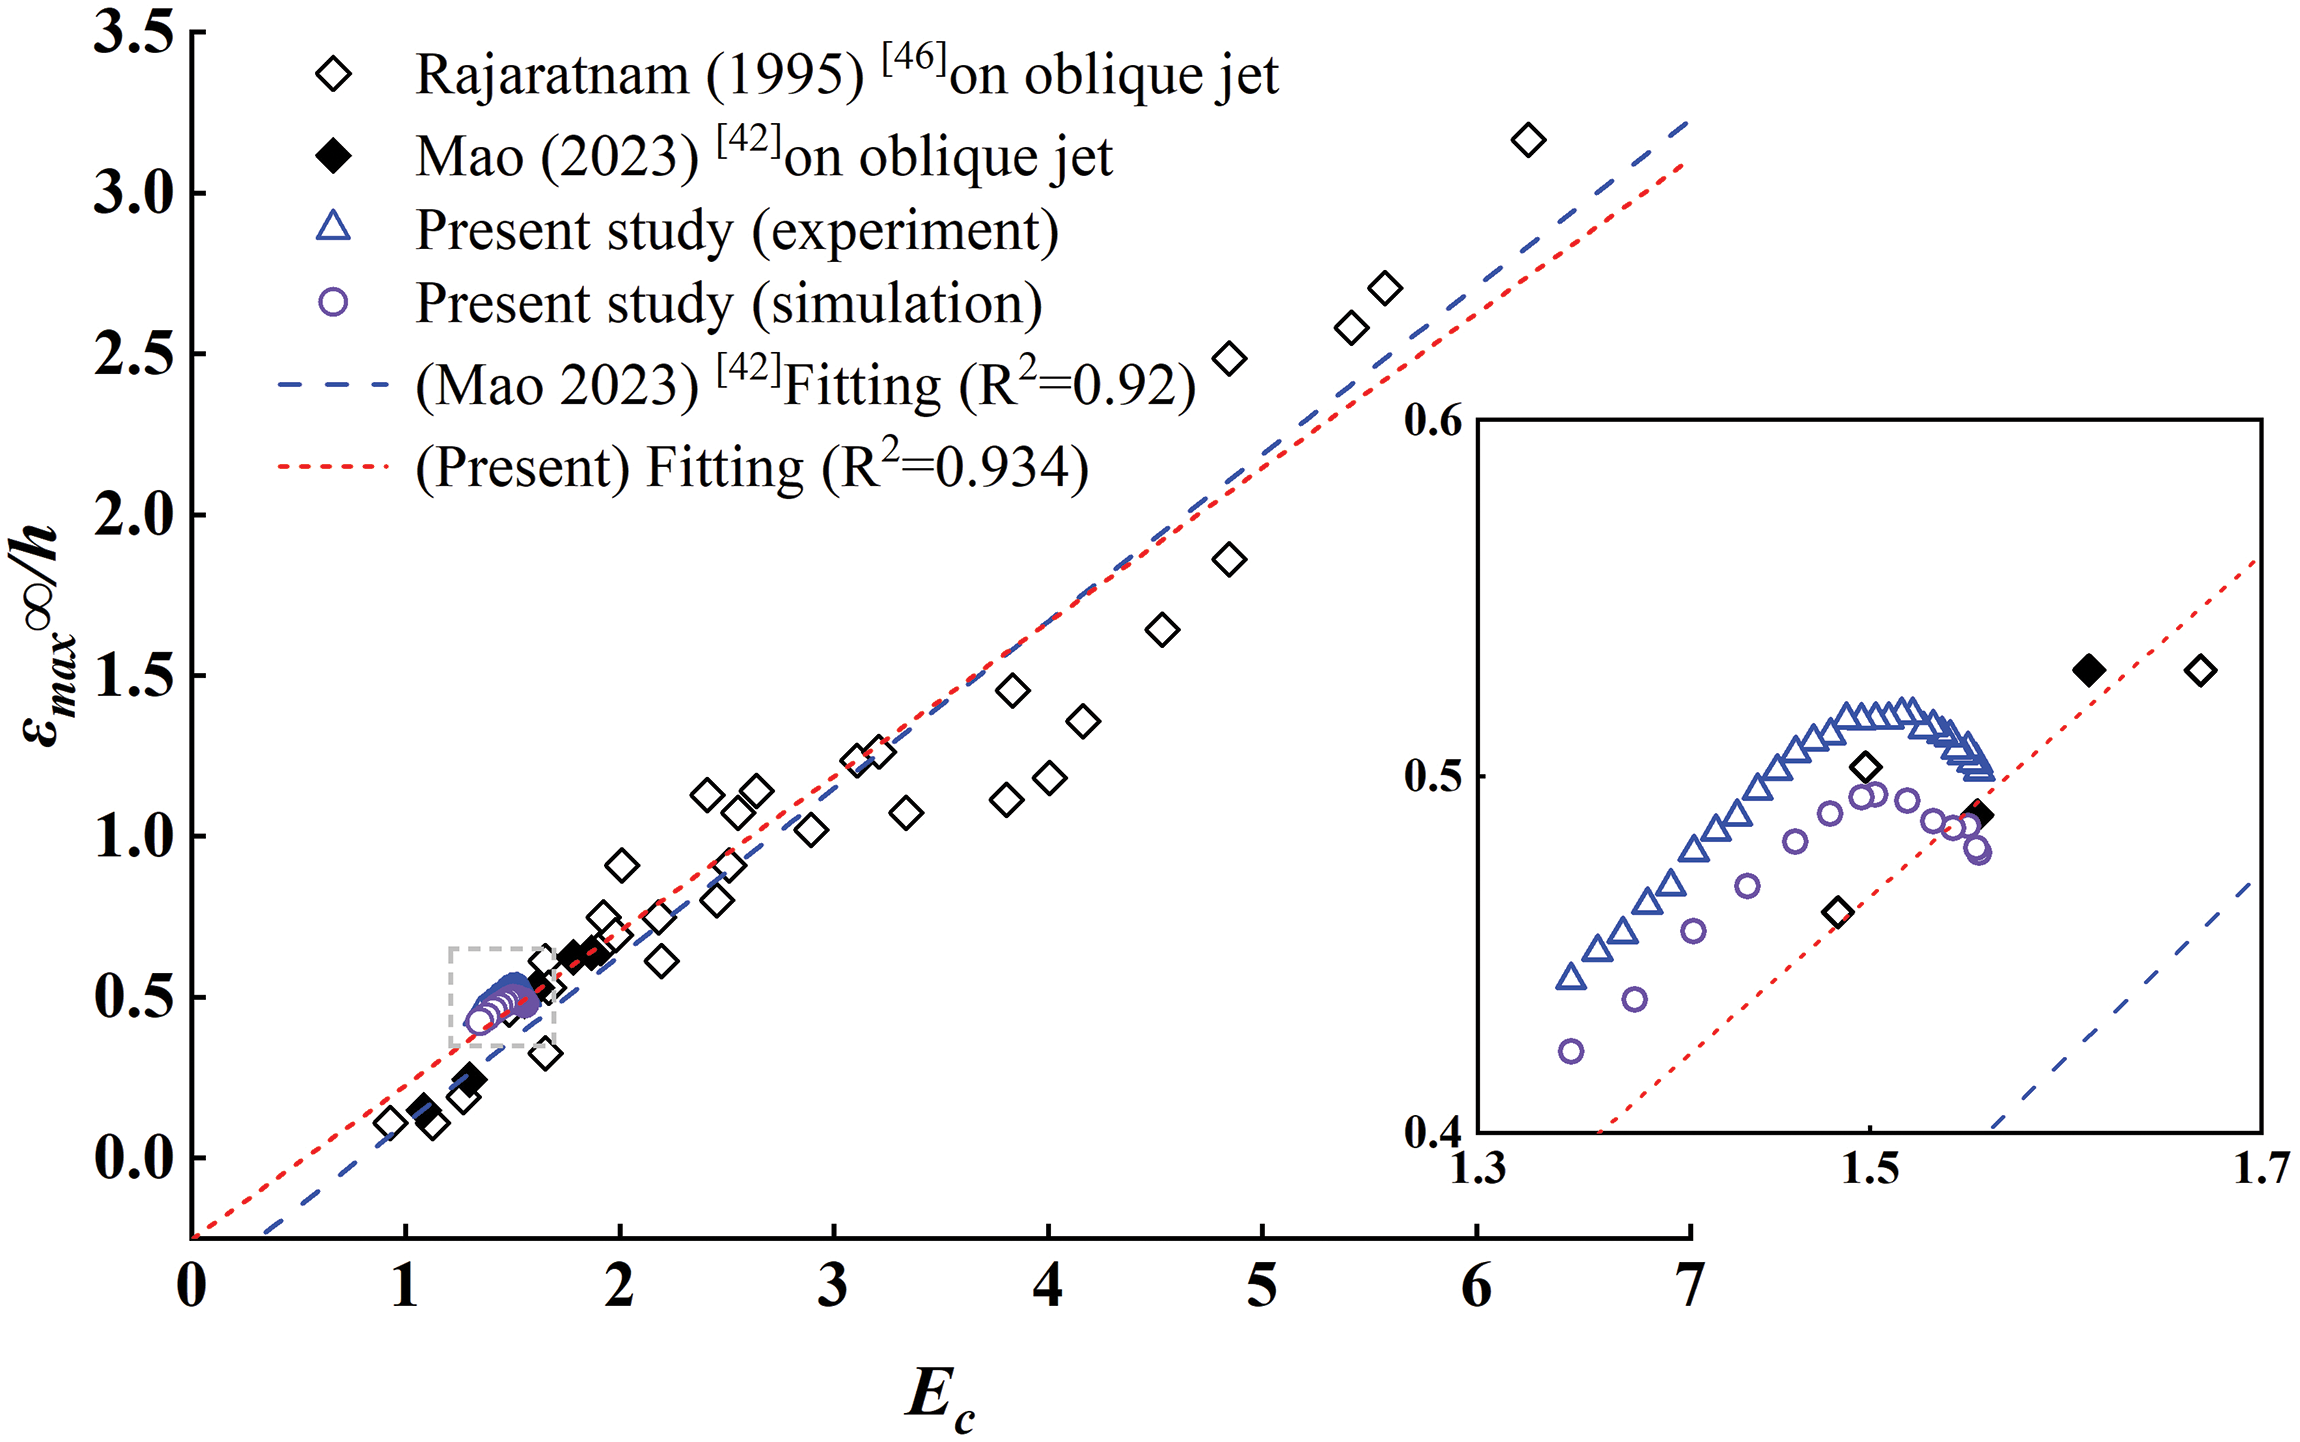
Figure 10: Variation of the maximum dynamic scour depth at equilibrium state with
Within the range of
By collecting the scour profile data in the asymptotic state under different jet angles and processing it in a dimensionless manner, it was found that the profile curve exhibited a certain regularity, as shown in Fig. 11. The horizontal axis represents
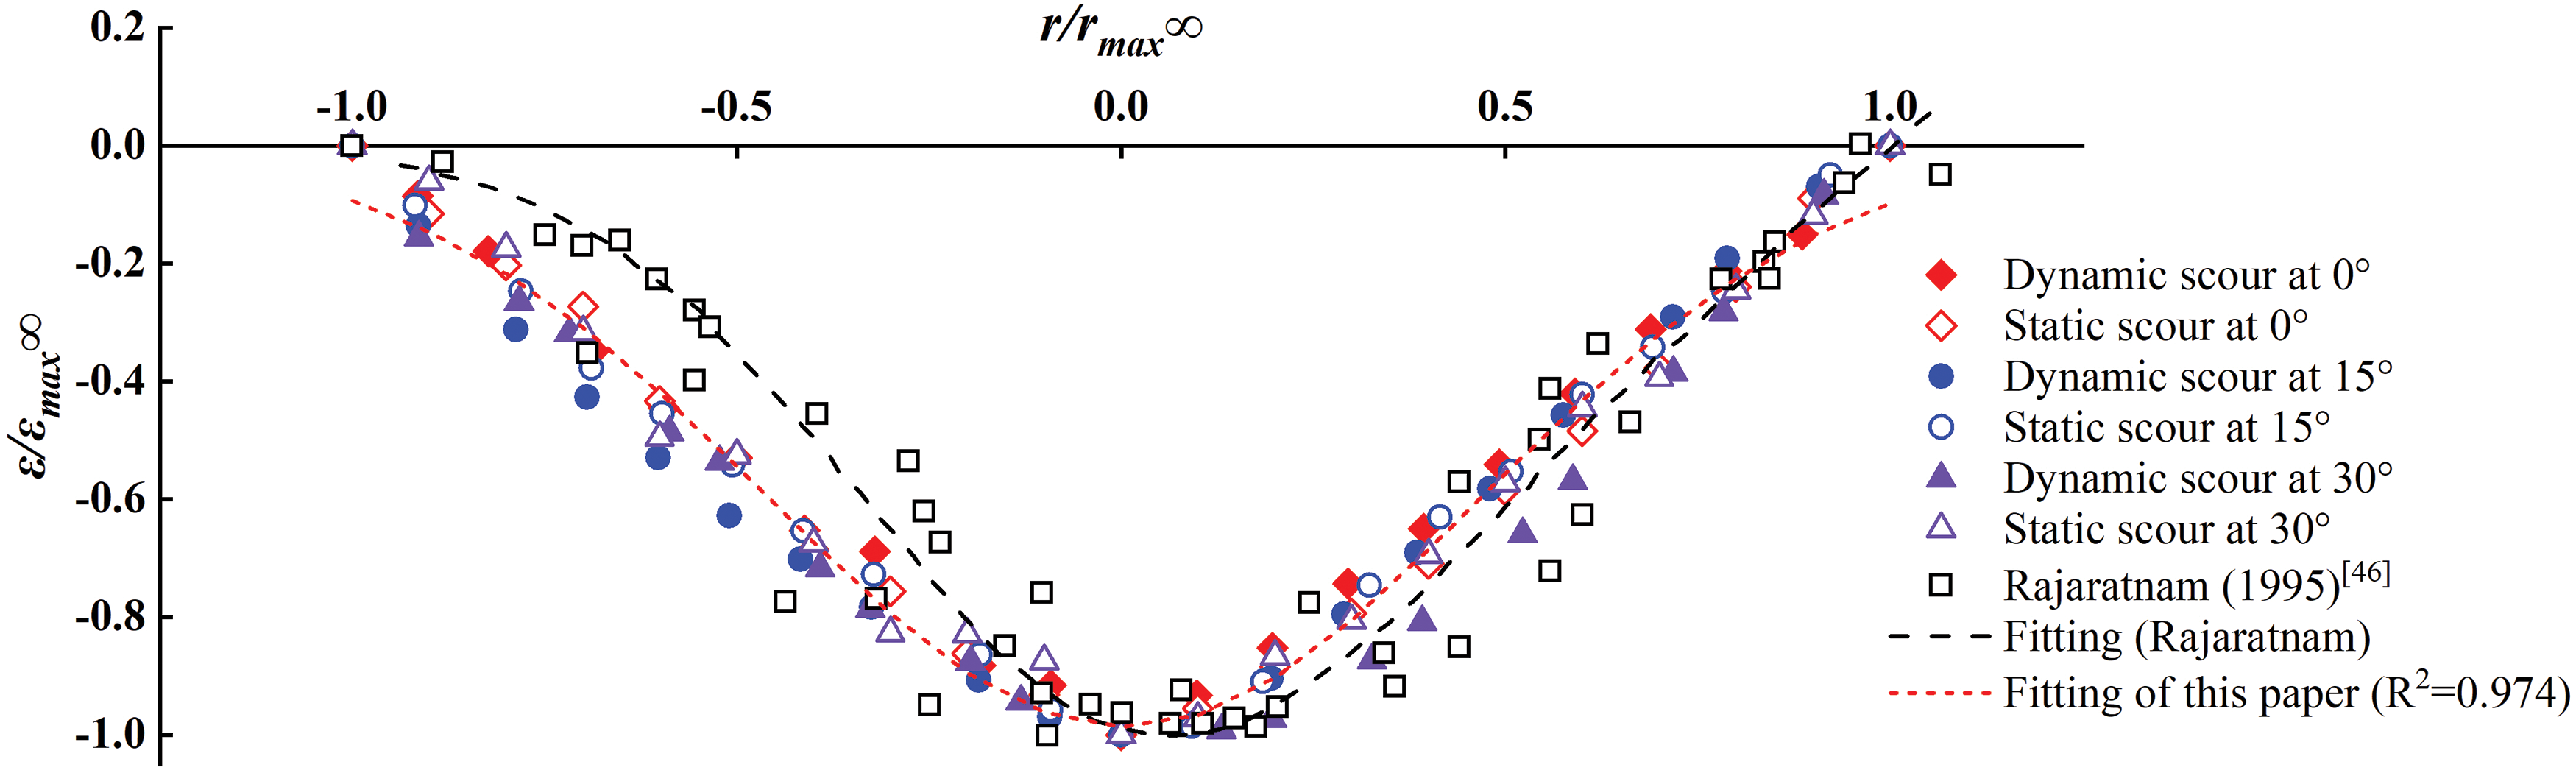
Figure 11: Dimensionless processing of scour profiles
With the exception of some data points, the dimensionless scour profile curves were predominantly concentrated around a single curve. The dimensionless profiles of dynamic and static scouring exhibited a high degree of similarity. In comparison to the results of inclined scouring by Rajaratnam et al. [46], the symmetry of the profile in this study was significantly higher. The reason might be as follows: Rajaratnam’s data were obtained from larger scouring angles (45~80°), where horizontal diversion became mainstream, resulting in the generation of a dominant vortex on the forward side of the nozzle which kept some bed material in suspension, and the rotation direction of the vortex was toward the nozzle, as shown in Fig. 12, the black arrows represent velocity vectors, while contour maps represent suspended sediment concentration. When the jet was turned off, a large amount of suspended sediment settled back onto the upstream slope, causing a significant change to the profile of the upstream slope.
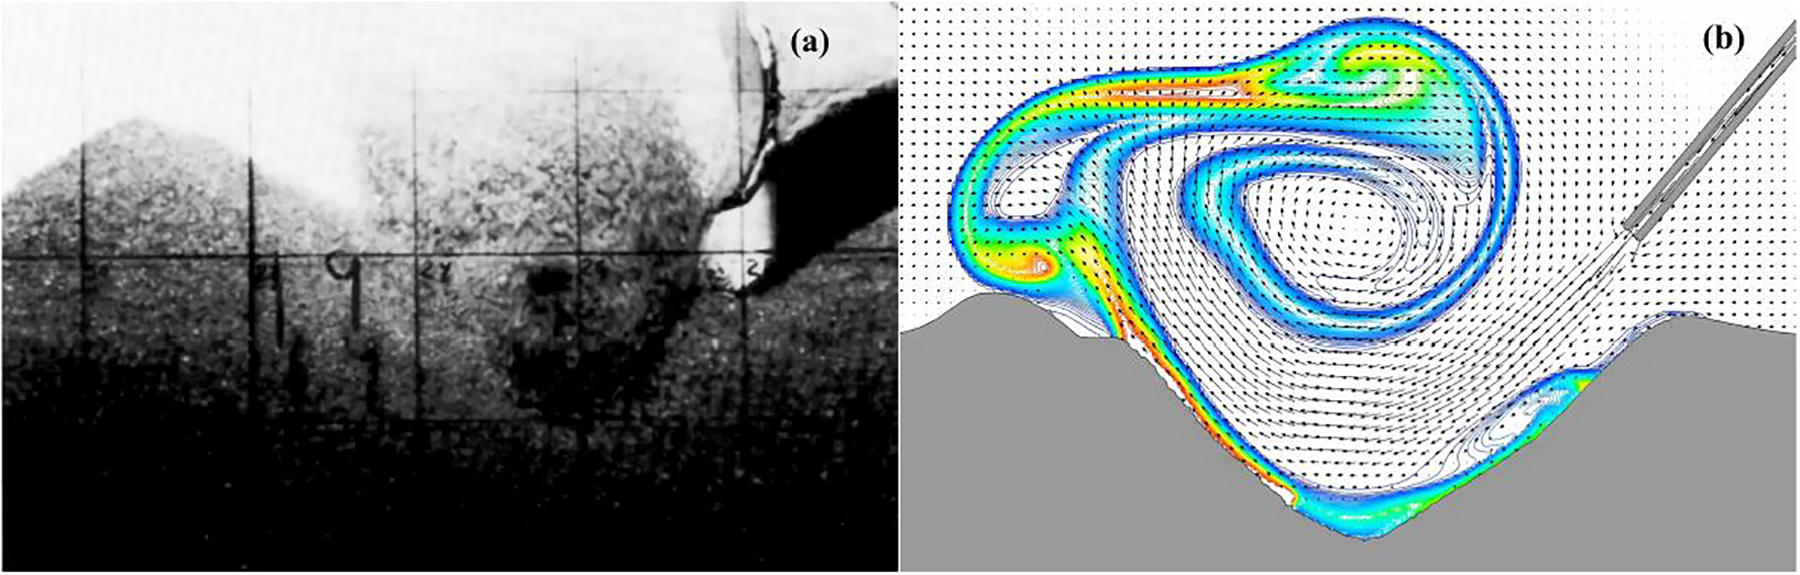
Figure 12: (a) Vortex phenomenon in the experiment; (b) suspended sediment accumulation caused by vortex
Eq. (16) accurately described this dimensionless profile, which was a general form that passed through three reference points (−1, 0), (0, −1), and (1, 0). Its significance lay in providing a fundamental mathematical tool for predicting the shape of the scour hole under different flow conditions.
3.4 Analysis of the Shear Stresses on the Jet Impingement Surface
The essential condition for soil failure under jet impact is that the bed shear stresses of the scouring surface exceed the critical shear resistance of the soil [47–49].
When the jet impacts the sand bed vertically, the scouring surface of the jet is approximately circular, as shown in Fig. 13. The pressure distribution on the scouring surface is uniform, with the pressure at the center being the stagnation pressure
Figure 13: Schematic diagram of vertical scouring
When the jet impacts the sand bed at a certain angle, the scouring surface of the jet is elliptical, as shown in Fig. 14. At this point, the velocity distribution on the scouring surface is complex, which makes the pressure distribution also quite complex.
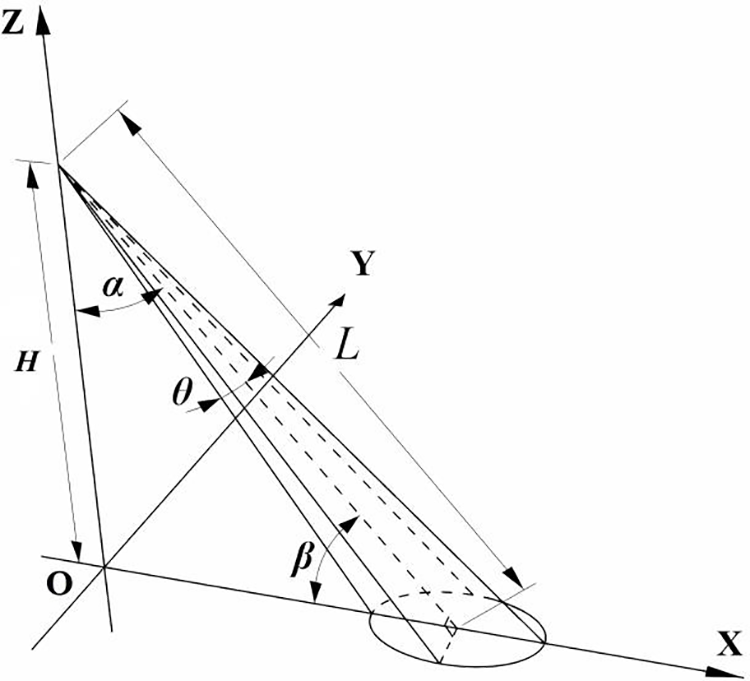
Figure 14: Schematic diagram of inclined scouring
Normally we express the loading and erosion strength in terms of shear stress and critical shear resistance. Since the critical shear resistance depends on material characteristics, the bed shear stress is an important parameter for measuring the efficiency of scouring. In this study, the criterion for soil failure is defined as the average shear stresses on the scouring surface exceeding the critical shear resistance of the soil.
The coupler-curve equation of contour outside scouring surface for vertical scouring and inclined scouring can be expressed by Eqs. (17) and (18), respectively [36].
In the equation,
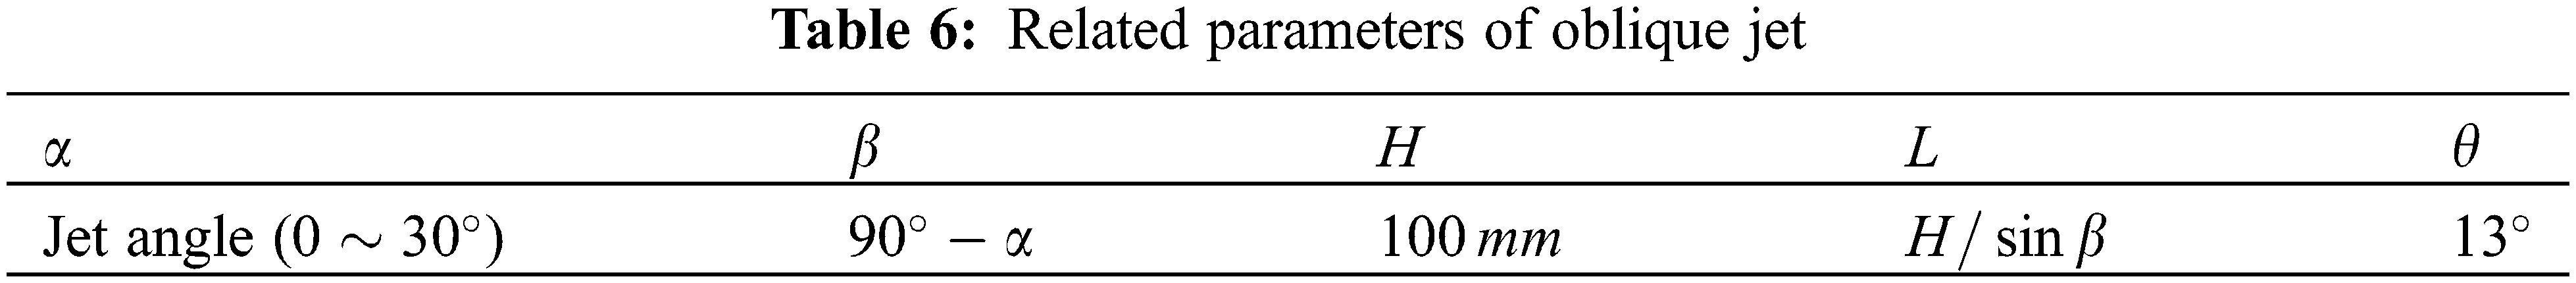
Once the jet angle
The average shear stresses of the jet on the scouring surface
In the equation,
The velocity distribution on the scouring surface during scouring cannot be directly acquired through physical experiments, but it can be measured using simulation software. Combined with Eq. (21), the force distribution on the scouring surface can be plotted, as shown in Figs. 15a–15d.
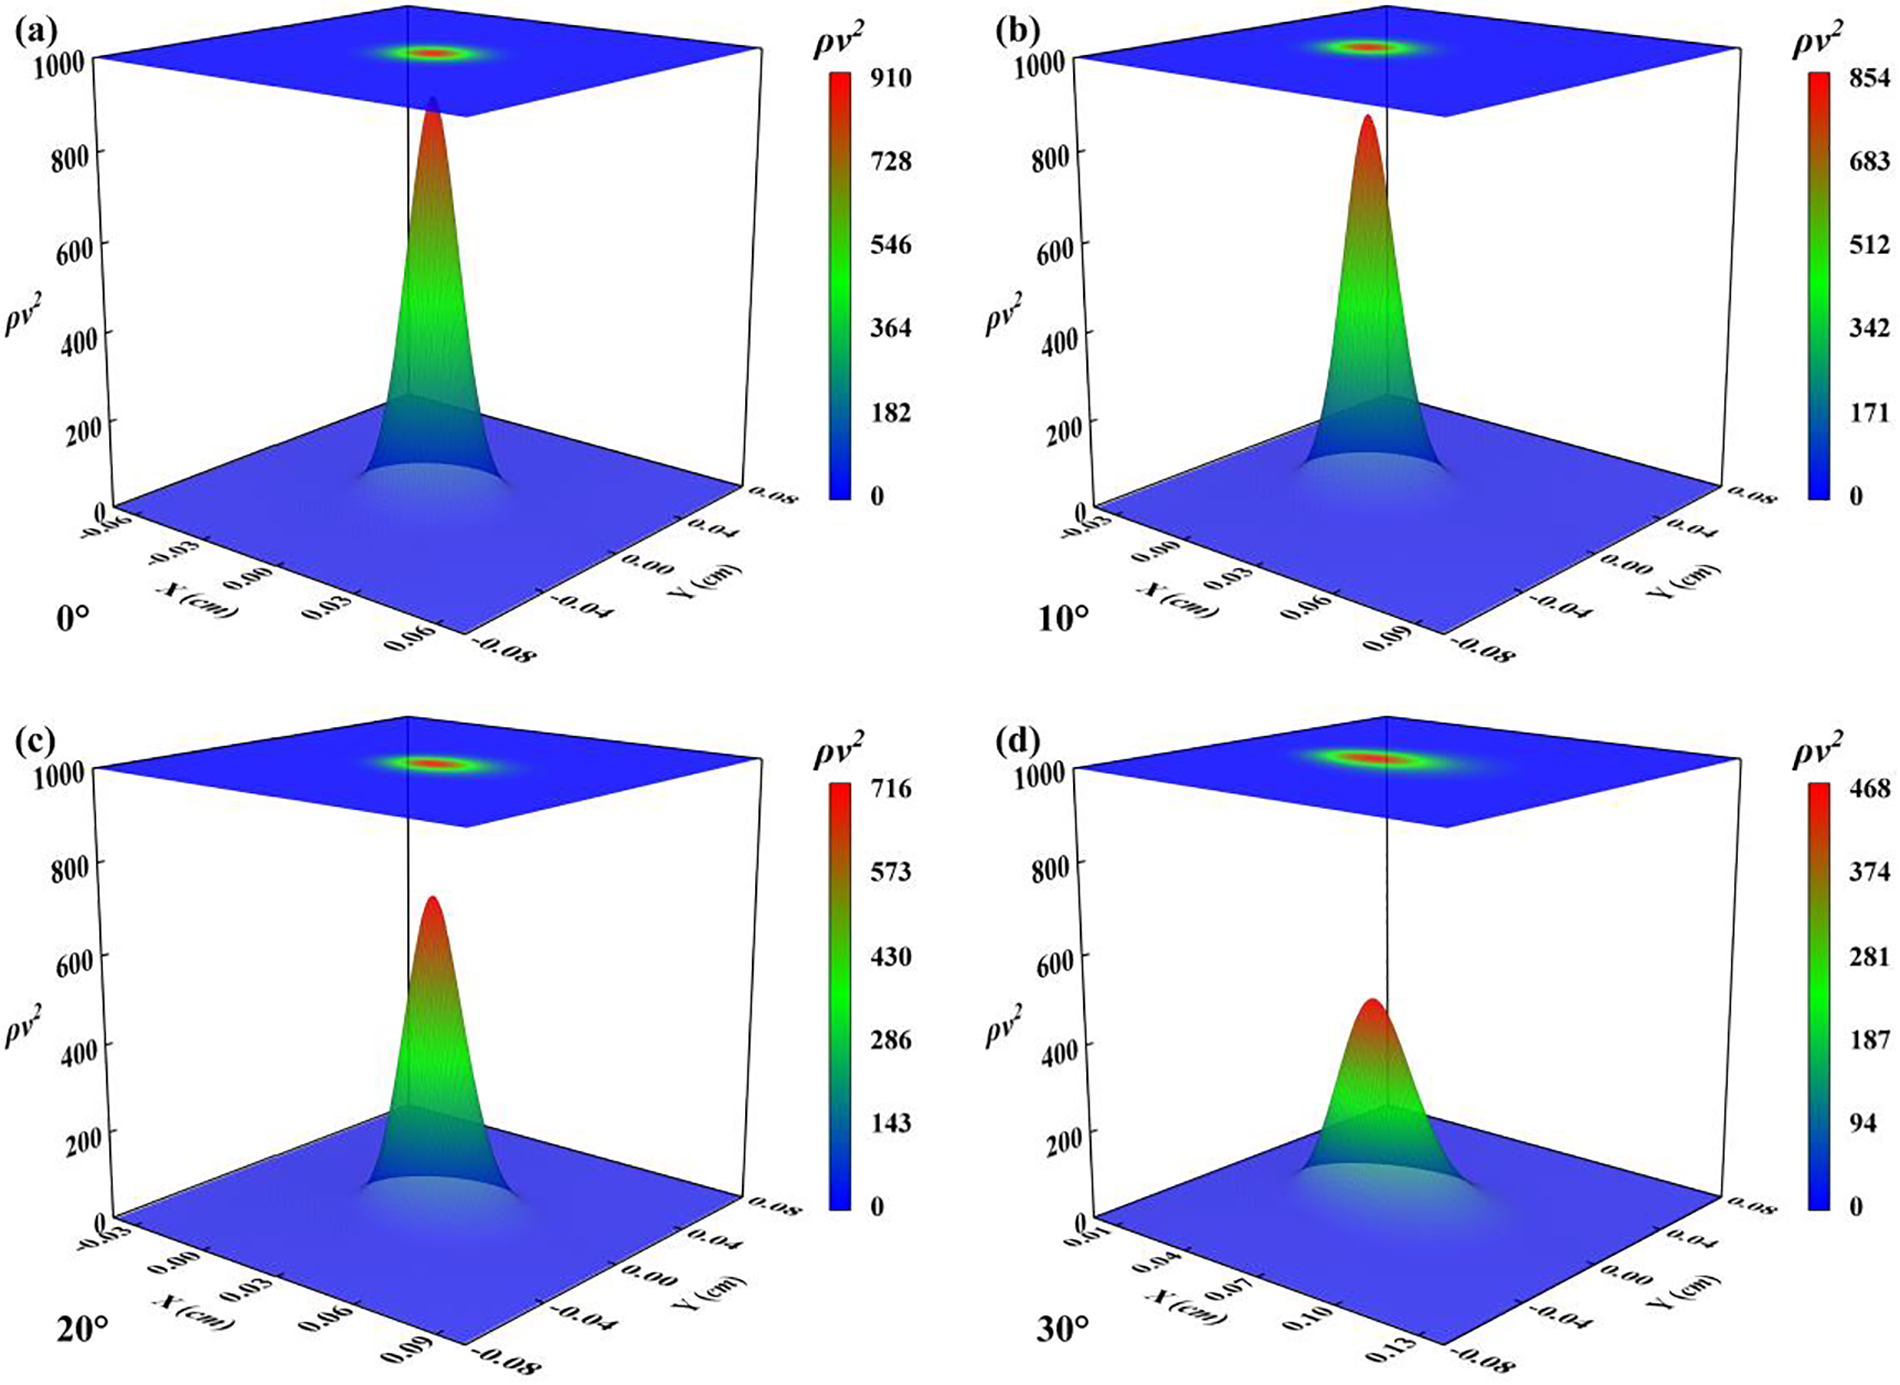
Figure 15: Force distribution of scouring surface: (a)
The resultant force
Fig. 16a shows the change in average shear stresses. The ratio of shear stress
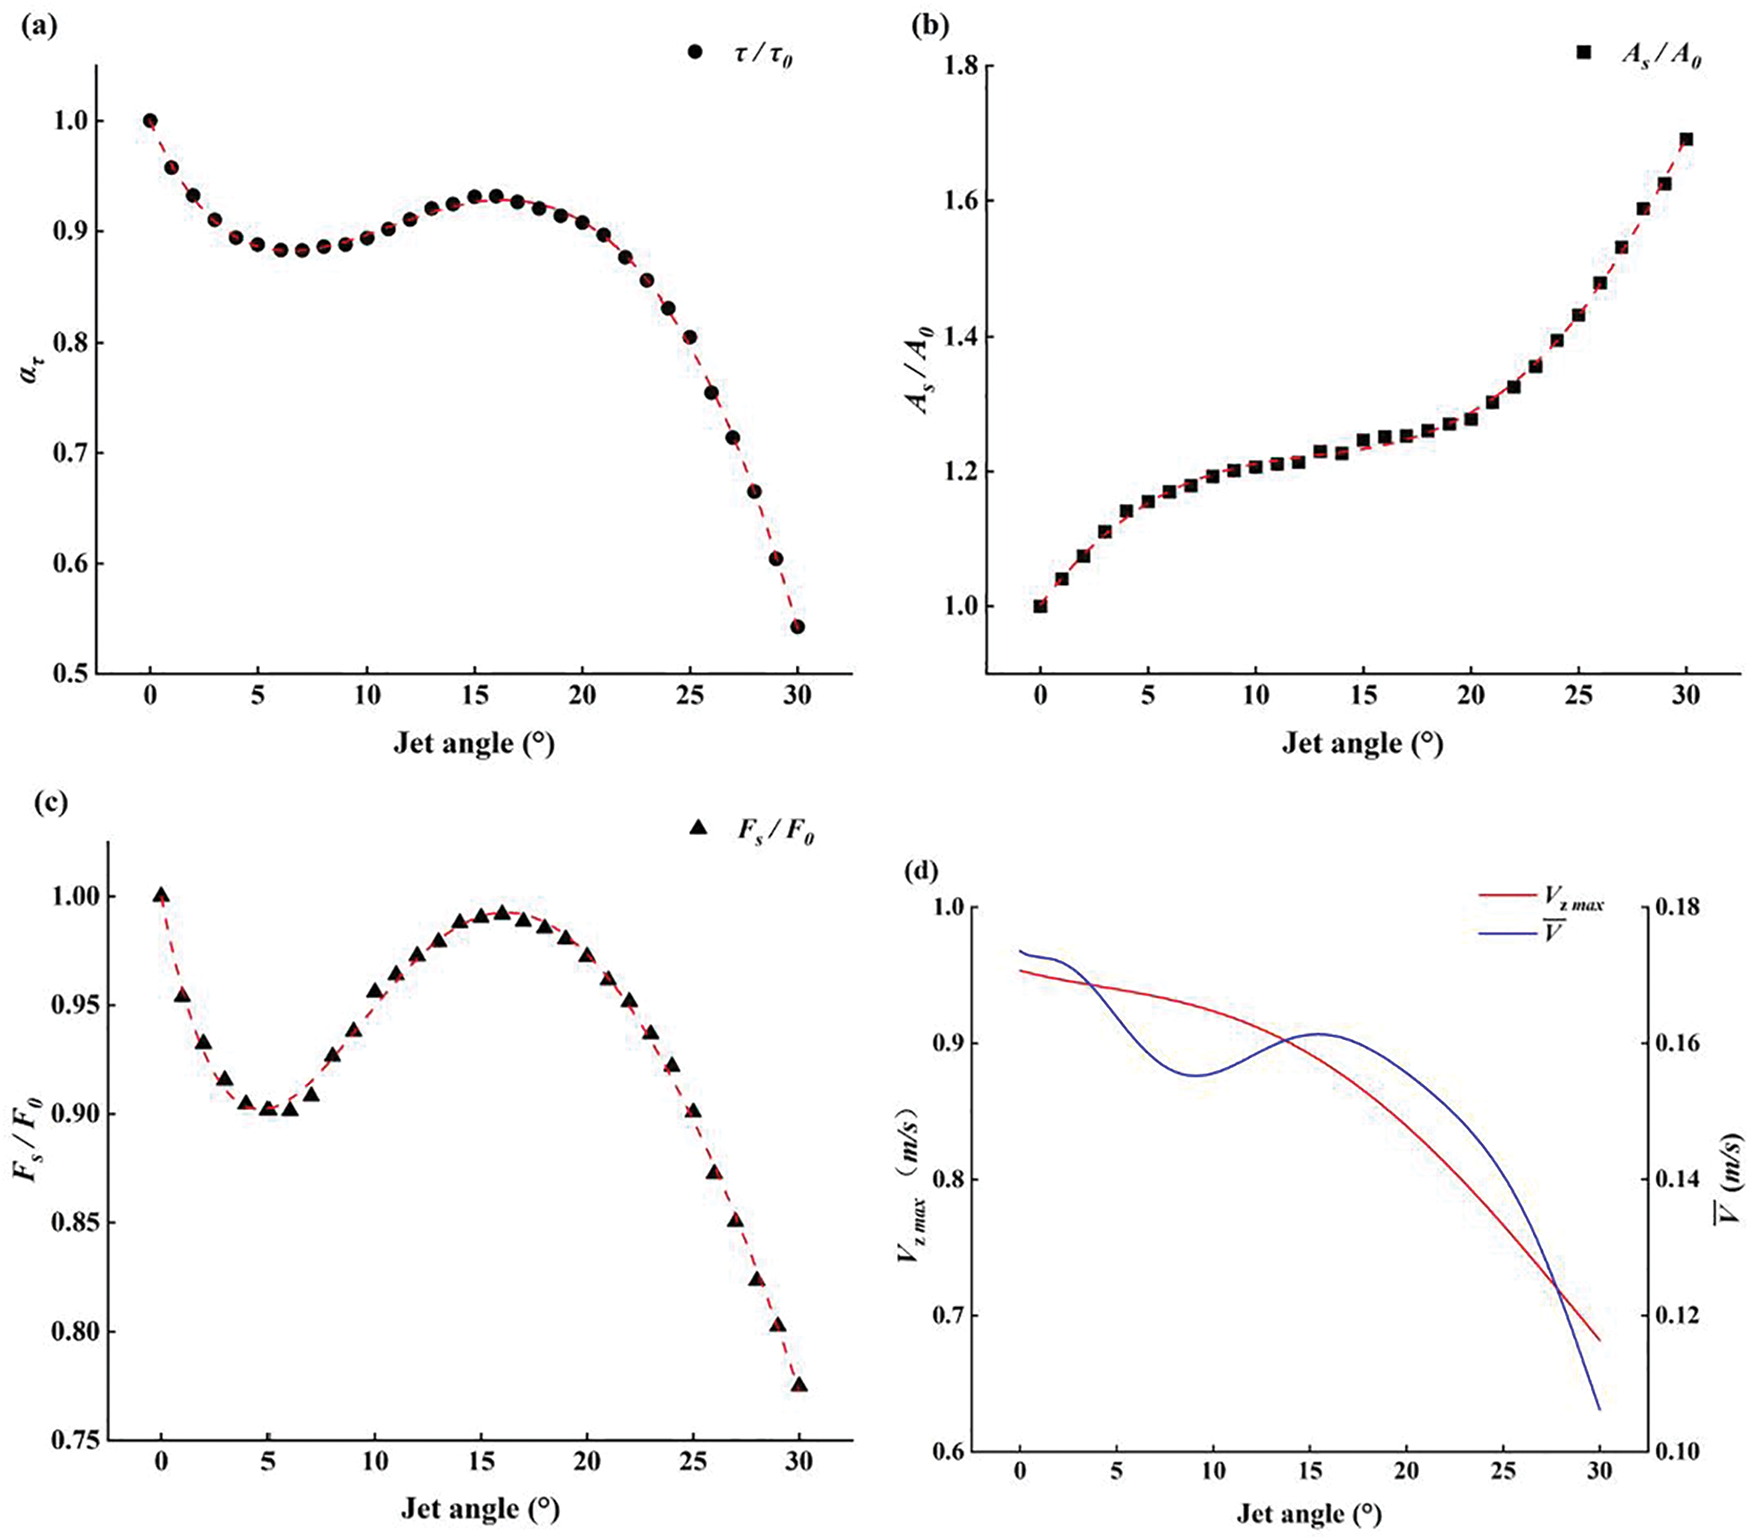
Figure 16: (a) Trend of the impingement area
Figs. 16b and 16c describe the variations of the impingement area
In summary, the impingement area
1. When the jet scouring vertically, the resultant force
2. After the jet begins to tilt, the velocity in the vertical direction decreases, resulting in a decrease in the resultant force
3. In the range of 10~20°, Fig. 16d indicates that the maximum velocity
4. As the jet angle continues to increase, the energy of the jet in the vertical direction rapidly decreases, resulting in a sharp decrease in both the maximum velocity
5. Although this study investigated jet angles within the range of 0~30°, it can be predicted that as the jet angle increases further (
Experiments and simulations were conducted to investigate the scouring phenomenon induced by an oblique water jet on an erodible sand bed. The scour holes were reconstructed in the form of point clouds, and the characteristics of the scour holes were analyzed over the range from 0° to 30°. Simultaneously, the variation pattern and mechanism of the average shear stresses
1. The results of dynamic scour development at different jet angles exhibited similarities and followed a logarithmic growth pattern. At an optimal impinging distance, the maximum scour depth reached more than two-thirds of the equilibrium state within a relatively short time. Subsequently, the growth rate decreased rapidly and finally reached an asymptotic state. When the jet was switched off, the suspended sediment re-deposited on the sand bed, resulting in the static scour depth being less than the dynamic scour depth.
2. The results indicate that the scouring effects are most pronounced when the jet angle is between 15° and 20°, within this range, a greater scour depth and a larger scour mass can be achieved simultaneously. Moreover, the specific energy of the jet is lower, allowing for a more effective conversion of the fluid’s kinetic energy into scouring work, which enhances the efficiency of scouring.
3. At the asymptotic state, the ratio of
4. For oblique scouring, the impingement area
The research results of this paper preliminarily determine that the optimum jet angle for water jet operations is between 15° and 20°. Different scouring effects can be achieved by selecting suitable parameters. The analysis of the average shear stresses
Acknowledgement: None.
Funding Statement: This work was supported by Research on the Influence of Nozzle Structure on the Scouring Effect of Submerged Water Jet (2023R411045), Design and Control Strategy Research of PEM Fuel Cell Hybrid Propulsion System for Ships (2024R411015), Zhejiang Ocean University Outstanding Master’s Thesis Cultivation Project (ZJOUYJS20230018), General Program of Education Department of Zhejiang Province (Y202250817) which was gained by Chen.
Author Contributions: The authors confirm contribution to the paper as follows: study conception and design: Hao Chen, Xianbin Teng; data collection: Zhaohao Zhang; analysis and interpretation of results: Hao Chen, Zhibin Zhang. Faxin Zhu; draft manuscript preparation: Hao Chen. All authors reviewed the results and approved the final version of the manuscript.
Availability of Data and Materials: The simulation data used in this study were generated through specific software and algorithms to produce simulated results. As it was generated based on specific models and parameters, if there are any further inquiries regarding the data and materials, please contact us directly. We will make every effort to provide reasonable support and clarification.
Conflicts of Interest: The authors declare that they have no conflicts of interest to report regarding the present study.
References
1. Xu K. Numerical simulation and optimization of the jetting and suction system of a jet-type trenching machine (Ph.D. Thesis). Harbin Engineering University: China; 2021. [Google Scholar]
2. Ke LJ, Gao YF, Gu YT, Ji J. Undrained bearing capacity of skids/pedrails during trenching for buried submarine pipelines. Comput Geotech. 2020;119(3–4):1–8. doi:10.1016/j.compgeo.2019.103362. [Google Scholar] [CrossRef]
3. Novan T, Taufiq W. Numerical simulation of early stages of scour around a submarine pipeline using a two-phase flow model. Ocean Eng. 2022;264(15):1109–23. doi:10.1016/j.oceaneng.2022.112503. [Google Scholar] [CrossRef]
4. Zhao ZD, Lian JJ, John Z. Interactions among waves, current, and mud: numerical and laboratory studies. Adv Water Resour. 2006;29(11):1731–44. doi:10.1016/j.advwatres.2006.02.009. [Google Scholar] [CrossRef]
5. Martino RG, Ciani FG, Paterson A, Piva MF. Experimental study on the scour due to a water jet subjected to lateral confinement. Eur J Mech B/Fluids. 2019;75:219–27. doi:10.1016/j.euromechflu.2018.10.009. [Google Scholar] [CrossRef]
6. Sarfaraz AA, Umesh CK, Kittur GRR. Influence of cohesion on scour under submerged circular vertical jets. J Hydraul Eng. 2003;129(12):1014–9. doi:10.1061/(ASCE)0733-9429(2003)129:. [Google Scholar] [CrossRef]
7. Yeh PH, Chang KA, John H, Billy E, Peter C, Andrew S. Large-scale laboratory experiment on erosion of sand beds by moving circular vertical jets. Ocean Eng. 2009;36(3/4):248–55. doi:10.1016/j.oceaneng.2008.11.006. [Google Scholar] [CrossRef]
8. Aderibigbe O, Rajaratnam N. Erosion of loose beds by submerged circular impinging vertical turbulent jets. J Hydraul Res. 1996;34(1):19–33. doi:10.1080/00221689609498762. [Google Scholar] [CrossRef]
9. Qian ZD, Hu XQ, Huai WX, Xue WY. Numerical simulation of sediment erosion by submerged jets using an Eulerian model. Sci China Technol Sci. 2010;53:3324–30. doi:10.1007/s11431-010-4165-3. [Google Scholar] [CrossRef]
10. Huang LY, Chen ZS, Ni LX, Du BX, Chen YJ, Lin S. Effects of target distance and impact angle on hydrodynamic performance of ultra-high pressure water jet nozzle. J Vibr Shock. 2022;41(15):169–78. doi:10.13465/j.cnki.jvs.2022.15.022. [Google Scholar] [CrossRef]
11. Chen LH, Gao DR, Cheng MZ, Cai Y, Guo LW. Effect of special-shaped nozzle structure on water jet performance. Processes. 2022;10(10):2066–70. doi:10.3390/pr10102066. [Google Scholar] [CrossRef]
12. Li T. Numerical simulation research on the erosion characteristics of underwater mixed flow nozzle jet (Master Thesis). Xi’an University of Technology: China; 2021. [Google Scholar]
13. Chen JQ, Zhang GH, Si JH, Shi HB, Wang XK. Experimental investigation of scour of sand beds by submerged circular vertical turbulent jets. Ocean Eng. 2022;257:1–12. doi:10.1016/j.oceaneng.2022.111625. [Google Scholar] [CrossRef]
14. Handoko WD, Widiastuti N, Budi GS, Karelius K, Pratapa S. Design and characterization of a stacked siever for natural sand processing. Mater Today Proc. 2021;44(3):3237–40. doi:10.1016/j.matpr.2020.11.446. [Google Scholar] [CrossRef]
15. Dong CM, Yu GL, Zhang HX, Zhang MX. Scouring by submerged steady water jet vertically impinging on a cohesive bed. Ocean Eng. 2020;196:15–26. doi:10.1016/j.oceaneng.2019.106781. [Google Scholar] [CrossRef]
16. Schmunk C, Dogan M, Altun S. Predicting propeller jet scour in silty and sandy marine environments. Ocean Eng. 2023;286(1):1–14. doi:10.1016/j.oceaneng.2023.115558. [Google Scholar] [CrossRef]
17. Bettina P, Peter R, Wolfgang S. Laser scanning—surveying and mapping agencies are using a new technique for the derivation of digital terrain models. ISPRS J Photogramm Remote Sens. 1999;54(2–3):95–104. doi:10.1016/S0924-2716(99)00005-2. [Google Scholar] [CrossRef]
18. Wang C, Wang X, Shi W, Lu W, Tan SK, Zhou L. Experimental investigation on impingement of a submerged circular water jet at varying impinging angles and Reynolds numbers. Exp Therm Fluid Sci. 2017;89:189–98. doi:10.1016/j.expthermflusci.2017.08.005. [Google Scholar] [CrossRef]
19. Rajaratnam N, Mazurek K. Erosion of sand by circular impinging water jets with small tailwater. J Hydraul Eng. 2003;129(3):225–9. doi:10.1061/(ASCE)0733-9429(2003)129:3(225). [Google Scholar] [CrossRef]
20. Shakya R, Singh M, Sarda VK, Kumar N. Scour depth forecast modeling caused by submerged vertical impinging circular jet: a comparative study between ANN and MNLR. Sustain Water Resour Manag. 2022;8(2):1–10. doi:10.1007/s40899-022-00634-z. [Google Scholar] [CrossRef]
21. Manzouri M, Azimi AH. Laboratory experiments evaluating sedimentation and mound formation of obliquely discharged sand particles in stagnant water. Int J Sediment Res. 2019;34:564–76. doi:10.1016/j.ijsrc.2019.05.003. [Google Scholar] [CrossRef]
22. Zhang LS. Design and working mechanism study of deep-sea dredging equipment (Ph.D. Thesis). Dalian Maritime University: China; 2017. [Google Scholar]
23. Al-Husseini TR, Al-Madhhachi AST, Naser ZA. Laboratory experiments and numerical model of local scour around submerged sharp crested weirs. J King Saud Univ Eng Sci. 2020;32(3):167–76. doi:10.1016/j.jksues.2019.01.001. [Google Scholar] [CrossRef]
24. Ozan AY, Yüksel Y. Simulation of a 3D submerged jet flow around a pile. Ocean Eng. 2010;37(8–9):819–32. doi:10.1016/j.oceaneng.2010.02.018. [Google Scholar] [CrossRef]
25. Swaroopini AS, Kumar MG, Kumar TN. Numerical simulation and optimization of high performance supersonic nozzle at different conical angles. Int J Res Eng Technol. 2015;4(9):268–73. doi:10.15623/IJRET.2015.0409049. [Google Scholar] [CrossRef]
26. Mercier F, Golay F, Bonelli S, Anselmet F, Borghi R, Philippe P. 2D axisymmetrical numerical modelling of the erosion of a cohesive soil by a submerged turbulent impinging jet. Eur J Mech B/Fluids. 2014;45:36–50. doi:10.1016/j.euromechflu.2013.12.001. [Google Scholar] [CrossRef]
27. Anirban G, Ronald MB, Ram B. An experimental and numerical study of water jet cleaning process. J Mater Process Technol. 2011;211(4):610–8. doi:10.1016/j.jmatprotec.2010.11.017. [Google Scholar] [CrossRef]
28. Meng R. Experimental research and numerical simulation of trenching technology behind subsea pipeline (Ph.D. Thesis). Tianjin University: China; 2012. [Google Scholar]
29. Mehnifard M, Dalfardi S, Baghdadi H, Seirfar Z. Simulation of local scour caused by submerged horizontal jets with Flow-3D numerical model. Desert. 2015;20(1):47–55. doi:10.22059/JDESERT.2015.54082. [Google Scholar] [CrossRef]
30. Sun WH. Research on structure of submarine jet trencher and optimization of jet arm (Master Thesis). Harbin Engineering University: China; 2021. [Google Scholar]
31. Xue WY. Study of mechanism of solid-liquid two-phase flow and two-phase flow model applied in engineering (Ph.D. Thesis). Wuhan University: China; 2014. [Google Scholar]
32. Nielsen AW, Liu XF, Sumer BM, Fredsøe J. Flow and bed shear stresses in scour protections around a pile in a current. Coast Eng. 2013;72:20–38. doi:10.1016/j.coastaleng.2012.09.001. [Google Scholar] [CrossRef]
33. Ahn SH, Xiao YX. Unsteady prediction of cavitating flow around a three dimensional hydrofoil by using a modified RNG k-epsilon model. Ocean Eng. 2018;158:275–85. doi:10.1016/j.oceaneng.2018.04.005. [Google Scholar] [CrossRef]
34. Wang HL, Qian ZD, Zhang D, Wang T, Wang C. Numerical study of the normal impinging water jet at different impinging height, based on wray-agarwal turbulence model. Energies. 2020;13(7):1744. doi:10.3390/en13071744. [Google Scholar] [CrossRef]
35. Jiang TW, Huang ZW, Li JB, Zhou YS, Xiong C. Effect of nozzle geometry on the flow dynamics and resistance inside and outside the cone-straight nozzle. ACS Omega. 2022;7(11):9652–65. doi:10.1021/acsomega.1c07050. [Google Scholar] [PubMed] [CrossRef]
36. Dai BL. Research on the jetting arm and erosion process of jet-assisted ROV trenching machine (Master Thesis). Zhejiang University: China; 2016. [Google Scholar]
37. Rijn V, Leo C. Sediment transport; Part I, bed load transport. J Hydraul Eng. 1984;110(10):1431–56. doi:10.1061/(ASCE)0733-9429(1984)110:. [Google Scholar] [CrossRef]
38. Oosterlee CW. A GMRES-based plane smoother in multigrid to solve 3D anisotropic fluid flow problems. J Comput Phys. 1997;130(1):41–53. doi:10.1006/jcph.1996.5442. [Google Scholar] [CrossRef]
39. Ji RW. Research on hydrodynamic oscillation between narrow gaps of adjacent buoyancy structures (Master Thesis). Jiangsu University of Science and Technology: China; 2017. [Google Scholar]
40. Liu Y. Maximizing the CFL number of stable time? Space domain explicit finite—difference modeling. J Comput Phys. 2020;416:1–17. doi:10.1016/j.jcp.2020.109501. [Google Scholar] [CrossRef]
41. Dutta D, Afzal MS. Scour around twin-piles under combined wave-current flows. Coast Eng. 2024;189:104477. doi:10.1016/j.coastaleng.2024.104477. [Google Scholar] [CrossRef]
42. Mao JY, Si JH, Chen JQ, Li GD, Wang XK. Experimental investigation on sand bed scour by an oblique planar water jet at varying impinging angles. Ocean Eng. 2023;279:1–9. doi:10.1016/j.oceaneng.2023.114526. [Google Scholar] [CrossRef]
43. Rajaratnam N, Macdougall RK. Erosion by plane wall jets with minimum tailwater. J Hydraul Eng. 1983;109(7):1061–4. doi:10.1061/(ASCE)0733-9429(1983)109:7(1061). [Google Scholar] [CrossRef]
44. Rajaratnam N. Erosion by plane turbulent jets. J Hydraul Res. 1981;19(4):339–58. doi:10.1080/00221688109499508. [Google Scholar] [CrossRef]
45. Vijay MM, Zou C, Hu SG, Remisz J, Tavoularis S. A study of the practicality of cavitating water jets. Int J Surface Mining Reclamation Environ. 1993;7(4):137–47. doi:10.1080/09208119308964699. [Google Scholar] [CrossRef]
46. Rajaratnam N, Aderibigbe O, Pochylko D. Erosion of sand beds by oblique plane water jets. Proc Inst Civil Eng Water Maritime Energy. 1995;112(1):31–8. doi:10.1680/iwtme.1995.27391 [Google Scholar] [CrossRef]
47. Ankit C, Jain RK, Kothyari UC. Scour under submerged circular vertical jets in cohesionless sediments. ISH J Hydraulic Eng. 2013;20(1):32–37. doi:10.1080/09715010.2013.835101. [Google Scholar] [CrossRef]
48. Kim YS, Han B, Kang GO. Effect of incidence angle of current on the hydraulic resistance capacity of clayey soil. J Korean Soc Coast Ocean Eng. 2012;24(1):26–35. doi:10.9765/KSCOE.2012.24.1.026 [Google Scholar] [CrossRef]
49. Kim YS, Kang GO, Tsuchida T. Experimental evaluation of the effect of the incidence angle and consolidation pressure on the hydraulic resistance capacity of clayey soils. Soils Found. 2019;59(1):110–21. doi:10.1016/j.sandf.2018.09.007. [Google Scholar] [CrossRef]
Cite This Article
 Copyright © 2024 The Author(s). Published by Tech Science Press.
This work is licensed under a Creative Commons Attribution 4.0 International License , which permits unrestricted use, distribution, and reproduction in any medium, provided the original work is properly cited.
 Downloads
 Citation Tools