
 Submit a Paper
 Propose a Special lssue
 Open Access
ARTICLE

Molecular Dynamics Numerical Simulation of Adsorption Characteristics and Exploitation Limits in Shale Oil Microscopic Pore Spaces
Taizhou Oil Production Plant, Sinopec East China Oil and Gas Company, Taizhou, 225300, China
* Corresponding Author: Guochen Xu. Email:
Fluid Dynamics & Materials Processing 2024, 20(8), 1915-1924. https://doi.org/10.32604/fdmp.2024.048337
Received 05 December 2023; Accepted 30 January 2024; Issue published 06 August 2024
 View Full Text
 Download PDF
Abstract
Microscopic pore structure in continental shale oil reservoirs is characterized by small pore throats and complex micro-structures. The adsorption behavior of hydrocarbons on the pore walls exhibits unique physical and chemical properties. Therefore, studying the adsorption morphology of hydrocarbon components in nanometer-sized pores and clarifying the exploitation limits of shale oil at the microscopic level are of great practical significance for the efficient development of continental shale oil. In this study, molecular dynamics simulations were employed to investigate the adsorption characteristics of various single-component shale oils in inorganic quartz fissures, and the influence of pore size and shale oil hydrocarbon composition on the adsorption properties in the pores was analyzed. The results show that different molecules have different adsorption capacities in shale oil pores, with lighter hydrocarbon components (CH) exhibiting stronger adsorption abilities. For the same adsorbed molecule, the adsorption amount linearly increases with the increase in pore diameter, but larger pores contribute more to shale oil adsorption. In shale pores, the thickness of the adsorption layer formed by shale oil molecules ranges from 0.4 to 0.5 nm, which is similar to the width of alkane molecules. Shale oil in the adsorbed state that is difficult to be exploited is mainly concentrated in the first adsorption layer. Among them, the volume fraction of adsorbed shale oil in 6 nm shale pores is 40.8%, while the volume fraction of shale oil that is difficult to be exploited is 16.2%.Keywords
The depletion of conventional oil and gas resources has led to a decline in production, while the development of shale oil and gas is changing the global energy system [1], stimulating the initiation of shale oil and gas development projects in the oil and gas industry [2,3]. However, the abundant nanoscale pores and extremely low permeability of shale make its exploitation more complex compared to conventional oil and gas, and its microscopic mechanism is still unclear [4–6]. Due to the affinity of shale oil to the pore walls in extremely small pore spaces, its adsorption behavior exhibits unique physical and chemical properties [7]. Therefore, studying the microscopic exploitation limits of shale oil and revealing the adsorption laws of shale oil are of great research significance in seeking new approaches to promote desorption and enhance recovery efficiency. In unconventional shale reservoirs, the pore sizes are generally in the nanometer range. The existence of extremely small pores in the range of 2–200 nm has been experimentally confirmed by atomic force microscopy (AFM) [8,9]. However, conducting micro-scale experiments targeting nanometer-sized pores is extremely challenging due to the pore size being below the optical resolution. With the development of computer technology and molecular dynamics theory, molecular dynamics simulation has been applied in recent years as an effective method to compensate for experimental limitations and study the behavior of oil and gas in shale nanoscale pores. Currently, molecular dynamics simulation has become an effective method for studying molecular behavior within nanoscale pores [10–12], obtaining the dynamic properties of gas molecules through simulating molecular-scale random Brownian motion [13]. In molecular simulation, different force fields are used to describe the interaction parameters between shale and gas, such as the dredging force field [14], ReaxFF force field [15], COMPASS force field [16], CLAYFF force field [17]. In order to better study the adsorption state of shale oil in pores, the grand canonical Monte Carlo (GCMC) simulation method has been widely used in molecular simulation. The GCMC method maintains the temperature, chemical potential, and volume of the system unchanged during the simulation process, allowing the number of adsorbate molecules in the system to vary and enabling the exchange of substance and energy within the pore. Through the GCMC method, researchers can simulate the adsorption behavior of adsorbate molecules in shale pores and accurately calculate and analyze the adsorption amount, adsorption position, and substance and energy exchange during the adsorption process [18], this allows for in-depth study of the adsorption mechanism of shale oil in pores, prediction of adsorption amount, and further optimization of exploitation strategies.
Molecular dynamics (MD) simulations have been used to study the adsorption and diffusion mechanisms of shale oil molecules in shale nanochannels. For example, some researchers have studied single-component adsorption of normal and branched alkanes in slit with different pore sizes (1, 2, and 4 nm) at temperatures of 390 K. Wu et al. [19] used molecular simulation and experimental data to establish a model of uniform gas migration in shale nanoscale pores, which took into account the real gas effect, stress and adsorption layer coupling effect. Sui et al. [20] studied the adsorption and transport behavior of n-octane in the slit pores of nanoscale dolomites by using the giant Regular Monte Carlo simulation (GCMC) and MD simulation. Szczerba et al. [21] used MD simulation method to study the occurrence state and characteristics of shale gas in nanoscale pores, and proposed a shale gas reserve estimation model considering adsorption. Many experts and scholars have studied adsorption in clay science, and through the study of the interaction between clay aggregates and water, we can better understand the interaction between shale minerals and wetting media such as water or oil [22,23]. In summary, the study of the occurrence, adsorption state and distribution of shale oil in nanocracks is of great significance for the study of the flow and production of shale oil, and is conducive to further elucidate the mechanism of the occurrence state of shale oil in pores and fractures, as well as the coupling relationship between shale oil and pore/fracture media.
In this study, the Funing Formation shale in the Sandu block of the Subei Basin is chosen as the object of study. By constructing inorganic shale pore walls on the nanometer scale, the grand canonical Monte Carlo (GCMC) simulation method and molecular dynamics (MD) simulation method are applied to investigate the occurrence state and adsorption characteristics of multiple single components (C6H14, C8H18, C12H26) in inorganic shale pores of different diameters. By studying the influence of pore size and shale oil hydrocarbon composition on the occurrence state of shale oil in pores and fractures, theoretical guidance is provided for the calculation of adsorbed oil and free oil in shale, as well as the quantitative characterization of shale oil mobility, which helps to explore new approaches to promote desorption and enhance shale oil recovery efficiency.
2 Model Construction and Molecular Simulation
2.1 Construction of Pore Structure and Alkane Molecular Models for Shale Oil
The chemical composition of crude oil is highly complex, including a significant amount of normal alkanes, branched alkanes, cyclic alkanes, aromatics, and asphaltenes. However, due to the light nature of shale oil (0.7–20 mPa·s), this study primarily focuses on normal alkanes. The molecular structures of n-hexane (C6H14), n-octane (C8H18), and n-dodecane (C12H26) were constructed in this research. Quartz is one of the most typical inorganic components in shale, making it a suitable candidate for simulating shale pore structures with high accuracy. In this study, the quartz unit cell was replicated, and a silica cell was used to construct shale pores. Quartz slit-type shale pores with dimensions of 3, 4, 5, 6, 8, 10, 18, and 20 nm were established. The initial atomic positions of the unit cell were obtained from the American Mineralogist Crystal Structure Database (AMCSD), with no ion substitutions. The size of a single unit cell was 4.913 × 4.913 × 5.405 Å. During the construction of the shale pore models, the quartz unit cell was cleaved along the (0 0 1) crystal plane, (0 0 1) crystal surface is a relatively stable and clear surface of quartz minerals. The mineral molecules on the innermost surface of the quartz wall were hydroxylated to simulate the wettability in real core pores. Surface hydroxylation (−OH) is achieved by adding H to the surface O atom to obtain a wet shale pore surface. Surface methylation is achieved by connecting the surface to −CH3, which can be used to simulate oil-wet pore surfaces. Through the above operations, the surface structures of different wettability minerals can be obtained. In this study, we mainly study the occurrence state of shale oil in inorganic water-wet pores, so we hydroxylated the quartz surface. Fig. 1 depicts the molecular structure models of shale oil in the simulated pores and the adsorbate molecules after configuration optimization, where yellow and red represent the silicon and oxygen atoms constituting the shale pore framework, and gray and white represent the hydrogen and carbon atoms in the alkanes, respectively.
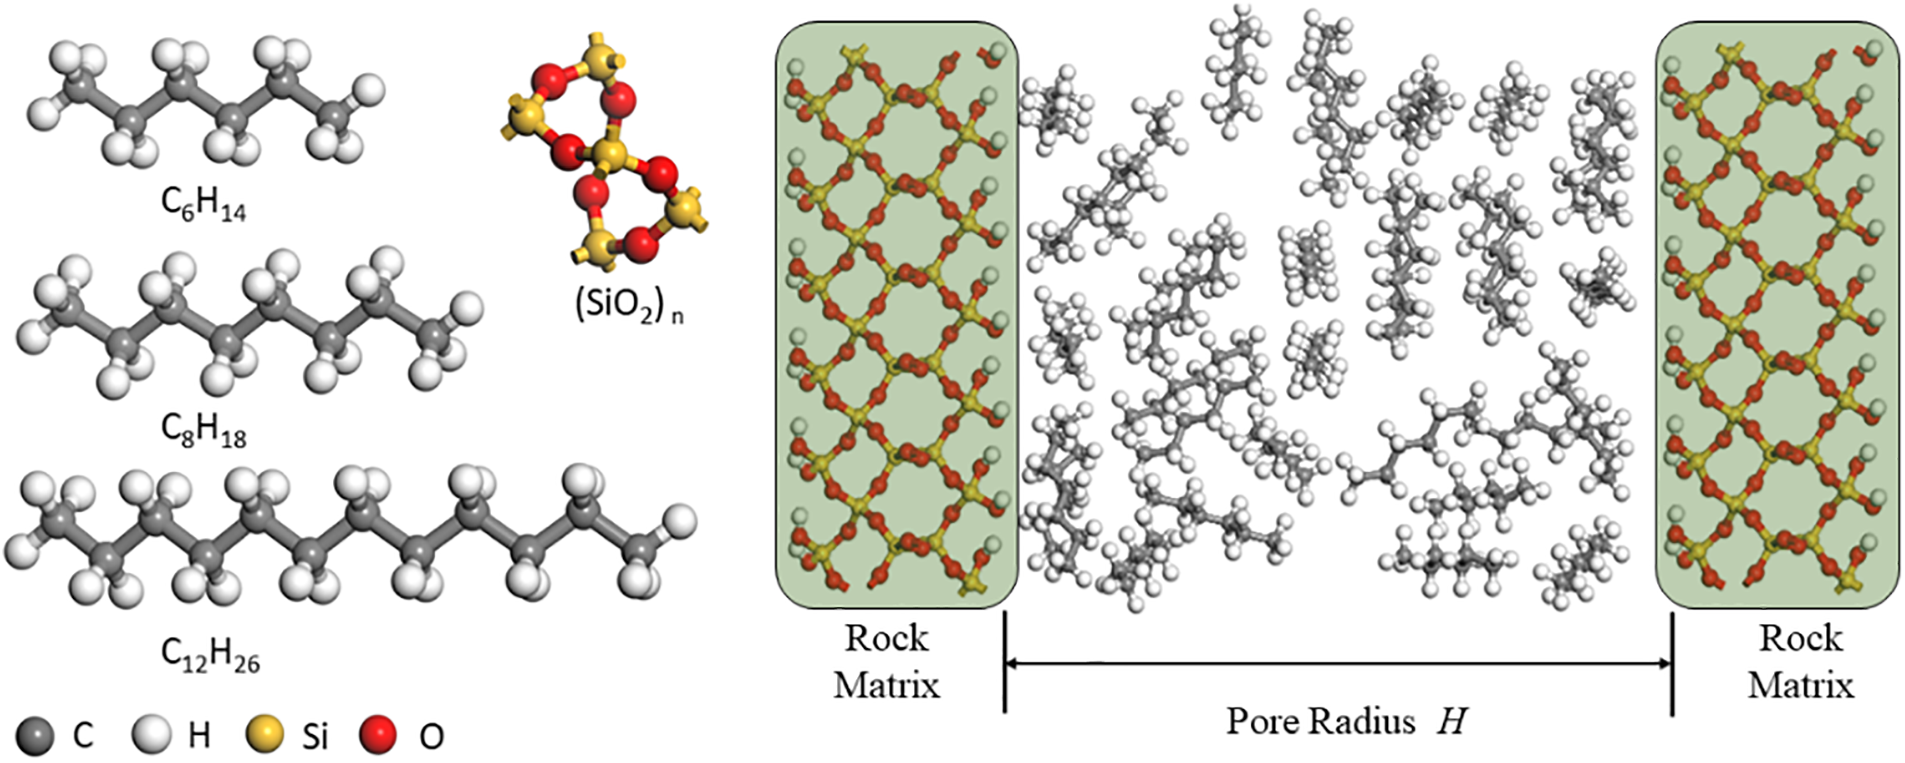
Figure 1: Molecular structure model of shale oil occurrence state simulation in pores
2.2 Simulation Conditions and Procedures
The present study initially employed grand canonical Monte Carlo (GCMC) simulation method to investigate the adsorption behavior of shale oil molecules in a molecular model of shale nanopores. The simulations were performed using the isothermal-isobaric ensemble at different temperatures, and the corresponding fugacity values at each point were obtained for isothermal adsorption simulation. To handle the calculations for large particles, the simulation system adopted periodic boundary conditions, tracking only the motion of particles within the central box. Under periodic boundary conditions, the simulation assumed an infinite number of equivalent boxes containing the same particles. When a particle in the central box was forced to leave the box at a certain velocity, a corresponding particle from the other side of the box entered the box with the same velocity to eliminate boundary effects. The number of particles in the system remained constant, equivalent to an infinitely large space with a large number of computational particles. In periodic boundary conditions, the nearest image method was used to calculate the intermolecular interaction forces in the system, and the truncation method was used to calculate the long-range nonbonded interactions.
For this study, the COMPASS force field was selected for simulation, which has a broad applicability range. It is the first force field that is suitable for both organic and inorganic materials and is currently widely used to calculate covalent molecules containing a majority of inorganic and organic materials, such as silicates/aluminosilicates and polymers. This force field includes both intra-molecular interactions and intermolecular interactions, and its functional form is expressed as follows:
The total potential energy consists of ten components: Eb represents the potential energy change due to bond stretching, Eθ represents the potential energy change caused by bond angle bending, E∅ represents the potential energy change resulting from dihedral angle torsion, Eb∅ represents the bond-torsion coupling energy, Ebθ represents the bond−angle coupling energy, Eθθ represents the angle−angle coupling energy, Eθ∅ represents the angle-torsion coupling energy, Eθθ∅ represents the angle−angle−torsion coupling energy. The Coulomb interaction energy is denoted as Eele:
After obtaining the initial adsorption configuration of shale oil pores through GCMC simulation, the system was subjected to energy minimization to adjust the positions of fluid atoms and obtain a stable initial structure. Subsequently, molecular dynamics simulation was performed to analyze the adsorption morphology of shale oil. The smart algorithm was used for geometric optimization during the energy minimization process, which integrates commonly used algorithms such as the steepest descent method and the conjugate gradient method. The smart algorithm automatically allocates the algorithm based on the energy situation of the configuration and is suitable for geometric optimization of most configurations.
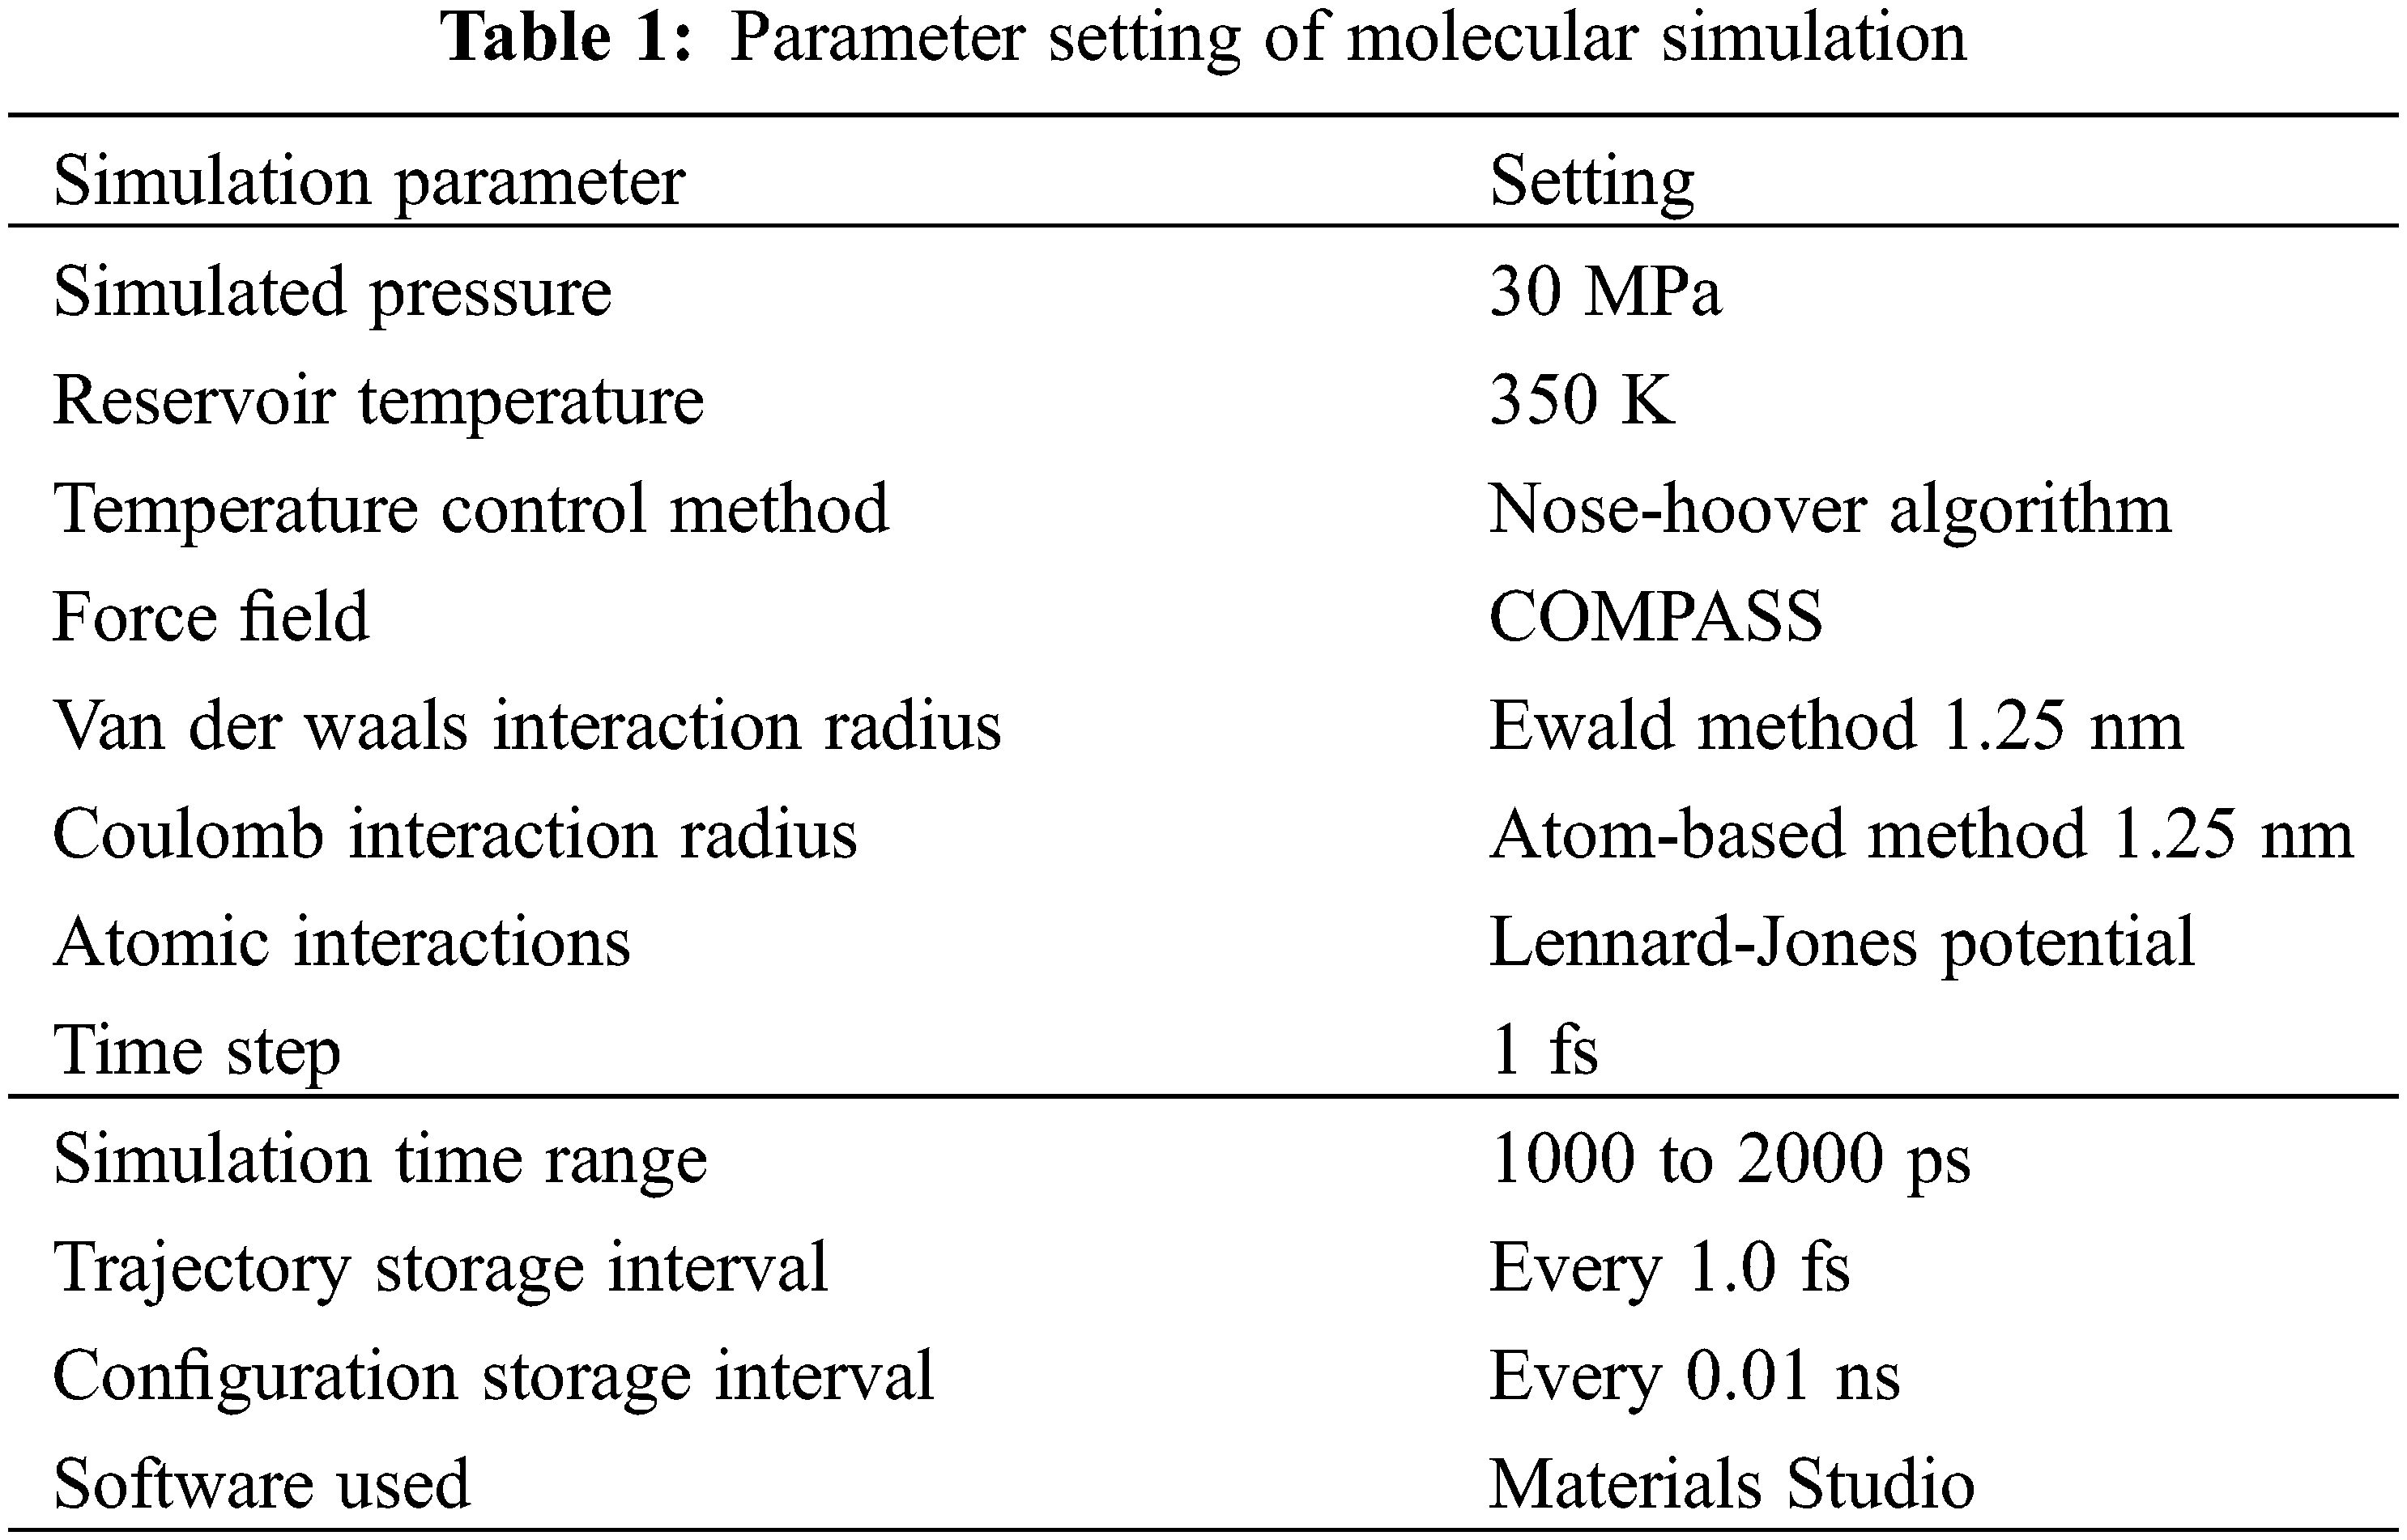
To ensure the comparability of simulation results, a uniform set of simulation parameters was used for the molecular dynamics simulation process: the simulated pressure was set at 30 MPa, while the simulated reservoir temperature was maintained at 350 K. The temperature control method was the Nose-Hoover algorithm, the force field used was COMPASS, the van der Waals and coulomb interaction radius was both set to 1.25 nm, the Ewald method was used to handle electrostatic interactions, the Atom-based method was used to handle van der Waals interactions, and the Lennard-Jones potential was used to describe atomic interactions. The time step of the dynamics simulation was 1 fs, and the simulation time ranged from 1000 to 2000 ps. Molecular trajectories were stored every 1.0 fs, and configurations were stored every 0.01 ns for result analysis. The molecular simulations were performed using the Forcite module of the Materials Studio software developed by Accelrys. The parameters of molecular simulation are shown in Table 1.
The dynamics simulations mainly employed the NVT and NVE ensembles. During the energy minimization and dynamics simulation process, the pore walls were kept fixed. The minimum and maximum adsorption capacities were calculated by Bet isotherm model. The Bet isotherm model assumes that adsorbed molecules form multiple layers on the adsorbed surface and there are interactions between the layers. To obtain the density distribution curve of the fluid inside the slit-type pore, the pore was divided into 50 cells along the z-axis, and the number of molecules in each cell was integrated to calculate the density distribution curve.
3 Analysis of Microscopic Adsorption Characteristics and Calculation of Mobilization Limit of Shale Oil
3.1 Analysis of Microscopic Pore Space Adsorption Characteristics
Under Reservoir Conditions of 10 MPa and 350 K, the equilibrium adsorption capacities of C6H14, C8H18 and C12H26 molecules in silica pores with widths ranging from 3 to 20 nm are presented in Fig. 2.
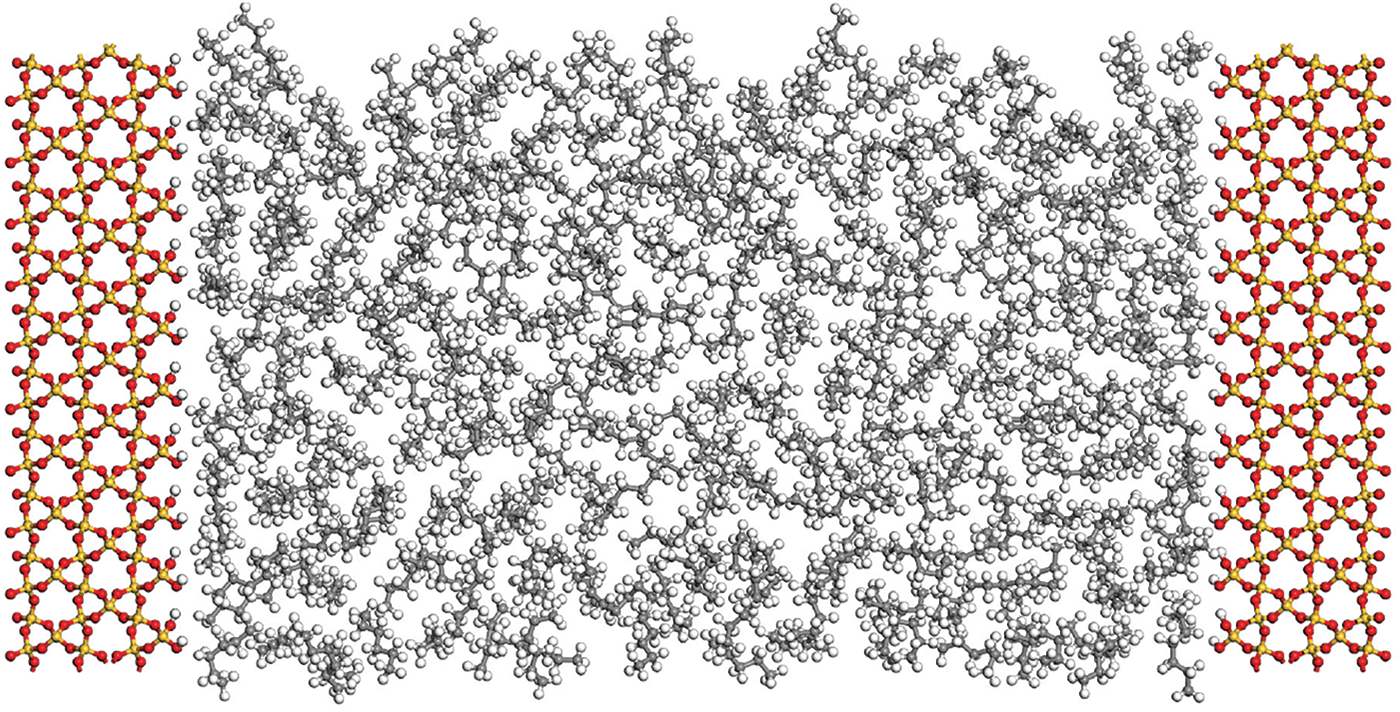
Figure 2: Molecular structure model of shale oil occurrence state simulation in pores
The study reveals variations in the adsorption abilities of different molecules within shale pore inner wall, with the adsorption capacities of shale oil molecules being in the order of C6H14 > C8H18 > C12H26, as shown in Fig. 3. This discrepancy is attributed to the decrease in adsorption capacities of shale oil molecules with increasing molecular size within pores of the same diameter. In actual reservoirs, limited by pore volume, smaller pores can only adsorb smaller molecules of shale oil, thus larger micropores contribute significantly to shale oil adsorption, while smaller shale oil molecules exhibit better adsorption properties.
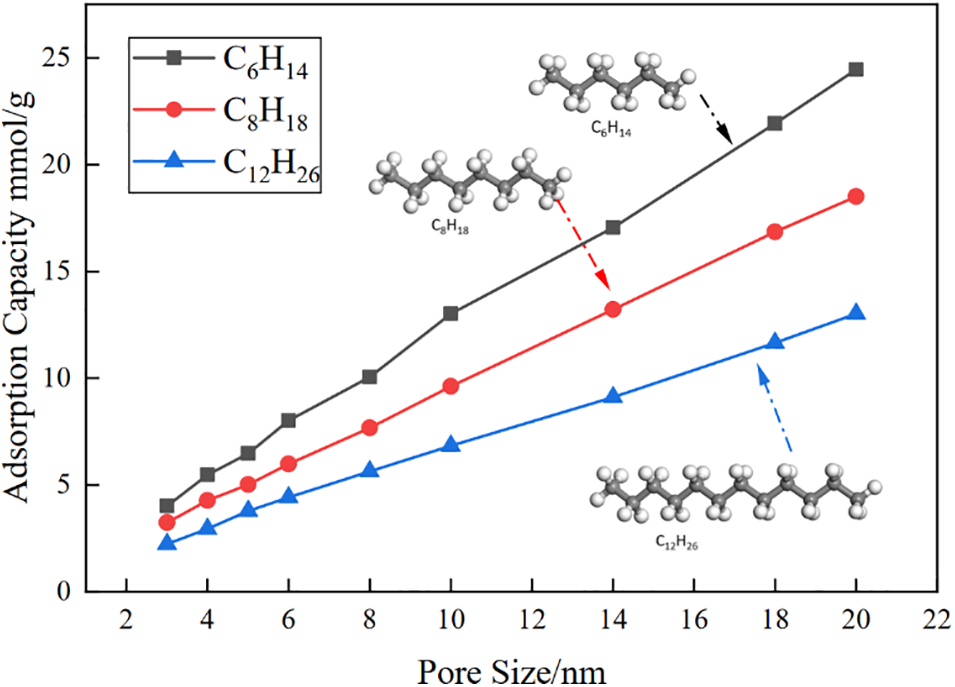
Figure 3: Adsorption curves of different shale oil molecules in pores with different pore radius
Furthermore, for the same adsorbate molecule, the adsorption capacity exhibits a linear increase trend as the pore diameter increases. Additionally, when the pore diameter is small, the average adsorption capacity of the three molecules shows relatively small differences compared to the maximum and minimum adsorption capacities. However, as the pore diameter increases, the differences between the average adsorption capacity and the minimum adsorption capacity gradually increase, although they remain relatively small compared to the maximum adsorption capacity, as shown in Figs. 4a–4c.
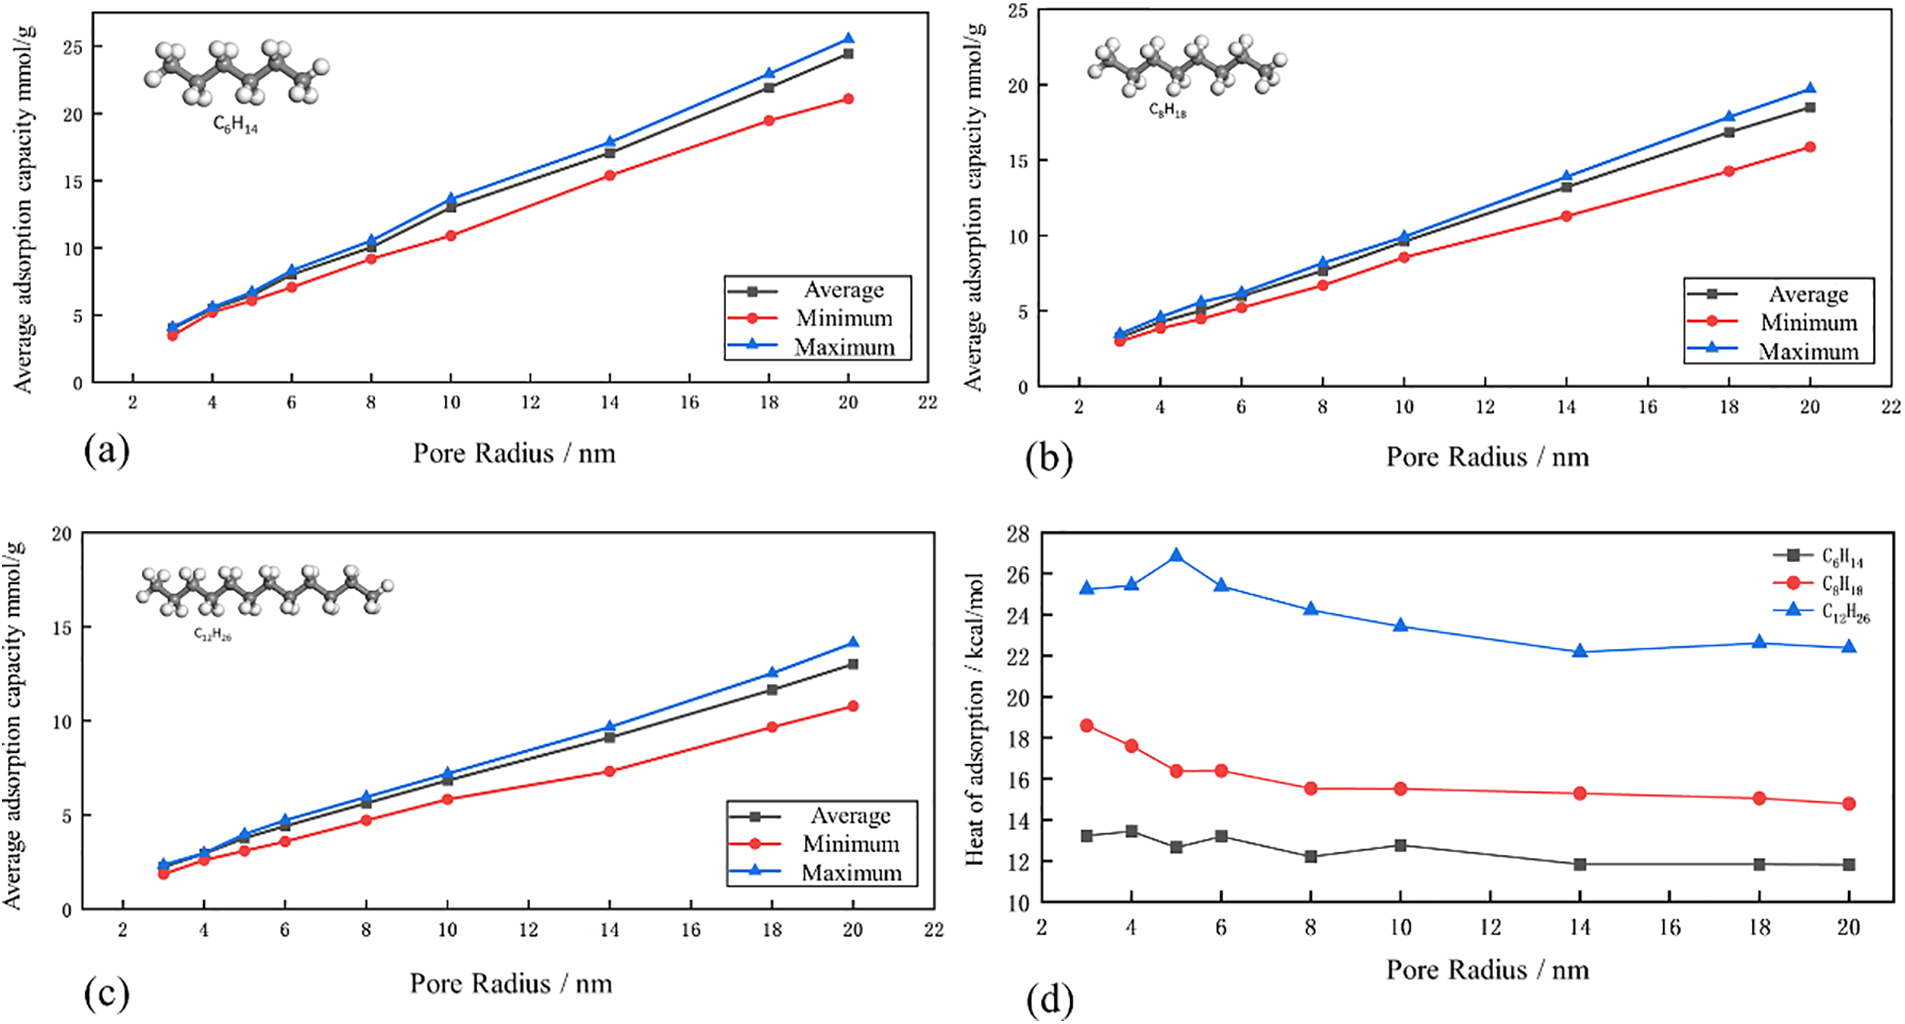
Figure 4: (a)–(c) Simulation curves of maximum, minimum and average adsorption capacity of C6H14 shale oil molecules in pores (d) Adsorption heat curves of shale oil molecules of different sizes in pores
During the adsorption process, gas molecules move towards the solid surface and gradually slow down, releasing heat. This thermal effect is known as the adsorption heat, which can be used to measure the strength of adsorption. A higher adsorption heat value indicates stronger adsorption. Although adsorption itself is an exothermic process, it is conventionally considered as a positive value. As shown in Fig. 4d, among the three different shale oil molecules, C12H26 with the highest molecular weight exhibits the highest adsorption heat value, followed by C8H18, while C6H14 has the lowest adsorption heat value. Additionally, as the pore radius increases, the adsorption heat of these three molecules slightly decreases. This suggests that with the increase in adsorption radius, the increased presence of free shale oil in the pore center affects the adsorption strength of adsorbed shale oil.
3.2 Analysis and Calculation of Microscopic Mobility Boundaries of Shale Oil
In nanopores, the density distribution of alkanes is non-uniform and exhibits a periodic and symmetrical pattern. The density peaks are maximum near the pore walls and gradually decrease and remain constant away from the pore walls. This is attributed to the stronger interaction forces between the alkane molecules and the wall surface in close proximity to the pore walls, while in the central region of the pore, the fluid-wall interaction forces are weaker and the density variation is primarily governed by intermolecular interactions among the alkane molecules, resulting in smaller density changes.
Near the walls of narrow slit-like pores, the density shows oscillations with three peaks and valleys. In this region, the fluid-wall interaction forces are relatively stronger, indicating an adsorbed state of the fluid. In contrast, in the pore center far from the walls, the fluid experiences weakened wall interactions, leading to a more uniform distribution of density with negligible variation, representing a free state of the fluid. The location of the molecules in these adsorbed states is divided into adsorption layers. According to Figs. 5a–5c, for shale oil molecules in shale oil pores of different diameters, the width of the adsorption layer varies only slightly, suggesting that the impact of increasing pore diameter on adsorption is insignificant once the pore diameter exceeds the adsorption layer width. On the other hand, Fig. 5d shows that for the same shale oil molecules, the adsorption density rules are the same in the pores with different pore sizes, and the difference is very small. This is attributed to the superposition effect of potential fields generated by the pore walls on the shale oil molecules. Due to the superposition of potential fields generated by pore walls on shale oil molecules, when the pore diameter is small, the arrangement of shale oil molecules appears more ordered (concentrated), exhibiting a higher density. The potential field generated by the pore wall will affect the arrangement and density of shale oil molecules. When the pore size is small, the potential field will produce a more concentrated arrangement of shale oil molecules, resulting in a higher density.
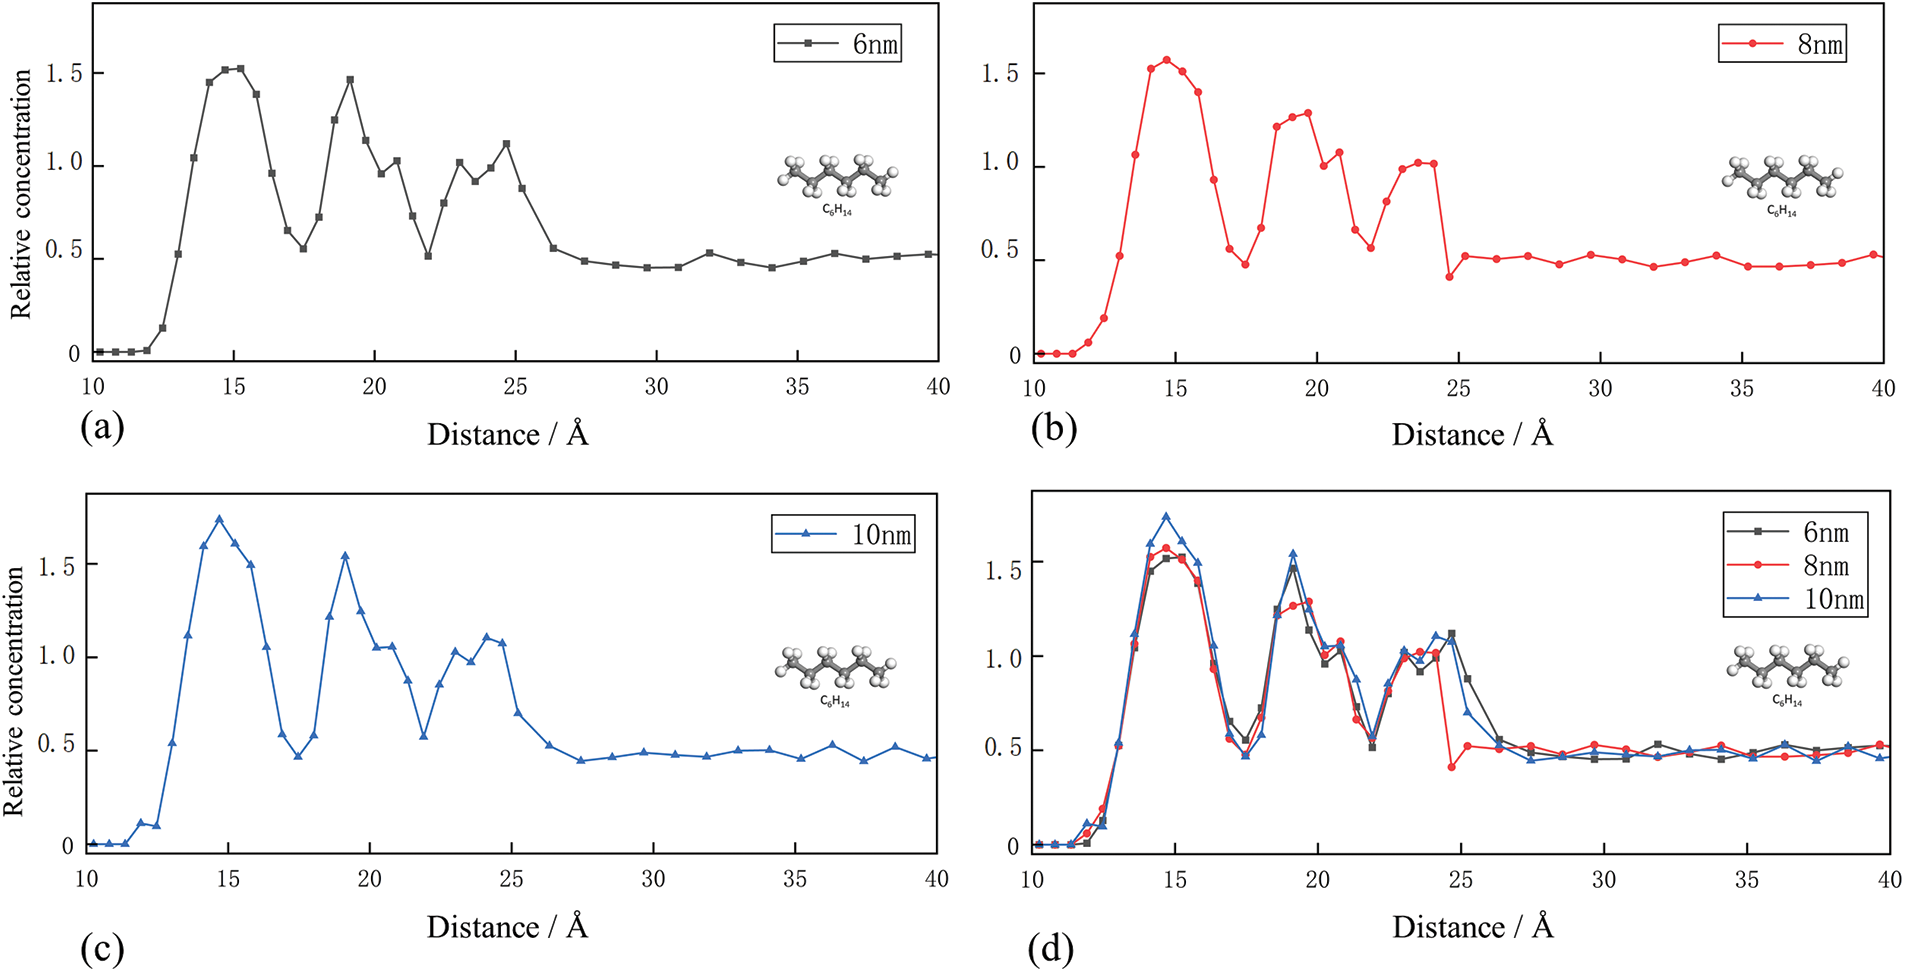
Figure 5: (a)–(c) Density distribution curves of C6H14 molecules in pores at 6, 8 and 10 nm (d) Comprehensive density distribution curve
This study reveals the distribution of adsorbed shale oil in shale pores through gas adsorption experiments and microstructural analysis, as shown in Fig. 6. The experimental results indicate the formation of a distinct first adsorption layer in the region close to the shale pore inner wall, with the first adsorption layer separated from other alkane molecules, resulting in the lowest density value at the separation point. Additionally, in the region further away from the shale pore inner wall, the formation of a second adsorption layer and a third adsorption layer is observed, both with an adsorption thickness of 0.4–0.5 nm, similar to the width of alkane molecules.

Figure 6: Density distribution curves of C6H14, C8H18 and C12H26 molecules in 10 nm pores
Further analysis reveals that the inaccessible adsorbed shale oil is primarily concentrated in the first adsorption layer, while the second adsorption layer and the third adsorption layer, located further away from the shale pore inner wall, consist of adsorbed shale oil. Therefore, the shale oil molecules within shale pores can be classified into adsorption and free states. Taking an 8 nm pore diameter as an example, the results are shown in Fig. 7. According to the experimental data, it is calculated that the volumetric fraction of adsorptive shale oil in the 8 nm shale pore is 40.8%, while the volumetric fraction of inaccessible shale oil is 16.2%. The classification of adsorptive and free states of shale oil is of great significance for a deeper understanding of the distribution and assessment of reserves of adsorbed oil in shale reservoirs. In addition, this study is of great significance for estimating shale oil reserves, optimizing and increasing shale oil production, and provides scientific basis for optimizing shale oil production technology and developing efficient and environmentally friendly shale oil production methods.
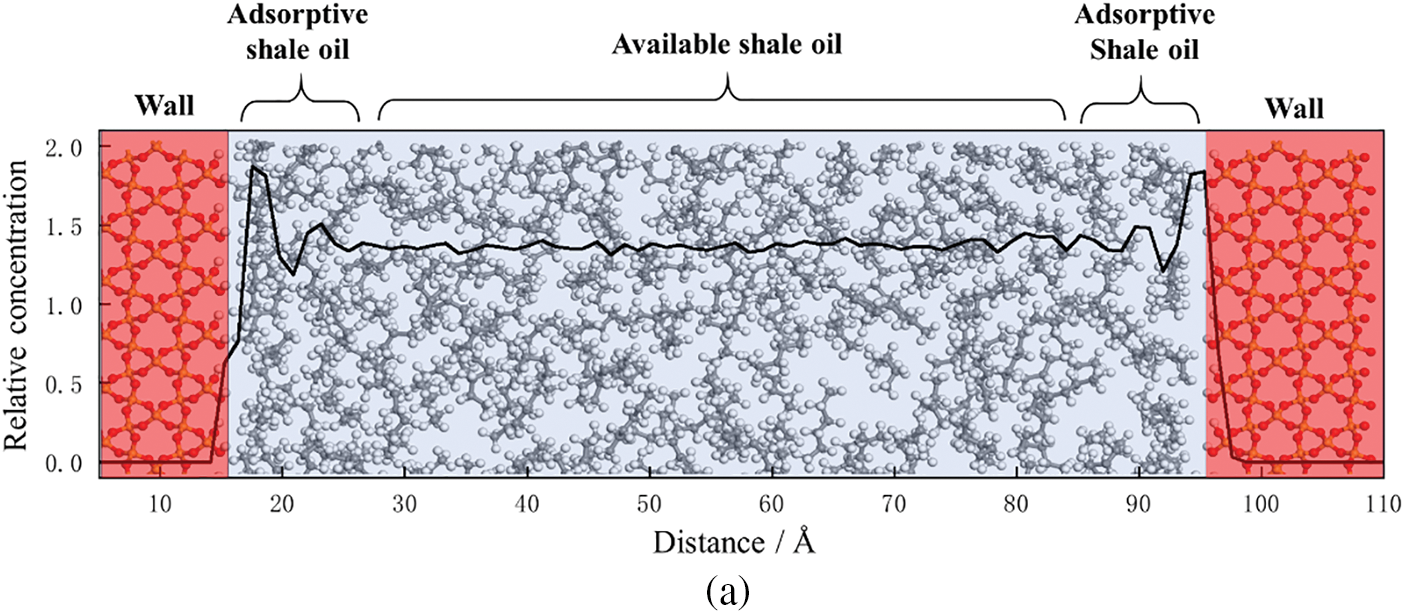
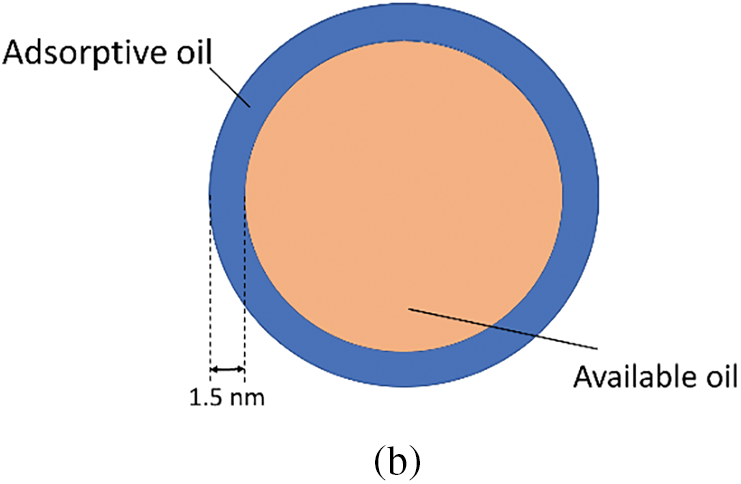
Figure 7: (a) The division result of adsorption state and free state of shale oil molecules in 8nm pores. (b) Schematic diagram of shale oil adsorptive and available state division in pores
This study investigates the adsorption characteristics of various single-component (C6H14, C8H18, C12H26) inorganic quartz fissures through molecular dynamics simulations and experimental research. The influence of pore size and shale oil composition on the occurrence of shale oil in pores and fractures is analyzed, providing theoretical guidance for calculating the proportion of adsorbed oil and free oil in shale pores, as well as the evaluation of shale micro-accessibility. The research findings are as follows:
(1) The adsorption capacity of different molecules in shale pore inner wall is different. The adsorption capacity of heavier hydrocarbon components is C6H14 > C8H18 > C12H26. With the increase of pore diameter, the adsorption capacity of the same adsorption molecules increases linearly. Larger pores contribute more to the adsorption of shale oil, while smaller shale oil molecules have better adsorption properties. With the increase of pore diameter, the gap between the average adsorption capacity and the minimum adsorption capacity increases gradually, but the gap between the maximum adsorption capacity is still relatively small.
(2) During the adsorption process, the largest molecule C12H26 has the highest adsorption heat value, followed by C8H18, and C6H14 has the lowest adsorption heat value. With the increase in pore radius, the adsorption heat of these three molecules slightly decreases. The density of the same shale oil molecule adsorbed in pores of different diameters is slightly different. When the pore diameter is small, the potential field effect of the pore walls on the shale oil molecules is superimposed, resulting in a more ordered (concentrated) arrangement of shale oil molecules and a larger density.
(3) In shale pores, distinct first adsorption layers and second and third adsorption layers are formed. The inaccessible adsorbed shale oil is primarily concentrated in the first adsorption layer, while the second and third adsorption layers, located further away from the shale pore inner wall, consist of adsorbed shale oil. The adsorption thickness in all layers is approximately 0.4–0.5 nm, which is similar to the width of alkane molecules. The inaccessible adsorbed shale oil is mainly concentrated in the first adsorption layer (16.2%), while the second and third adsorption layers, located further away from the shale pore inner wall, consist of adsorbed shale oil (40.8%).
Acknowledgement: None.
Funding Statement: The author received no specific funding for this study.
Author Contributions: There is no co-author on this article, all work is done by Guochen Xu.
Availability of Data and Materials: No data needs to be disclosed.
Conflicts of Interest: The author declares that he has no conflicts of interest to report regarding the present study.
References
1. Hughes JD. A reality check on the shale revolution. Nat. 2013;494(7437):307–8. [Google Scholar]
2. Mănescu CB, Nuno G. Quantitative effects of the shale oil revolution. Energy Policy. 2015;86:855–66. [Google Scholar]
3. Feng Q, Xu S, Xing X, Zhang W, Wang S. Advances and challenges in shale oil development: a critical review. Adv Geo Energy Res. 2020;4(4):406–18. [Google Scholar]
4. Xia D, Yang Z, Gao T, Li H, Lin W. Characteristics of micro- and nano-pores in shale oil reservoirs. J Pet Explor Prod. 2021;11:157–69. [Google Scholar]
5. Bhuiyan MH, Agofack N, Gawel KM, Cerasi PR. Micro- and macroscale consequences of interactions between CO2 and shale rocks. Energies. 2020;13(5):1167. [Google Scholar]
6. Jin ZJ, Wang GP, Liu GX, Gao B, Liu QY, Wang HL, et al. Research progress and key scientific issues of continental shale oil in China. Acta Pet Sin. 2021;42(7):821–35 (In Chinese). [Google Scholar]
7. Memon A, Li A, Memon BS, Muther T, Han W, Kashif M, et al. Gas adsorption and controlling factors of shale: review, application, comparison and challenges. Nat Resour Res. 2021;30(1):827–48. [Google Scholar]
8. Graham SP, Rouainia M, Aplin AC, Cubillas P, Fender TD, Armitage PJ. Geomechanical characterisation of organic-rich calcareous shale using AFM and nanoindentation. Rock Mech Rock Eng. 2021;54(1):303–20. [Google Scholar]
9. Wang J, Dziadkowiec J, Liu Y, Jiang W, Zheng Y, Xiong Y, et al. Combining atomic force microscopy and nanoindentation helps characterizing in-situ mechanical properties of organic matter in shale. Int J Coal Geol. 2024;281:104406. [Google Scholar]
10. Babaei S, Ghasemzadeh H, Tesson S. Methane adsorption of nanocomposite shale in the presence of water: insights from molecular simulations. Chem Eng J. 2023;475:146196. [Google Scholar]
11. Adewumi Babatunde K, Mamo Negash B, Rashik Mojid M, Ahmed TY, Regassa Jufar S. Molecular simulation study of CO2/CH4 adsorption on realistic heterogeneous shale surfaces. Appl Surf Sci. 2021;543:148789. [Google Scholar]
12. Wu T, Xue Q, Li X, Tao Y, Jin Y, Ling C, et al. Extraction of kerogen from oil shale with supercritical carbon dioxide: molecular dynamics simulations. J Supercrit Fluids. 2016;107:499–506. [Google Scholar]
13. Hunt JM. Distribution of hydrocarbons in sedimentary rocks. Geochim Cosmochim Acta. 1961;22(1):37–49. [Google Scholar]
14. Perez F, Devegowda D. Spatial distribution of reservoir fluids in mature kerogen using molecular simulations. Fuel. 2019;235:448–59. [Google Scholar]
15. Falk K, Pellenq R, Ulm FJ, Coasne B. Effect of chain length and pore accessibility on alkane adsorption in kerogen. Energy Fuels. 2015;29(12):7889–96. [Google Scholar]
16. Xu J, Wang R, Zan L. Shale oil occurrence and slit medium coupling based on a molecular dynamics simulation. J Pet Sci Eng. 2023;220:111151. [Google Scholar]
17. Ho TA, Dang ST, Dasgupta N, Choudhary A, Rai CS, Wang Y. Nuclear magnetic resonance and molecular simulation study of H2 and CH4 adsorption onto shale and sandstone for hydrogen geological storage. Int J Hydrogen Energy. 2024;51:158–66. [Google Scholar]
18. Lawal LO, Olayiwola T, Abdel-Azeim S, Mahmoud M, Onawole AO, Kamal MS. Molecular simulation of kerogen-water interaction: theoretical insights into maturity. J Mol Liquids. 2020;299:112224. [Google Scholar]
19. Wu K, Chen Z, Li X, Guo C, Wei M. A model for multiple transport mechanisms through nanopores of shale gas reservoirs with real gas effect-adsorption-mechanic coupling. Int J Heat Mass Transfer. 2016;93:408–26. [Google Scholar]
20. Sui H, Zhang F, Wang Z, Wang D, Wang Y. Molecular simulations of oil adsorption and transport behavior in inorganic shale. J Mol Liquids. 2020;305:112745. [Google Scholar]
21. Szczerba M, McCarty DK, Derkowski A, Kowalik M. Molecular dynamics simulations of interactions of organic molecules found in oil with smectite: influence of brine chemistry on oil recovery. J Pet Sci Eng. 2020;191:107148. [Google Scholar]
22. Kang X, Zou X, Sun HM, Ma XY, Chen RP. Molecular dynamics simulations of microstructure and dynamic shearing behaviors of kaolinite-water-salt system. Appl Clay Sci. 2022;218:106414. [Google Scholar]
23. Kang X, Sun HM, Yang W, Chen RP. Wettability of clay aggregates—A coarse-grained molecular dynamic study. Appl Surf Sci. 2020;532:147423. [Google Scholar]
Cite This Article
 Copyright © 2024 The Author(s). Published by Tech Science Press.
This work is licensed under a Creative Commons Attribution 4.0 International License , which permits unrestricted use, distribution, and reproduction in any medium, provided the original work is properly cited.
 Downloads
 Citation Tools