
 Submit a Paper
 Propose a Special lssue
 Open Access
ARTICLE

Numerical Simulation of Wet Particles Motion in a Vertical Powder Dryer
School of Petrochemical Engineering, Lanzhou University of Technology, Lanzhou, 730050, China
* Corresponding Author: Dongdong Pang. Email:
Fluid Dynamics & Materials Processing 2024, 20(8), 1823-1846. https://doi.org/10.32604/fdmp.2024.048093
Received 27 November 2023; Accepted 01 March 2024; Issue published 06 August 2024
 View Full Text
 Download PDF
Abstract
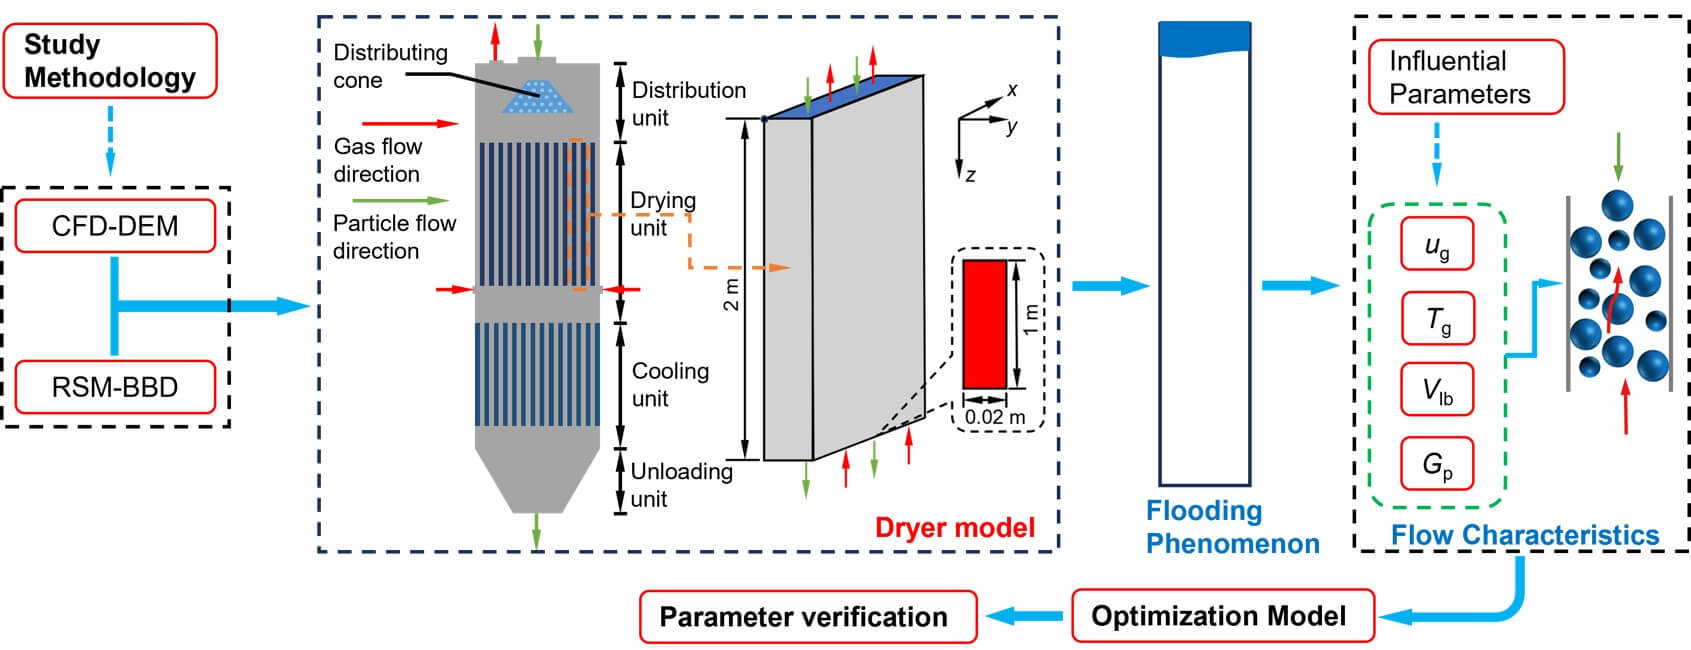
In this study, the motion of wet particles in the drying unit of a vertical powder dryer is investigated by using a Discrete element method (DEM) coupled with a liquid bridge force. In particular, by varying parameters such as the particle mass flow rates, the superficial gas velocities, and superficial gas temperatures, the influence of the moisture content on the flow behavior is examined. The results show that when the moisture content increases, the mean particle velocity decreases while the bed mean solid “holdup” and the mean residence time (MRT) of particles grow. It is also found that the local solid holdup is relatively higher in the near-wall region and decreases towards the near-fluid region. Two regression models are introduced accordingly for the mean particle velocity and the bed mean solid holdup by means of the RSM-BBD (Response surface methodology-Box-Behnken design) method to obtain the optimal combination of parameters for flooding prevention. Finally, the optimal results are compared with numerical observations. As the relative error is less than 10%, this demonstrates that the proposed methodology can accurately describe the particle flow dynamics in the drying unit.Graphic Abstract
Keywords
The vertical powder dryer has been widely applied in various fields such as the petrochemical industry, grain, and energy due to its advantages of high heat transfer efficiency, low energy consumption, high gas-solid contact efficiency, and high product quality [1,2]. In the drying unit of a vertical powder dryer, particles move downward along the direction of gravity while gas moves upward against gravity, which is similar to a gas-solid counter-current downer [3–7].
Complex gas-solid flow phenomena affect the heat and mass transfer characteristics, drying properties, and particle motion behavior in drying units. Understanding the properties and variation rules of gas-solid flow phenomena is of significant reference value for optimizing the operation and design of gas-solid counter-current type dryers [8–12]. Luo et al. [13] investigated the flow behavior of a gas-solid counter-current fluidized flow system for the first time and discovered that the pressure gradient could be utilized to determine the solid holdup. Li et al. [14] conducted experiments using a cold experimental device for counter-current downers to investigate the impact of varying counter-current gas velocities and particle circulation velocities on particle velocity and mass concentration at different axial heights, summarized the radial distribution of particle velocity and concentration, and they further used a significant amount of experimental data to develop a prediction equation for the local particle velocity in the process of free development. Peng et al. [15] introduced a new empirical drag correlation coefficient coupled Computational fluid dynamics (CFD) to accurately predict the axial pressure distribution of the counter-current downer. Garić-Grulović et al. [16] established a gas-solid counter-current downer experimental platform to analyze the flow characteristics of coarse particles and the distribution of axial pressure, and then they validated the accuracy of their mathematical model by comparing with obtained experimental data. Jiang et al. [17–19] constructed a visual gas-solid counter-current fluidized bed experimental platform and developed a multi-scale numerical model to investigate the flow characteristics of this system. They found that the particle velocity decreased while the solid holdup, particle residence time, radial distribution inhomogeneity, and the number or concentration of particle aggregates near the wall increased as the gas velocity increased. Liu et al. [20] applied the improved energy-minimization multiscale (EMMS) theory to predict the incidence of flooding in the gas-solid counter-current downer and conducted a mutual verification with the CFD-DEM model to obtain a generalized fluidized-phase diagram.
Most studies have focused on the flow characteristics of dry particles, however, there is insufficient research on wet particles in gas-solid counter-current dryers (or downers). This paper first investigates the flow behaviors of wet particles in the drying unit of a vertical powder dryer using a coupled model of CFD-DEM coupled with a liquid bridge force. Subsequently, how the moisture content affects the flow characteristics of particles is explored by varying parameters such as particle mass flow rates, superficial gas velocities and superficial gas temperatures. Furthermore, the concept of the flooding phenomenon is utilized to describe the blockage of the drying unit at the inlet. Finally, the effects of the particle mass flow rate, moisture content, superficial gas velocity, and temperature on the mean particle velocity and bed mean solid holdup are analyzed by the RSM-BBD method, and the interrelationships among the working condition parameters are discussed.
2.1 Governing Equations of the Gas Phase
The governing equations of gas motion including the continuity and momentum equations obtained from the mean Navier-Stokes equation are expressed by [21]:
where εg is the void fraction, -; ρg is the gas density, kg/m3; ug is the gas velocity, m/s; g is the gravity, m/s2; p is the gas pressure, Pa; τg is the gas viscous stress tensor, kg/(m∙s2); Vcell is the computing cell volume, m3; Np is the number of particles in a computing cell, -; Vp is the particle volume, m3; vp is the particle velocity, m/s; β is the interphase momentum exchange coefficient between gas and solid, kg/(m3∙s), which is expressed by the Gidaspow correlation [22] as:
where dp is the particle diameter, m; Cd is the drag coefficient, -; Rep is the particle Reynolds number,-.
2.2 Governing Equations of the Solid Phase
The particle motion in discrete phase (DEM) follows Newton’s second law, and the translational and rotational equations [23,24] are given by:
where mp is the particle mass, kg; Fc is the contact force, N; Flb is the liquid bridge force, N; ωp is the particle rotational velocity, rad/s; Ip is the particle moment of inertia, kg∙m2; Tp is the torque, N∙m; rp is the position of particle center, m; Tr is the rolling friction torque, N∙m. The subscripts n and t are the normal and tangential parameters, respectively.
In this paper, the linear-spring-damping (LSD) soft-sphere model is applied to calculate the contact force, and the expressions of the normal and tangential contact forces are given by:
where δ is the elastic deformation, m; μs is the sliding friction coefficient, -; vr is the relative collision velocity, m/s; k is the spring stiffness, N/m; η is the damping coefficient, N∙s/m.
The liquid bridge force consists of the static liquid bridge force (capillary force) and the dynamic liquid bridge force (viscous force), which collaborate to regulate the motion of wet particles. The capillary force is expressed as follows:
where R is the particle radius, m; γ is the surface tension coefficient, N/m; H is the distance between a particle and the wall or between two particles, m; and the parameters A, B and C are calculated as follows [22]:
Between two particles
Between a particle and the wall
where
The expressions of tangential and normal viscous forces [25] are, respectively:
where μlb is the liquid viscosity, Pa∙s.
When the liquid bridge breaks, the distance between particles is called the critical rupture distance. The critical rupture distance Hcr is expressed as:
2.3 Gas-Solid Heat Transfer Model
The heat transfer energy equations for gas and particles are as follows [26–28]:
where Cp,g is the gas specific heat capacitys, J/(kg∙K); Tg is the gas temperature, K; Tp is the particle temperature, K; Ap is the particle surface area, m2; λg is the thermal conductivity of gas, W/(m∙K); Sq is the source terms; Qg,p is the thermal exchange between the gas and solid phases, J/s; Qp,p is the heat transfer between particles, J/s; Qp,w is the heat transfer between the particle and a wall, J/s; Qeva is the heat taken away by evaporation, J/s; Tc is the relative temperature between particles, K; rc is the contact surface radius, m; tc is the particle contact time, s; λp is particle conduction coefficient, W/(m∙K); ρp is particle density, kg/m3; Cp is the specific heat capacity for the particle, J/(kg∙K); hp,w is the heat transfer coefficient between particle and wall, W/(m2∙K); Ap,w is the contact area between particle and wall, m2; Tw is the wall temperature, K; tcw is the contact time when the particle collides with the wall, s; L is the latent heat of liquid evaporation, J/kg; ml is the evaporated liquid mass; hg,p represents the convective heat transfer coefficient between the gas and the particle, which the empirical correlation is given by Gunn [29]:
where Nu and Pr are the particle nusselt and Prandtl number, respectively.
The particles enter each heat transfer channel uniformly, thus the mass flow rate, heat transfer rate, and flow characteristics of the particles in each channel are generally the same, so the simulations are conducted only in one heat transfer channel to save the computing cost. Fig. 1 illustrates the structure diagram of the drying unit in the vertical powder dryer.
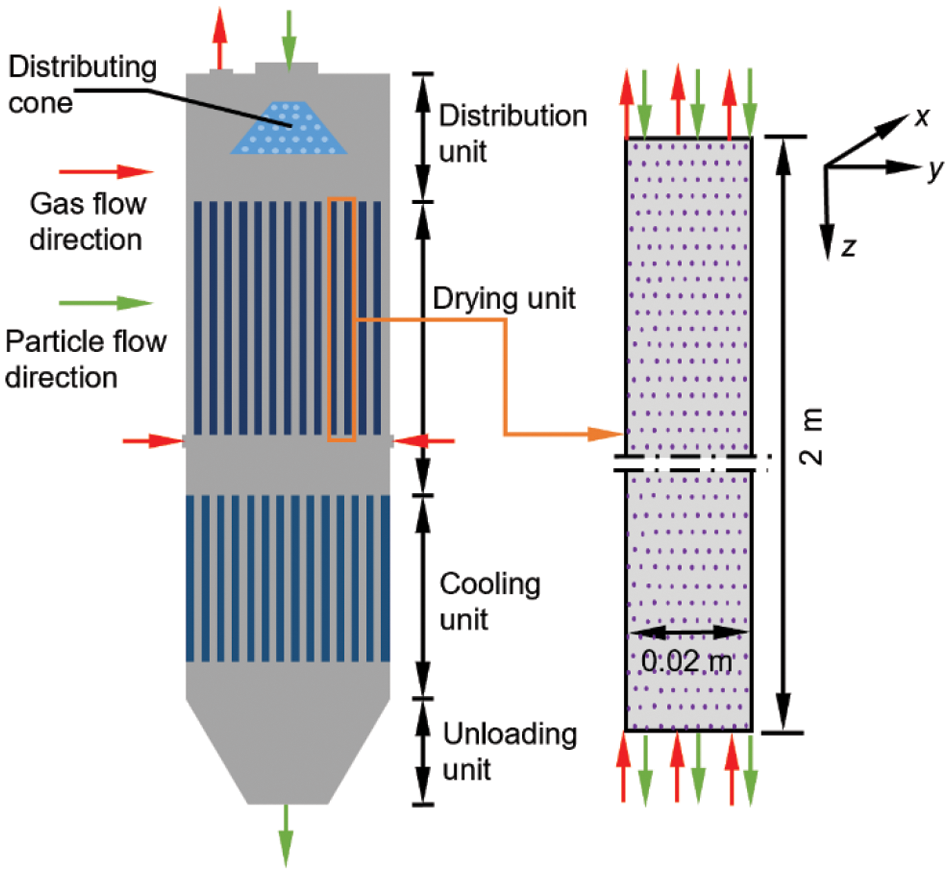
Figure 1: The structure diagram of the drying unit in the vertical powder dryer
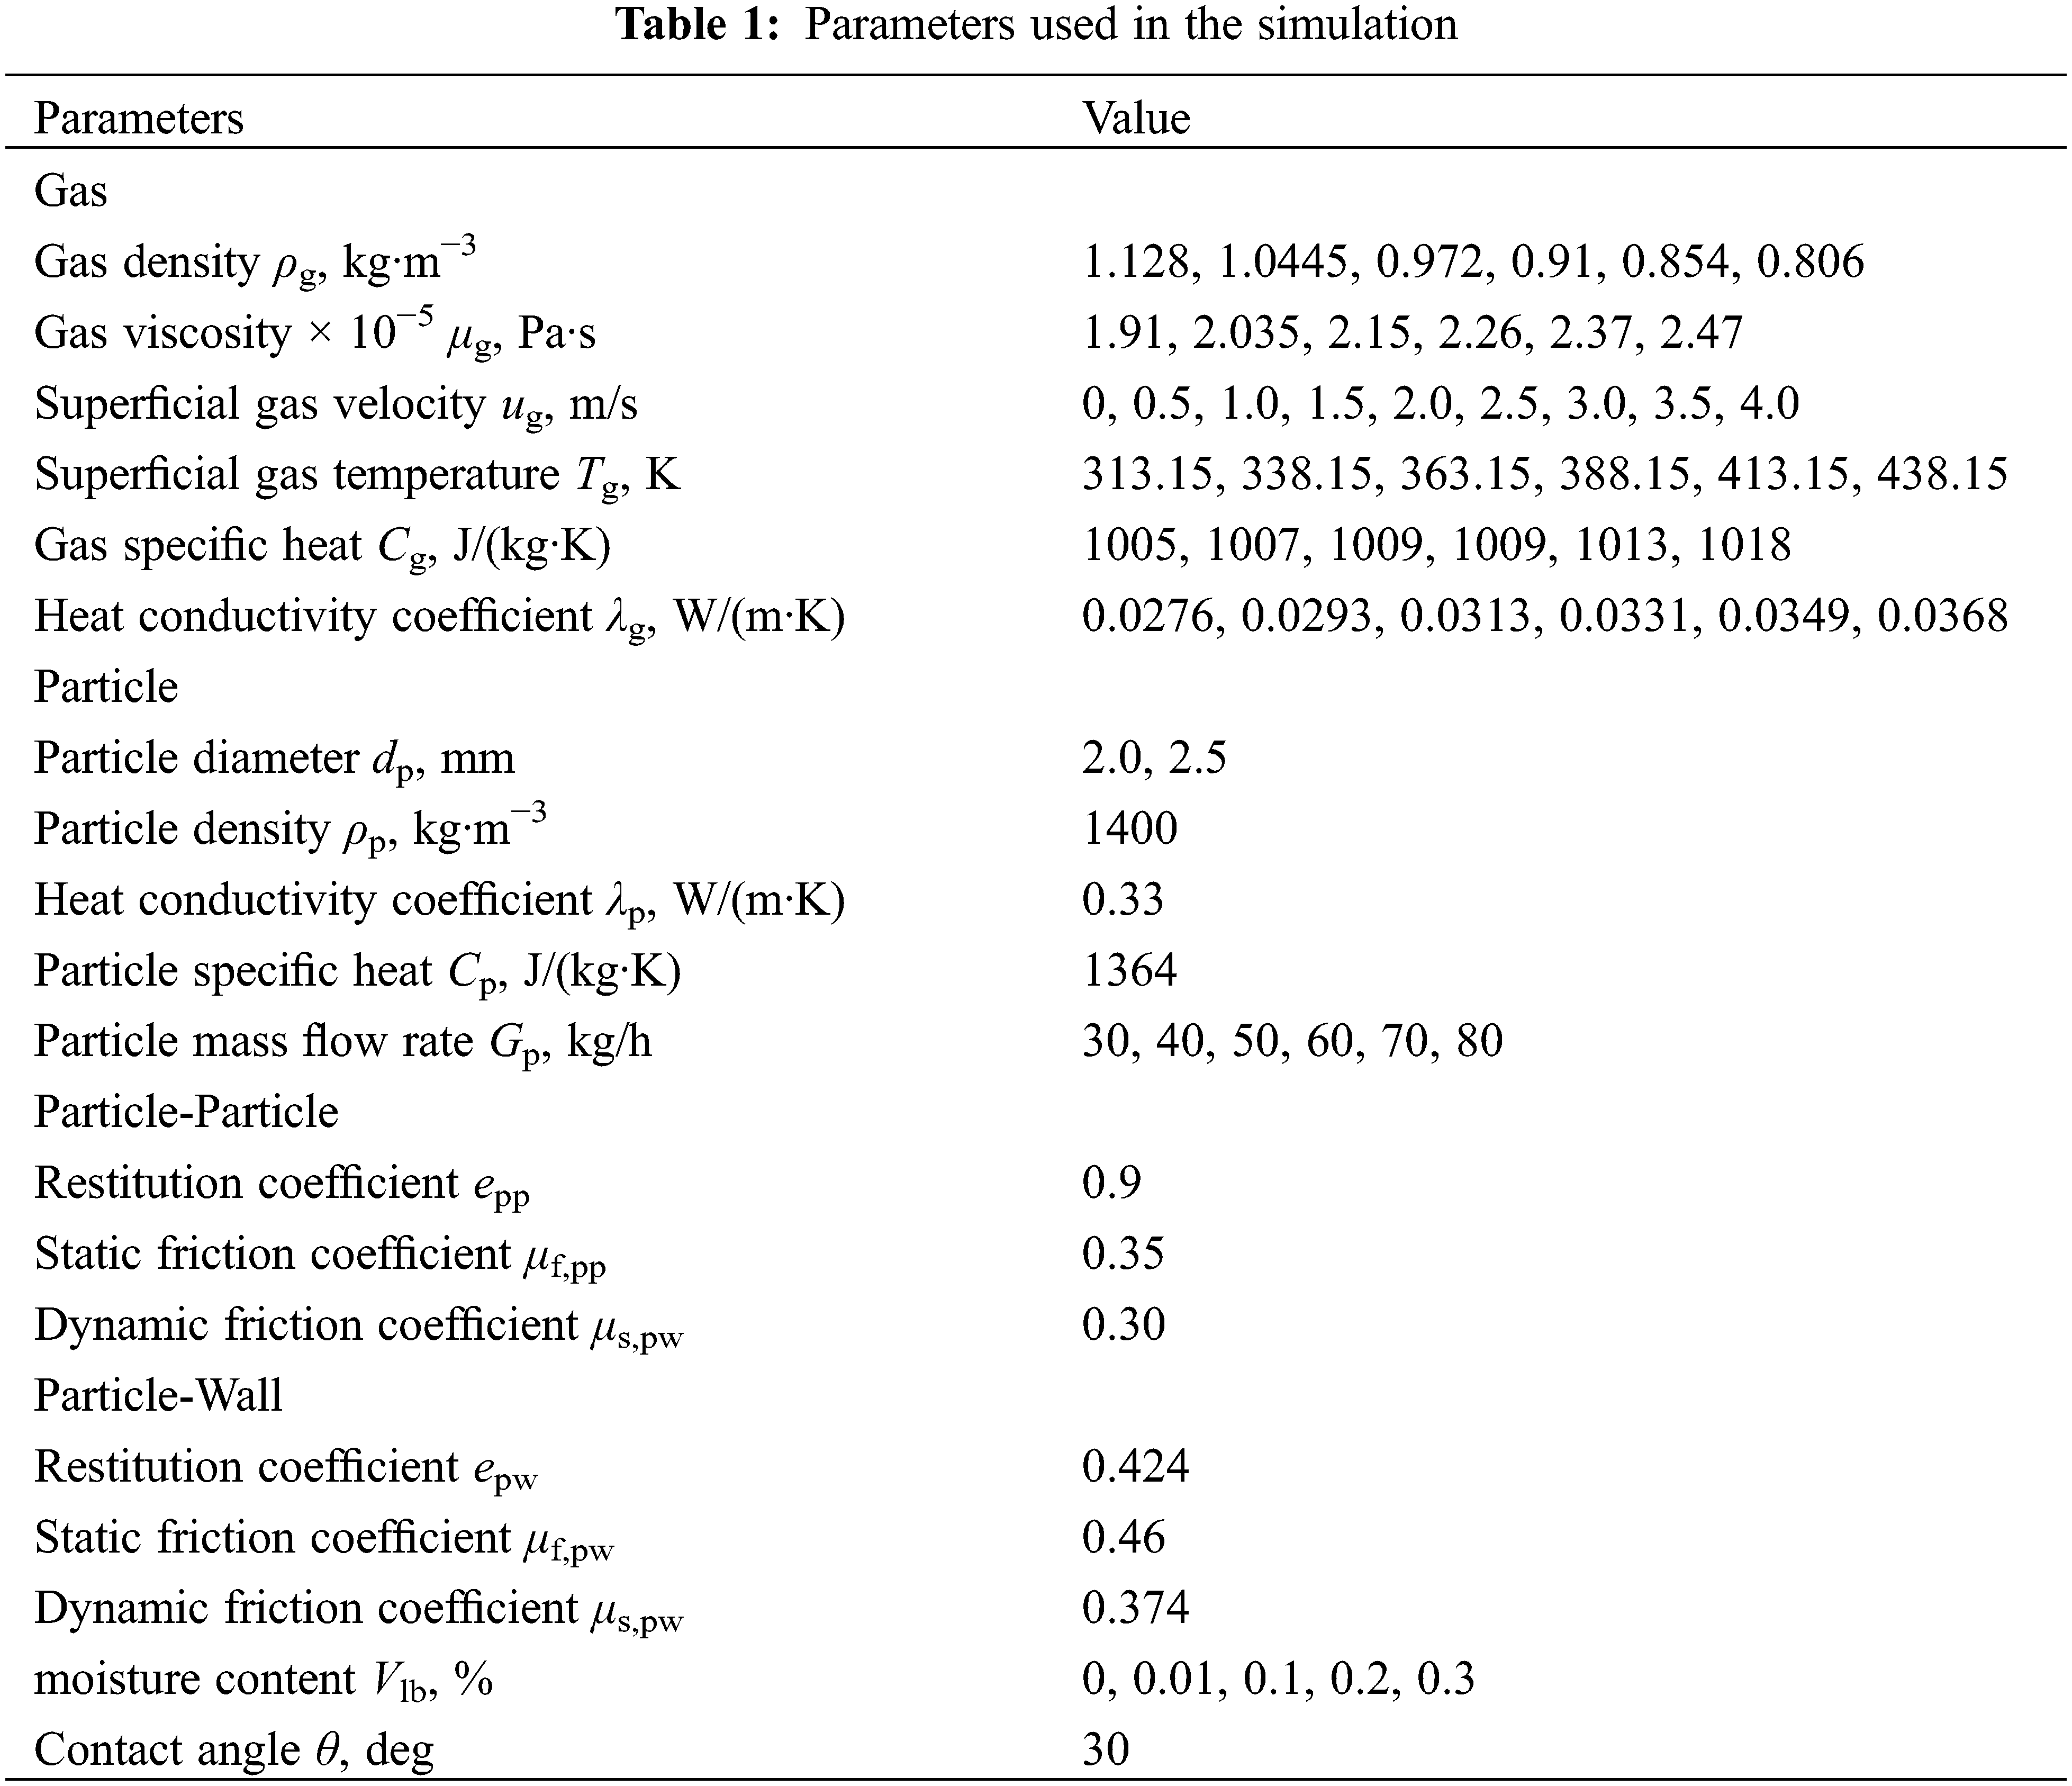
In this paper, the dimensions of the bed in the x, y, and z directions are 1 m × 0.02 m × 2 m. The gas inlet is located at the bottom of the model. The gas phase is subjected to the specified speed conditions at the entry boundary, and the gas phase of the wall is subject to the no-slip boundary conditions at the border. However, the particle inlet is situated at the top of the model, and a specified velocity boundary condition is applied at the inlet. The particles flow uniformly into the drying unit with a given solid particle mass flow rate. The particles’ initial temperature is 303.15 K, and the walls maintained at 428.15 K. Table 1 summarizes the parameters used in this study. The simulation time for both wet and dry particle systems is 8 s, and the calculated results are based on the average values from the last 6 s of data. This approach ensures stability and high accuracy in the calculations.
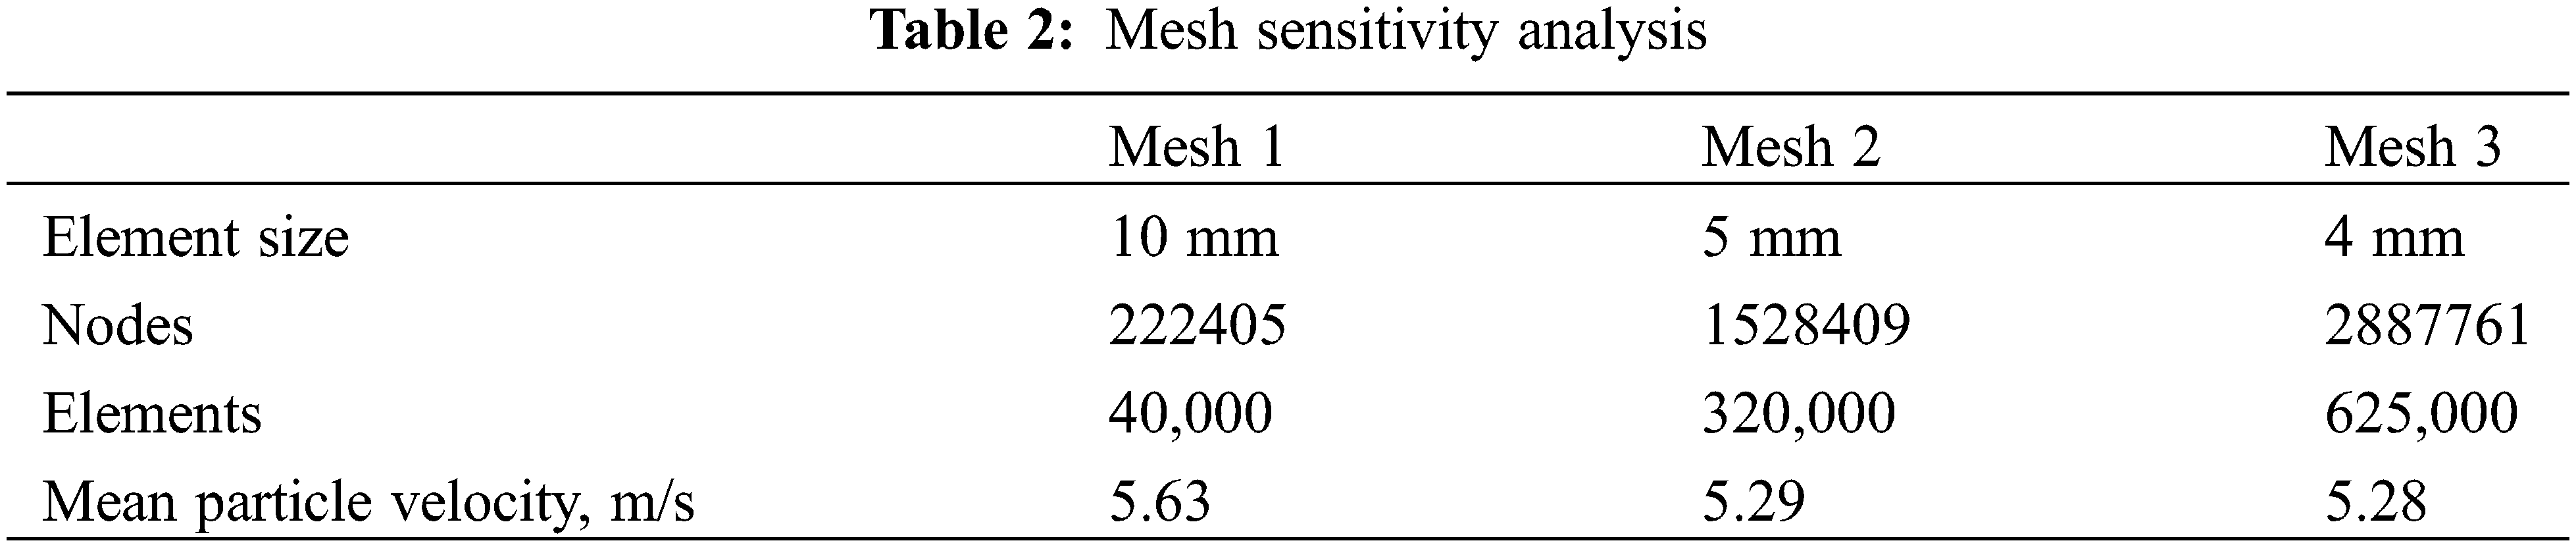
Since the model structure is relatively simple, a regular hexahedral mesh is used, which also enhances computational efficiency. Moreover, grid independence is tested to avoid the negative impacts of grid number and size on accuracy. The simulations are carried out with three grid dimensions (grid sizes: 4, 5, 10 mm). As shown in Fig. 2 and Table 2, as the grid size decreases and the grid number increases, the trend of particle velocity change gradually levels off. Therefore, considering accuracy and workload, a grid size of 5 mm is adopted in this study.
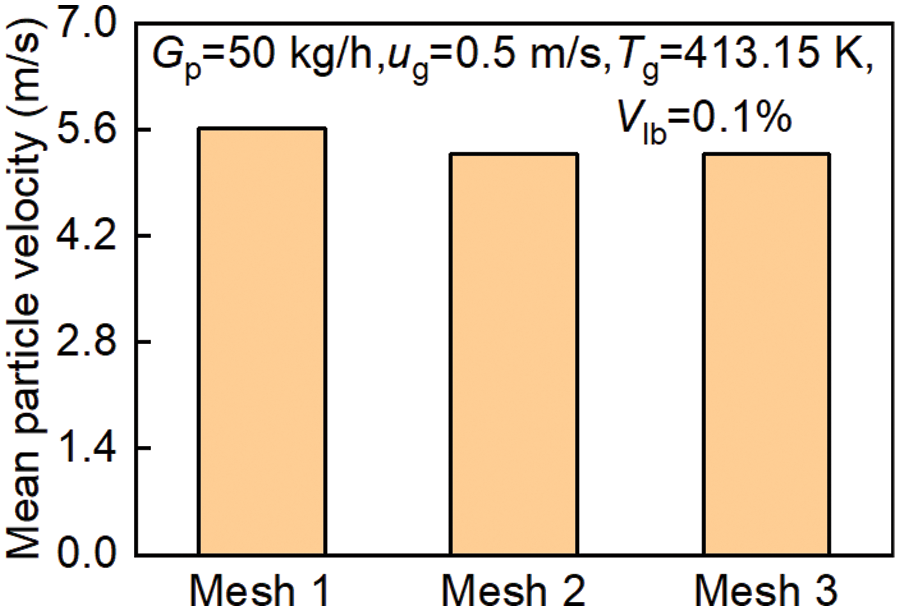
Figure 2: Grid sensitivity (or independence) analysis
To validate the accuracy of the analysis method for wet particle systems, the experimental data from Tang et al. [30] is compared with the simulation results, as illustrated in Fig. 3. The dimensions of the spouted bed in x, y, and z directions are 0.15 m × 0.02 m × 0.8 m, and the gas velocity is 41.2 m/s. This is due to the lack of experimental studies on wet particle systems in gas-solid counterflow dryers or downflow beds. Therefore, the experimental data from spouted beds are used to verify the accuracy of this analysis method. It is evident from the figure that the numerical simulation results closely align with the experimental results. However, there are some discrepancies in the jet region, with the maximum error being 12.04%, indicating the validity of the analysis method in wet particle systems.
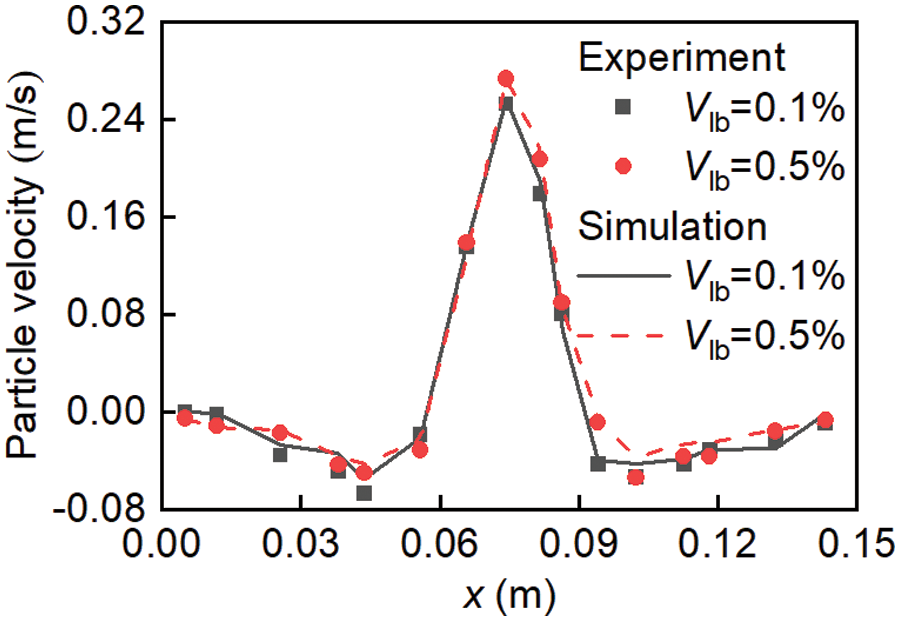
Figure 3: Validation of analysis method
Fig. 4 illustrates the accuracy of the simulated data in the gas-solid counter-current dryer (or downers) validated using an equivalent method. Due to certain constraints, conducting the relevant experiment is not feasible, and thus, the correctness of the simulation results and their adherence to the laws of change can be evaluated based on the similarity of the axial distribution of particle velocities. In Fig. 4a, the particle density is 2 507 kg/m³, the diameter is 1.94 mm, and the mass flow rate is 284.3 kg/h. In the experiment, the diameter and height of the downer (circular section) are 0.016 and 2.23 m [16]. In the simulation, the equivalent diameter of the downer (rectangular section) is 0.016 m, and the size of the bed is 0.02 m × 0.013 4 m × 2.23 m. Fig. 4b shows the particle mass flow rate of 50 kg/h, superficial gas velocity of 1 m/s, and particle diameter of 2 mm. It is observed that when the equivalent diameter is constant, the axial variation of particle velocity distribution remains consistent, with a maximum relative error of 10%, indicating the accuracy of the research findings for gas-solid countercurrent dryers or downers with a rectangular cross-section. In addition, although the bed sizes differ, the axial distribution of particle velocity is similar, indicating that the analysis method (or model) is reasonable.
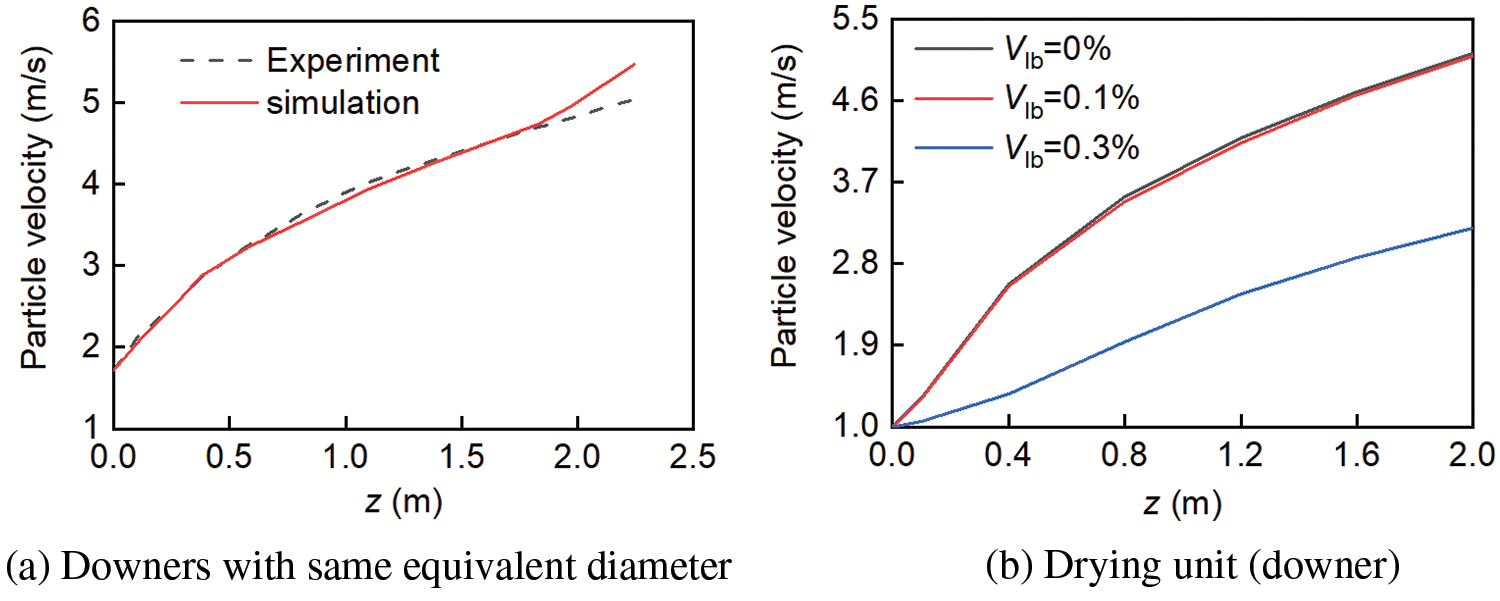
Figure 4: Comparison diagram of the axial distribution of particle velocity
5.1 Latent Heat of Vaporization of Wet Particle System
Fig. 5 illustrates the correlation between the latent heat of liquid vaporization and the particle temperature in a wet particle system under ug = 0.5 m/s, Tg = 413.15 K, and Gp = 70 kg/h. It can be obtained that as the bed height increases (from particle inlet to outlet), the latent heat of liquid evaporation decreases, and the particle temperature increases. This also indicates that the volume of liquid on the particle surface decreases along with the particles downward direction, resulting in a gradual reduction in the impact of the liquid on the flow characteristics of the particles. The reason may be that as the bed height increases, the wet particles are affected by the gas temperature for a longer period, leading to reduced liquid on the particle surface. Moreover, as the moisture content increases, the particle temperature also increases, while the latent heat of liquid evaporation decreases. This is mainly due to the fact that the higher the moisture content, the closer the distance between particles, and the greater the number of liquid bridges, leading to a larger neck radius of the liquid bridge and a more pronounced thermal conductivity (indirect thermal conductivity) of the liquid bridge [31]. In a word, the latent heat of liquid evaporation decreases as the particle temperature increases.
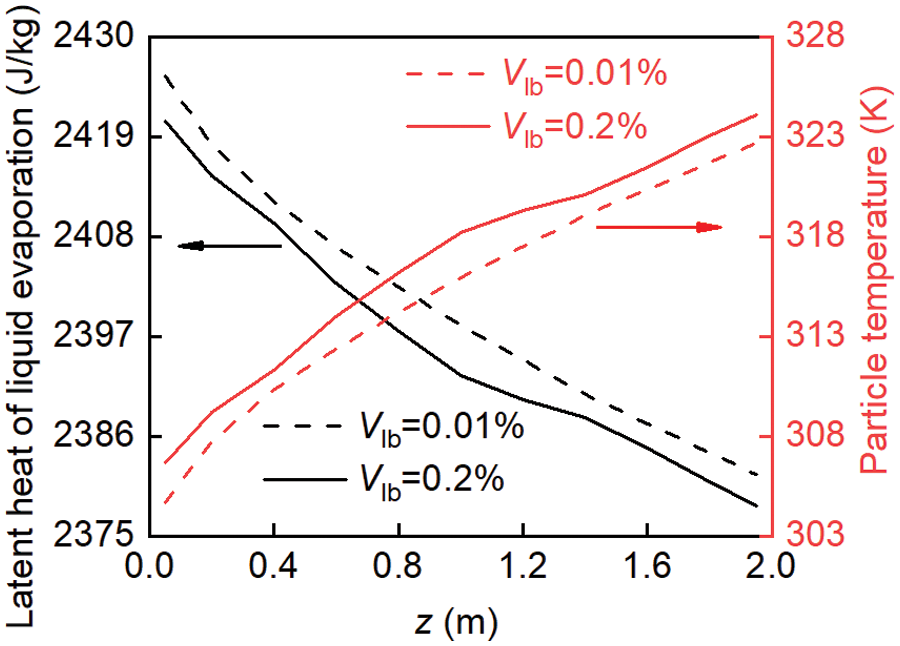
Figure 5: The change in latent heat of vaporization and temperature of wet particles during the flowing process
5.2 Influence of Flooding Phenomenon
Liu et al. [20] found that flooding is a gradual process usually accompanied by drastic changes in bed kinetic parameters. In the dry particle system, flooding occurs when the gas velocity exceeds the critical value, causing numerous particles moving out of the bed. Furthermore, when the particle mass flow rate exceeds the critical value, a bridging phenomenon occurs that hinders the upward flow of gas, leading to flooding. In other words, flooding results in the blockage of the inlet and a sudden change in the bed’s porosity to 1.
This study pays special attention to the influence of moisture content on flood phenomena. Fig. 6 shows the correlation between moisture content and flooding under ug = 0.5 m/s, Tg = 413.15 K, and Gp = 70 kg/h. It can be obtained that the solid holdup of wet particles is primarily controlled by liquid bridging force. Subsequently, because the wet particles easily adhere to the wall due to the liquid bridging force effect on them, there is increased friction between the particles and the wall, leading to a relatively long drying time of the particles in the drying unit. However, the liquid bridge force and the bed mean solid holdup experiences a sudden decrease at time t = 2.7 s when the moisture content is 0.3%, indicating the occurrence of flooding.
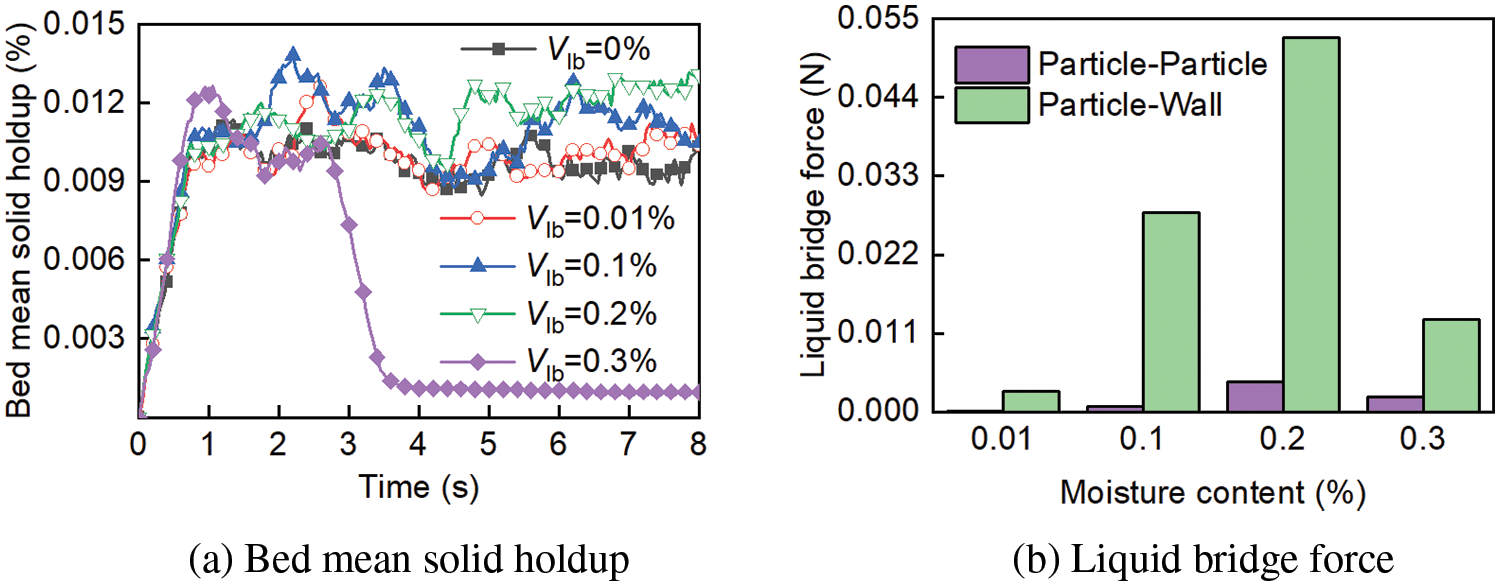
Figure 6: The relationship between moisture content and flooding phenomenon
Figs. 7 and 8show the instantaneous velocity contour of particles and gas under the conditions of ug = 0.5 m/s, Tg = 413.15 K, Gp = 70 kg/h, and t = 6 s. It can be observed that when the moisture content is 0% and 0.2%, an increase in moisture content results in higher particle agglomeration number and gas velocity, and a further strengthening of the heterogeneity of gas-solid flow structure. When the moisture content reaches 0.3%, some particles will agglomerate at the top of the drying unit, resulting in a blockage of the top of the drying unit and hindering the inflow of wet particles. Moreover, the particles have a high initial velocity and the bed width is narrow, while the gas flows upward against gravity, leading to the bias phenomenon and a localized high-speed gas region.
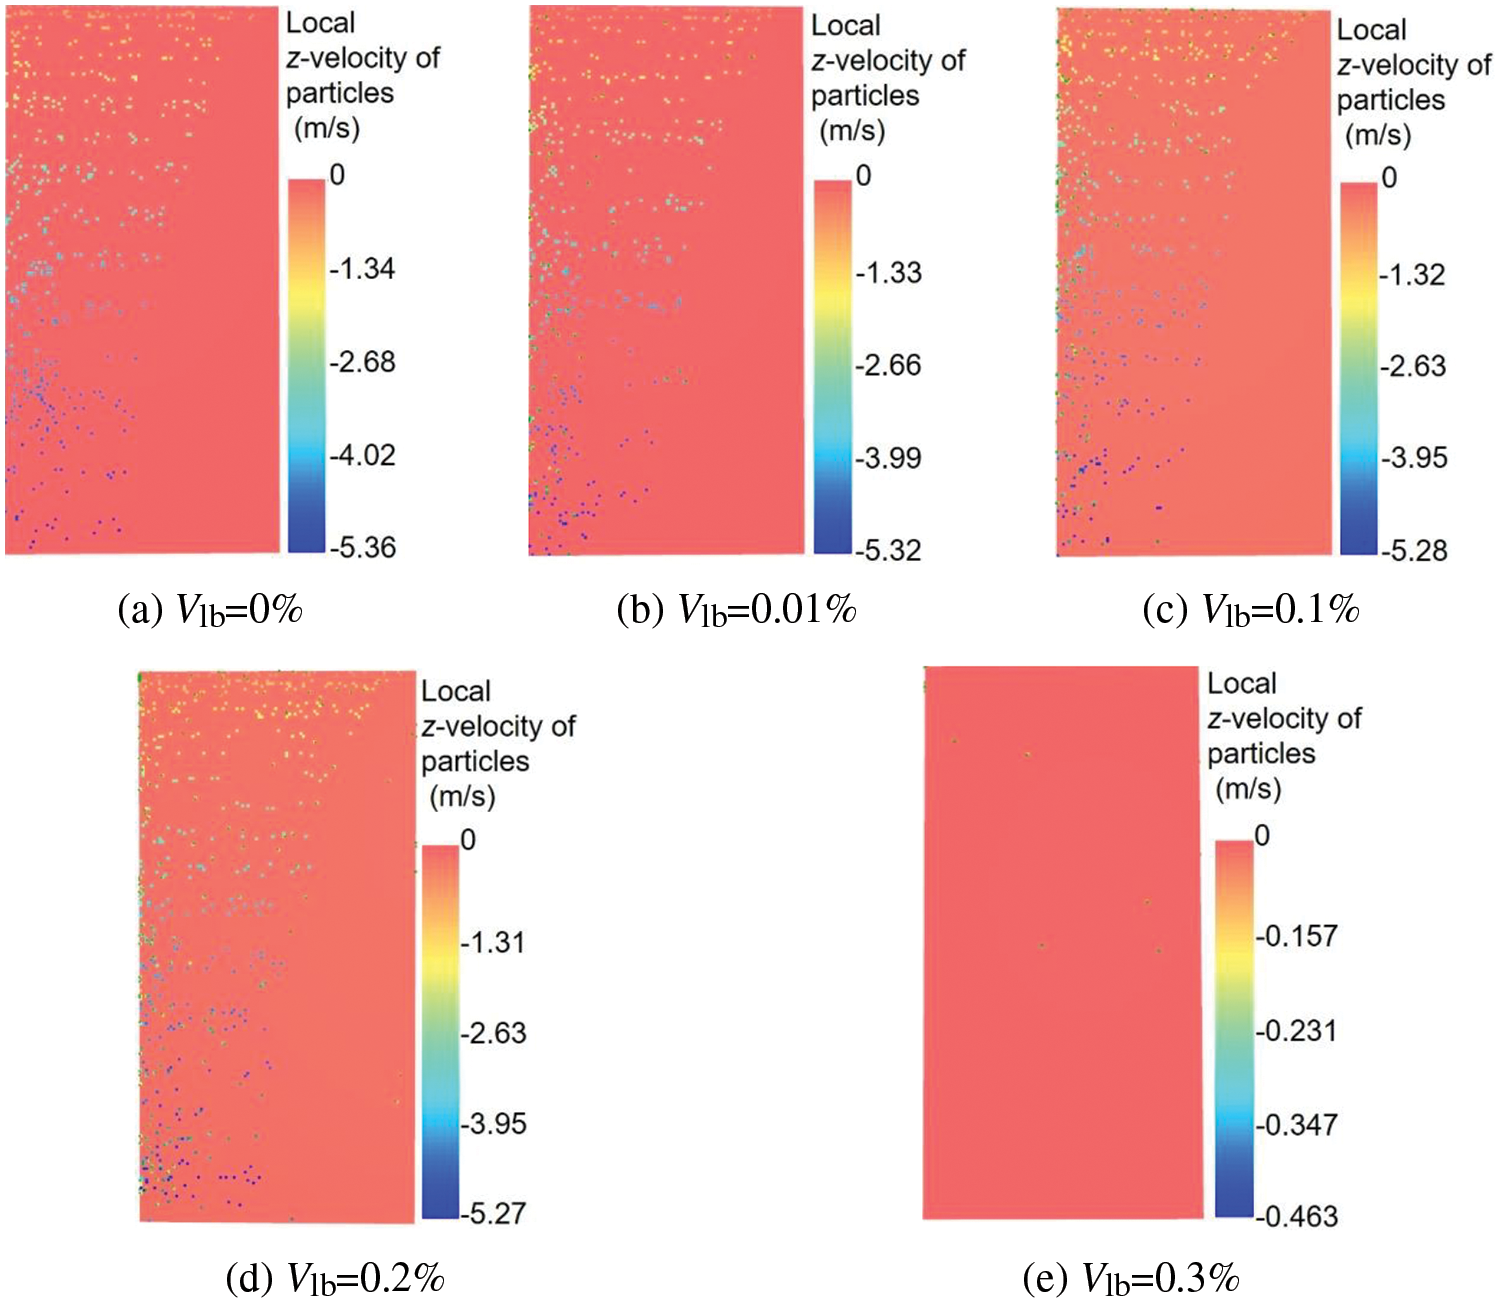
Figure 7: Instantaneous velocity contour of particles at time t = 6 s
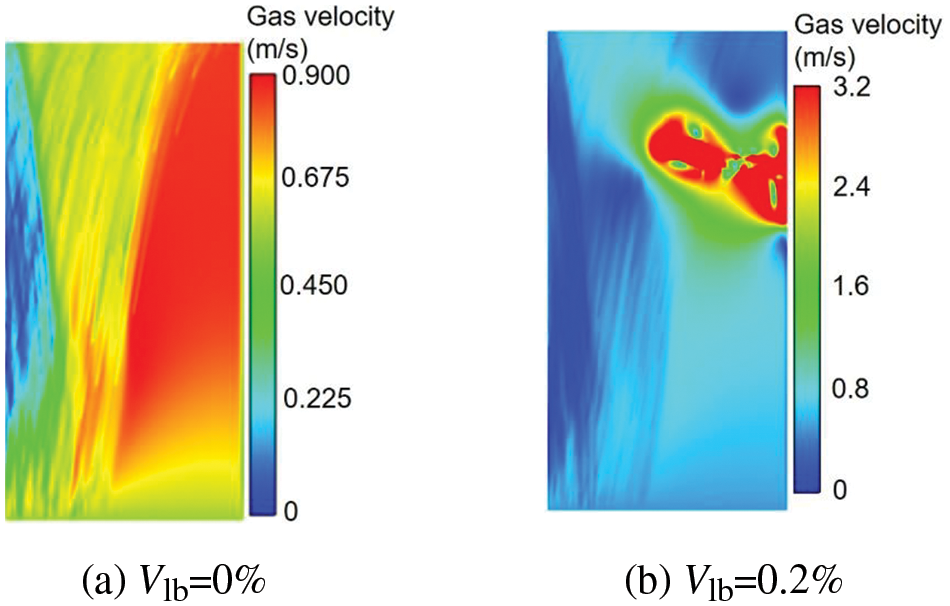
Figure 8: Instantaneous velocity contour of gas at time t = 6 s
5.3 Influence of Particle Mass Flow Rate on Particle Behaviors
The flow characteristics of particles are studied under different particle mass flow conditions, as shown in Fig. 9, when ug and Tg are 0.5 m/s and 413.15 K, respectively.
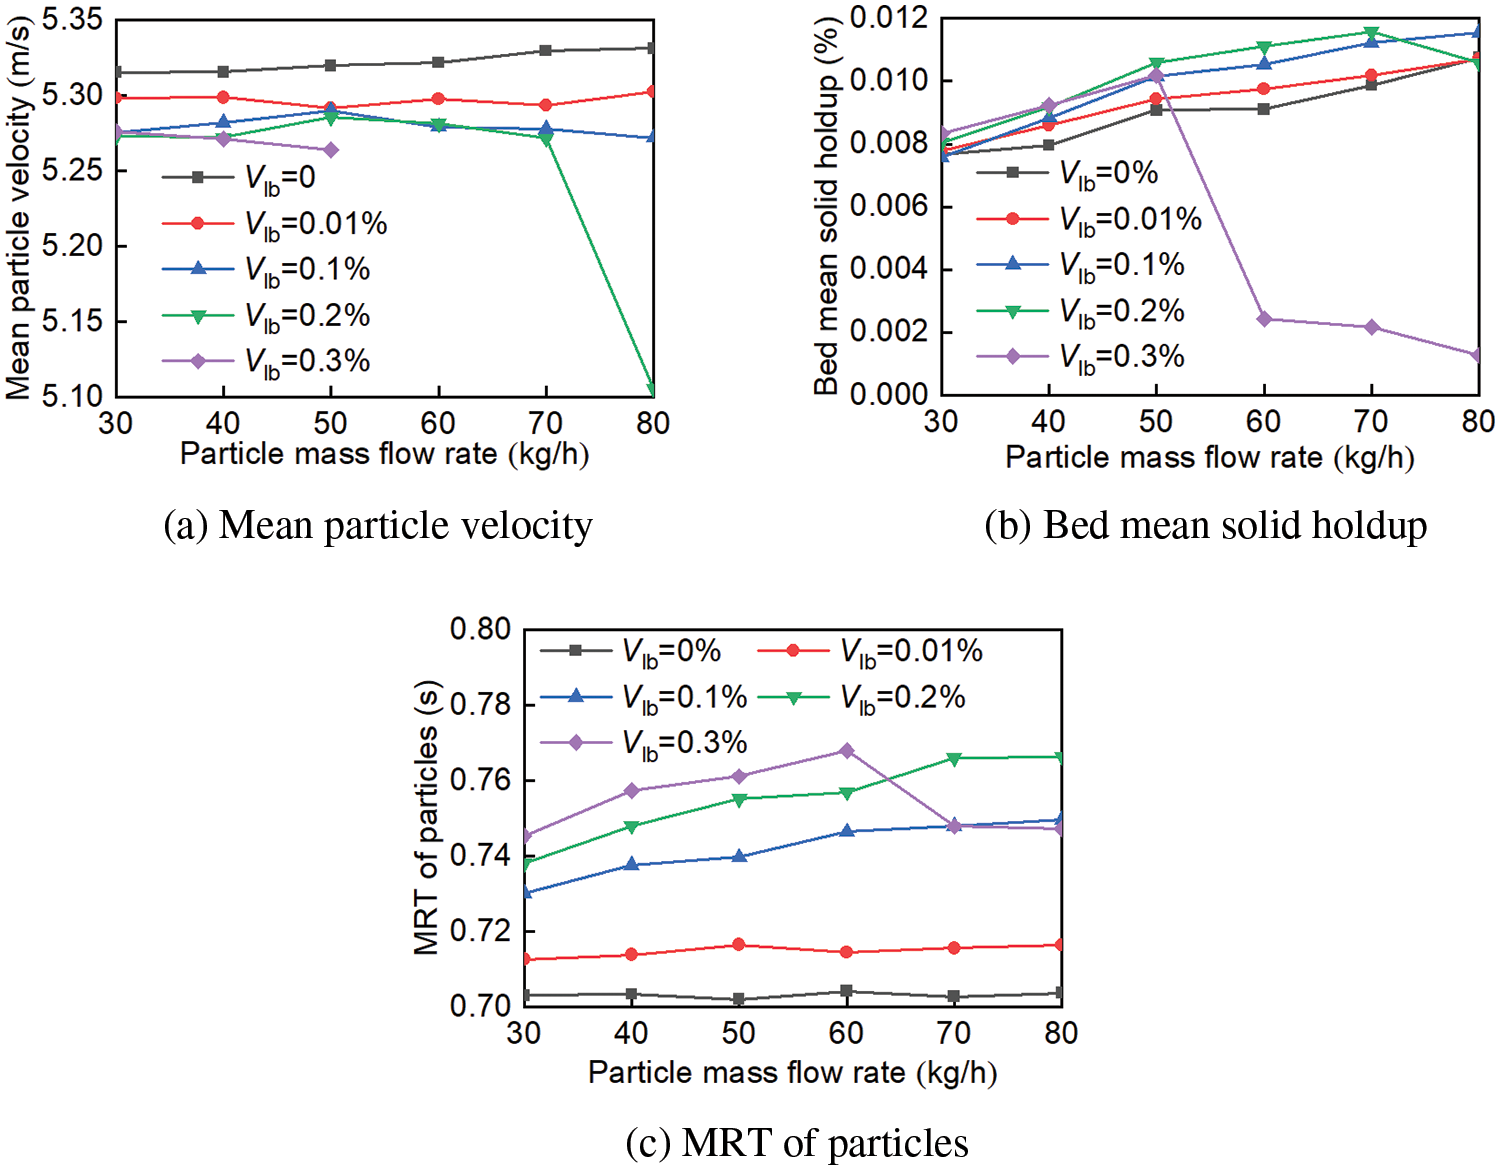
Figure 9: The effect of particle mass flow rate on the flow characteristics of particles
Fig. 9a shows the variation of mean particle velocity with particle mass flow rate. When the moisture content is 0%, the mean particle velocity increases with the particle mass flow rate’s increasing. The reason is that particles’s number in the drying unit increases as the particle mass flow rate increases, leading to an increase in particle gravity. When the moisture content is 0.1% and 0.2%, the mean particle velocity initially increases and then decreases with the particle mass flow rate’s increasing (the inflection point is at 50 kg/h). However, when the moisture content is 0.3%, the mean particle velocity decreases with the particle mass flow rate’s increasing. Moreover, it is worth noting that under the same particle mass flow rate, the mean particle velocity decreases with the moisture content increasing, the possible cause is that the contact rate, friction force, and liquid bridge force increase as the moisture content increases.
Fig. 9b shows the variation of bed mean solid holdup with particle mass flow rate under different moisture contents. When the moisture content is not larger than 0.2%, it is positively correlated with the bed mean solid holdup, at the same time, there is a positive correlation between the bed mean solid holdup and the particle mass flow rate. However, when the moisture content is at 0.3%, the bed mean solid holdup initially increases and then suddenly drops to a very low level (the inflection point is at 50 kg/h), the possible cause is that under higher moisture content and particle mass flow rate, the drying unit experiences flooding, resulting in a significant decrease in the number of particles in the unit.
Fig. 9c shows the variation of particles’MRT with particle mass flow rate, that is the MRT of particles increases as the particle mass flow rate increases when the moisture content is under 0.2%. Once the moisture content exceeds 0.3%, the MRT of particles initially increases and then decreases with the increase of particle mass flow rate. Furthermore, at Vlb ≤ 0.3% and Gp ≤ 50 kg/h,, the MRT of particles increases with the increase of moisture content since higher moisture content leads to a decrease in the distance between particles and an increase in the liquid bridge force. Consequently, the drying space is limited resulting in a larger friction force and relatively slower particle velocity.
5.4 Influence of Superficial Gas Velocity on Particle Behaviors
The flow characteristics of particles with particle mass flow rate of 50 kg/h and superficial gas temperature of 413.15 K under various superficial gas velocities are given in Fig. 10.
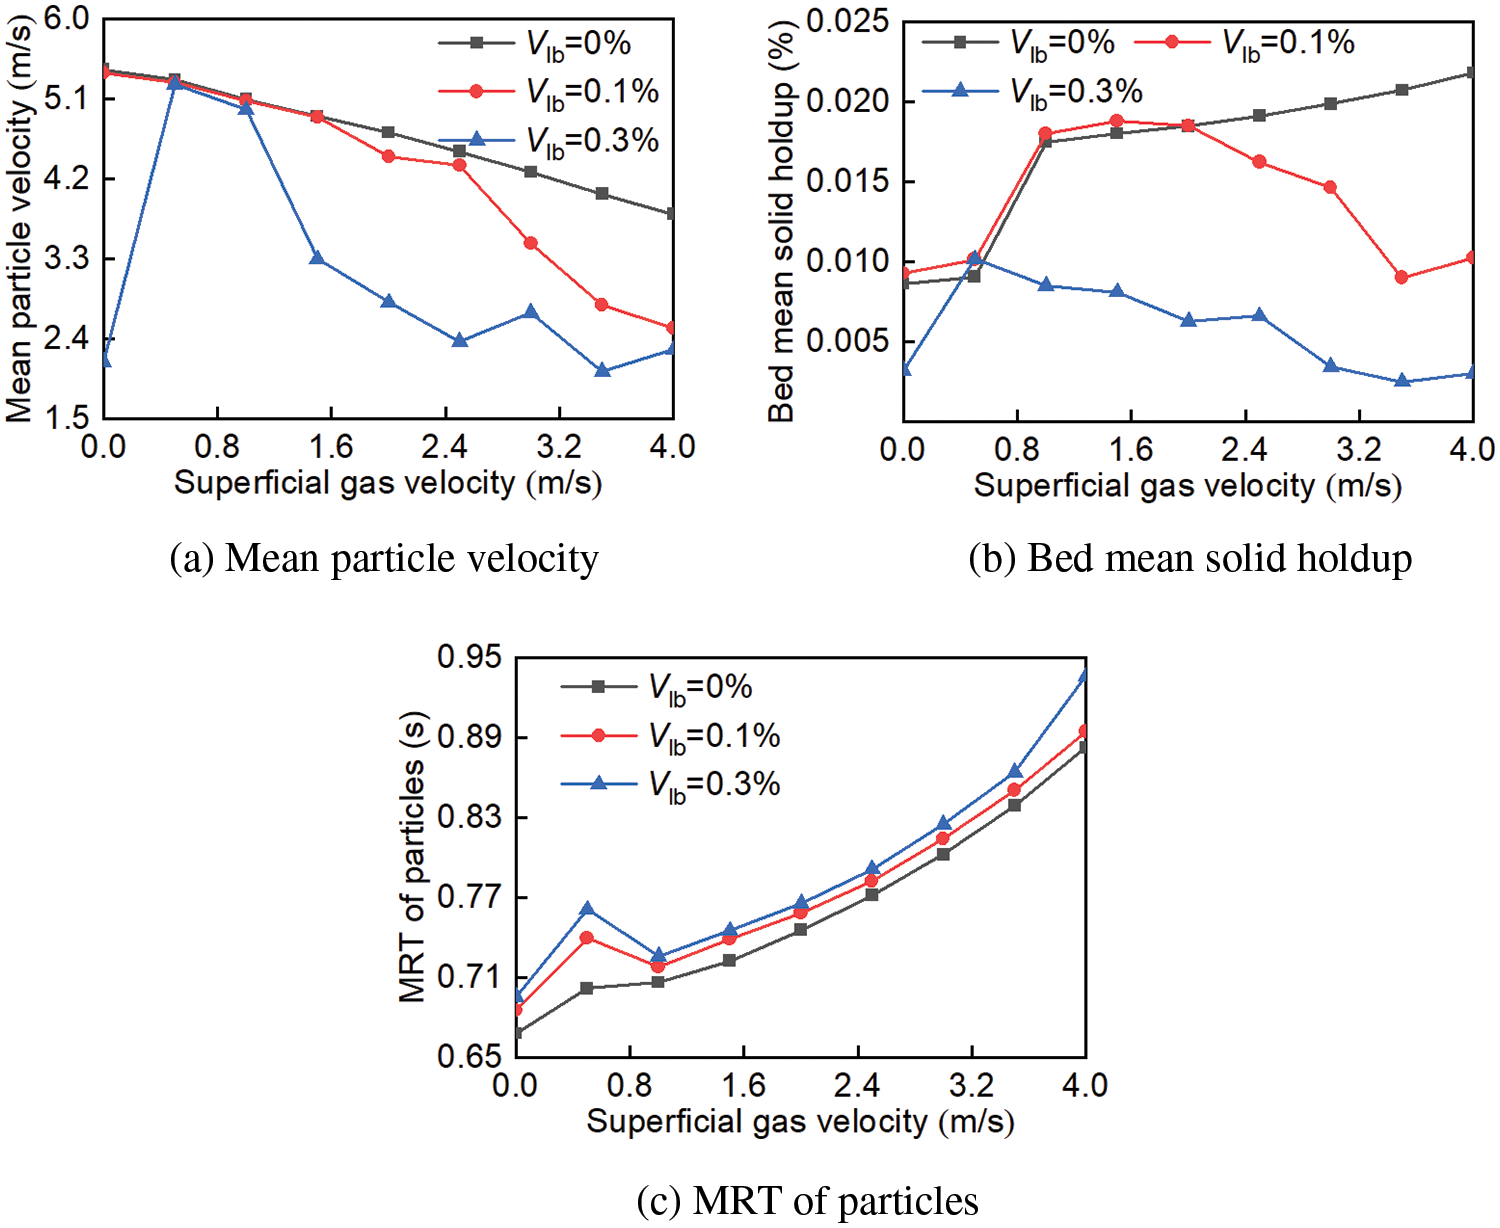
Figure 10: The effect of superficial gas velocity on the flow characteristics of particles
It can be obtained in Figs. 10a and 10cthat the gas-solid drag force increases since the superficial gas velocity increases which results in a decrease in the mean particle velocity and a relative increase in the MRT of particles. At the same time, the liquid bridge force increases with increasing moisture content, which leads to the contact frequency, and friction force between a particle and a wall increase, further a decrease in mean particle velocity and an increase in MRT of particles. Fig. 10b illustrates the different bed mean solid holdup changing tendency under variational moisture content. That is, in the dry particle system the bed mean solid holdup increases with an increase in superficial gas velocity, while in the wet particle system, the bed mean solid holdup initially increases and then decreases as the superficial gas velocity increases.
Moreover, when the superficial gas velocity is larger than 2.5 m/s and the moisture content larger than 0.1%, there occur fluctuations in the mean particle velocity due to the flooding of the drying unit inlet and a decrease in the number of particles in the unit.
5.5 Influence of Superficial Gas Temperature on Particle Behaviors
The flow characteristics of particles under different superficial gas temperature with particle mass rate of 50 kg/h and superficial gas velocity of 0.5 m/s is shown in Fig. 11.
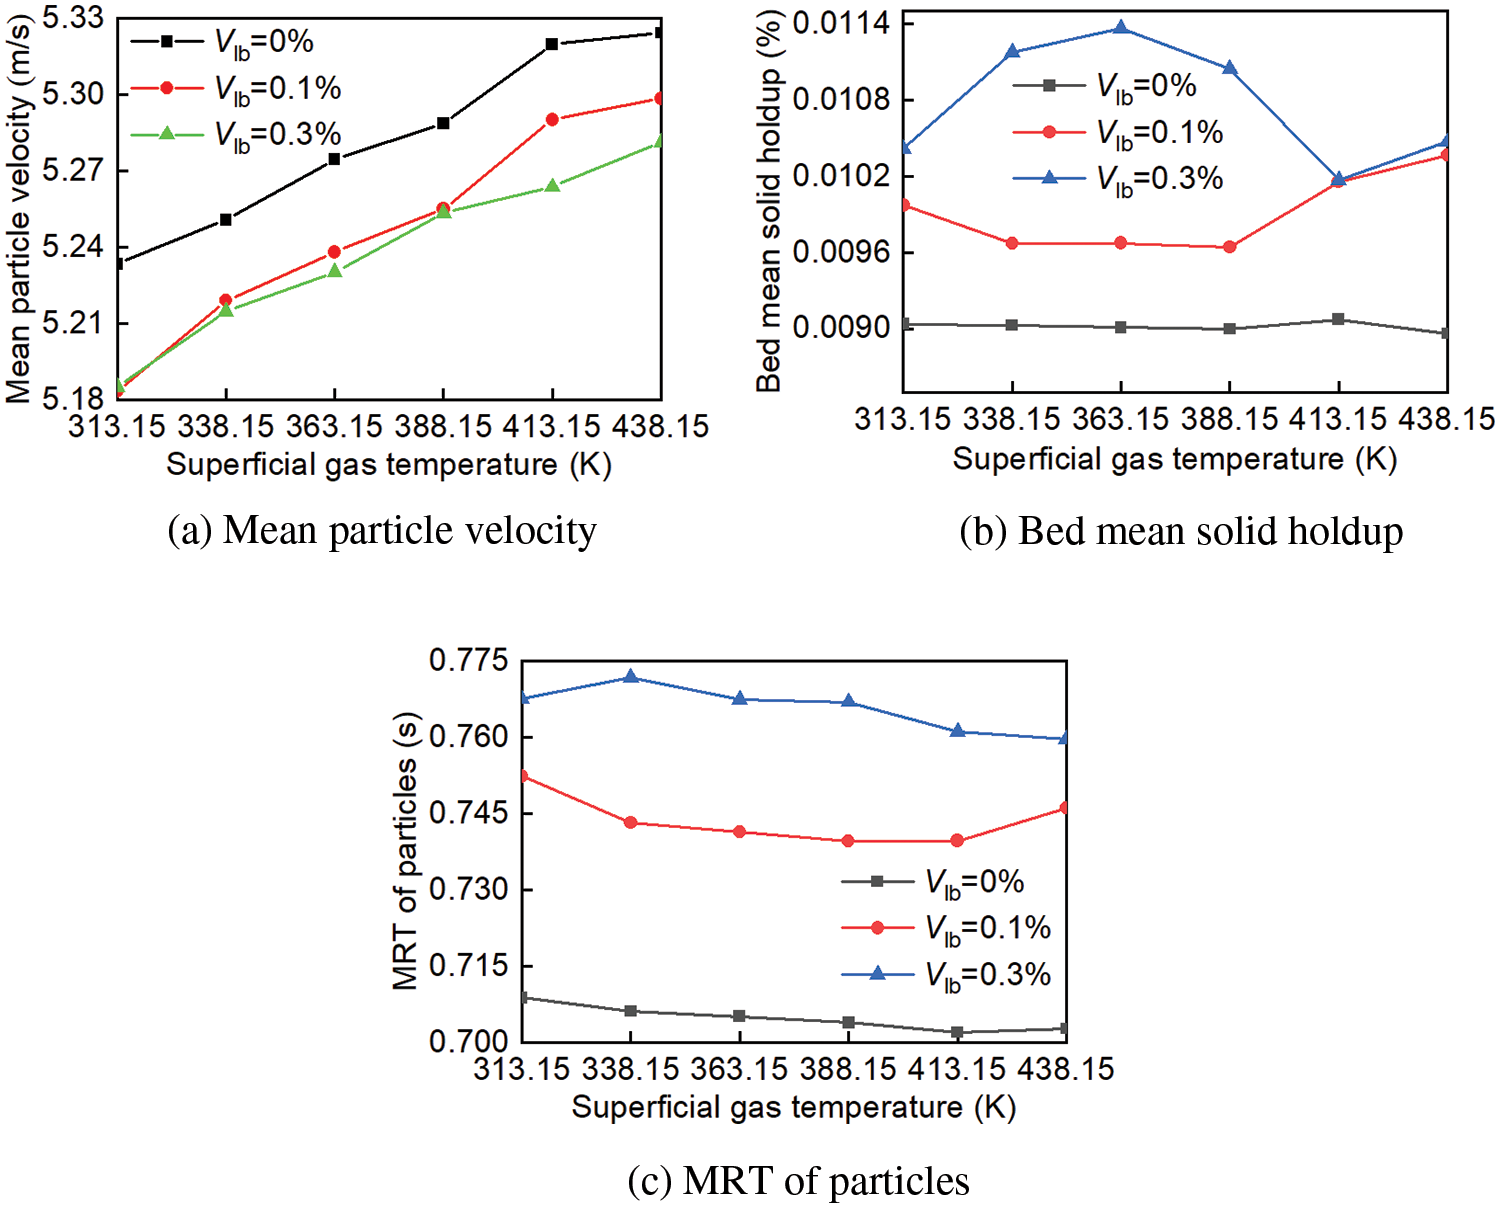
Figure 11: The effect of superficial gas temperature on the flow characteristics of particles
It can be obtained in Figs. 11a and 11cthat as the superficial gas temperature increases, the mean particle velocity also increases, while the MRT of particles decreases overall. This is because higher superficial gas temperature and lower gas density lead to an increase in convective heat transfer coefficient, a decrease in particle resistance and a reduction in the liquid bridge force between two particles or between a particle and the wall. However, as the moisture content increases, the heat taken away by evaporation also increases, leading to a decrease in gas temperature and a relative increase in gas density. Consequently, the mean particle velocity and MRT of particles change less.
According to Fig. 11b, the bed mean solid holdup initially decreases and then increases with the increase in superficial gas temperature when the moisture content is low (Vlb ≤ 0.1%). However, when the moisture content is high (Vlb = 0.3%), the bed mean solid holdup initially increases, then decreases, and then increases again with the rise in superficial gas temperature, indicating that the gas temperature also influences the particle flow. The reason is that at low superficial gas temperature and moisture content, the liquid bridge force decreases as the gas temperature increases, which leads to a smaller particle agglomeration number and reduced updraft resistance, resulting in a decrease in bed mean solid holdup. Conversely, at high superficial gas temperature, a larger evaporation rate of water on the particle surface causes water vapor to be unable to be discharged quickly from the drying unit, resulting in the formation of a large agglomeration number at the inlet of the drying unit (with a size smaller than the drying space size), and finally, an increase in the number of particles.
5.6 Distribution Characteristics of Particle Velocity and Solid Holdup
In order to compare the simulation results from the previous study and discuss the radial (or x-direction) distribution characteristics of wet particles under different bed height conditions, a series of chosen working conditions are presented in Table 3.
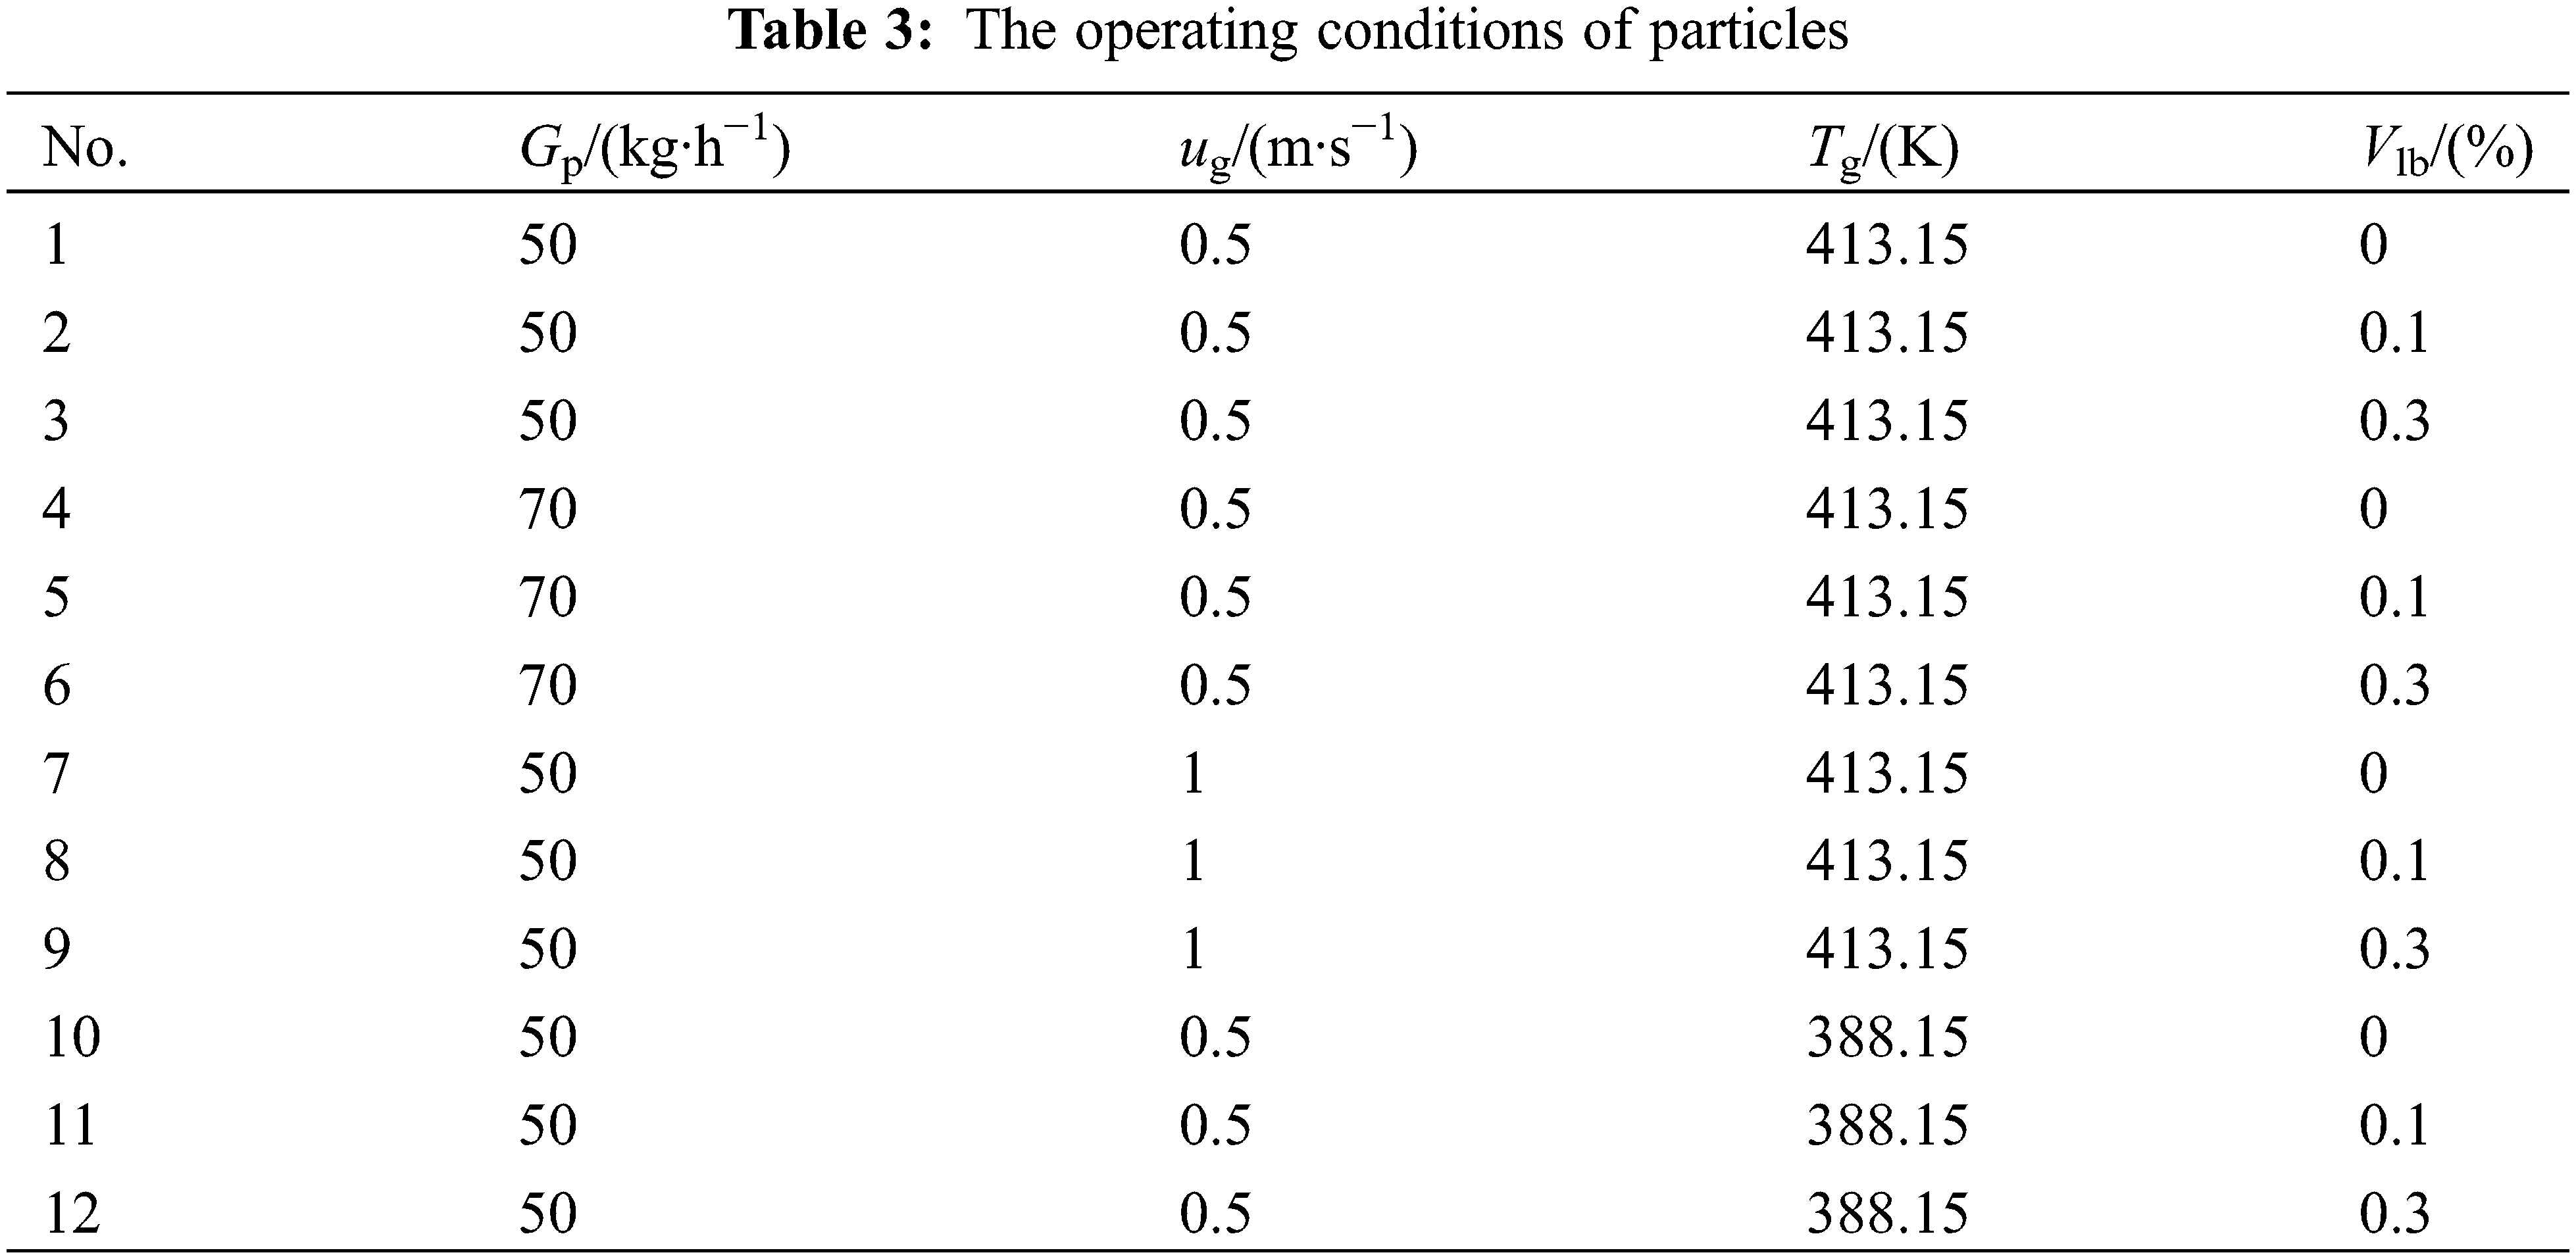
Fig. 12 shows the effect of multi-factor conditions on the radial distribution of local particle velocity for dp = 2.5 mm. It can be obtained that the local particle velocity increases with an increase in particle mass flow rate and superficial gas temperature at different bed heights, while it decreases with the increase in superficial gas velocity. As the bed height (from particle inlet to outlet) increases, the mean particle velocity gradually increases. Under all operating conditions, the local particle velocity decreases with an increase in moisture content. The particle flow structure exhibits local non-uniformity, leading to a skewed flow and a higher concentration of particles in the near-wall region. Moreover, the change in local particle velocity is more pronounced at the outlet, this is because the superficial gas temperature increases along the bed height, resulting in a decrease in the moisture content of wet particles. In conclusion, within a certain range, increasing the particle diameter can reduce the occurrence probability of flooding phenomenon, as shown in Figs. 9a, 10a, and 11a.
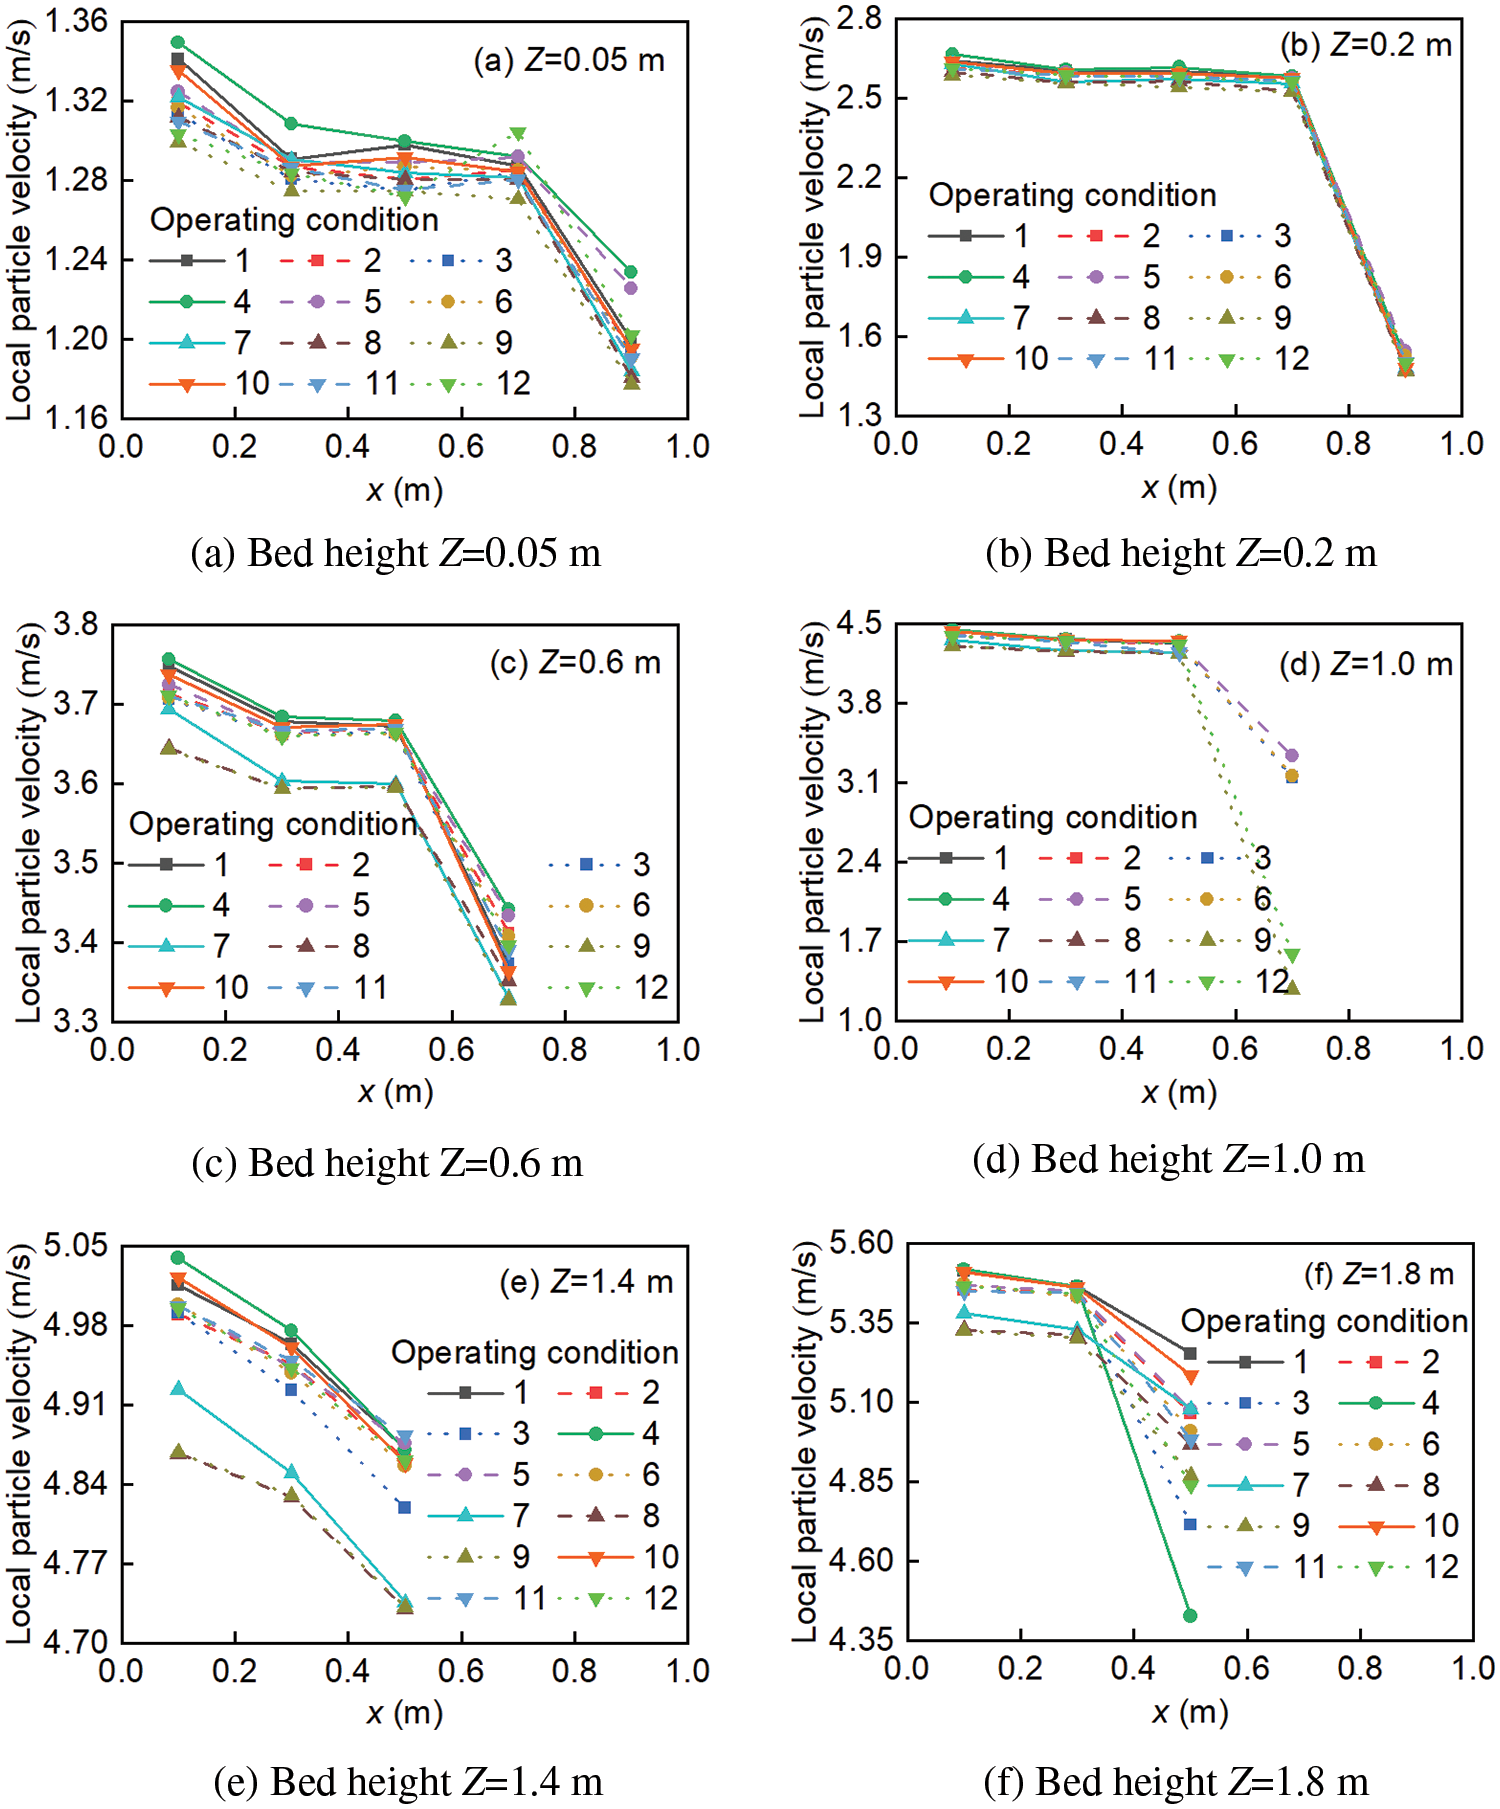
Figure 12: Radial distribution of local particle velocity (x-direction, dp = 2.5 mm)
Fig. 13 shows the effect of multi-factor conditions on the local solid holdup radial distribution for dp = 2.5 mm. It can be obtained that the local solid holdup increases with the increase of particle mass flow rate, superficial gas velocity, and moisture content at different bed heights. In most operating conditions, the radial profile of solids holdup exhibits heterogeneity in the upper section of the drying unit. At all bed heights, the solid holdup is higher in the near-wall region compared to the near-fluid region. This phenomenon occurs because the particles tend to align near the wall, where the gas velocity is close to zero. Furthermore, the solid holdup is highest at the particle inlet of the drying unit and decreases along the bed height (from particle inlet to outlet).
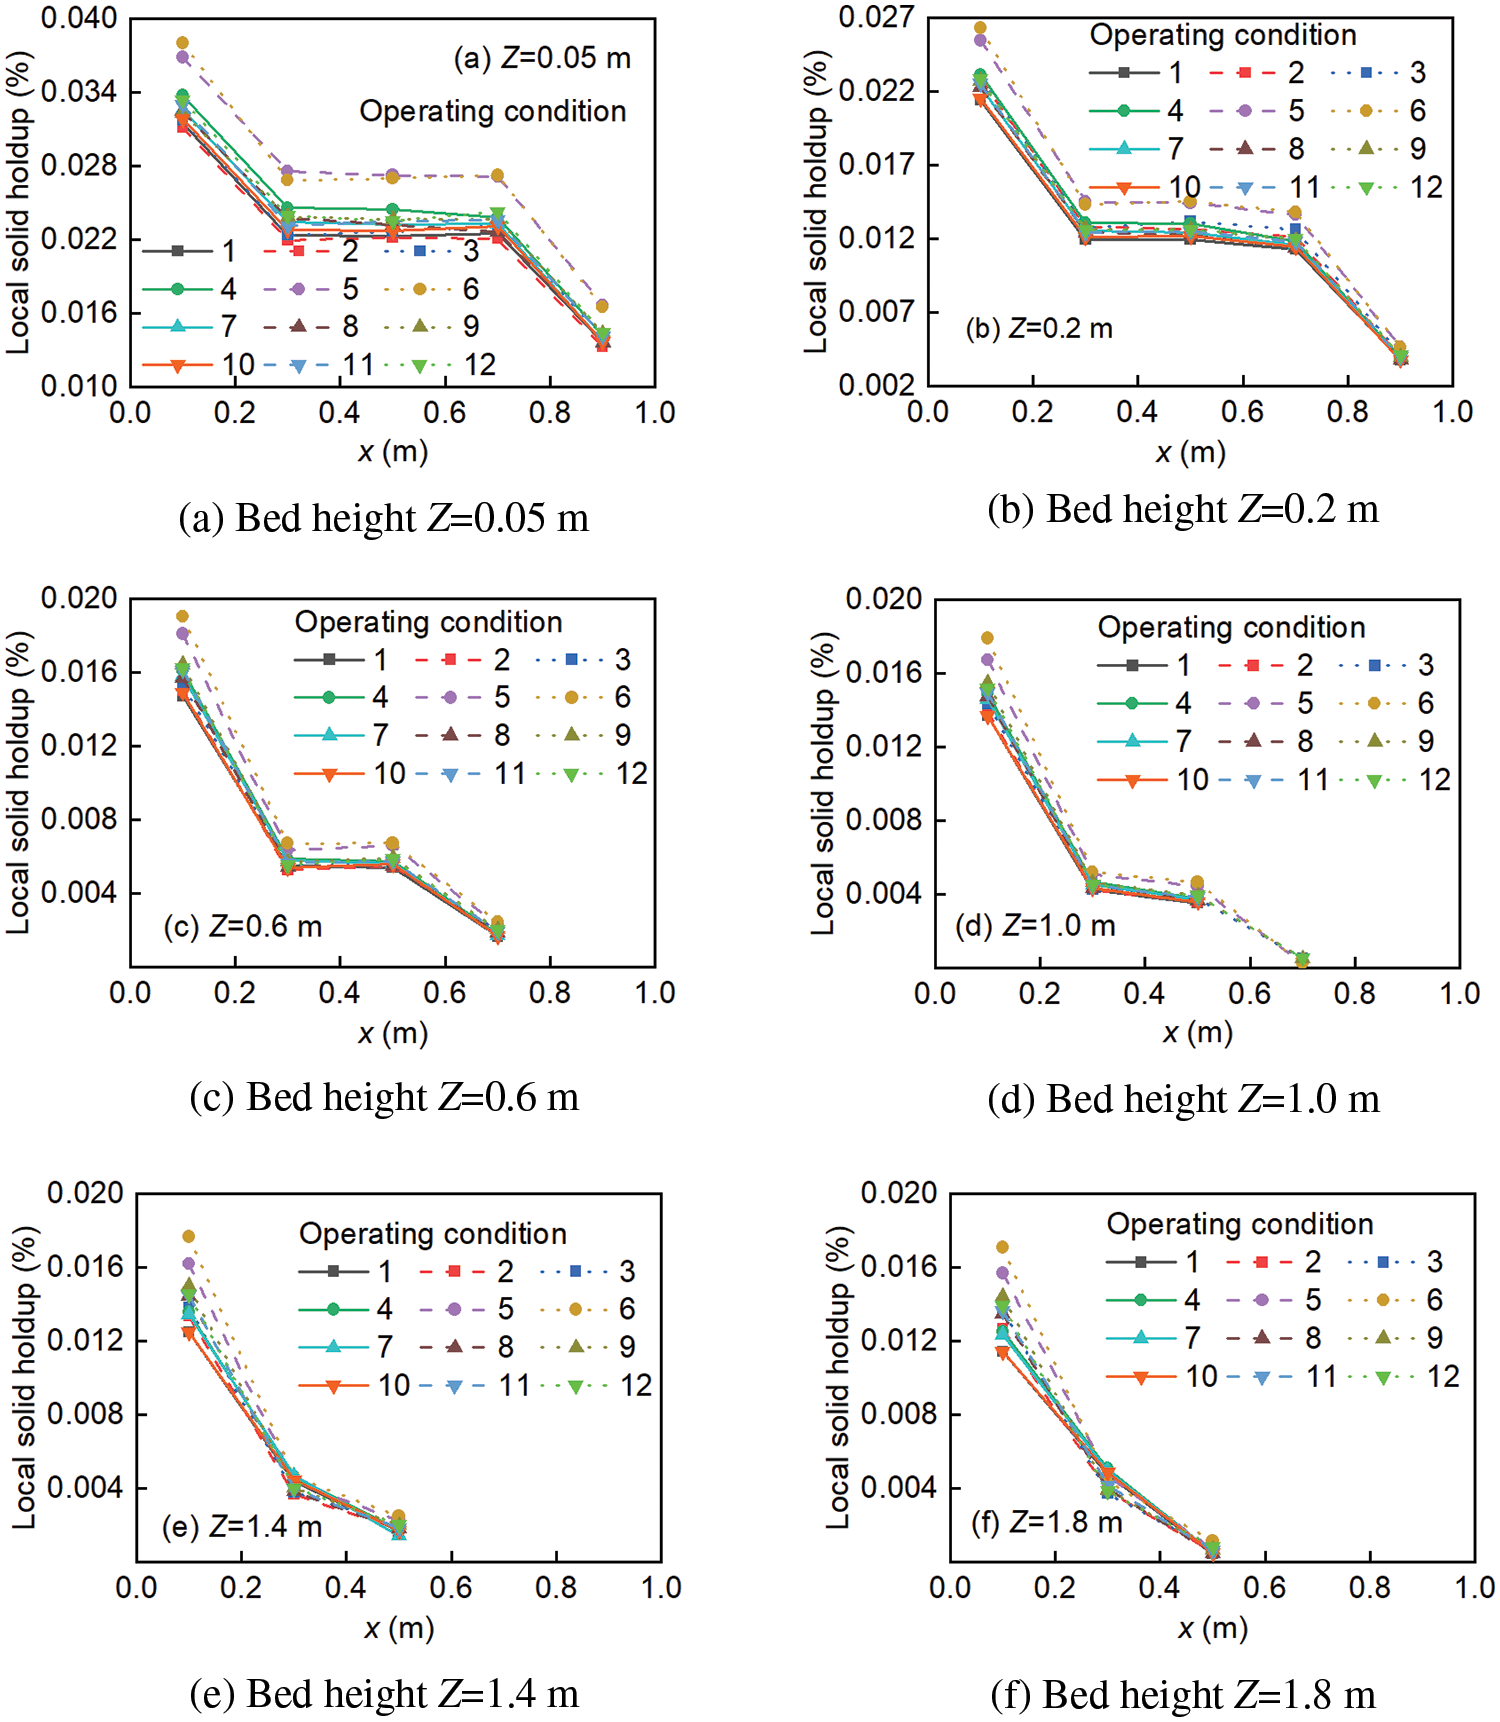
Figure 13: Radial distribution of local solid holdup (x-direction, dp = 2.5 mm)
In a word, when the superficial gas velocity and particle mass flow exceed a certain critical value, flooding occurs. However, in the case of high moisture content, the probability of flooding can be reduced by decreasing the particle mass flow rate, the superficial gas velocity or increasing particle diameter.
5.7 The Prediction of RSM-BBD Method
Response surface methodology (RSM) is an empirical modeling approach in which data is obtained through finite order orthogonal experiments, and the response variables fitted can globally approximate the actual response values, and the optimal set of parameters is determined to solve the multivariate optimization problem [32]. The Box-Behnken design (BBD) is a faster and more efficient method that requires the fewest number of experiments, and can optimize the analysis conditions and reduce computational costs.
The combination of RSM and the BBD is advantageous for predicting the flow characteristics of wet particles and reducing the likelihood of flooding. In addition, the approach is divided into three steps: the experimental design, the regression models, and the optimization [33]. The regression coefficient R2 is used to evaluate the performance of the model, and the closer the R2 value is to 1.0, the more accurate the response surface model is.
In this work, the RSM-BBD method is used to generate a design consisting of 29 runs. The RSM-BBD is used to analyze the effects of particle mass flow rate (Gp, kg/h), moisture content (Vlb, %), superficial gas velocity (ug, m/s), and superficial gas temperature (Tg, K) on the mean particle velocity (vp, m/s) and bed mean solid holdup (εp,bed, %). The recommended range for the operating condition parameters is as follows: 30 kg/h ≤ Gp ≤ 50 kg/h, 0 m/s ≤ ug ≤ 1 m/s, 388.15 K ≤ Tg ≤ 428.15 K, and 0% ≤ Vlb ≤ 0.3%.
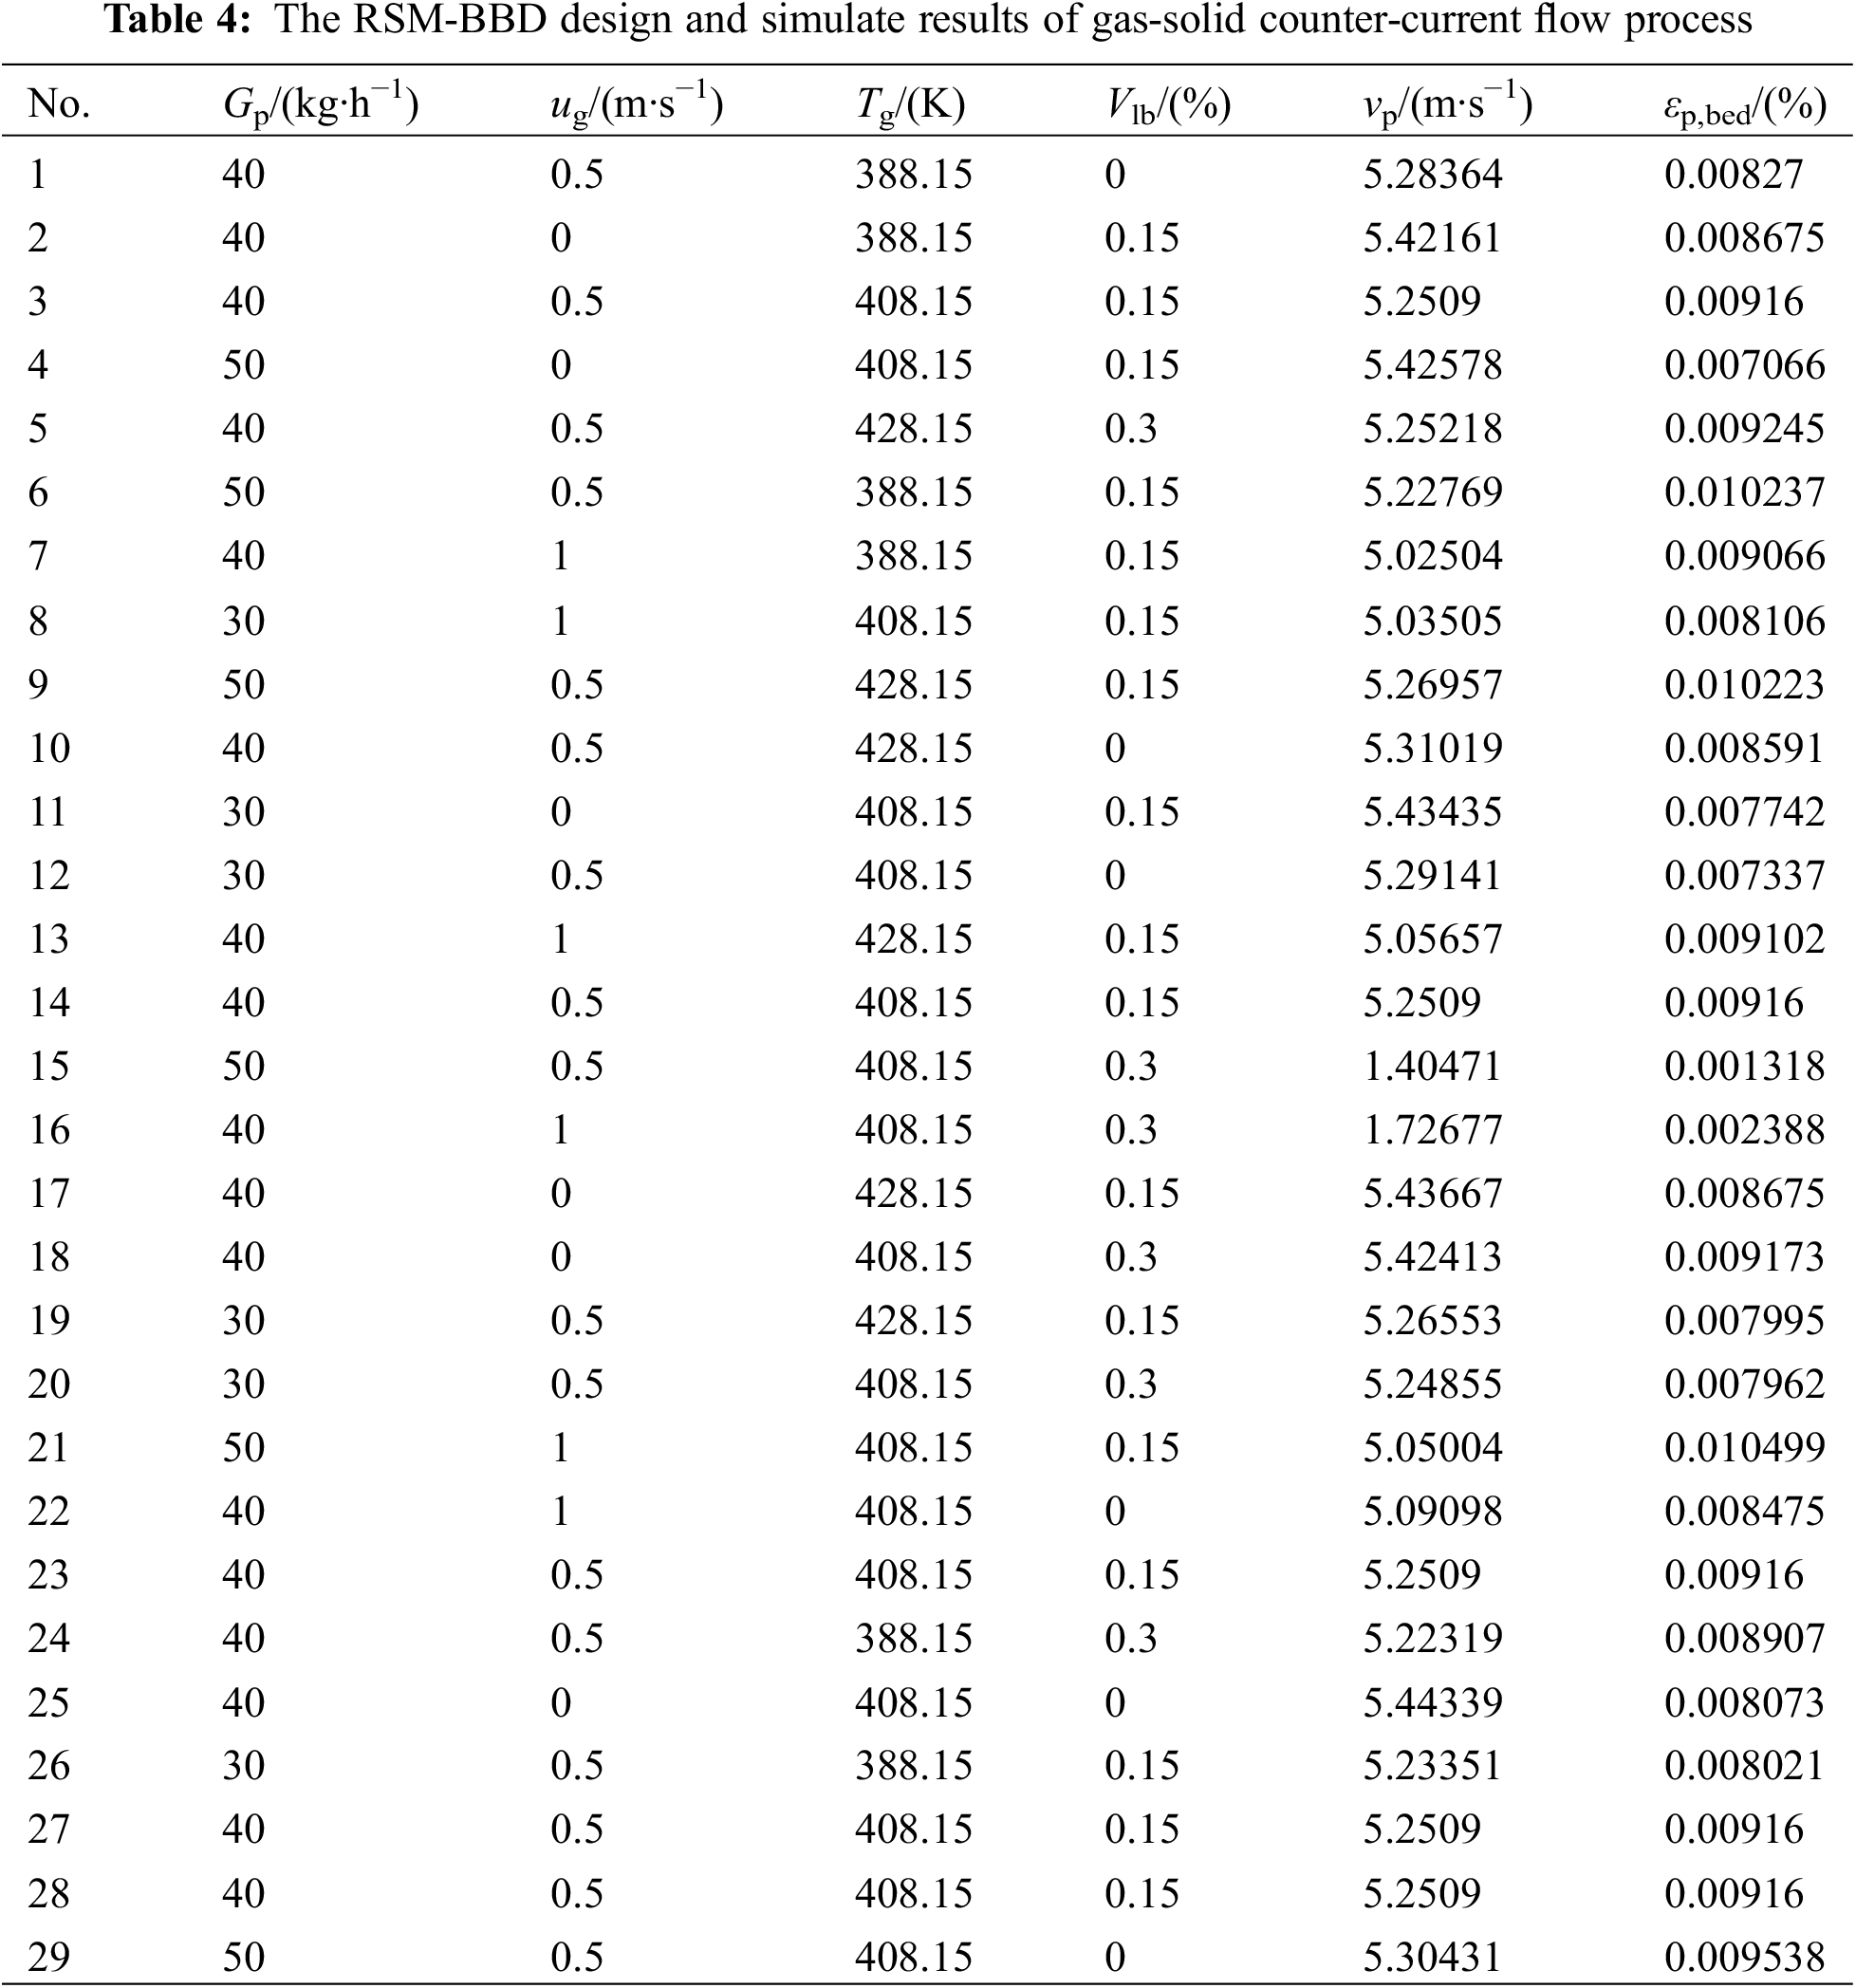
The RSM-BBD design and simulated results are given in Table 4.
5.7.1 Influence of Independent Variables on the Mean Particle Velocity
The RSM-BBD method is used to analyze the interactions between different influencing factors and their impact on the regression model. By performing multiple regression analysis on the simulated data in Table 4, the regression equation for the mean particle velocity is obtained:
After performing the fitting calculation of RSM-BBD, the p value associated with the regression equation for mean particle velocity is less than 0.0001, indicating that the equation is highly significant. Furthermore, the obtained correlation coefficient is R2 = 0.9581, which is close to 1, suggesting that the predicted values from the selected model closely align with the actual values.
Fig. 14 shows the RSM-BBD analysis of mean particle velocity. It can be obtained in Fig. 14a that the actual values align with the predicted values, suggesting that the mean particle velocity regression model fits well. In Figs. 14b–14g, it can be observed that the mean particle velocity tends to decrease as the moisture content and superficial gas velocity increase. With the simultaneous increase of particle mass flow rate and moisture content, vp initially increases and then decreases. The response surface of Fig. 14g is not steep and the degree of bending is not large, indicating that the interaction between superficial gas temperature (Tg) and moisture content (Vlb) is not significant. This is because with the increase of moisture content, superficial gas temperature and velocity, more moisture can flow to the top of the drying unit. However, some moisture is unable to escape the drying unit in time, which leads to an increase of particle agglomeration size at the top. Meantime, the superficial gas changes from a uniform flow to a jet flow, and the gas quickly bypasses the particle agglomeration. As a result, the combined influence of superficial gas temperature and moisture content on the mean particle velocity is very small. Furthermore, Figs. 14b–14galso shows that the interaction between particle mass flow rate (Gp) and superficial gas temperature (Tg), superficial gas velocity (ug) and superficial gas temperature (Tg) is insignificant, but other factors interact significantly. The impact of each operating condition parameter on the mean particle velocity is determined by the curvature of the response surface. In terms of magnitude, the following factors play a role: superficial gas velocity, particle mass rate, moisture content, and superficial gas temperature.
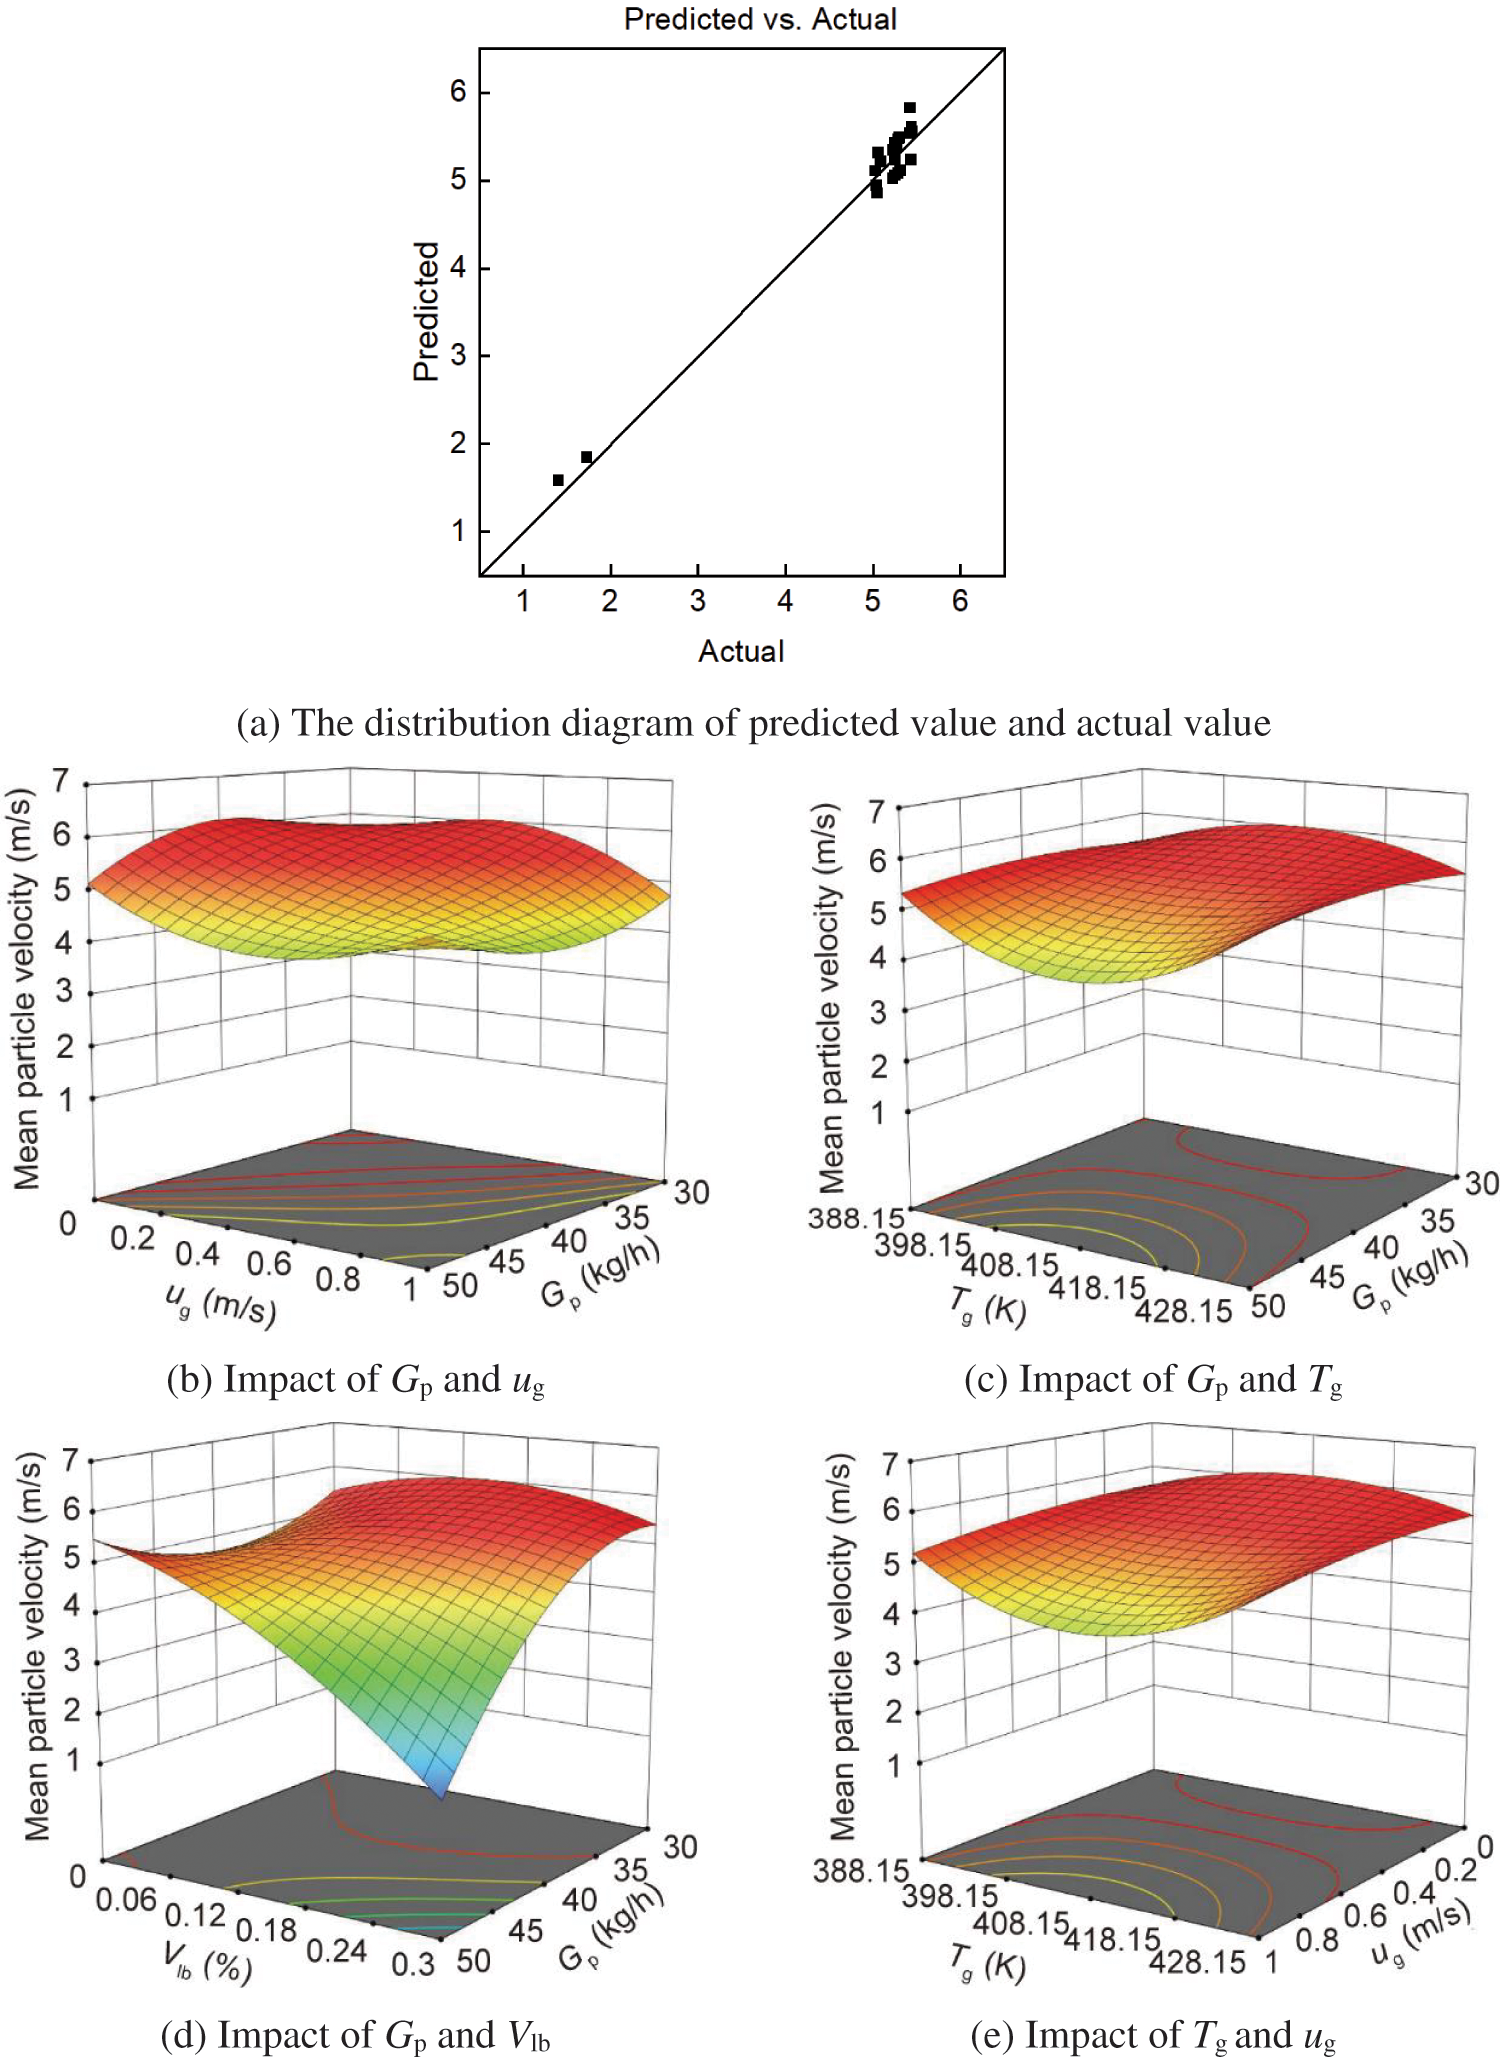
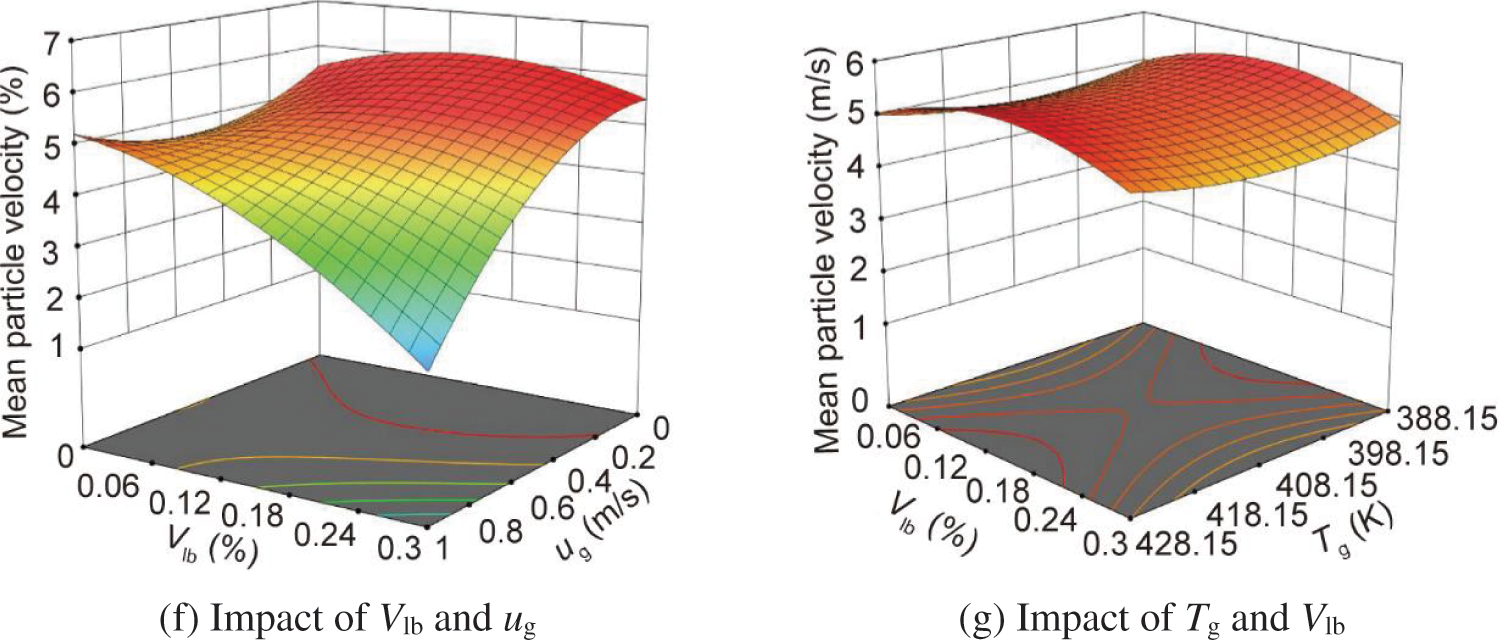
Figure 14: The RSM-BBD analysis of mean particle velocity
5.7.2 Influence of Independent Variables on the Bed Mean Solid Holdup
The RSM-BBD method is used to analyze the variance and determine the significance of each factor on the bed mean solid holdup. By conducting multiple regression analysis on the simulated data presented in Table 4, the regression equation for the bed mean solid holdup is derived as follows:
After performing the fitting calculation of RSM-BBD, the P value associated with the regression equation for the bed mean solid holdup regression equation is less than 0.0001, indicating that the equation is highly significant. In addition, the correlation coefficient is obtained as R2 = 0.9734, which is closer to 1, indicating that the predicted value of the selected model is closer to the actual value.
Fig. 15 shows the RSM-BBD analysis of bed mean solid holdup. It can be observed in Fig. 15a that the predicted values align closely with the actual values, suggesting that the regression model for bed mean solid holdup is a good fit. As shown in Figs. 15b–15g, under the interaction of particle mass flow rate (Gp) and superficial gas velocity (ug), particle mass flow rate (Gp) and moisture content (Vlb), and superficial gas velocity (ug) and moisture content (Vlb), the bed mean solid holdup first increases and then decreases with the increase of these parameters. This is because the number of particles in the drying unit increases with the increase of these parameters, which leads to an upward trend of solid holdup. Conversely, when these parameters exceed the critical values, the top of the drying unit is gradually blocked, leading to a decrease of the solid holdup. Moreover, the response surfaces of Figs. 15c, 15f and 15gshow minimal bending, indicating that the interaction between the particle mass flow rate (Gp) and the superficial gas temperature (Tg), the superficial gas velocity (ug) and the superficial gas temperature (Tg), and the superficial gas temperature (Tg) and the moisture content (Vlb) is not significant, while other factors exhibit significant interaction. The curvature of the response surface determines the strength of the effect of each operating condition parameter on the bed mean solid holdup. In terms of magnitude, the factors that determine the strength of the effect are the superficial gas velocity, particle mass rate, moisture content, and superficial gas temperature.
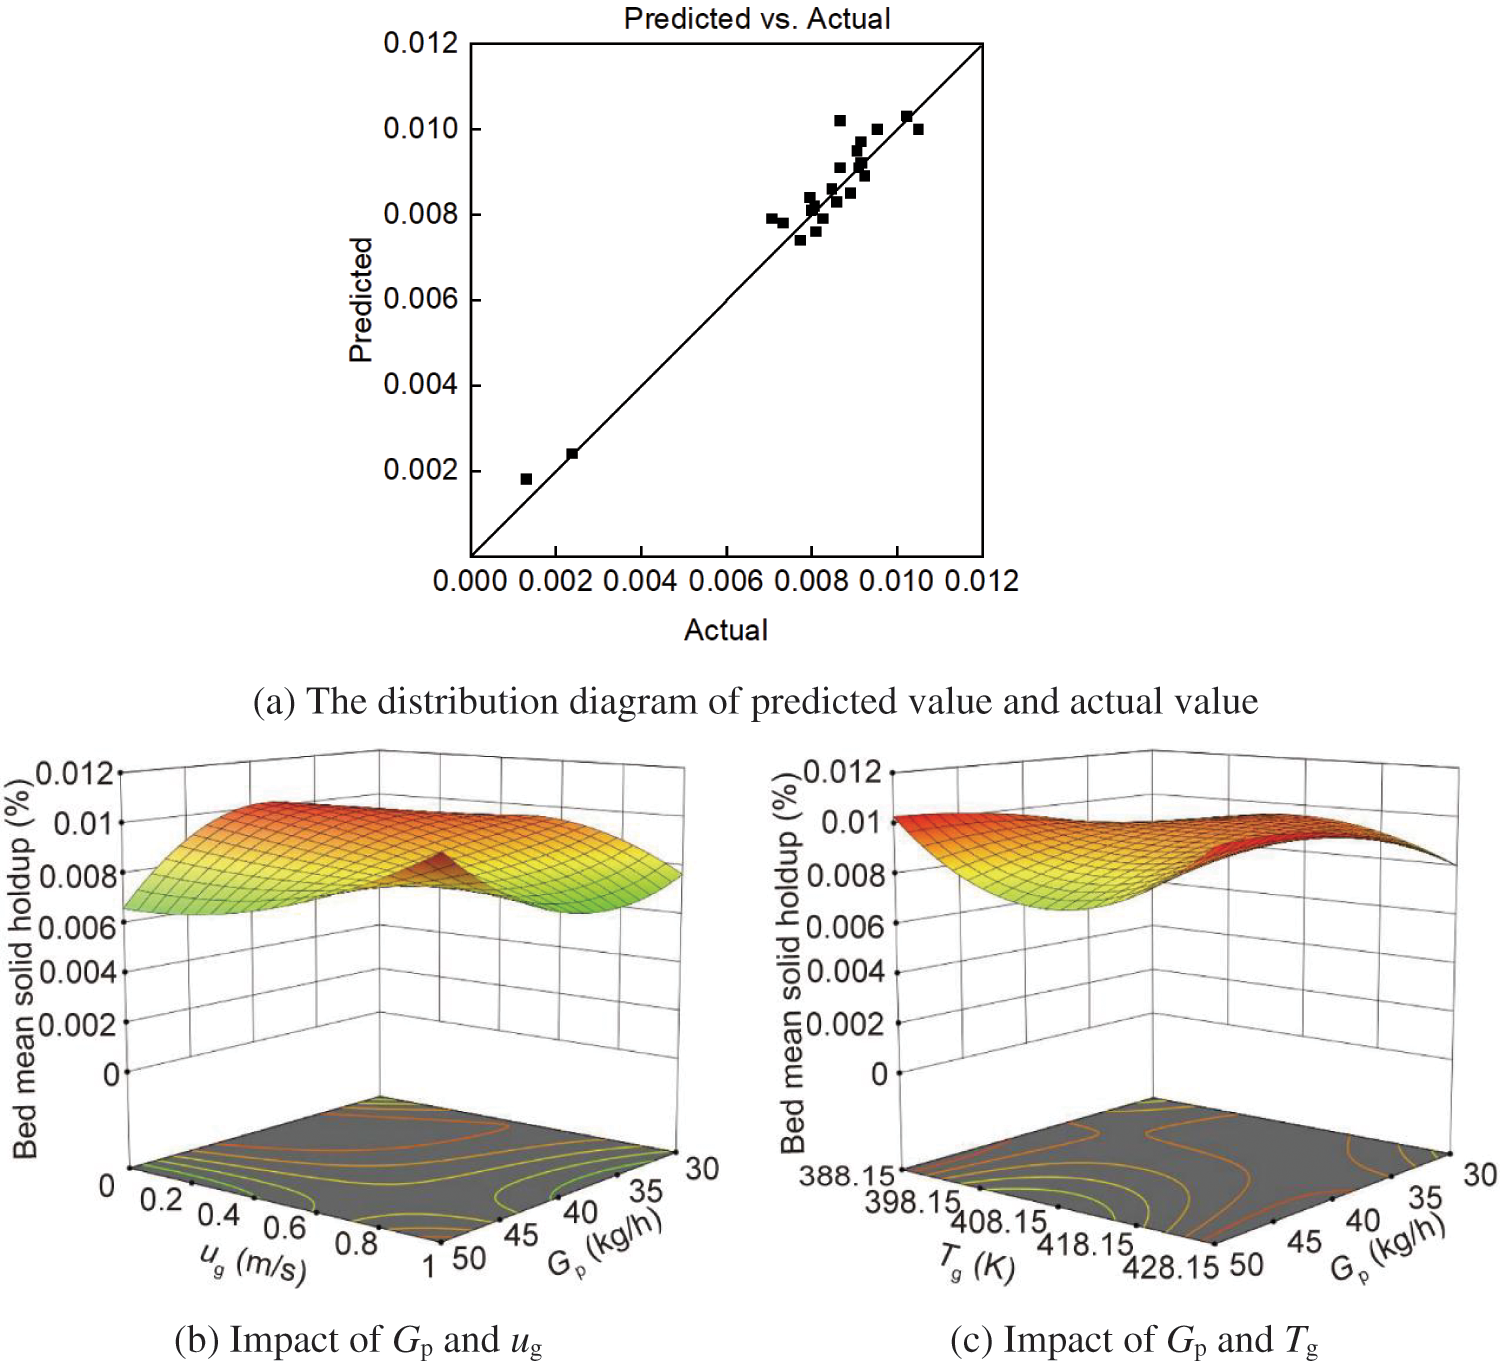
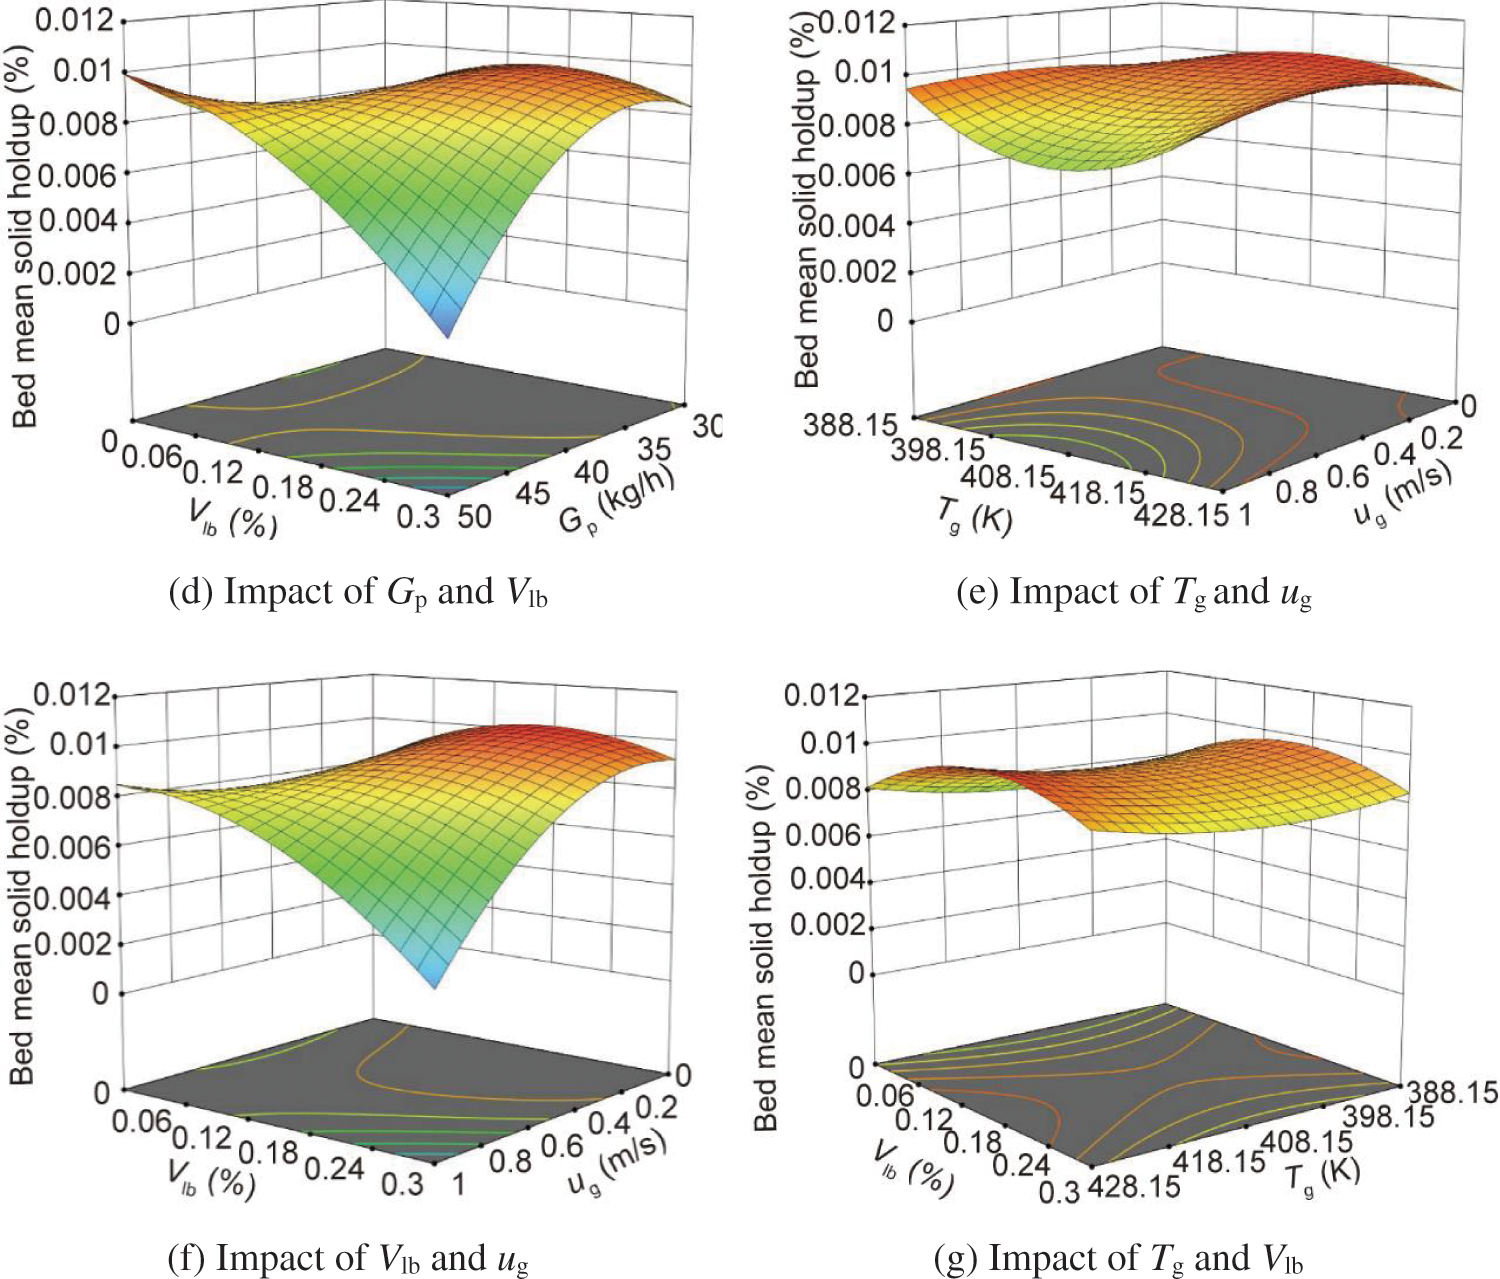
Figure 15: The RSM-BBD analysis of bed mean solid holdup
5.7.3 The Predicted Value of the Optimum Condition and the Verification of Regression Model
For preventing flooding, multi-objective optimization analysis and expectation function optimization method can be used to determine the optimal combination of process parameters. The optimization model is represented by:
The optimal combination of process parameters is as follows: Gp = 35.149 kg/h, ug = 0.073 m/s, Tg = 423.831 K, and Vlb = 0.201%. Under this condition, the mean particle velocity is 5.460 m/s, and the bed mean solid holdup is 0.009%. To verify the accuracy of the regression model, this paper conducted three repeated numerical calculations using the optimal operating condition parameters mentioned earlier, as shown in Table 5.
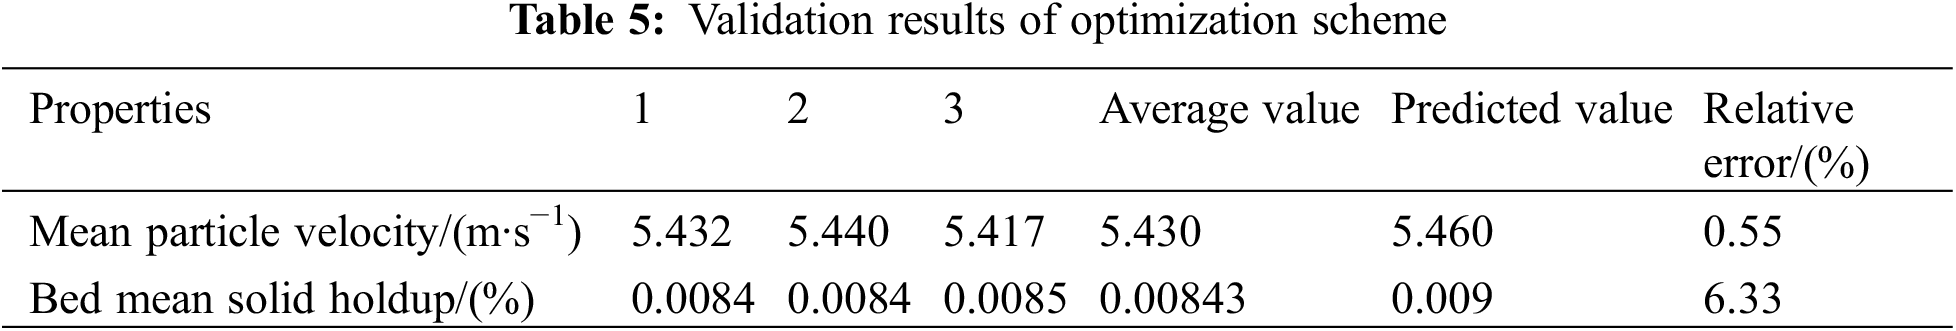
Table 5 shows that the relative errors of the mean particle velocity and bed mean solid holdup are 0.55% and 6.33%, respectively, suggesting that the regression model accurately captures the variations in particle flow characteristics in the drying unit. Additionally, it helps minimize the damage caused by flooding to the drying equipment.
This paper presents numerical simulations of the flow characteristics of wet particles in the drying unit of a vertical powder dryer. A coupled model of CFD-DEM with a liquid bridge force is employed, and the parameters are optimized using the RSM-BBD method. The following conclusions can be drawn:
(a) The particle flow structure in the dryer exhibits local non-uniformity. The particles primarily concentrate in the near-wall region, leading to intense collisions between the particles and the wall surface. Furthermore, the up-flow gas effectively improves the solid holdup and enhances the axial/radial perturbance.
(b) In a specific range, when the moisture content increases, the mean particle velocity decreases, while the bed mean solid holdup and MRT of particles increase. Moreover, under high moisture content, particles tend to agglomerate, which can lead to blockage of the inlet of the drying unit and cause flooding. In short, the moisture content greatly influences particle movement.
(c) The regression models for the mean particle velocity and bed mean solid holdup were established using RSM-BBD method and verified (R2 is 0.9581 and 0.9734). Subsequently, the optimal combination of technological parameters is determined through multi-objective optimization analysis and the method of optimizing the expectation function. The optimal combination of process parameters is as follows: Gp = 35.149 kg/h, ug = 0.073 m/s, Tg = 423.831 K, and Vlb = 0.201% Under this condition, the mean particle velocity is 5.460 m/s, and the bed mean solid holdup is 0.009%.
Acknowledgement: The authors would like to acknowledge the Multiphase Flow Research Group for their continuous support.
Funding Statement: The authors received no specific funding for this study.
Author Contributions: Study conception and design: Long Yu, Dongdong Pang; Data collection: Long Yu, Dongdong Pang, Minmin She; Analysis and interpretation of results: Dongdong Pang, Hongwei Qiu; Draft manuscript preparation: Dongdong Pang; Software: Dongdong Pang, Ping Cao, Xiongwei You. All authors reviewed the results and approved the final version of the manuscript.
Availability of Data and Materials: All data are presented inside the manuscript.
Conflicts of Interest: The authors declare that they have no conflicts of interest to report regarding the present study.
References
1. Dong PF, Wang Z, Li ZJ, Li SG, Lin WG, Song WL. Experimental study on pyrolysis behaviors of coal in a countercurrent downer reactor. Energy Fuels. 2012;26(8):5193–8. [Google Scholar]
2. Wang ZW. Optimization and experimental study on fluidity in dryer of powder flow heat pump dryer (Master Thesis). Shandong Jianzhu University: China; 2021. [Google Scholar]
3. Aldugman TA. Simulation of hydrodynamics in a gas-solid downer reactor under co- and counter-current operations (Ph.D. Thesis). King Abdullah University of Science and Technology: Saudi Arabia; 2022. [Google Scholar]
4. Jiang KJ, Chen W, Zhang Q, Xu C, Du XZ. Experimental study on cluster characteristics of gas-solid countercurrent fluidized bed. J Eng Thermophys. 2021;42(12):3212–21 (In Chinese). [Google Scholar]
5. Nagarajan K, Renganathan T, Krishnaiah K. Hydrodynamics of a continuous countercurrent liquid-solid system: experiments and modeling. RSC Adv. 2016;6(42):35486–97. [Google Scholar]
6. Vynnycky M, Rangavittal BV, Glaser B. An asymptotic model for gas-solid flow in a countercurrent moving bed reactor. Siam J Appl Math. 2023;83(2):882–908. [Google Scholar]
7. Gillani SSJ, Ullah A, Zaman M, Chugtai IR, Inayat MH. Counter-current three-phase fluidization in a turbulent contact absorber: a CFD simulation. Particuol. 2017;35:51–67. [Google Scholar]
8. Zhao YF, Fan YP, Lyu H, Wang KS. Radial distributions of Kutta-Joukowski force and particle concentration in a downer. J Chem Eng Chinese Univ. 2020;43(2):420–31 (In Chinese). [Google Scholar]
9. Jiang F, Liu Y, Qi GP, Li XL. Study on particle collision behavior in a liquid-solid down-flow circulating fluidized bed. Chem Ind Eng. 2022;39(3):49–59 (In Chinese). [Google Scholar]
10. Zhao Z, Situmorang YA, Fushimi C, Tsutsumi A, Yang J, Hao X, et al. Numerical simulation of hydrodynamic behaviors in a gas-solids dense downer reactor. Adv Powder Technol. 2020;31(7):3028–37. [Google Scholar]
11. Liu WM, Yuan QM. Computational fluid dynamics simulation of gas-solid downer distributor. Pet Process Petrochem. 2022;53(8):73–8 (In Chinese). [Google Scholar]
12. Arsenijević Z, Radoičić TK, Garić-Grulović R, Đuriš M, Grbavčić Z. Hydrodynamic modeling of downward gas-solid flow. Part II: co-current flow. Powder Technol. 2014;256:416–27. [Google Scholar]
13. Luo KB, Liu W, Zhu JX, Beeckmans JM. Characterization of gas upward-solids downward countercurrent fluidized flow. Powder Technol. 2001;115:36–44. [Google Scholar]
14. Li ZJ, Dong PF, Song WL, Fan CG, Li SG, Lin WG. Radial and axial distributions of particle velocity in a counter-current fluidized bed. Chinese J Process Eng. 2012;12(3):376–81 (In Chinese). [Google Scholar]
15. Peng G, Dong PF, Li ZJ, Wang JW, Lin WG. Eulerian simulation of gas-solid flow in a countercurrent downer. Chem Eng J. 2013;230:406–14. [Google Scholar]
16. Garić-Grulović R, Radoičić TK, Arsenijević Z, Đuriš M, Grbavčić Z. Hydrodynamic modeling of downward gas-solids flow. Part I: counter-current flow. Powder Technol. 2014;256:404–15. [Google Scholar]
17. Jiang KJ, Wang FL, Kong YQ, Xu C, Du XZ. Characteristics of axial and radial development of solids holdup in a countercurrent fluidized bed particle solar receiver. J Therm Sci. 2021;30:2223–40. [Google Scholar]
18. Jiang KJ, Du XZ, Kong YQ, Xu C, Ju X. A comprehensive review on solid particle receivers of concentrated solar power. Renew Sustainable Energy Rev. 2019;116:109463. [Google Scholar]
19. Jiang KJ, Wang FL, Kong YQ, Xu C, Du XZ. Experimental investigation on the hydrodynamic characteristics of fluidized bed particle solar receiver with gas-solid countercurrent flow pattern. J Therm Sci. 2021;30:2241–53. [Google Scholar]
20. Liu JB, Liu XH, Zhang ZX, Zhao H, Ge W. Modeling the axial hydrodynamics of gas-solid counter-current downers. Particuol. 2020;50:135–43. [Google Scholar]
21. Rastialhosseini SA, Abdollahzadeh AA. Effect of feed-size segregation on energy consumption during jigging: a CFD-DEM study. Particul Sci Technol. 2023;1–11. doi:10.1080/02726351.2023.2269385. [Google Scholar] [CrossRef]
22. Mikami T, Kamiya H, Horio M. Numerical simulation of cohesive powder behavior in a fluidized bed. Chem Eng Sci. 1997;53(10):1927–40. [Google Scholar]
23. Mishra R, Arora A. Novel CFD-DEM approach for analyzing spherical and non-spherical shape particles in spouted fluidized bed. Particul Sci Technol. 2024;42(2):288–300. [Google Scholar]
24. Muguruma Y, Tanaka T, Tsuji Y. Numerical simulation of particulate flow with liquid bridge between particles (simulation of centrifugal tumbling granulator). Powder Technol. 2000;109(1–3):49–57. [Google Scholar]
25. Nase ST, Vargas WL, Abatan AA, McCarthy JJ. Discrete characterization tools for cohesive granular material. Powder Technol. 2001;116(2–3):214–23. [Google Scholar]
26. Sutkar VS, Deen NG, Patil AV, Salikov V, Antonyuk S, Heinrich S, et al. CFD-DEM model for coupled heat and mass transfer in a spout fluidized bed with liquid injection. Chem Eng J. 2016;288:185–97. [Google Scholar]
27. Li J, Mason DJ. A computational investigation of transient heat transfer in pneumatic transport of granular particles. Powder Technol. 2000;112(3):273–82. [Google Scholar]
28. Mansoori Z, Saffar-Avval M, Basirat-Tabrizi H, Ahmadi G, Lain S. Thermo-mechanical modeling of turbulent heat transfer in gas-solid flows including particle collisions. Int J Heat Fluid Flow. 2002;23(6):792–806. [Google Scholar]
29. Gunn DJ. Transfer of heat or mass to particles in fixed and fluidised beds, Int. J. Int J Heat Mass Trans. 1978;21(4):467–76. [Google Scholar]
30. Tang TQ, He YR, Ren AX, Wang TY. Experimental study and DEM numerical simulation of dry/wet particle flow behaviors in a spouted bed. Ind Eng Chem Res. 2019;58(33):15353–67. [Google Scholar]
31. Wu Q. Numerical simulation of fluidization behavior and liquid transfer characteristics of non-spherical wet particles (Master Thesis). Harbin Institute of Technology: China; 2022. [Google Scholar]
32. Benghazi Z, Zeghichi L, Djellali A, Hafdallah A. Predictive modeling and multi‐response optimization of physical and mechanical properties of SCC based on sand’s particle size distribution. Arab J Sci Eng. 2020;45(10):8503–14. [Google Scholar]
33. Khan S, Madni A, Aamir MN, Khan S, Ahmad FUD, Basit A, et al. Design and evaluation of sustained-release lipid-PLGA hybrid nanoparticles for enhanced anticancer efficacy of 5-fluorouracil. Particul Sci Technol. 2023;42:269–87. [Google Scholar]
Cite This Article
 Copyright © 2024 The Author(s). Published by Tech Science Press.
This work is licensed under a Creative Commons Attribution 4.0 International License , which permits unrestricted use, distribution, and reproduction in any medium, provided the original work is properly cited.
 Downloads
 Citation Tools