
 Submit a Paper
 Propose a Special lssue
 Open Access
ARTICLE

Numerical and Experimental Analysis of the Aerodynamic Torque for Axle-Mounted Train Brake Discs
1 Brake System Laboratory, CRCC (Qingdao) Vehicle Inspection Station Co., Ltd., Qingdao, 266031, China
2 Brake System Laboratory, CRRC Qingdao Sifang Rolling Stock Research Institute Co., Ltd., Qingdao, 266031, China
3 The State Key Laboratory of Heavy-Duty and Express High-Power Electric Locomotive, Central South University, Changsha, 410075, China
4 Key Laboratory of Traffic Safety on Track of Ministry of Education, School of Traffic & Transportation Engineering, Central South University, Changsha, 410075, China
5 National & Local Joint Engineering Research Center of Safety Technology for Rail Vehicle, Changsha, 410075, China
* Corresponding Author: Chen Jiang. Email:
Fluid Dynamics & Materials Processing 2024, 20(8), 1867-1882. https://doi.org/10.32604/fdmp.2024.047427
Received 05 November 2023; Accepted 25 March 2024; Issue published 06 August 2024
 View Full Text
 Download PDF
Abstract
As the velocity of a train increases, the corresponding air pumping power consumption of the brake discs increases proportionally. In the present experimental study, a standard axle-mounted brake disc with circumferential pillars was analyzed using a 1:1 scale model and a test rig in a wind tunnel. In particular, three upstream velocities were selected on the basis of earlier investigations of trains operating at 160, 250, and 400 km/h, respectively. Moreover, 3D steady computational fluid dynamics (CFD) simulations of the flow field were conducted to compare with the wind tunnel test outcomes. The results for a 3-car train at 180 km/h demonstrated: (1) good agreement between the air resistance torques obtained from the wind tunnel tests and the related numerical results, with differences ranging from 0.95% to 5.88%; (2) discrepancies ranging from 3.2 to 3.8 N · m; (3) cooling ribs contributing more than 60% of the air resistance torque; (4) the fast rotation of brake discs causing a significantly different flow field near the bogie area, resulting in 25 times more air pumping power loss than that obtained in the stationary brake-disc case.Keywords
The braking system of a high-speed train plays a pivotal role in ensuring braking efficiency and passenger safety. During the braking process, the brake disc generates a significant amount of heat, leading to elevated temperatures that can impact braking performance and longevity [1,2]. To enhance ventilation and heat dissipation, various cooling rib structures are incorporated within the brake disc to induce a pumping effect on the airflow. The European standard EN14535-3 mandates the specification of aerodynamic loss levels for brake discs to regulate the energy-efficiency design of their cooling structures.
Numerous scholars and engineers have investigated the power loss caused by the wind effect on brake discs through various methods such as numerical simulation, experimental testing, and others. Tirovic [3] conducted the first investigation on several designs of brake disc cooling structures, including radial vane, tangential vane, radial vane/pillared, and solid by Computational Fluid Dynamics (CFD) simulation, then a number of studies have been carried out on this basis [4–6]. Grivc et al. [7] proposed a novel design with hyperbolic cooling ribs and low-profile ribs based on periodic simulation, achieving a 37% reduction in ventilation loss and a 21.5% reduction in mass. Gerlici et al. [8] conducted numerical studies on the air-pumping loss of brake discs with radial vane and tangential vane designs. They found that the tangential vane design exhibits lower loss with good cooling characteristics. Kravchenko et al. [9] developed a test rig to examine the air resistance of brake discs using 1/4 and 1/3 scaled models. Zhou et al. [10] studied the pumping characteristics of wheel-mounted and axle-mounted brake discs of high-speed trains and analyzed the percentage of pumping power consumption during operation. Zuo et al. [11] investigated the air pumping characteristics and power consumption of wheel-mounted and axle-mounted brake discs during operation. Additionally, Zuo et al. [12] conducted a study to investigate the brake disc with a cooling rib structure and analyzed the flow field and pump characteristics of the cooling ribs using CFD. Ji et al. [13] developed a full direct 3D numerical approach based on the sliding mesh technique to simulate the heating and ventilation of a wheel brake system, which can be used as a benchmark test for different optimization approaches for the braking systems on high-speed trains. Besides, there are some simulation studies on brake discs are focused on solid thermomechanical problems [14,15] and many studies investigate the heat transfer performance of brake discs based on CFD [16–19].
However, the study of the brake disc pumping effect still encounters a number of unresolved issues. Firstly, the complex flow mechanism associated with the wind pumping effect of brake discs necessitates more comprehensive numerical simulations coupled with full-scale experimental validation in a wind tunnel. Secondly, previous research on brake discs often overlooked the influence of the real vehicle structures or employed over-simplified train structures, leading to significant deviations between the simulated and actual working conditions. Therefore, this paper aimed to investigate a 1:1 full-scale axle-mounted brake disc installed on a test rig in a wind tunnel with equivalent upstream velocities corresponding to the train bottom. Subsequently, the brake disc CFD simulation using the Moving Reference Frame (MRF) technique and appropriate turbulence models was validated by comparing the air resistance torque obtained from the wind tunnel test. Based on the validated simulation parameters, a 3-car train model equipped with brake discs was simulated at its maximum speed of 180 km/h to determine the air resistance torque and ventilation power loss.
2 Numerical Method and Validation of Wind Tunnel Test
2.1 Governing Equation and Turbulence Model
Considering the operating conditions outlined in this study, with a Mach number around the brake disc below 0.3, it is reasonable to consider the flow as incompressible. The primary emphasis of this paper is on the aerodynamic torque originating from the complex cooling structure within the brake disc. Therefore, it is essential to accurately simulate the internal flow field induced by the cooling ribs structure. In this paper, the realizable k-ε turbulence model was chosen for numerical simulation research [20], and the governing equations are as follows:
where
The turbulent kinetic energy k equation is given by:
and the turbulent dissipation rate ε equation is:
where
2.2 Validation of a Single Rotating Brake Disc in Wind Tunnel Test
In this study, the speed conditions include velocities of 160, 250, and 400 km/h. Based on the previous simulation of a three-car model, the oncoming wind speed at the bottom of the second car was chosen as the upstream wind velocity for the wind tunnel experiment. The corresponding velocity-inlet values for each speed were 10, 30, and 39 m/s, respectively.
A 1:1 scale aerodynamic wind tunnel test of the cooling ribbed axle-mounted brake disc was conducted in the Wind and Sand Tunnel Laboratory at Central South University. The setups of the brake disc test stand and the wind tunnel are shown in Fig. 1. The wind tunnel applied oncoming wind speeds corresponding to the simulated conditions to create the bottom flow field during train operation. The test rig was equipped with a high-precision torque sensor which collected data at a time step of 10 milliseconds, enabling real-time recording of the air resistance torque of the brake disc.
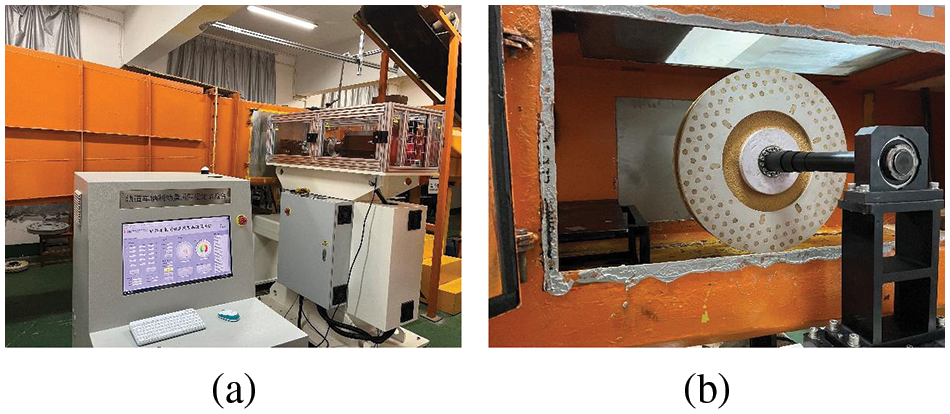
Figure 1: The setup of wind tunnel test: (a) the external view of wind tunnel and aerodynamic torque platform; (b) brake disc in wind tunnel
In the wind test, a light weighted 1:1 brake disc was manufactured by CNC engraving using tough polyurethane material, as the original steel brake disc is heavy. Consequently, the weight of the brake disc wind tunnel model was reduced to 11.2 kg.
To establish a CFD model for the rotating brake disc in the wind tunnel test, the MRF technique was applied to simulate the rotating flow field. A subregion with a diameter of 680 mm and a thickness of 970 mm was excavated in the fluid domain. The test section of the wind tunnel was the velocity inlet, while the end of the diffuser section served as the pressure outlet with a pressure value set to the atmospheric pressure (101.325 kPa). The turbulence intensity was set at 0.5% in the velocity inlet. Refer to Fig. 2 for specific geometries and settings.
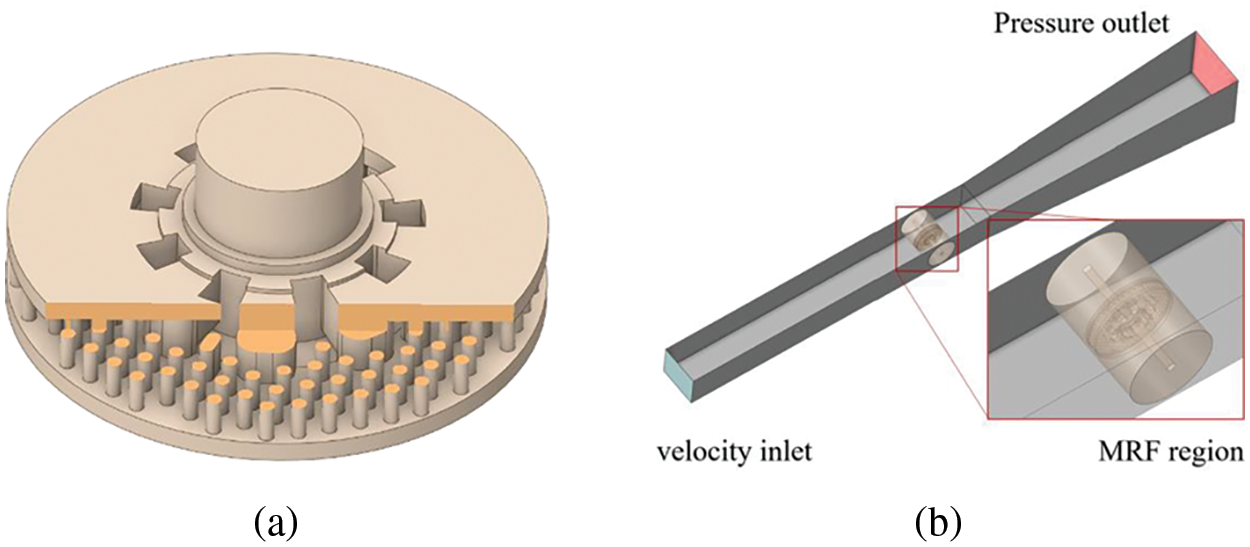
Figure 2: Numerical simulation model of air resistance torque in wind tunnel: (a) the axle-mounted brake disc; (b) the computational domain of wind tunnel test
Due to the intricate cooling ribs in the brake disc, polyhedral grids which can be automatically generated were selected to discretize the fluid domain. The realizable k-ε model was applied for the turbulence flow around brake disc. To ensure accuracy, the boundary layer grid was created with a growth factor of 1.2 and 6 layers. Based on the maximum tangential velocity and the diameter of the cooling ribs as characteristic lengths, the first layer thickness was chosen to achieve a y+ value of 50, which can balance the accuracy and the computational cost. Other regions transition from dense boundary layer grids to sparse grids in the far-field with a growth factor of 1.2. The total number of grids for the axle-mounted brake disc is approximately 5.6 million, as illustrated in Fig. 3.
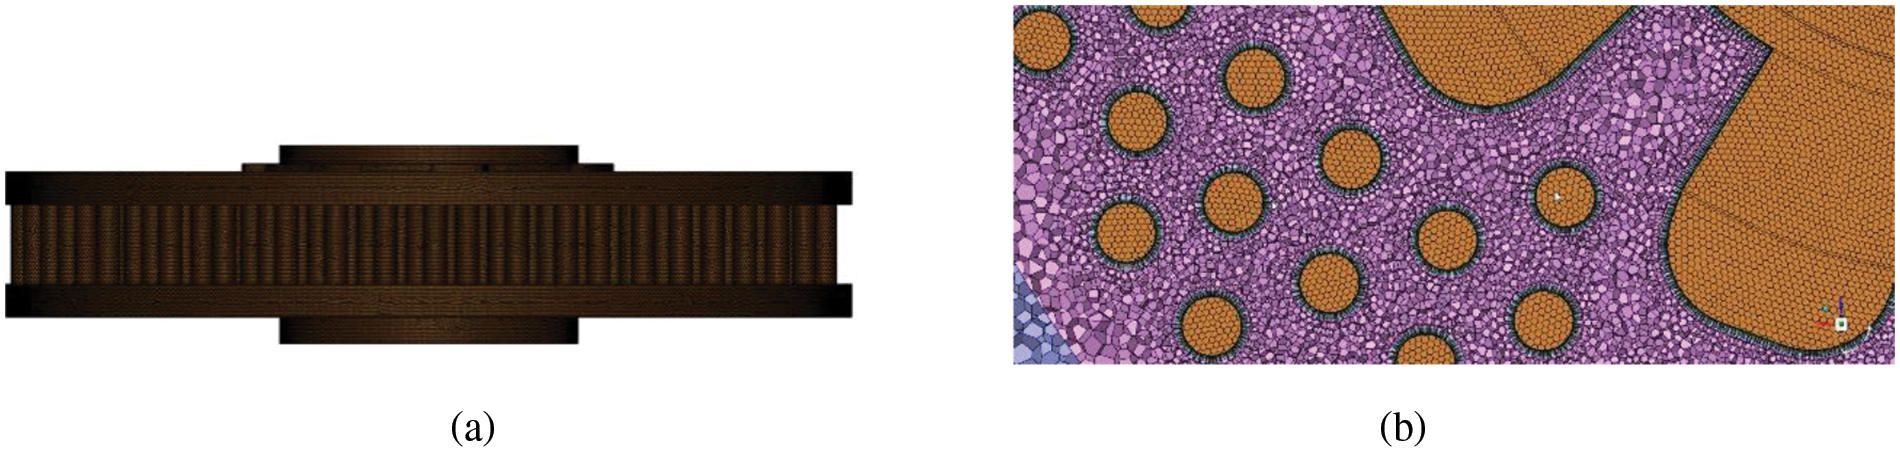
Figure 3: The grid of axle-mounted brake disc: (a) the surface mesh; (b) the volumetric mesh near the cooling ribs
The fluid domain was filled with air characterized by a density of 1.225 kg/m³ and a dynamic viscosity of 1.7894 × 10⁻⁵ kg/(m∙s). The pressure-velocity coupling scheme was SIMPLE. The spatial discretization was specified as follows: the Least Square Cell Based method was used for gradient calculations, PRESTO was employed for pressure, which is particularly suitable for rotating flow fields. The Second Order Upwind scheme was applied for momentum and energy, while the First Order Upwind method was used for turbulent kinetic energy and turbulent dissipation rate.
After the simulation, the experimental results were compared with the simulated results, as shown in Fig. 4. The experimental data was subjected to a moving average with a period of 200. The curve fitting of the aerodynamic torque data followed a quadratic curve, as shown in Fig. 5. Table 1 presents the averaged and smoothed torque data over a 2-s interval under three constant-speed conditions. The results indicate a good agreement between the experimental data and the numerical results, with the maximum error not exceeding 6%.
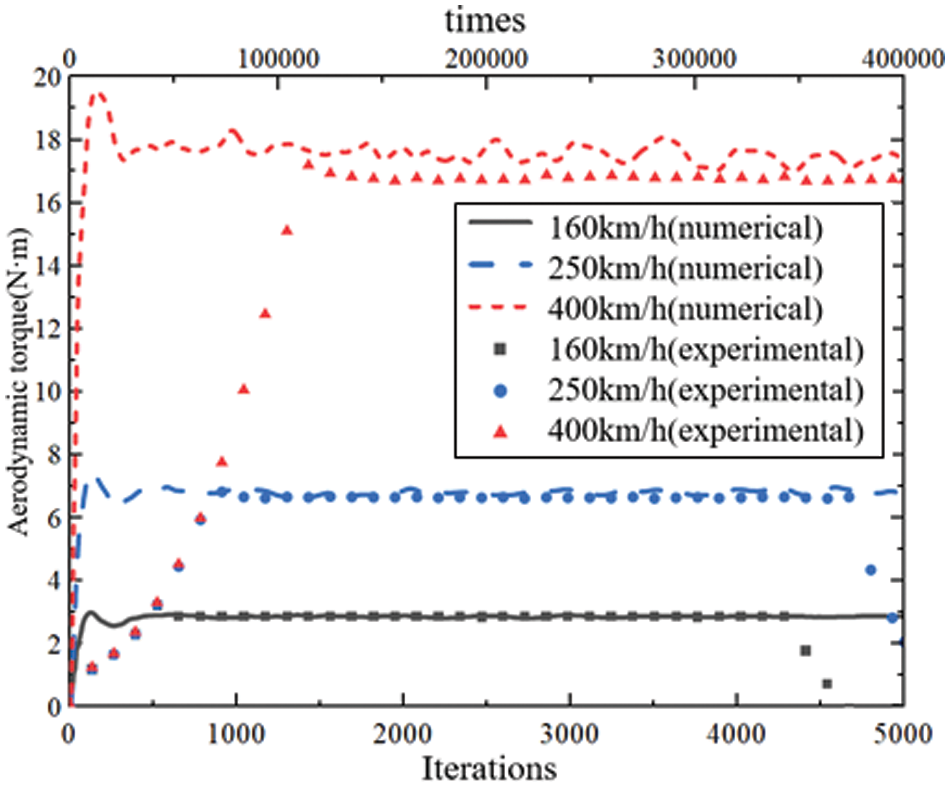
Figure 4: The comparison of aerodynamic torque obtained by wind tunnel test and numerical simulation of brake disc at different speeds
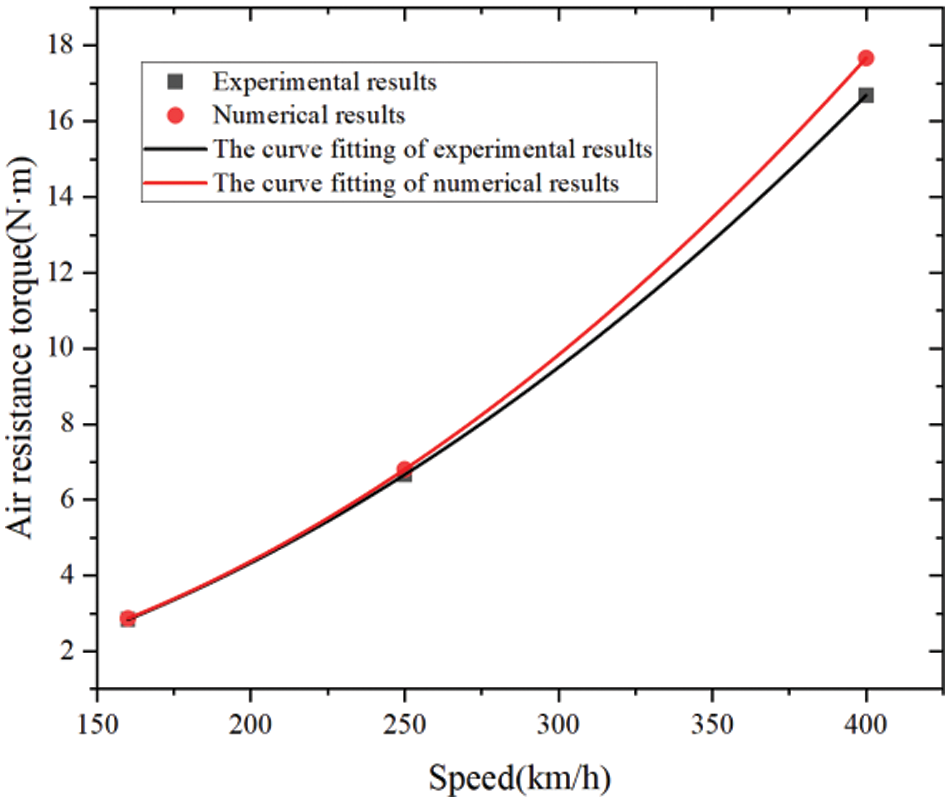
Figure 5: The curve fitting of aerodynamic torque obtained by wind tunnel test and numerical simulation of brake disc at different speeds

3 Numerical Simulation Model for Three-Car Train
The axle-mounted brake disc studied in this paper is widely used, particularly in the CR200J type of train, where all non-powered bogies are equipped with this brake disc. A three-car model of this train was utilized as shown in Fig. 6a. It comprises three main parts: the car bodies, the bogies, and the brake discs. The focus of the study is on the aerodynamic characteristics of the brake discs under the front and middle car. Therefore, the third car was identical to the middle car, and the bogie under its body was not considered. The bogie geometry includes components such as air springs, brake calipers, and gearboxes, so as to preserve its complex shape, as illustrated in Fig. 6b. The overall dimensions of the vehicle were 77.5 m in length, 3.5 m in width, and 4.05 m in height. The diameter of the brake disc was 0.64 m. For ease of later reference, the bogies and brake discs are labeled as shown in Fig. 6c.
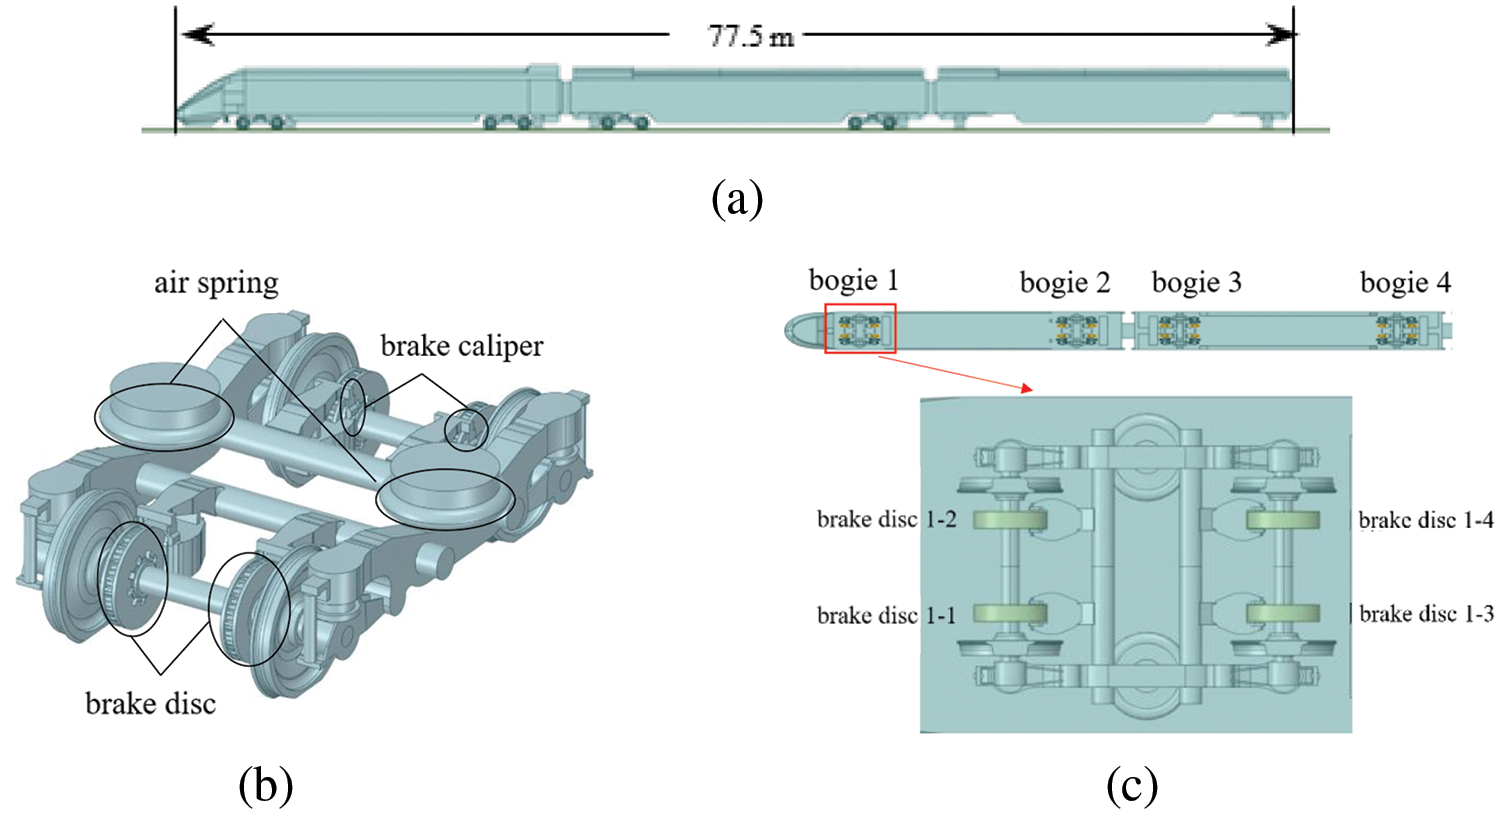
Figure 6: The geometry of trains and brake discs: (a) the three cars; (b) the bogie; (c) the brake disc labeling
3.2 Computational Domain and Boundary Conditions
The overall view of the computational domain for the three-car model is shown in Fig. 7a. The top boundary is positioned 10 h above the ground (where h = 3 m), the left and right sides are 8 h from the track centerline, the velocity inlet is located 10 h from the front car, and the pressure outlet is situated 50 h from the tail car. A close-up view near the bogie is shown in Fig. 7b. In this study, the train’s motion was considered steady-state, with the brake discs rotating uniformly, allowing them to be treated as steady-state components. The regions around the brake discs were set as MRF zones, as indicated by the green portion in Fig. 7b. The center of the MRF region was the geometric center of the brake disc, with the z-axis serving as the rotation axis. The rotational speeds for the three velocity conditions were 96.618, 150.966, and 241.546 rad/s, respectively. To ensure sufficient space for grid generation, the distance between the brake caliper and disc was appropriately increased, and the rotational angular velocity in the inner region was maintained consistent with the brake disc.
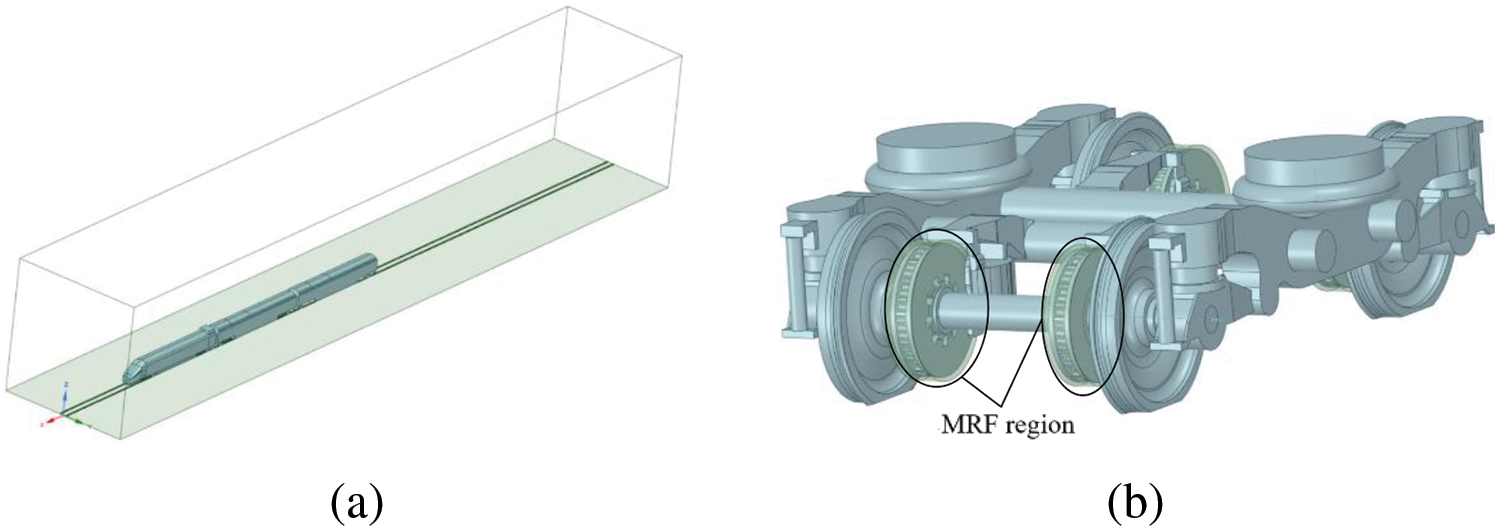
Figure 7: The computational domain of three-car train model: (a) the three cars; (b) the bogie and the MRF region around the brake disc
The boundary conditions for the simulation of the three-car model were set as follows: The front face served as the velocity inlet with a constant value. The turbulence intensity and turbulence viscosity ratio followed the default settings of Fluent. The bottom face used the slip wall boundary condition to simulate the relative motion between the train and the ground. The velocity direction and magnitude were consistent with the velocity inlet. The symmetry condition was set on the side and top faces. The back face was set as the pressure outlet with a constant value corresponding to standard atmospheric pressure. The surfaces of the cars and the bogies were set as no-slip walls. The axle-mounted brake discs and the wheel surfaces were modeled as rotating slip walls, with corresponding angular velocities applied.
Due to the intricate geometry of the bogie region, the polyhedral grids were employed, offering significant advantages in terms of mesh quantity, quality, and efficiency. The MRF areas near the brake discs used the same mesh parameters as described in Section 2.2. The total number of the meshes is approximately 20 million. The thickness of the first boundary layer mesh was controlled to maintain an average y+ value of 200, with some regions possibly having values lower than 200. Each inner region of the brake disc was meshed with approximately 380,000 elements. The mesh used in the three-car model is displayed in Fig. 8, including the overall mid-section mesh, the surface mesh of the bogie, and the sectional mesh where the brake disc is located.

Figure 8: The mesh of three-cars and bogie area: (a) the mesh of three cars in y = 0 cross-section; (b) the surface mesh of bogie in head car; (c) the mesh of brake disc in middle cross-section
Fig. 8a shows the mesh on the Y = 0 section of the train, where the mesh was refined around the train and the ground, gradually increasing in size. Fig. 8b depicts the surface mesh on the first bogie, with mesh refinement in smaller and high-curvature areas to enhance accuracy. Fig. 8c illustrates the mesh on the mid-section of the brake disc of the first bogie.
3.4 Numerical Simulation Setting
For the simulation of the three-car model, the air was configured with the same parameters as the simulation of a single brake disc in the wind tunnel. The realizable k-ε turbulence model was also employed. The solver and settings were also consistent with those used in the simulation of a single brake disc. A total of 15,000 iterations were set while monitoring the variation of the aerodynamic drag force and torque for the entire train and brake discs. Once the monitored quantities exhibited a smooth change, it was considered that the airflow around the train had reached a steady state.
In the full-speed operation of the train, the air-resistance torque is at a relatively high value. In this section, the train running at a constant-speed operation of 180 km/h was considered. Fig. 9 shows the surface pressure distribution of the front and the middle cars. It was revealed that the nose tip and fairing of the front car, being in direct contact with high-speed air, exhibit the maximum pressure. As the air flows around the streamlined front of the train, the pressure values on the middle car are significantly lower than those on the front car.
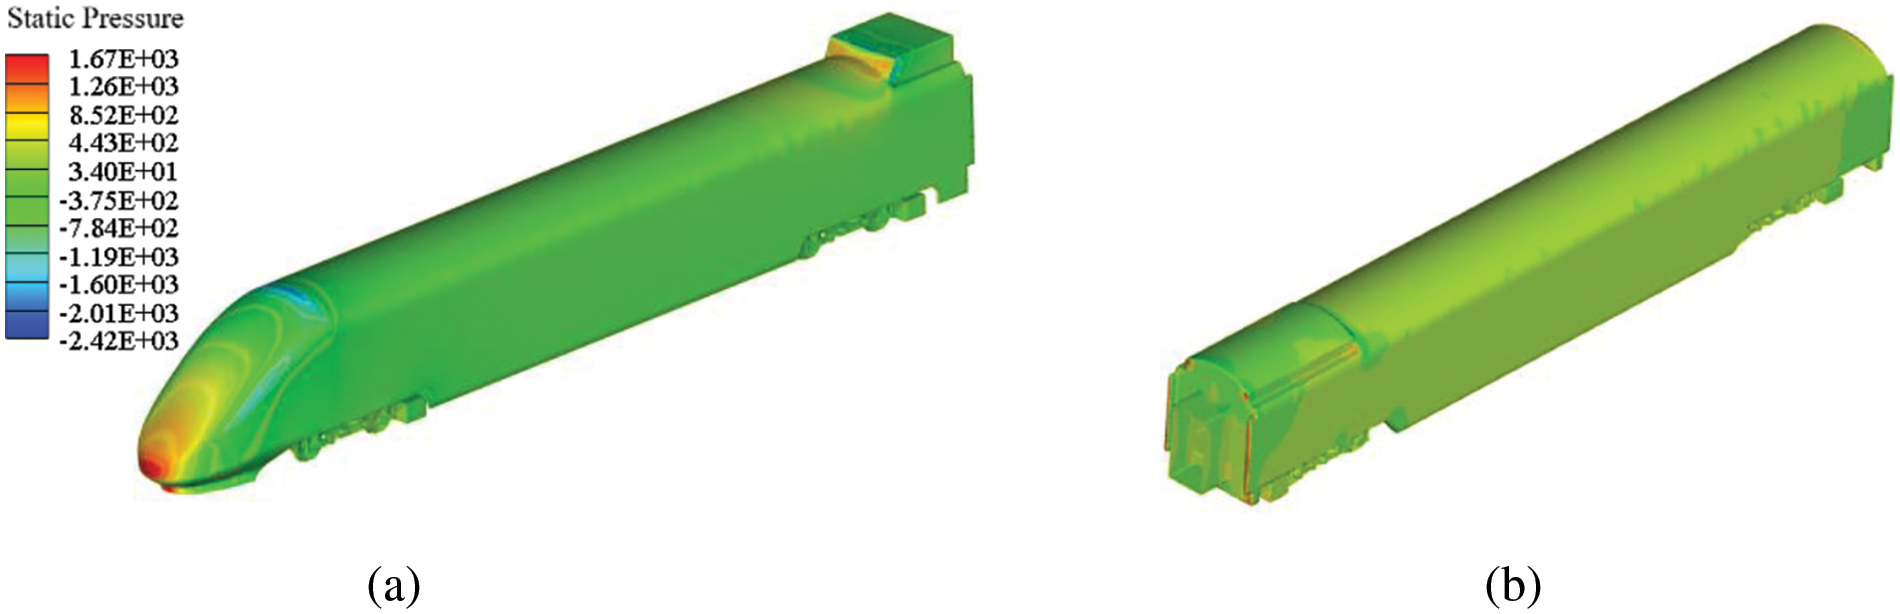
Figure 9: The pressure distribution on trains running at 180 km/h: (a) the head car; (b) the middle car
Figs. 10–13 illustrate the surface pressure distribution of each bogie during the steady-state operation. Bogie 1, located at the front of the head car, experiences higher velocity due to the impact of airflow in this region, resulting in higher pressure compared to the other bogies. A positive pressure zone is observed on the windward side near the ground where the wheels and brake disc are located. Bogies 2 and 4, situated at the rear of the head and middle cars, experience lower air flow velocity, and the pressure difference between the windward and leeward sides is not significant. The box-shaped auxiliary structure in front of bogie 3 obstructs most of the air flow, resulting in a pressure distribution similar to that of the bogies 2 and 4.
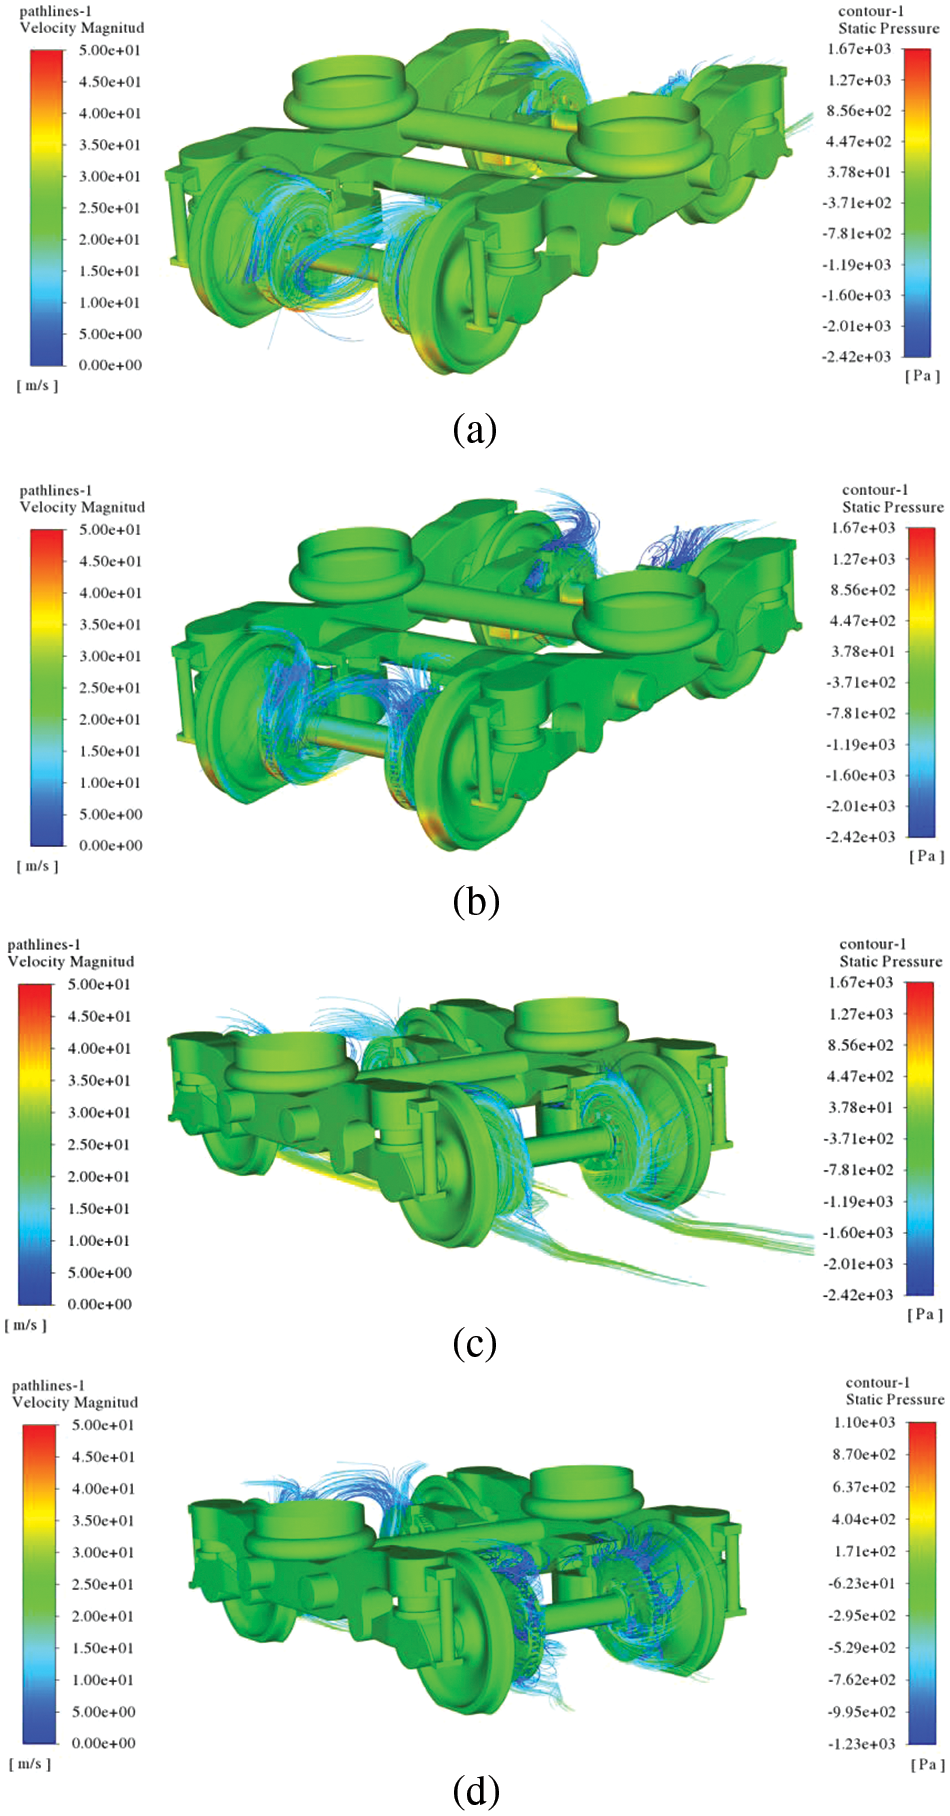
Figure 10: The streamlines around brake discs in bogie 1: (a) the brake disc 1-1 (3.482 N · m) and 1-2 (3.3565 N · m) in rotating condition; (b) the brake disc 1-1 (0.687 N · m) and 1-2 (0.687 N · m) in stationary condition; (c) the brake disc 1-3 (3.767 N · m) and 1-4 (3.800 N · m) in rotating condition; (d) the brake disc 1-3 (0.414 N · m) and 1-4 (0.437 N · m) in stationary condition
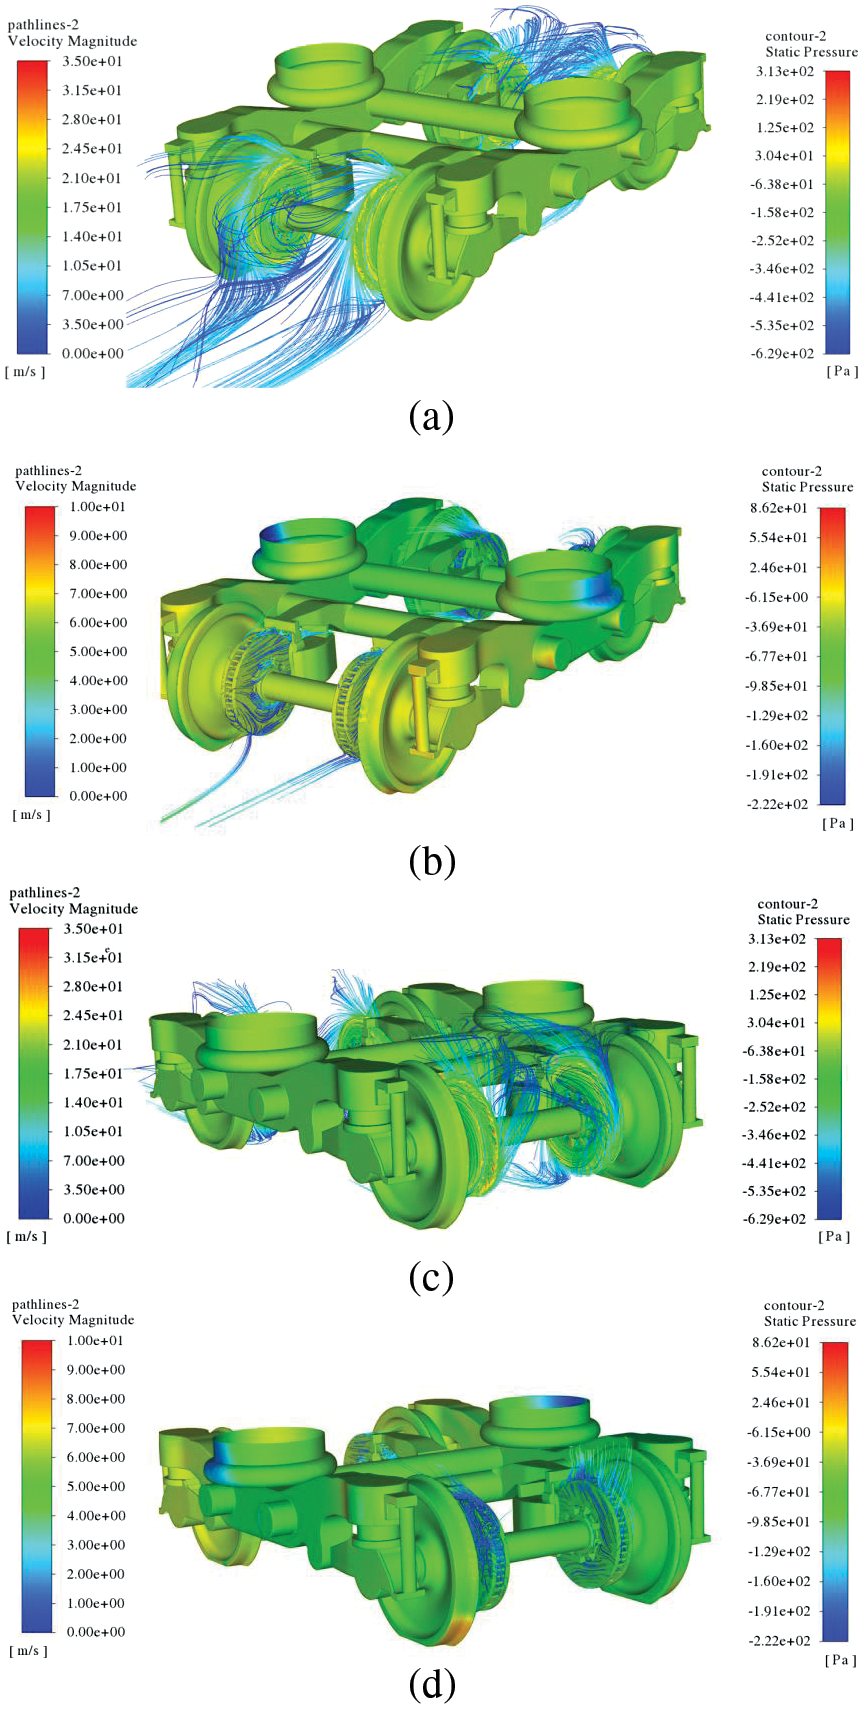
Figure 11: The streamlines of brake disc in bogie 2: (a) the brake disc 2-1 (3.620 N · m) and 2-2 (3.629 N · m) in rotating condition; (b) the brake disc 2-1 (0.015 N · m) and 2-2 (0.014 N · m) in stationary condition; (c) the brake disc 2-3 (3.634 N · m) and 2-4 (3.616 N · m) in rotating condition; (d) the brake disc 2-3 (0.010 N · m) and 2-4 (0.023 N · m) in stationary condition
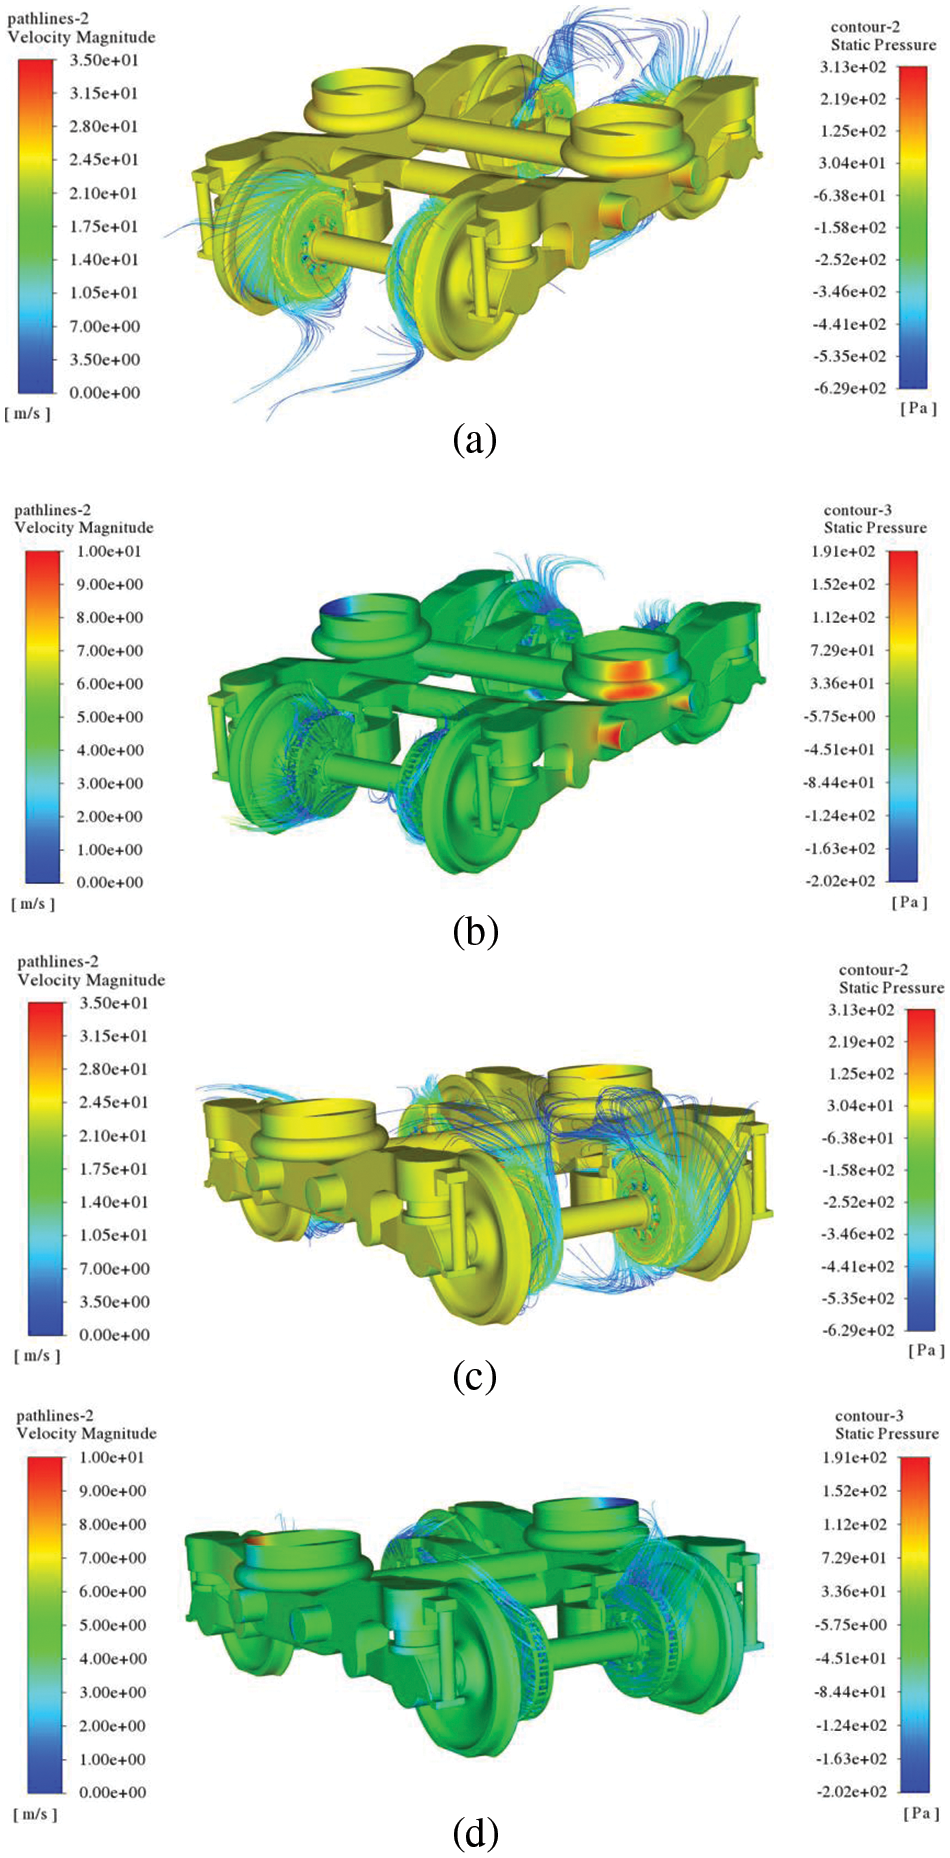
Figure 12: The streamlines of brake disc in bogie 3: (a) the brake disc 3-1 (3.733 N · m) and 3-2 (3.711 N · m) in rotating condition; (b) the brake disc 3-1 (0.016 N · m) and 3-2 (0.003 N · m) in stationary condition; (c) the brake disc 3-3 (3.409 N · m) and 3-4 (3.211 N · m) in rotating condition; (d) the brake disc 3-3 (0.019 N · m) and 3-4 (0.017 N · m) in stationary condition

Figure 13: The streamlines of brake disc in bogie 4: (a) the brake disc 4-1 (3.691 N · m) and 4-2 (3.736 N · m) in rotating condition; (b) the brake disc 4-1 (0.006 N · m) and 4-2 (0.012 N · m) in stationary condition; (c) the brake disc 4-3 (3.753 N · m) and 4-4 (3.749 N · m) in rotating condition; (d) the brake disc 4-3 (0.002 N · m) and 4-4 (0.006 N · m) in stationary condition
To compare and analyze the impact of whether the brake discs are rotating on the underbody bogies and to observe the flow characteristics around the brake discs, the streamlines for the four bogies are shown in Figs. 10 to 13. Upon comparing the results of the flow field with the brake disc rotating and stationary at the same locations on the bogies, it is evident that under the rotating condition, the streamlines exhibit a significant air pumping effect. The region around the bogie demonstrates higher velocity and is more chaotic in the rotating condition compared to the stationary condition.
Analyzing the streamline characteristics in the bogie region, specifically bogie 1 with the rotating brake disc located at the front of the head car, it is observed that the high-speed oncoming flow underside significantly influences the streamlines around the bogie. The windward side of the lower surface exhibits a higher velocity and smooth streamlines as shown in Fig. 10. In contrast, bogies 2, 3, and 4, with the rotating brake disc, experience less influence from the oncoming flow at the bottom, and the rotating condition presents typical air pumping features of brake discs. The streamlines are drawn into the internal cooling ribs through the inlet hole and then expelled from the outer edge. The streamlines in the stationary condition of the brake disc do not show such distinct features.
4.3 Aerodynamic Drag and Torque Analysis
The aerodynamic drag results for the brake discs and the entire train are extracted as shown in Table 2. Compared to the stationary condition, the aerodynamic drag force of the brake discs increased by 1.52%, while the entire train’s aerodynamic drag increased by 4.76% in the rotating condition. As we can see that the rotating brake discs themselves have a minor influence on the aerodynamic drag. However, the air pumping effect of the brake disc has significant influences on the air flow under the train’s body. Therefore, the rotating brake discs can redistribute the air flow in bogie area, leading to an increase in the total aerodynamic drag.

The aerodynamic torque of each brake disc and the percentage of the aerodynamic torque for the brake disc cooling ribs are shown in Figs. 14 and 15, respectively. Generally, there is minimal difference in the aerodynamic torque of the brake discs on each bogie, due to the low oncoming flow position of the head car, which is consistent with the rotation direction of the brake disc. Specifically, brake discs 1-1 and 1-2 exhibit smaller aerodynamic torque compared to 1-3 and 1-4, where the flow velocity is lower. Bogie 2, located at the rear of the head car, experiences a reduced oncoming flow velocity compared to the front, resulting in uniform aerodynamic torque for all four brake discs on bogie 2. Bogie 3 has a box-type auxiliary structure at the front, obstructing most of the upstream flow and generating larger aerodynamic torque for 3-1 and 3-2. Bogie 4 experiences smaller upstream flow velocity at the bottom, resulting in relatively small differences in the aerodynamic torque of its brake discs.
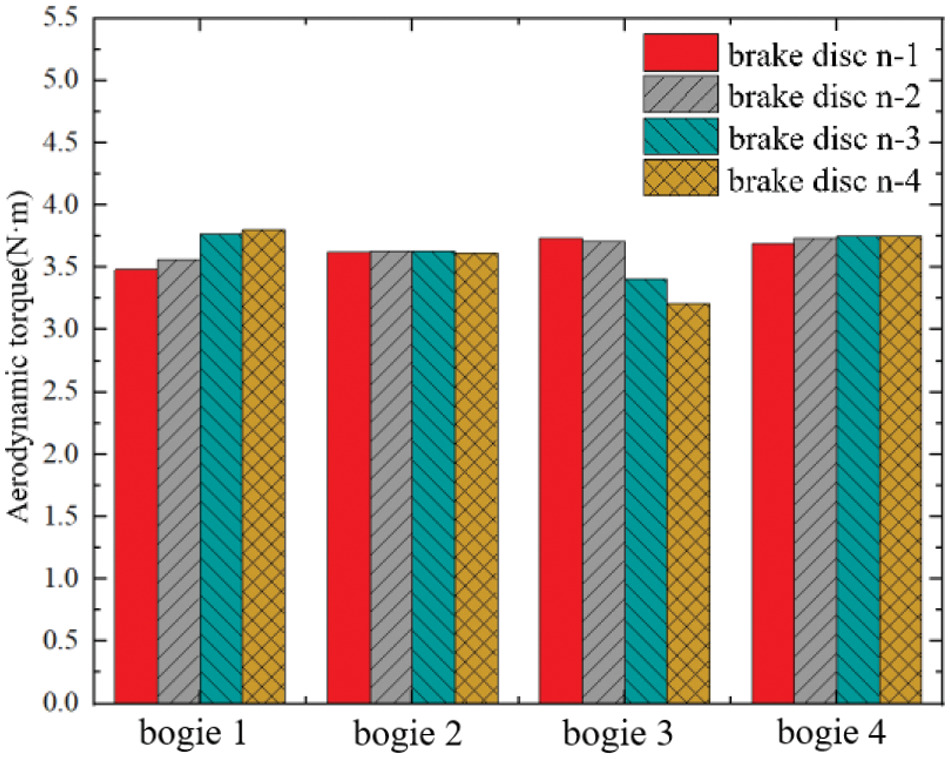
Figure 14: Histogram of air-resistance torque for brake discs

Figure 15: Percentage of air-resistance torque for brake disc cooling ribs
Meanwhile, the air-resistance torque obtained from the single brake disc simulation at 180 km/h is 3.478 N · m. The difference compared to the above realistic condition is relatively small, with a maximum error of less than 8%. This demonstrates that the air pumping effects of rotating brake discs can be approximately obtained by simulating a single brake disc with the corresponding upstream flow velocity. This conclusion is helpful for conserving computational resources in comparing and optimizing brake disc cooling structures.
Additionally, the contribution of the air-resistance torque was analyzed, and the results indicate that the cooling ribs of the brake disc contribute to the majority of the aerodynamic torque, accounting for approximately 60%. Brake discs 1-1 and 1-2 exhibit the highest aerodynamic torque contributions, while 1-3 and 1-4 have the smallest contribution percentages, with the remaining differences being relatively small.
Combining the previously mentioned air-resistance torques for each brake disc, the power losses P generated by the aerodynamic torque caused by the air pumping effects of brake discs are calculated as follows [12]:
where T is the aerodynamic torque of brake disc, v is the velocity of wheel tread (unit: km/h), and Rw is the radius of wheel (unit: m). The above equation can be simplified to:
where ω is the angular velocity of the rotating brake disc (unit: rad/s).
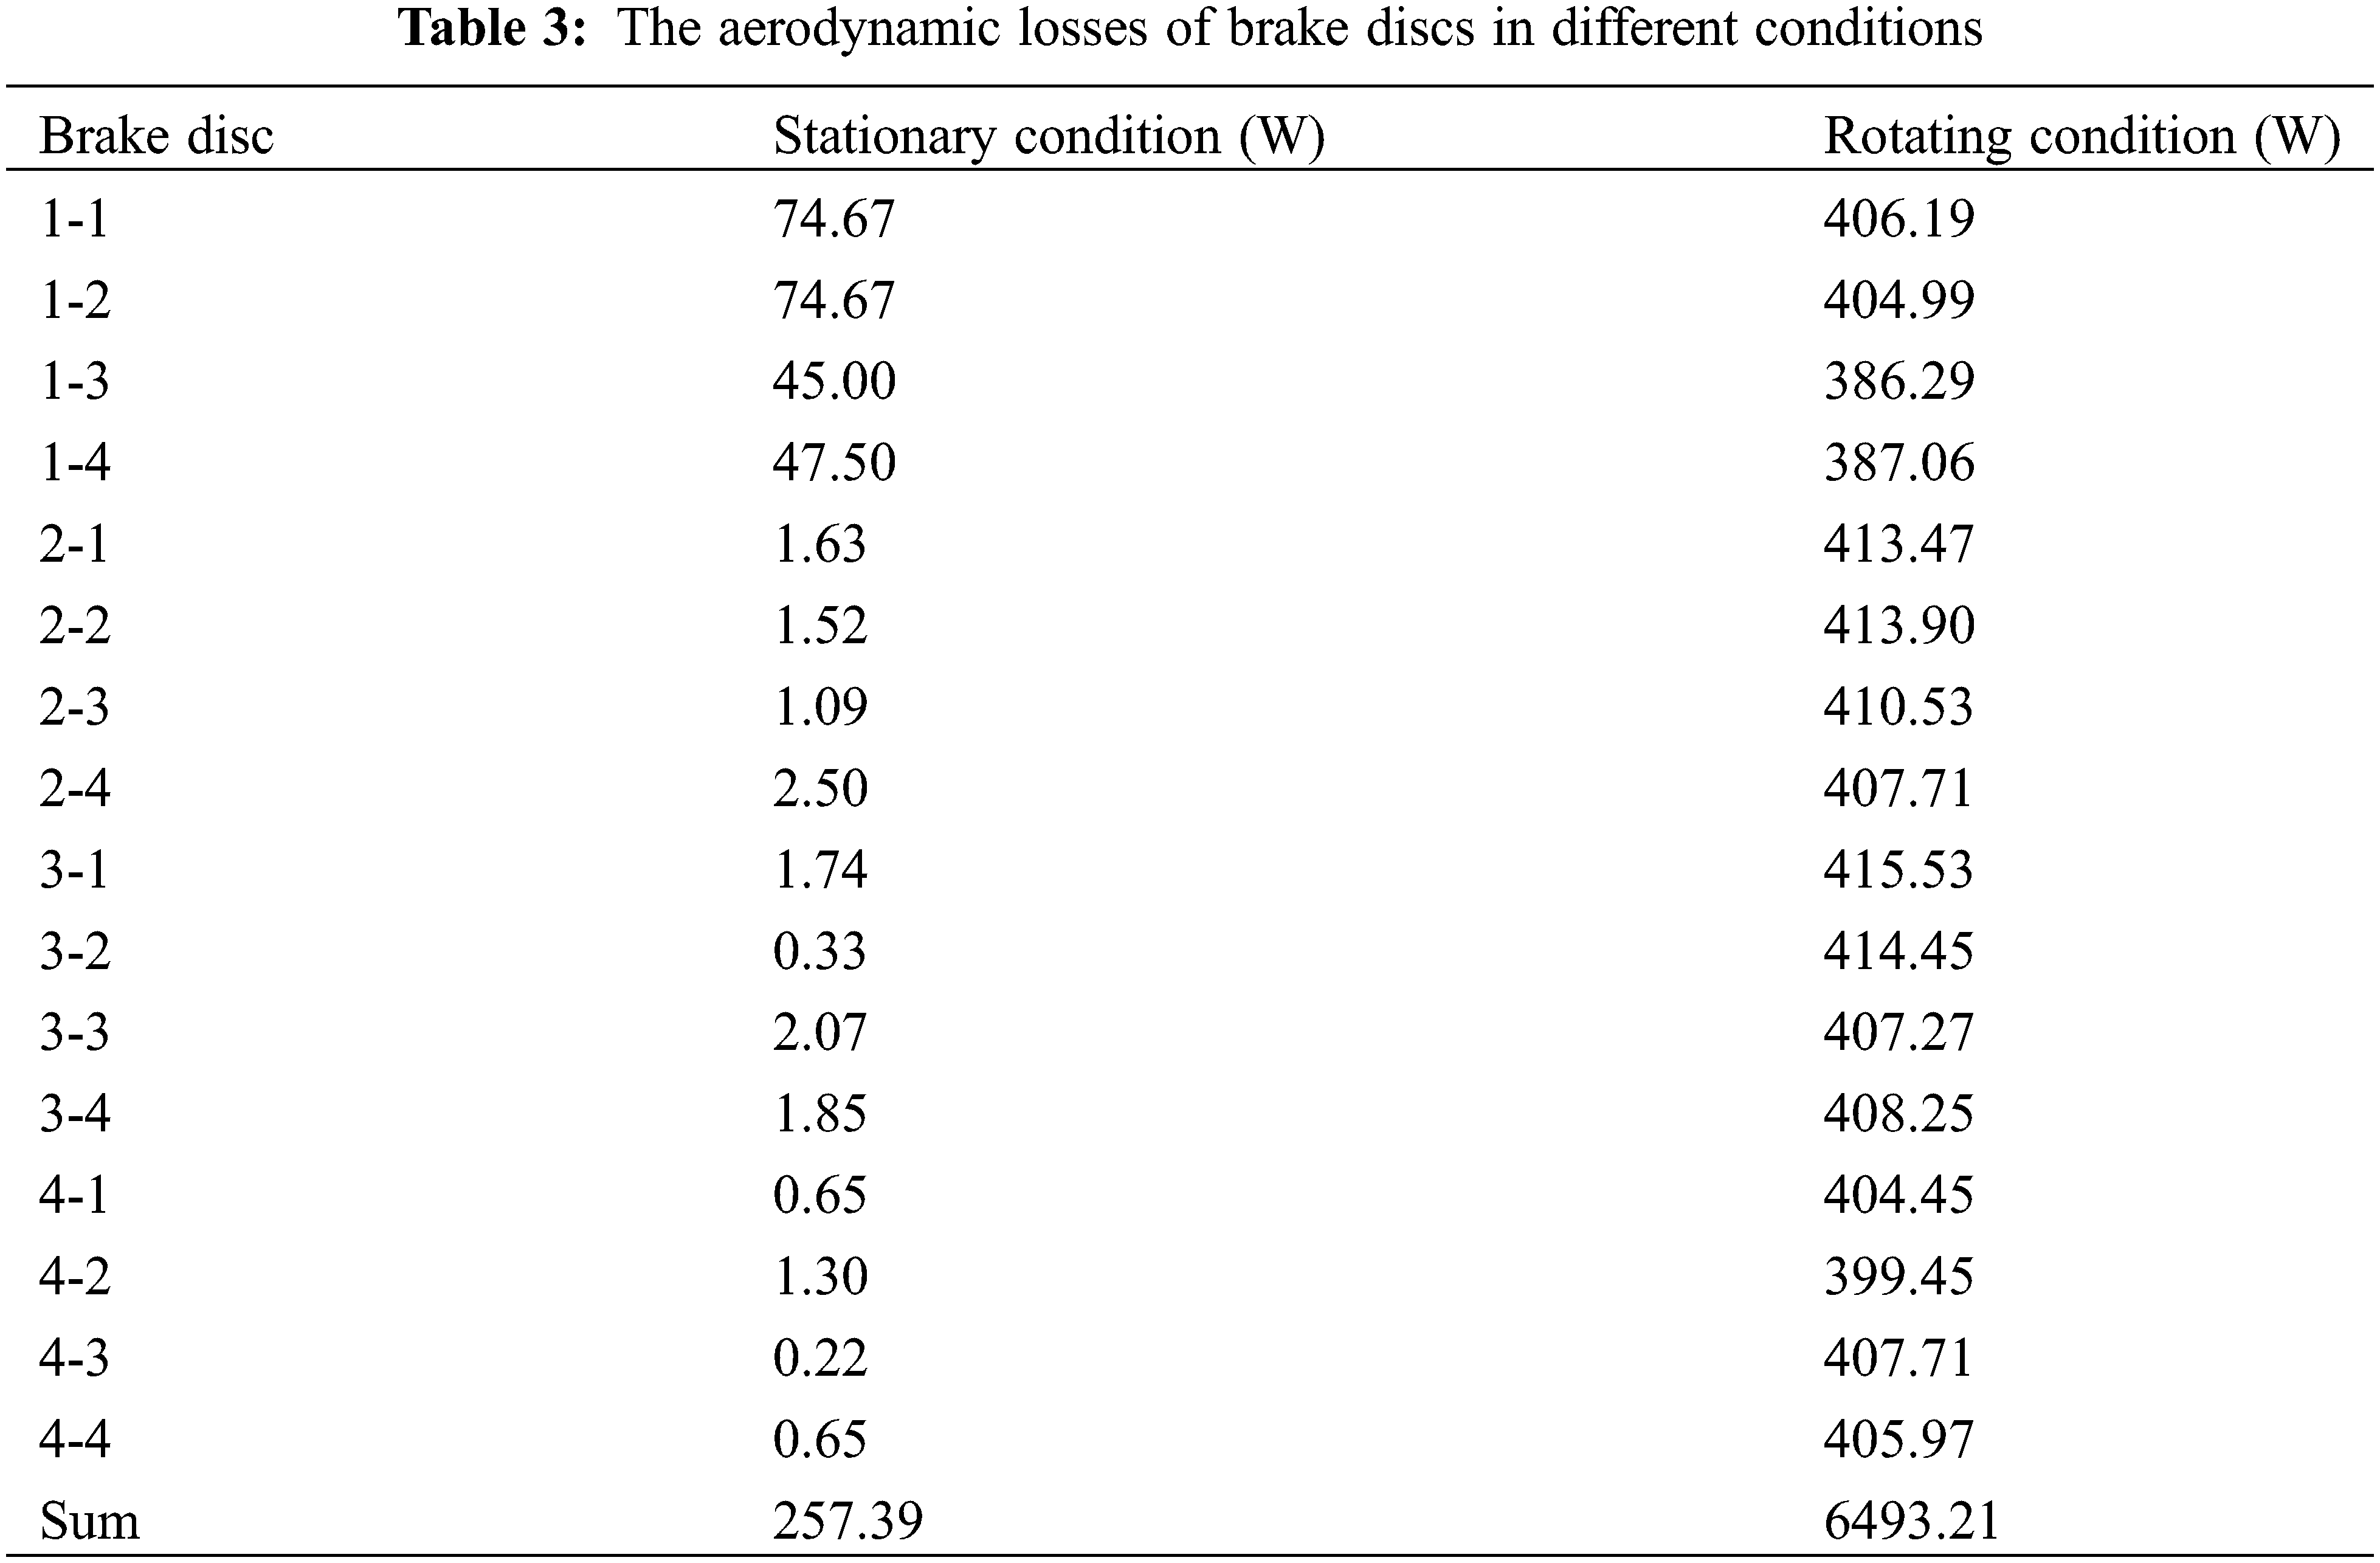
The aerodynamic losses for all brake discs are summarized in Table 3. In the rotating condition, the total power consumption for all brake discs is 6493.21 W, which is significantly higher than the power consumption in the stationary condition. This demonstrates that the air-pumping losses due to the rotation of the brake disc are not negligible.
This study conducted wind tunnel tests on a 1:1 scale axle-mounted brake disc at three speed conditions: 160, 250, and 400 km/h. The results were compared with CFD simulation results obtained with the MRF method. Additionally, a three-car model at a constant speed of 180 km/h was simulated to compare and analyze the aerodynamic drag and torque of each brake disc on the four bogies of the head car and the middle car. The following conclusions were drawn:
1. The air-resistance torque results from the wind tunnel test and numerical simulations using the MRF method showed good consistency, with errors within the range of 0.95% to 5.88%. Therefore, the simulation settings proposed in this paper can accurately obtain the air-resistance torque of a rotating brake disc;
2. The differences in air-resistance torque results for each brake disc on the 3-car train model were relatively small and close to the single brake disc simulation at the same speed. Therefore, engineers can test and optimize the cooling structure of a brake disc on a relatively small-scale simulation of a single rotating brake disc;
3. The aerodynamic torque provided by the cooling ribs accounted for approximately 60% of the overall brake disc, confirming that the air pumping loss of the cooling ribs is the main source;
4. The total aerodynamic drag and power losses for all brake discs in the rotating condition are significantly higher than in the stationary condition. This demonstrates that the aerodynamic performance design of a train should not neglect those rotating brake discs.
In this paper, due to the difficulties in creating the MRF region between brake pads, only the axle-mounted brake discs are studied. In the future, the air pumping of wheel-mounted brake discs will be studied using more sophisticated simulation techniques such as overset mesh.
Acknowledgement: None.
Funding Statement: This work is supported by the National Key Research and Development Program of China (2020YFA0710901), the National Natural Science Foundation of China (12002395) and Natural Science Foundation of Hunan Province (Grant No. 2023JJ30643).
Author Contributions: The authors confirm contribution to the paper as follows: study conception and design: N. Liu, C. Hong, C. Jiang; data collection: C. Hong, C. Jiang; analysis and interpretation of results: B. Wang, Y. Shi, X. Su; draft manuscript preparation: C. Jiang, X. Jin. All authors reviewed the results and approved the final version of the manuscript.
Availability of Data and Materials: The data and materials that support the findings of this study are available on request from the corresponding author.
Conflicts of Interest: The data that support the findings of this study are available on request from the corresponding author.
References
1. Li J, Tao L, Gu JL, Chen C, Chen Y. Review on convective heat transfer in internal channel of ventilated brake disc of vehicle. J Traffic Transp Eng. 2022;2:19–40. [Google Scholar]
2. He G, Pan A, Wang C, Ouyang Z, Xu X, Jiang P, et al. Failure analysis of inner wall of X-10 brake discs for urban rail vehicles. Eng. Fail Anal. 2023 Apr 1;146:107067. [Google Scholar]
3. Tirović M. Energy thrift and improved performance achieved through novel railway brake discs. Appl Energy. 2009 Mar 1;86(3):317–24. [Google Scholar]
4. Tirovic M, Galindo-Lopez CH. Convective heat dissipation from a wheel-hub-mounted railway brake disc. Proc Inst Mech Eng F J Rail Rapid Transit. 2008 Jul 1;222(4):355–65. [Google Scholar]
5. Tirovic M, Stevens K. Heat dissipation from a stationary brake disc, Part 2: CFD modelling and experimental validations. Proc Inst Mech Eng C J Mech Eng Sci. 2018 May;232(10):1898–924. [Google Scholar]
6. Tirovic M, Topouris S, Sherwood G. Experimental investigation of the cooling characteristics of a monobloc cast iron brake disc with fingered hub. Proc Inst Mech Eng D J Automobile Eng. 2020 Jan;234(1):85–97. [Google Scholar]
7. Grivc U, Deržič D, Muhič S. Numerical optimisation and experimental validation of divided rail freight brake disc crown. J Mod Transport. 2019 Mar 1;27(1):1–10. [Google Scholar]
8. Gerlici J, Fomina Y, Kravchenko K. The dependence of the brake disc aerodynamic drag on the rolling stock motion speed. Transp Res Proc. 2021;55:723–30. [Google Scholar]
9. Kravchenko K, Hauser V, Gorbunov M. Estimating the brake disc air resistance by scaled test rig and by computer simulation. Transp Res Proc. 2019;40:737–44. [Google Scholar]
10. Zhou S, Zuo J. Simulation of brake disc resistance torque of high-speed train considering air flow field. J Phys Conf Ser. 2022 Feb;2383(1):012083. [Google Scholar]
11. Zuo J, Luo Z. Air pumping effect analysis for brake disc of high-speed train. J Traffic Transp Eng. 2014;14:34–40. [Google Scholar]
12. Zuo J, Wu M, Luo Z. Simulation on air flow field of high-speed train concerning the environment under train. J Tongji University (Natural Science). 2013;41(11):1717–20. [Google Scholar]
13. Ji P, Wu F, Zhang G, Yin X, Vainchtein D. A novel numerical approach for investigation of the heat transport in a full 3D brake system of high-speed trains. Numer Heat Transf A Appl. 2019 Jun 18;75(12):824–40. [Google Scholar]
14. Belhocine A, Afzal A. Finite element modeling of thermomechanical problems under the vehicle braking process. Multiscale and Multidiscip Model Exp and Des. 2020 Mar;3(1):53–76. [Google Scholar]
15. Grzes P, Kuciej M. Coupled thermomechanical FE model of a railway disc brake for friction material wear calculations. Wear. 2023 Oct 15;530–531:205049. [Google Scholar]
16. Belhocine A, Omar WZW. CFD analysis of the brake disc and the wheel house through air flow: predictions of surface heat transfer coefficients (STHC) during braking operation. J Mech Sci Technol. 2018 Jan;32(1):481–90. [Google Scholar]
17. Bombek G, Hribernik A. Flow behaviour in vented brake discs with straight and airfoil-shaped radial vanes. Proc Inst Mech Eng D J Automobile Engineering. 2023 Dec;237(14):3448–64. [Google Scholar]
18. Galindo-López CH, Tirović M. Maximising heat dissipation from ventilated wheel-hub-mounted railway brake discs. Proc Inst Mech Eng F J Rail Rapid Transit. 2013 May;227(3):269–85. [Google Scholar]
19. Kepekci H, Kosa E, Ezgi C, Cihan A. Three-dimensional CFD modeling of thermal behavior of a disc brake and pad for an automobile. Int J Low Carbon Technol. 2020 Nov;15(4):543–9. [Google Scholar]
20. Voller GP, Tirovic M, Morris R, Gibbens P. Analysis of automotive disc brake cooling characteristics. Proc Inst Mech Eng D J Automobile Eng. 2003 Aug 1;217(8):657–66. [Google Scholar]
Cite This Article
 Copyright © 2024 The Author(s). Published by Tech Science Press.
This work is licensed under a Creative Commons Attribution 4.0 International License , which permits unrestricted use, distribution, and reproduction in any medium, provided the original work is properly cited.
 Downloads
 Citation Tools