
 Submit a Paper
 Propose a Special lssue
 Open Access
ARTICLE

Experimental and Numerical Evaluation of the Cavitation Performances of Self-Excited Oscillating Jets
1 School of the Environment and Safety Engineering, Jiangsu University, Zhenjiang, 212013, China
2 Research Center of Fluid Machinery Engineering and Technology, Jiangsu University, Zhenjiang, 212013, China
3 GongQing Institute of Science and Technology, Jiujiang, 332020, China
4 School of Energy and Power Engineering, Jiangsu University, Zhenjiang, 212013, China
* Corresponding Authors: Wei Xu. Email: ; Xiuli Wang. Email:
Fluid Dynamics & Materials Processing 2024, 20(8), 1883-1901. https://doi.org/10.32604/fdmp.2024.047298
Received 01 November 2023; Accepted 13 March 2024; Issue published 06 August 2024
 View Full Text
 Download PDF
Abstract
Self-excited oscillating jets (SOJ) are used in several practical applications. Their performances are significantly affected by structural parameters and the target distance. In this study, a geometric model of the SOJ nozzle accounting for multiple structural parameters is introduced, then the related cavitation performances and the optimal target distance are investigated using a Large-Eddy Simulation (LES) approach. Results are also provided about an experiment, which was conducted to validate the simulation results. By analyzing the evolution of the vapor volume fraction at the nozzle outlet, a discussion is presented about the effect of the aforementioned structural parameters on the cavitation performances and the target distance. It is shown that the distribution of cavitation clouds at the outlet of the SOJ nozzle displays a non-monotonic trend (first increasing, then decreasing). Under working conditions with an inlet pressure of 4 MPa, a SOJ nozzle outlet/ inlet diameter ratio (D/D) of 1.2, and a chamber diameter ratio (D/L) close to 1.8, the nozzle outlet cavitation performance attains a maximum. The optimal structural parameters correspond to the optimal target distance, which is near 50 mm. The experiments have revealed that the SOJ nozzle with the above parameters displays a good cavitation erosion effect at the target distance of 50 mm, in satisfactory agreement with the numerical simulation results.Keywords
Nomenclature
| SOJ | Self-excited oscillating jets |
| LES | Large eddy simulation |
| WALE | Wall adapting local eddy viscosity model |
| PIV | Particle image velocity |
| D | Diameter of the SOJ nozzle chamber |
| D1 | Diameter of the SOJ nozzle inlet |
| D2 | Diameter of the SOJ nozzle outlet |
| L | Length of the SOJ nozzle chamber |
| Rc | Condensation rate |
| Re | Evaporation rate |
| Α | Rear wall angle of the SOJ nozzle chamber |
| σ | Cavitation number |
Cavitation is a detrimental phenomenon for hydraulic machinery due to the impact of bubble collapse [1,2]. However, the energy released by cavitation collapse has potential value because of the local high temperature, high pressure, and high-speed jets generated during the process. Cavitation has proven to be applicable in various fields, such as cutting [3,4], peening [5], pharmaceutics [6,7], pretreatment and processing of organic wastes [8,9], and fossil fuel exploitation [10,11]. A submerged water jet with cavitation is referred to as a “cavitating jet.” With the continuous development of industry, there are increasing demands for cavitation jet technology, making it essential to find an efficient cavitation jet scheme.
Self-excited oscillation jet (SOJ) is considered one of the most promising technologies, mainly due to the pulse effect and cavitation effect it offers. The pulse effect involves periodic high-speed ejection of fluid at the nozzle outlet, resulting from a specific nozzle structure in a SOJ. This leads to a water hammer effect at the peak of the pulse, which tends to have a more damaging effect than stable jets [12,13]. Research indicates that the peak pressure of SOJ is 2.5 times higher than that of ordinary continuous jets [14]. The cavitation effect primarily refers to the substantial energy released locally during the collapse of cavitation bubbles [15], which can further intensify the damaging performance of water jets [16]. Studies have shown that the incipient cavitation numbers for SOJ can be two to six times higher than with a conventional jet [4], indicating that SOJ jets are more prone to cavitation than conventional jets. In self-excited oscillating jets, as the cavitation number decreases and the outlet jet velocity increases, cavitation erosion undergoes more significant changes. The nozzle structure significantly affects cavitation jet strength, jet width, jet diffusion angle, and bubble distribution generated by the cavitation jet generator, with the nozzle shape dominating all other parameters that may affect cavitation erosion [17,18]. Therefore, studying the geometry of SOJ nozzles is crucial for improving the effectiveness of cavitating jets.
Many scholars have investigated the effects of SOJ nozzle geometry on flow characteristics and cavitation performance, but few have explored the firing distance. Typical geometric parameters of SOJ nozzles include inlet pipe diameter, outlet pipe diameter, chamber diameter, and chamber length. These factors, when the inlet pressure was 3 MPa, are ranked in terms of their effects on nozzle performance as follows: the chamber fillet, outlet pipe diameter, chamber diameter, and chamber length [19]. Li et al. studied the effect of inlet pipe diameter on the oscillation and cavitation erosion performance of SOJ nozzles and found that the inlet pipe diameter significantly impacts the pressure oscillation of SOJ nozzles due to hydroacoustic characteristics [20,21]. Moreover, an increase in the inlet pipe pressure leads to an increase in frequency and a decrease in amplitude [22]. The downstream contraction ratio of the SOJ nozzle can affect the development trends of pressure oscillations and determine the values of the peaks and amplitudes [23]. As the nozzle inlet shrinkage ratio increases, the resonance amplitude and erosion capacity of the SOJ nozzle first increase and then decrease [24]. Additionally, different nozzle internal surface roughness affects the cavitation strength of the SOJ nozzle. An overly smooth surface hinders cavitation bubble formation, weakening cavitation erosion intensity, while an excessively rough surface dissipates energy, leading to jet dispersion and a significant reduction in erosion intensity [25].
Existing research is vital for understanding the impact of nozzle construction parameters on SOJ nozzle exit cavitation performance and pulse frequency. However, cavitation jets may exhibit characteristics such as aggregation and dispersion during the jet process, resulting in varying cavitation intensities at different locations from the nozzle outlet, which can affect the application effectiveness of cavitation jet technology. Thus, it is of great value to further clarify the evolution of bubble clouds and determine the location with the highest cavitation intensity. In this study, the distance from the location with the highest cavitation intensity to the nozzle outlet is defined as the optimal target distance.
With the advancement of computer performance and computational fluid dynamics theory, numerical simulation has become a convenient and efficient tool for studying fluid mechanics, particularly for complex turbulent fluid machinery [26]. Numerical simulation methods have been employed to study complex turbulence in pumps [27] and high-speed underwater cavitation jets [28], and they have been used in numerous studies on the complex flow of SOJ cavitation jets. Zhu et al. used numerical simulation methods to optimize the design of SOJ nozzles and found that the optimal nozzle diameter ratio falls within the range of 1.35 to 1.55 [29]. Subsequently, Zhang et al. employed numerical simulation methods to compare and analyze the velocity and pressure characteristics of SOJ nozzles by varying their geometric parameters. It was discovered that the periodic expansion and contraction of the low-pressure vortex ring in the self-excited oscillation nozzle chamber lead to periodic changes in outlet nozzle pressure. The optimal inlet and outlet diameter ratio for the SOJ nozzle was determined to be 1.2 and was verified through experiments [30]. The inlet and outlet diameter ratio obtained by Zhu et al. closely aligned with the conclusion of Zhang et al., resulting in a diameter ratio of 1.2 being chosen for this study.
Large eddy simulation (LES) has emerged as a new numerical simulation method known for its accuracy, particularly in modeling complex turbulence near walls. It has been proven to provide accurate simulation results in scenarios involving hydrofoil surface cavitation and complex wall turbulence [31,32]. For the SOJ nozzle, Fang et al. compared it to a conical nozzle using LES and found that SOJ nozzles have shorter core lengths and exhibit better clustering, smaller diffusion angles, and improved mixing performance [33]. Nevertheless, further research is needed to determine the core length of the SOJ, as different modulation positions significantly influence the impact performance of pulsed jets [34], and the optimal modulation position can also be referred to as the optimal target distance. The previously mentioned studies have made substantial contributions to understanding the impact performance and influencing factors of SOJ nozzles through numerical simulation and experimentation. However, most numerical simulations have employed the Reynolds-Averaged Navier-Stokes (RANS) method, which may have limitations in accurately capturing near-wall and complex turbulence. For SOJ nozzles, the RANS method may not accurately depict the evolution of cavitation at the nozzle outlet. LES, on the other hand, resolves large-scale turbulence structures and models small-scale turbulence, offering advantages in accurately capturing small vortex structures. Therefore, LES was selected for this study to investigate the variation of cavitation flow field and cavitation intensity of SOJ with position.
Consequently, this study aims to achieve the following objectives: (1) analyze the evolution of the SOJ nozzle outlet flow field using the LES method, (2) investigate the impact of different parameters on the cavitation performance of SOJ nozzles and determine the target distance for achieving the best cavitation effect, and (3) validate the simulation results through visual experiments.
In the vapor/liquid two-phase flow mixture model, it is assumed that the multiphase components share the same velocity and pressure. The governing equations encompass the mass and momentum conservation equations as follows [35,36]:
Here, u represents velocity, p denotes pressure, ql signifies liquid density, qv indicates vapor density, av represents vapor fraction, and al signifies liquid fraction. The subscripts (i, j, k) correspond to the directions of the Cartesian coordinates.
In this study, the LES method was employed. The fundamental principle of LES involves directly calculating large-scale vortices and simulating small vortices using subgrid scale models. The subgrid scale model utilized in this study is the Wall Adapting Local Eddy Viscosity (WALE) model [37,38], which strikes a balance between complexity and universality, making it a more versatile model. This model defines turbulent vortex viscosity as follows:
Here, the filter size ΔS is computed using the equation ΔS = CwV1/3 with the typical value of Cw being 0.325. The strain rate tensor is defined as:
Different cavitation models can impact the accuracy of predicting cavitation occurrence. The Zwart-Gerber-Belamri model is a cavitation model known for its high convergence and accuracy [39]. Key parameters in this cavitation model include vapor volume fraction, evaporation coefficient, and condensation coefficient. The interphase mass conversion rate per unit volume is calculated based on bubble number density, taking into account the influence of gas nucleus density in water on evaporation. The evaporation rate Re and condensation rate Rc in this model are expressed as follows:
In Eqs. (3) and (4), αv represents the volume fraction of the gas phase, ρv stands for vapor phase density, ρl signifies liquid phase density, αnuc indicates the density of gas nuclei in water, Fvap is the evaporation coefficient, Fcond represents the condensation coefficient, and RB denotes the bubble radius.
During numerical simulations, the following parameter values were utilized: the density of pure water was set at 998.2 kg/m3, the density of water vapor was 0.5542 kg/m3, the saturated vapor pressure of water was 3540 Pa, the cavitation bubble diameter was 1 × 10⁻⁶ m, the evaporation coefficient was 50, and the condensation coefficient was 0.01.
The geometric parameters of the SOJ nozzle include inlet pipe diameter, outlet pipe diameter, chamber diameter, and chamber length. Definitions of each geometric parameter are illustrated in Fig. 1.
Figure 1: Definition of parameters of self-excited oscillating nozzle
In Fig. 1, D1 represents the diameter of the nozzle inlet, D2 signifies the diameter of the outlet, L stands for the length of the chamber, D denotes the diameter of the chamber, and the collision angle α of the rear wall of the chamber is 120°.
The primary factors influencing the performance of SOJ nozzles include the ratio of the inlet and outlet pipe diameters (D2/D1), the chamber diameter D, and the chamber length L. Previous studies [29,30] have shown that when D2/D1 is close to 1.2, the chamber length L is 5–8 times longer than D1, and the chamber diameter D is 4–6 times longer than D1, the nozzle exhibits superior cavitation performance. Accordingly, a range of values was selected for each parameter, as presented in Table 1. The inlet diameter was determined to be 3.0 mm.
Based on the parameter range specified in Table 1, the study considered parameters such as the inlet and outlet pipe diameter ratio (D2/D1) ranging from 1 to 1.3, the chamber length ratio (L/D1) ranging from 3.5, and the chamber diameter ratio (D/L) ranging from 1.7 to 2.4 in the parameter configuration process. As a result, ten cases were designed, as outlined in Table 2, to investigate the impact of D2, L, and D parameters on SOJ nozzles.
With the ten groups of cases detailed in Table 2, geometric modeling was established for each, as shown in Fig. 2. The computational domain encompassed the self-oscillating nozzle and the submerged area, with the lengths of the upstream and downstream straight pipes matching the nozzle entity used in subsequent experiments. The lengths were set to be five times greater than the diameter of the inlet and outlet to ensure full development of the flow field.
Figure 2: Geometric model and grids
For the geometric model depicted in Fig. 2 (right), ICEM was employed to create the structured mesh, utilizing the O-block mesh for the inner area. The grid configuration inside the computational domain is presented in Fig. 2 (left). The minimum mesh thickness near the wall was set to 1 micron, with a height growth rate of 1.2, ensuring an appropriate dimensionless wall distance (Y-plus). To meet LES grid requirements, the core area grids and wall boundary layer were refined, maintaining smooth transitions between adjacent grids.
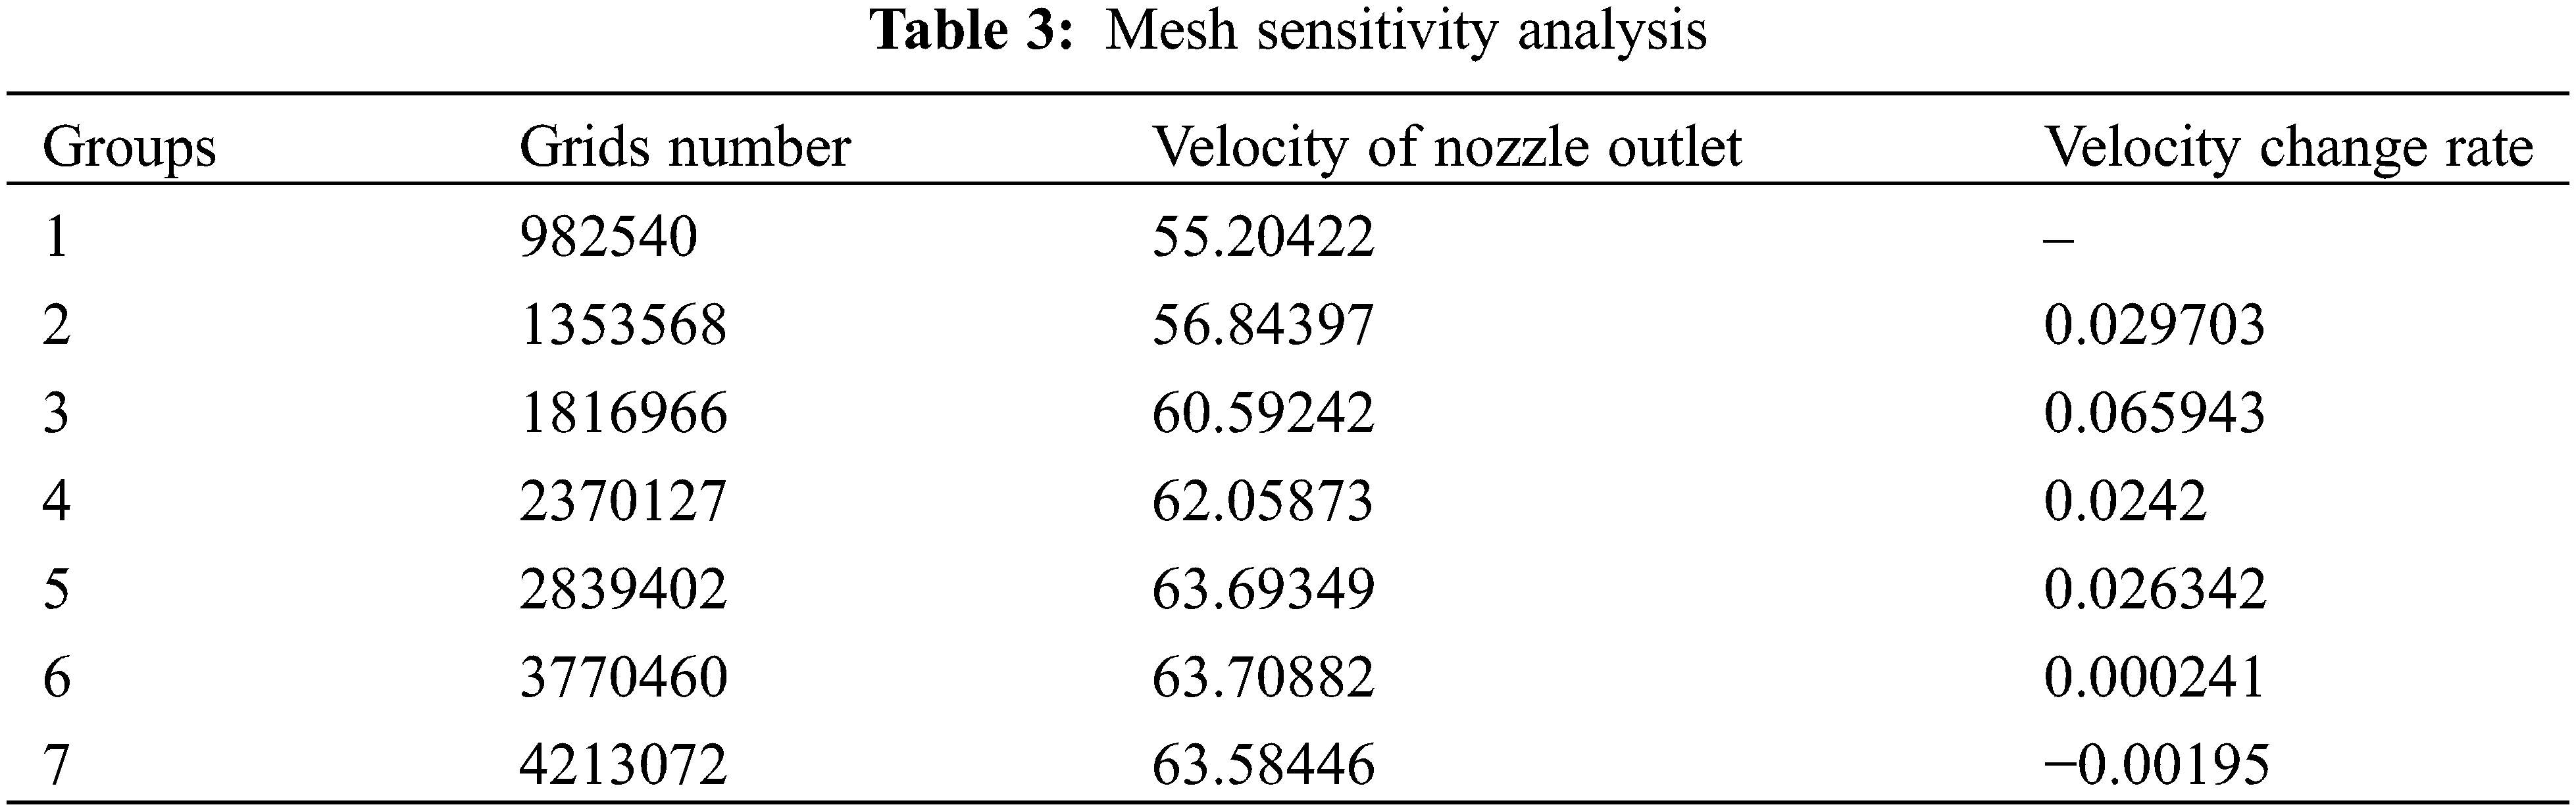
Grid independence was verified before simulation, employing seven groups of grids with varying numbers, as detailed in Table 3. In ICEM, the quality of each grid group exceeded 0.5, with grid numbers in one group increased by 25% relative to the others until the average flow velocity at the nozzle outlet in the steady-state simulation stabilized. Ultimately, the number of grid nodes was fixed at 3,770,460.
Appropriate grid conditions were established to ensure the accuracy of simulated data. The quality of the first-layer grid was reflected through the dimensionless parameter Y-plus. The distribution of Y-plus values on the wall surface during the simulation is illustrated in Fig. 3. All Y-plus values were less than 1 on the outer wall of the self-oscillating chamber, with slightly larger values at the nozzle inlet, but none exceeding 5.
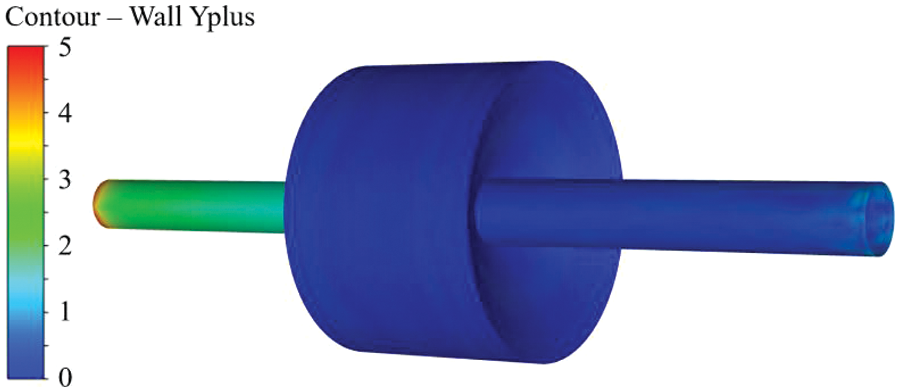
Figure 3: The contours of wall Y-plus
FLUENT was employed for numerical simulation, utilizing a finite volume approach based on the SIMPLEC (Semi-Implicit Method for Pressure Linked Equations Consistent) methodology [40,41]. The equations were discretized using a second-order upwind differencing approach. Convergence conditions for the governing equations were met when the total of the residuals fell below 10−5.
The entire water calculation domain featured a connection between a self-oscillating nozzle and a submerged jet flow field. The model incorporated a high-pressure inlet boundary condition and a low-pressure inlet for atmospheric pressure to replicate an underwater environment, along with an outlet boundary condition. The entire fluid domain was divided into two parts for structural grid construction, both interconnected with an INTERFACE boundary.
During numerical simulation, the selected solution type was transient simulation based on pressure. The time step was set at 1 × 10⁻⁶ s, with a total computation time of 1 s. In the multiphase flow model, the Mixture model was utilized, defining the mixed phase as pure water and water vapor. The density and viscosity of pure water were specified as 998.2 kg/m3 and 1.003 × 10⁻³ kg/(m·s), respectively, while the density and viscosity of vapor were set to 0.5542 kg/m3 and 1.34 × 10⁻⁵ kg/(m·s), respectively. The multiphase flow mass transfer mechanism chosen was cavitation, employing the Zwart-Gerber-Belamri model for cavitation modeling. The saturated vapor pressure of water was 3540 Pa, the cavitation bubble diameter was 1 × 10⁻⁶ m, the evaporation coefficient was 50, and the condensation coefficient was 0.01. As for boundary conditions, a high-pressure inlet boundary condition was applied, setting the inlet pressure at 4 MPa. The outlet boundary was designated as the water tank outlet with an atmospheric pressure value, resulting in a relative pressure of 0 Pa.
To validate the flow state and jet erosion effect of the self-oscillating nozzle outlet, as well as the reliability of the numerical simulation results, tests were conducted. A schematic diagram of the test device for assessing the jet erosion effect of the self-oscillating nozzle is presented in Fig. 4.
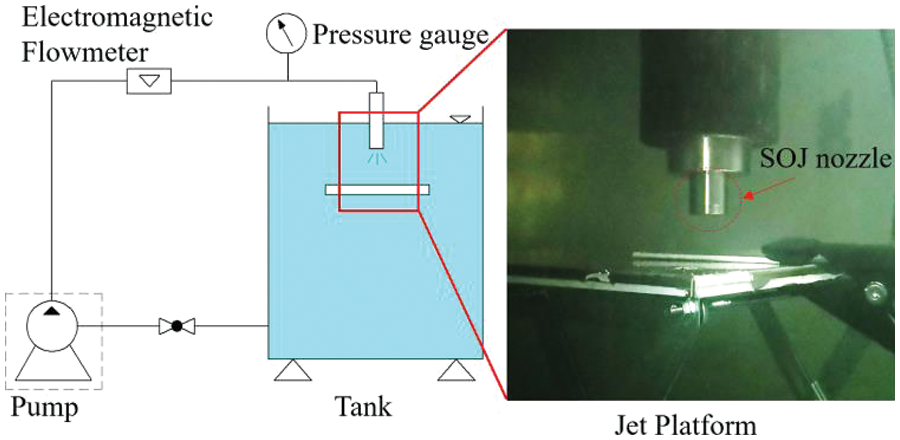
Figure 4: Jet test platform
The experimental setup utilized a jet test bench located in the laboratory of the National Pump Engineering Center at Jiangsu University. High-pressure water was supplied by a high-pressure plunger pump, with a maximum pressure of 5 MPa and a maximum flow rate of 50 L/min. The test pressure could be adjusted via the overflow valve, but the precise specific flow rate was uncertain due to the presence of the overflow valve. Additionally, a flow meter was installed upstream of the nozzle, and a pressure gauge displayed the pipeline pressure during experiments. The stage’s height could be adjusted using a nut, submerging the entire nozzle stage in water. The impact distance was controlled by altering the distance between the stage and the nozzle. An aluminum plate 1060 (Chinese national standard GB/T 3880-2006, aluminum content 99.6%) served as the impact sample and was affixed to the stage facing the nozzle outlet. The nozzle diameter ratio of 1.2 (D2/D1 = 1.2) was found to yield the best jet erosion effect, based on simulation results. The chamber length L and chamber diameter D had significant effects on the optimal impact distance of the outlet jets, and the optimal simulation result was selected for testing. Fig. 5 provides an illustration of the test nozzles’ structure and parameters.
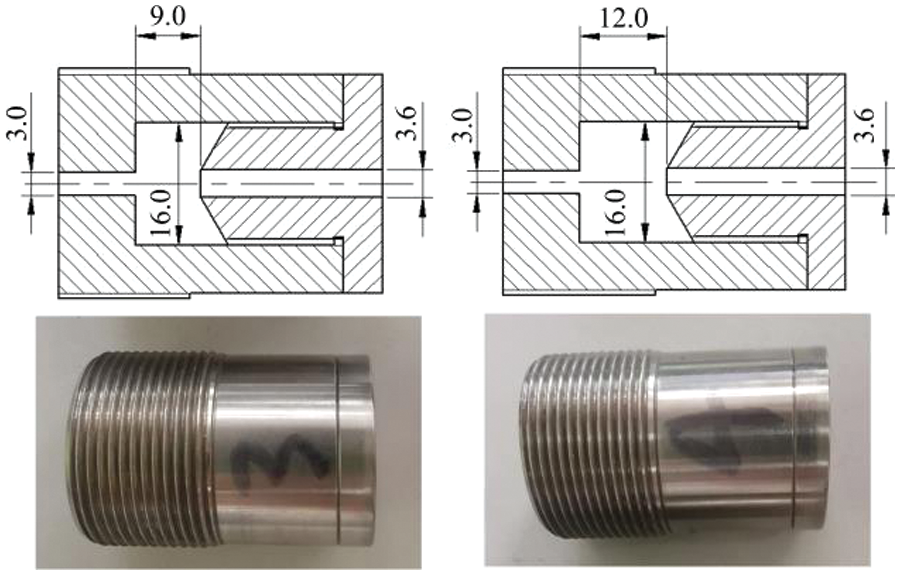
Figure 5: Test nozzles and structural parameters (Unit is mm)
The test nozzles were manufactured using a computer numerical control machine tool, with errors not exceeding 10 μm. The two parts were connected with screw threads, and the potential water leakage caused by thread clearance was essentially negligible.
Following the tests, a scanner was employed to scan the surface erosion conditions of the aluminum plate to eliminate color bias. Cavitation performance was then evaluated by comparing the erosion degree of test nozzles 3 and 4, corresponding to Nos. 5 and 6 in Table 2, respectively.
Given the dynamic nature of the SOJ nozzle’s flow state, the unsteady flow field offered insights into flow characteristics over an oscillation cycle. The range of the optimal target distance was determined by analyzing the variation in average vapor volume fraction.
Characteristics are crucial for studying the evolution of cavitation jets. The flow field of one cycle of No. 5 nozzle is shown in Fig. 6, with the vapor volume fraction of the ISO-surface set at 0.1.
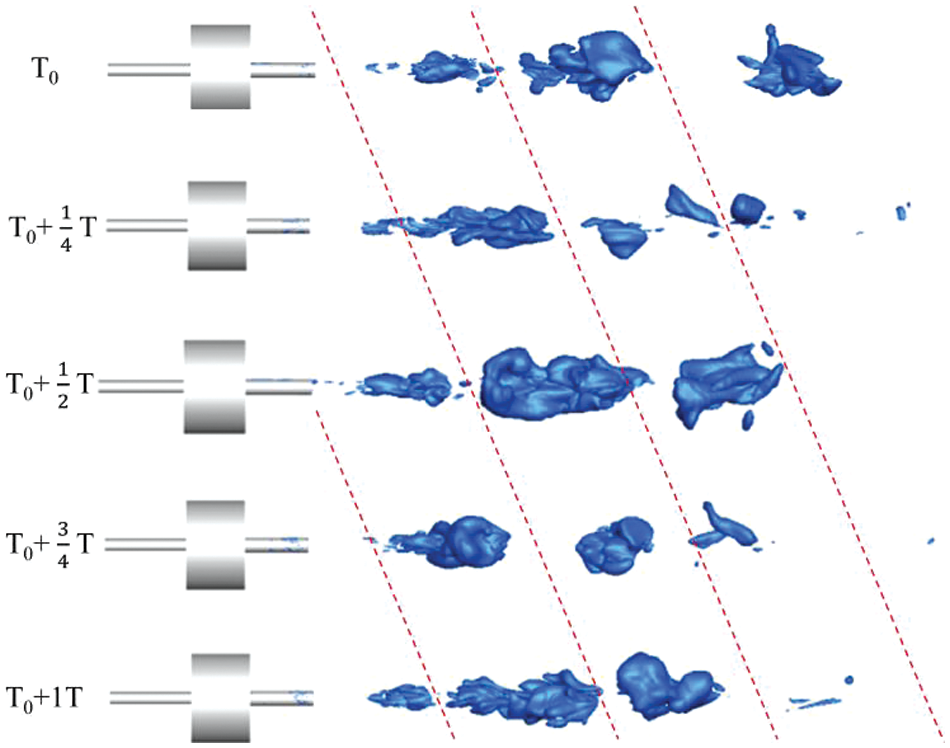
Figure 6: Cavitation clouds in one cycle
Due to the presence of an oscillating chamber in the self-oscillating nozzle, periodic pulse pressure was generated when high-speed fluid entered the inlet. Pulse flow occurred as the fluid reached the outlet, with the pulse’s intensity directly influencing the peak impact strength of the jets. Furthermore, upon leaving the nozzle, the high-velocity jet encountered the immersion fluid, leading to cavitation due to shear forces caused by velocity differences. Under submerged conditions, the collision of the pulsed jet with static liquid in the water tank reduced the effective impact distance of the jets. As the distance increased, the pulsed fluid gradually fragmented and dispersed. These flow processes align with findings from the particle image velocity method and visualization experiments by Zhou et al. [42] and the numerical simulation results presented in this study.
Analyzing the transient flow field revealed that cavitation clouds at the nozzle outlet resembled a pulse, with the volume of cavitation clouds initially increasing and then decreasing. During this change, a position emerged where the cavitation group exhibited its maximum volume and intensity, corresponding to the previously mentioned optimal target distance.
Coherent structures play a pivotal role in turbulent flow analysis. Various analysis methods exist, including the Q criterion, λ2 criterion, Δ criterion, Ω methods, among others [43]. Among these, the Q criterion is commonly used and defined as:
Here,
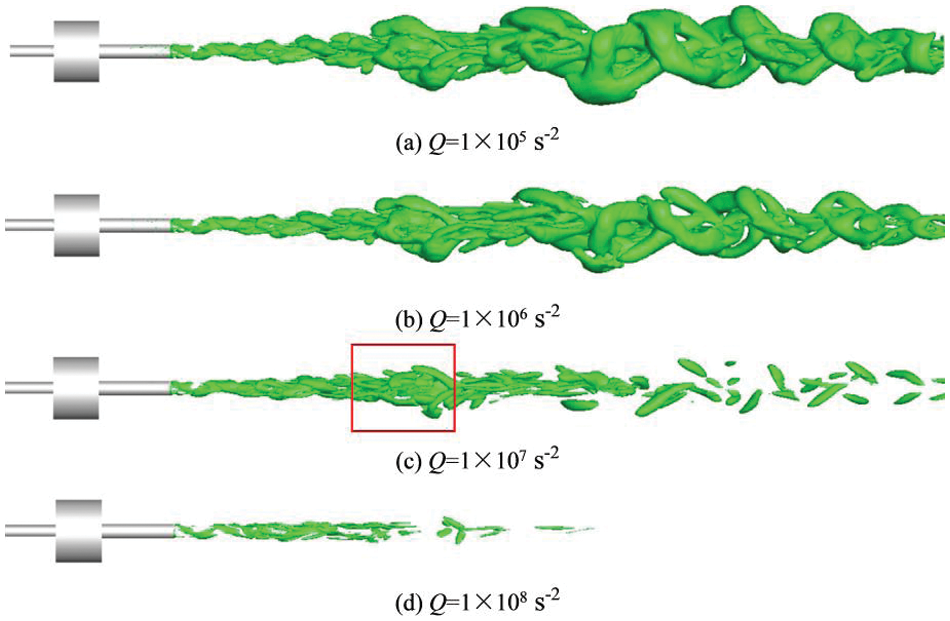
Figure 7: Coherent structure of different Q-criterion number
Coherent structure analysis revealed the pulsed jet state of the self-oscillating nozzle. In Fig. 7, the distribution and development of vorticity at the nozzle outlet were readily observable, with smaller Q numbers indicating more substantial vorticity. Notably, when Q = 1 × 10⁷ s−2, as shown in Fig. 7c, it distinctly depicted the growth, development, separation, and dispersion of the outlet pulsed jets, a phenomenon consistent with Fang et al.’s study [33]. Furthermore, it was evident that vorticity decreased beyond the nozzle outlet in Fig. 7. The position where vorticity reached its maximum corresponded to the optimal shooting distance of the pulsed jets, highlighted in the red box in Fig. 7c.
To investigate cavitation at various distances from the nozzle outlet, multiple monitoring interfaces were established at the nozzle outlet during the simulation. These interfaces assessed cavitation’s extent by monitoring the average vapor volume fraction on each interface. Consequently, 20 monitoring surfaces were positioned consecutively at the outlet, spaced at 0.005 m intervals. Fig. 8 provides a schematic representation of the monitoring surface arrangement within the ISO-surface figure, where the vapor volume fraction is 0.1.
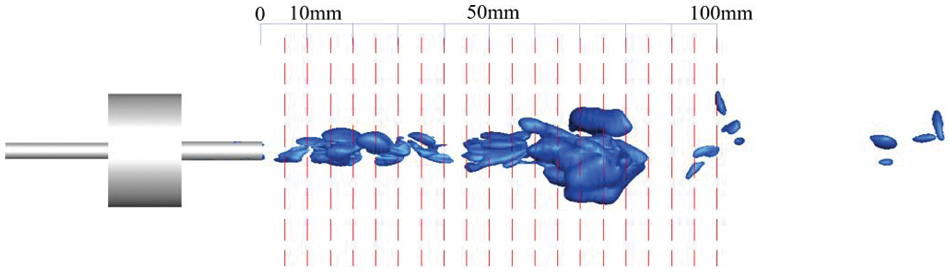
Figure 8: The position of the detection surface
Throughout the simulation, when the flow field reached a steady state, continuous monitoring of time-varying data was conducted at 0.01 s intervals, capturing mean vapor volume fraction, mean pressure, and mean velocity for each monitoring surface. The average of 1000 data points for each monitoring surface over 0.01 s represented the distribution of the average state across different distances during that period. Fig. 9 shows the distribution of average vapor volume fraction, pressure, and velocity over a distance of 100 mm from the nozzle outlet for two sets of parameters, Nos. 5 and 13 nozzles, which yielded optimal results during simulation.
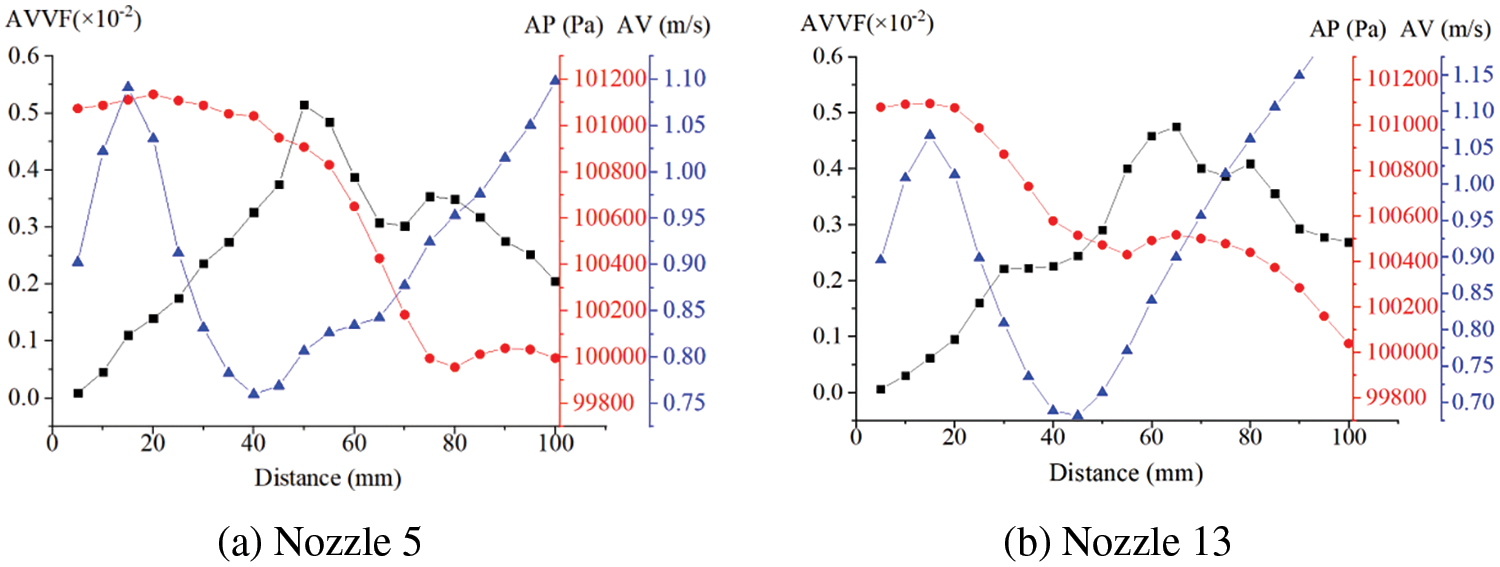
Figure 9: Curves of the average flow field of the two nozzles
Fig. 9 distinctly shows a peak in the average vapor volume fraction curve occurring between 40 and 70 mm, representing the location with the highest average vapor content. The cavitation number of the flow is defined as:
Here,
3.2 Influence of Different Geometric Parameters
3.2.1 Influence of Outlet Pipe Diameter
To assess the impact of different outlet pipe diameters on the target distance of the SOJ nozzle, the control variables method was employed. Test groups with varying outlet pipe diameters were selected for control. In Table 2, different outlet pipe diameters were applied to nozzles Nos. 1, 4, and 8 while maintaining other variables constant. The same approach was used for nozzles Nos. 9, 13, and 16. Fig. 10 shows the average vapor volume fraction curve with outlet distance for both sets of nozzles.
Figure 10: The average vapor volume fraction curves of different outlet pipe diameter D2
In Fig. 10, all conditions remained identical, except for the outlet pipe diameter. The red curves for nozzles Nos. 4 and 13 were at the top, indicating that these nozzles exhibited higher vapor volume fractions at the outlet with an outlet pipe diameter of 3.6 mm (outlet/inlet pipe diameter ratio of 1.2), signifying good cavitation performance. Conversely, the general trend of the black curves (nozzles Nos. 8 and 16, outlet pipe diameter of 4 mm) was notably lower, indicating that the outlet pipe diameter had a significant impact on cavitation performance.
3.2.2 Influence of Chamber Length
To investigate the effect of different chamber lengths on the target distance of the SOJ nozzle, the control variables method was similarly applied. Test groups with varying chamber lengths were selected for control. In Table 2, different chamber lengths were employed for nozzles Nos. 4, 5, and 6 while keeping other variables constant. The same approach was used for nozzles Nos. 12, 13, and 14. Fig. 11 illustrates the average vapor volume fraction curve with chamber length for both sets of nozzles.
Figure 11: Curves of average monitoring parameters of different chamber length L
In Fig. 11, all conditions remained consistent, except for the outlet pipe diameter. The black curve for nozzle 4 was at the top, indicating good cavitation performance. Although the difference in the average vapor volume fraction curves between Nos. 12 and 13 in Fig. 11b was minimal, the peak of No. 13 exceeded that of No. 12, implying that No. 13 achieved higher maximum cavitation performance than No. 12.
Regarding different chamber lengths, the outlet diameter D2 of 3.6 mm resulted in higher gas volume fractions. Vapor volume fractions were superior with a chamber length L = 9 and D = 16 mm, with slightly higher values for D = 22 and L = 12 mm. Analysis of the chamber diameter ratio D/L revealed that while the two nozzle parameters with better effects differed significantly in chamber diameter D and chamber length L, the chamber diameter ratio (D/L) differed by only 0.1. Thus, it can be explained that a chamber diameter ratio D/L = 1.8 led to higher vapor volume fractions near the highest vapor volume fraction of the SOJ nozzle.
3.2.3 Influence of Chamber Diameter
To investigate the impact of different chamber diameters on the target distance of the SOJ nozzle, the control variables method was employed, and test groups with varying chamber diameters were selected. In Table 2, different chamber diameters were assigned to nozzles Nos. 4 and 12 while keeping other variables constant. The same approach was applied to nozzles Nos. 5 and 13, while nozzles Nos. 6 and 14 were not plotted due to significantly lower average vapor volume fractions. Fig. 12 shows the average vapor volume fraction curve with outlet distance for both sets of nozzles.
Figure 12: Curves of average monitoring parameters of different chamber diameter D
In Fig. 12, all other conditions remained the same, except for the chamber diameter. In Fig. 12a, the black curve was higher, while in Fig. 12b, the red curve was higher. This indicates that nozzles with the same outlet diameter but different chamber lengths could also exhibit varying cavitation performance in terms of the same chamber diameter. Similarly, when considering the chamber diameter ratio D/L, nozzle 5 and 13, which had a chamber diameter ratio around 1.8, displayed higher vapor volume fractions.
3.3 Experimental and Comparison
During the experiment, an aluminum plate was placed at a fixed distance from the nozzle outlet, and different impact distances were achieved by adjusting the height of the loading platform. By comparing the simulation results, the impact shape and causes were analyzed. Fig. 13 illustrates the result of test nozzle 3 jets impacting the aluminum plate at a distance of 40 mm, and this is compared with the velocity and pressure contours from the simulation.
Figure 13: Comparisons of cavitation impact effect and simulation
Fig. 13b reveals three marked rings, denoted as R1, R2, and R3 in ascending order. Notably, the central ring R1 differed in shape from the second ring R2-R3, with deeper erosion dents on R1. The velocity contour showed relatively high velocities in this area, suggesting that the erosion in the central area of R1 was primarily due to the impact of high-velocity jets. A second ring-like area with noticeable erosion existed between R2 and R3, although it was less severe than the central area of R1. R3’s boundary was unclear, but within this area, pressure increased, and velocity decreased. Based on the cavitation number definition equation (Eq. (6)), the cavitation number increased in this region, indicating that erosion in this part was primarily caused by cavitation.
To compare the effects of different nozzles, aluminum plates were placed near the nozzles at a distance of 50 mm for 10 min, with all other conditions being the same. Fig. 14 presents a comparison of the results between test nozzles 3 and 4.
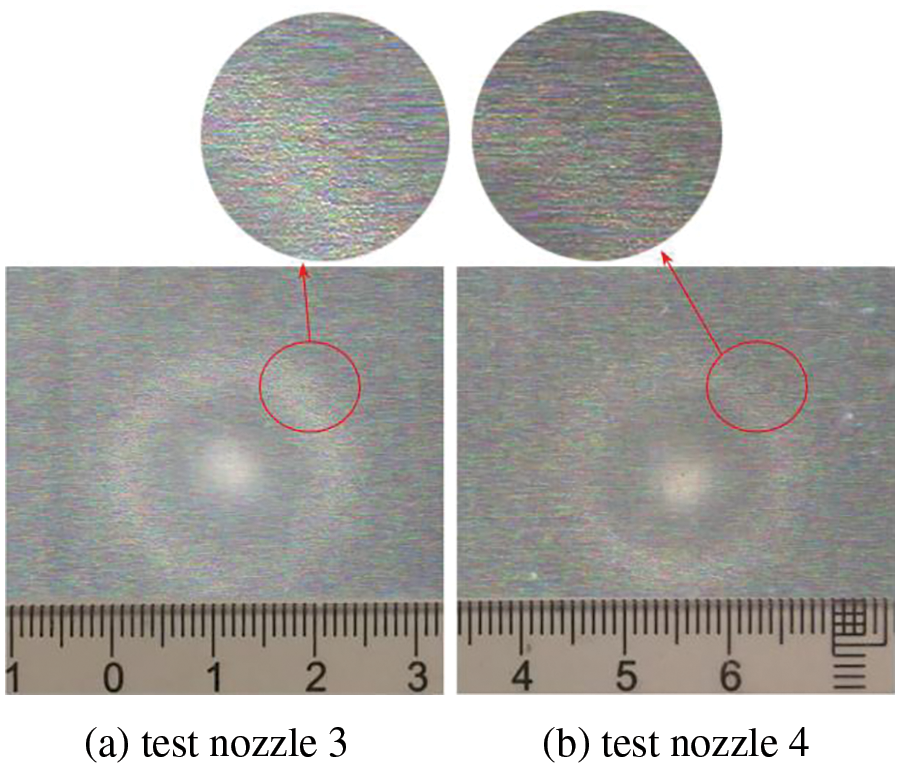
Figure 14: The jet erosion results
In Fig. 14, the surface erosion characteristics of the aluminum sheet were scanned, with a consistent scale applied to both pictures. While the two areas of erosion in Figs. 14a and 14b were similar in size, the erosion marks in Fig. 14a were noticeably deeper, indicating better cavitation erosion performance for test nozzle 3. This finding aligned with the conclusions drawn from the numerical simulations.
Next, the impact of each individual parameter on the target distance of the SOJ nozzles was discussed. Fig. 15 illustrates the trend of the optimal target distance and maximum vapor volume fraction for different outlet diameters D2. Notably, the optimal target distance obtained may not be highly precise due to the 5 mm interval between monitoring surfaces, resulting in a potential deviation of plus or minus 5 mm from the actual position.
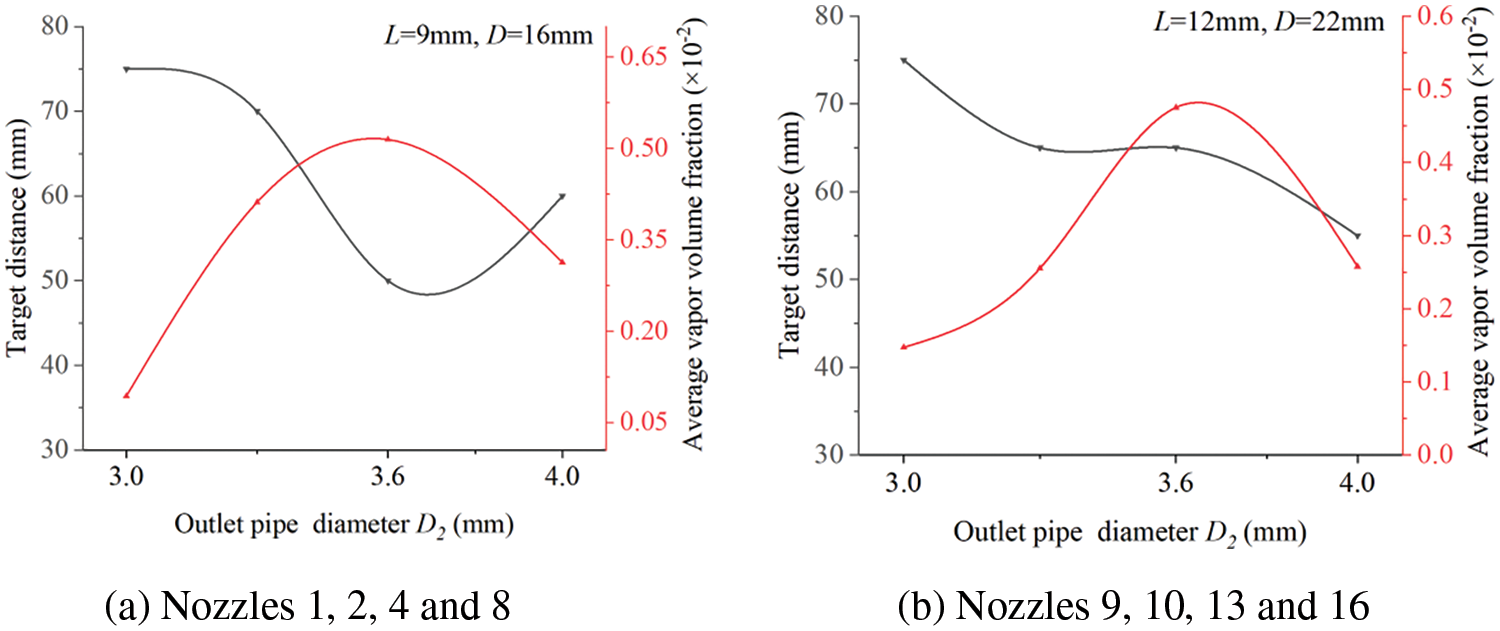
Figure 15: Comparisons of target distance of different outlet diameter D2
In Fig. 15, optimal target distances were distributed in the 50 to 75 mm range, with nozzles Nos. 5 and 13 (outlet pipe diameter D2 of 3.6 mm) identified as the best performers for two different sets of chamber diameters and lengths. In Fig. 15a, the shortest target distance occurred with D2 = 3.6 mm, while in Fig. 15b, D2 = 4.0 mm yielded the closest target distance due to increased chamber diameter and length. However, the maximum vapor volume fraction still occurred with D2 = 3.6 mm. Thus, it can be assumed that achieving greater cavitation at a shorter distance may reduce some kinetic energy loss.
Fig. 16 shows the trend of optimal target distance and maximum vapor volume fraction for different chamber lengths L.
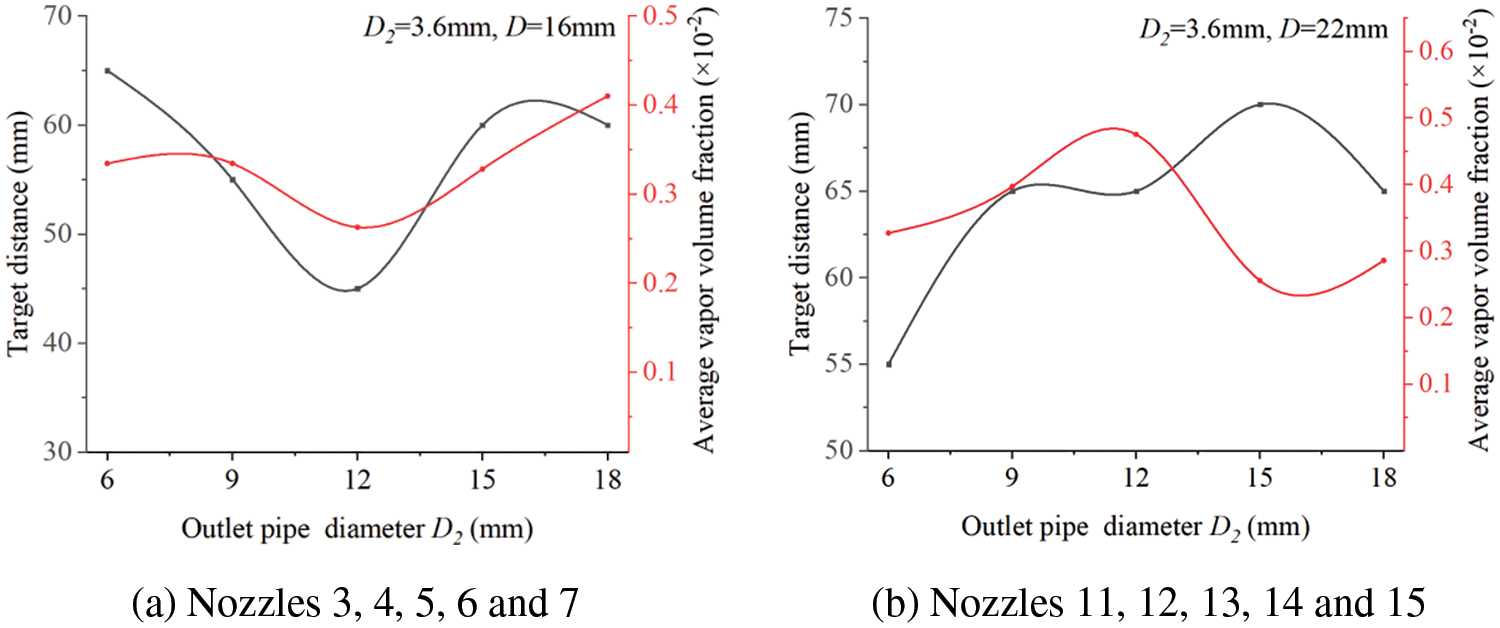
Figure 16: Comparisons of target distance of different chamber length L
Regarding the effect of different chamber diameters D on the optimal target distance, the limited comparison data points for each set were consolidated as shown in Table 4. Chamber length and chamber diameter were often considered in conjunction, with the chamber diameter-to-length ratio (D/L) serving as the main focus.
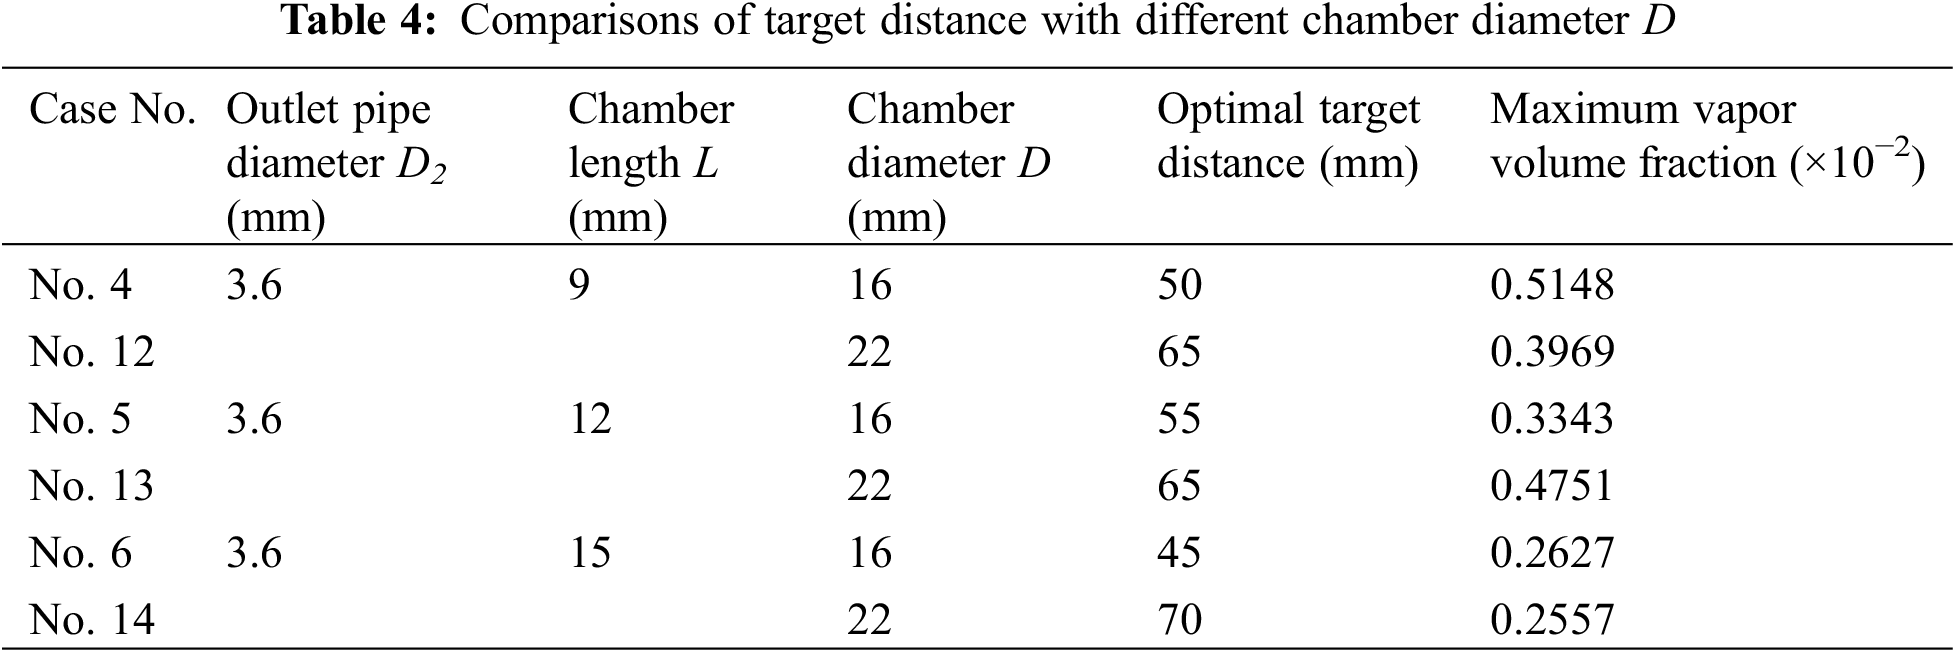
Comparing the data in Fig. 16 and Table 4, it is evident that the difference in the maximum vapor volume fraction in Fig. 16a was minimal, and the overall optimal target distances were close. In Fig. 16b, the maximum vapor volume fraction corresponded to the shortest target distance, and the chamber diameter ratio for this condition was 1.83. In Table 3, the overall highest vapor volume fraction corresponded to a chamber diameter ratio of 1.78, with an optimal target distance of 50 mm. Therefore, it is reasonable to assume that, in influencing chamber length and diameter, achieving a larger vapor volume fraction is feasible when the chamber diameter ratio (D/L) approaches 1.8, resulting in a relatively closer target distance.
In prior studies, Zhang et al. also investigated the impact of structural parameters on the pulsed jet of SOJ nozzles. They concluded that effective pulsed jet generation occurred when the structural parameters, specifically the outlet/inlet diameter ratio (D2/D1), were approximately 1.2, and the chamber length-to-diameter ratio (L/D) fell in the range of 0.35 to 0.37 [30]. This current study confirmed the superior cavitation performance of SOJ nozzles with an inlet/outlet diameter ratio of 1.2, aligning with findings from Zhu et al. several years ago [29]. However, there was some deviation in the chamber length-to-diameter ratio (L/D) obtained in this study, which was around 0.56 (D/L = 1.8). This discrepancy was mainly attributed to differences in other external parameters such as inlet pipe diameter and pressure.
Consequently, the structural design of SOJ nozzles cannot adhere to a universal standard for diverse application conditions. For instance, Wang et al. employed SOJ nozzles for atomization and identified optimal parameters of D = 28.056, D2 = 5.372 mm, and an inlet pressure of 3.999 MPa [44]. Another study by Wang et al. focused on SOJ cleaning nozzles and determined the optimal nozzle parameters as D1 = 1.365, L = 17.97, and D = 5.065 mm [45]. Therefore, while this study provides valuable insights for SOJ nozzle design, specific parameters may vary depending on the particular application scenario. Further research is warranted to establish parameters tailored to specific conditions.
This study investigated the cavitation performance of SOJ nozzles and examined the behavior of the optimal target distance under various conditions through numerical simulations and experiments. The periodic flow of SOJ was analyzed using LES, and an approximate optimal target distance was identified. The relationship between the optimal target distance and the cavitation performance of the SOJ nozzle was established through mean flow field analysis, confirming the influence of conditional parameters on nozzle performance. Finally, jet experiments verified the erosion effect at the optimal target distance of the SOJ nozzle. The key conclusions of this study are as follows:
(1) The distribution of cavitation clouds at the SOJ nozzle outlet exhibited a clear periodic pattern, with an identifiable optimal target distance.
(2) When the outlet/inlet diameter ratio (D1/D2) of the SOJ nozzle was close to 1.2 and the chamber diameter ratio (D/L) was approximately 1.8, the nozzle exhibited the highest vapor volume fraction at the outlet, indicating superior cavitation performance.
(3) Optimal cavitation performance of the SOJ nozzle corresponded to a target distance near 50 mm. Increasing the target distance led to a loss of kinetic energy and the collapse of the cavitation cloud.
(4) Experimental evidence confirmed that the cavitation jet produced distinct erosion marks on an aluminum plate in a short time. These eroded areas correlated with the pressure and velocity contours observed in the simulation.
Acknowledgement: All authors express gratitude for the diligent efforts of the journal editorial office and for the laboratory facilities provided by Jiangsu University.
Funding Statement: This work was supported by Key Projects of the Joint Fund of the National Natural Science Foundation of China (U20A20292); The Fundamental Research Funds for the Central Universities (No. JZ2021HGB0090); Key R&D Program of Zhenjiang City (GY2020015); Technology Support Plan (Research on Key Industrial Technologies) (TG202251); Shandong Province Science and Technology SMES Innovation Ability Improvement Project (2023TSGC0005).
Author Contributions: The authors confirm contribution to the paper as follows: study conception and design: Yuanyuan Zhao, Fujian Zhao; data collection: Fujian Zhao; analysis and interpretation of results: Guohui Li, Xiuli Wang; draft manuscript preparation: Fujian Zhao, Wei Xu. All authors reviewed the results and approved the final version of the manuscript.
Availability of Data and Materials: The data used to support the findings of this study are available from the corresponding author upon request.
Conflicts of Interest: The authors declare that they have no conflicts of interest to report regarding the present study.
References
1. Perić M. Prediction of cavitation on ships. Brodogradnja. 2022;73(3):39–58. [Google Scholar]
2. Sreedhar BK, Albert SK, Pandit AB. Cavitation damage: theory and measurements–A review. Wear. 2017;372:177–96. [Google Scholar]
3. Yamauchi Y, Soyama H, Adachi Y, Sato K, Shindo T, Oba R, et al. Suitable region of high-speed submerged water jets for cutting and peening. JSME Int J Ser B. 1995;38(1):31–8. [Google Scholar]
4. El Hassan M, Bukharin N, Al-Kouz W, Zhang J, Li W. A review on the erosion mechanism in cavitating jets and their industrial applications. Appl Sci. 2021;11(7):3166. [Google Scholar]
5. Soyama H. Cavitation peening: a review. Metals. 2020;10(2):270. [Google Scholar]
6. Brandon Helfield SSJK. Cavitation-enhanced drug delivery and immunotherapy. Pharmaceutics. 2023;15(9):2207. [Google Scholar]
7. Sivakumar M, Tang SY, Tan KW. Cavitation technology–A greener processing technique for the generation of pharmaceutical nanoemulsions. Ultrason Sonochem. 2014;21(6):2069–83. [Google Scholar]
8. Askarniya Z, Sun X, Wang Z, Boczkaj G. Cavitation-based technologies for pretreatment and processing of food wastes: major applications and mechanisms–A review. Chem Eng J. 2023;454:140388. [Google Scholar]
9. Abdrashitov A, Gavrilov A, Marfin E, Panchenko V, Kovalev A, Bolshev V, et al. Cavitation reactor for pretreatment of liquid agricultural waste. Agriculture. 2023;13(6):1218. [Google Scholar]
10. Fang Z, Gao X, Tao X, Li D, Zhang M, Xiong T, et al. Impact performance of Helmholtz self-excited oscillation waterjets used for underground mining. Appl Sci. 2019;9(16):3235. [Google Scholar]
11. Jasper S, Gradzki DP, Bracke R, Hussong J, Petermann M, Lindken R. Nozzle cavitation and rock erosion experiments reveal insight into the jet drilling process. Chem Eng Technol. 2021;93(10):1610–8. [Google Scholar]
12. Tang JR, Wang L, Lu YY, Ling YF, Zhang YK, Yao Q, et al. An experimental study on visualization of pulsation characteristics of supercharged pulsed water jet. J Vib Shock. 2021;40(20):1–8. [Google Scholar]
13. Foldyna J, Sitek L, Švehla B, Švehla T. Utilization of ultrasound to enhance high-speed water jet effects. Ultrason Sonochem. 2004;11(3–4):131–7. [Google Scholar]
14. Khavari M, Priyadarshi A, Morton J, Porfyrakis K, Pericleous K, Eskin D, et al. Cavitation-induced shock wave behaviour in different liquids. Ultrason Sonochem. 2023;94:106328. [Google Scholar]
15. Ge M, Petkovšek M, Zhang G, Jacobs D, Coutier-Delgosha O. Cavitation dynamics and thermodynamic effects at elevated temperatures in a small Venturi channel. Int J Heat Mass Transfer. 2021;170:120970. [Google Scholar]
16. Ge M, Zhang G, Petkovšek M, Long K, Coutier-Delgosha O. Intensity and regimes changing of hydrodynamic cavitation considering temperature effects. J Cleaner Prod. 2022;338:130470. [Google Scholar]
17. Hutli E, Nedeljkovic MS, Radovic NA, Bonyár A. The relation between the high speed submerged cavitating jet behaviour and the cavitation erosion process. Int J Multiphase Flow. 2016;83:27–38. [Google Scholar]
18. Gall V, Rütten E, Karbstein HP. Cavitation patterns in high-pressure homogenization nozzles with cylindrical orifices: influence of mixing stream in simultaneous homogenization and mixing. Exp Comput Multiphase Flow. 2022;2(4):156–64. [Google Scholar]
19. Yuan X, Wang N, Wang W, Zhang L, Zhu Y. Nozzle resonance mechanism and cooperative optimization of self-excited oscillating pulse cavitation jet. Mech Eng. 2023;47(1):74–88. [Google Scholar]
20. Li D, Kang Y, Ding X, Liu W. Experimental study on the effects of feeding pipe diameter on the cavitation erosion performance of self-resonating cavitating waterjet. Exp Thermal Fluid Sci. 2017;82:314–25. [Google Scholar]
21. Li D, Kang Y, Ding X, Wang X, Fang Z. An experimental investigation on the pressure characteristics of high speed self-resonating pulsed waterjets influenced by feeding pipe diameter. J Mech Sci Technol. 2016;30(11):4997–5007. [Google Scholar]
22. Xiang L, Wei X, Chen S. Experimental study on the frequency characteristics of self-excited pulsed cavitation jet. Eur J Mech B/Fluids. 2020;83:66–72. [Google Scholar]
23. Wang X, Kang Y, Zhang M, Yuan M, Li D. The effects of the downstream contraction ratio of organ-pipe nozzle on the pressure oscillations of self-resonating waterjets. Energies. 2018;11(11):3137. [Google Scholar]
24. Cai T, Pan Y, Ma F, Xu P. Effects of organ-pipe chamber geometry on the frequency and erosion characteristics of the self-excited cavitating waterjet. Energies. 2020;13(4):978. [Google Scholar]
25. Han X, Kang Y, Li D, Zhao W. Effects of surface roughness on self-excited cavitating water jet intensity in the organ-pipe nozzle: numerical simulations and experimental results. Mod Phys Lett B. 2019;33(27):1950324. [Google Scholar]
26. Shen J, Yang X. Decoupled energy stable schemes for phase-field models of two-phase complex fluids. SIAM J Sci Comput. 2014;36(1):B122–45. [Google Scholar]
27. Ye W, Zhu Z, Qian Z, Luo X. Numerical analysis of unstable turbulent flows in a centrifugal pump impeller considering the curvature and rotation effect. J Mech Sci Technol. 2020;34(7):2869–81. [Google Scholar]
28. Song G, Zheng H, Wang Y, Zheng Y, Zhou Y, Yao B. Finite element analysis of nozzle selection based on high pressure water jet technology. IOP Conf Ser Earth Environ Sci. 2019;267(4):42053. [Google Scholar]
29. Zhu HJ, Qiu BS, Yang XL, Jia QK. Optimization design of self-excited oscillation cavity. Adv Mater Res. 2011;204–210:263–7. [Google Scholar]
30. Zhang X, Li X, Nie S, Wang L, Dong J. Study on velocity and pressure characteristics of self-excited oscillating nozzle. J Braz Soc Mech Sci Eng. 2021;43(1):5. [Google Scholar]
31. Ji B, Luo XW, Arndt REA, Peng X, Wu Y. Large eddy simulation and theoretical investigations of the transient cavitating vortical flow structure around a NACA66 hydrofoil. Int J Multiphase Flow. 2015;68:121–34. [Google Scholar]
32. Bose ST, Park GI. Wall-modeled large-eddy simulation for complex turbulent flows. Annu Rev Fluid Mech. 2018;50(1):535–61. [Google Scholar]
33. Fang Z, Wu Q, Zhang M, Liu H, Jiang P, Li D. Large eddy simulation of self-excited oscillation pulsed jet (SEOPJ) induced by a Helmholtz oscillator in underground mining. Energies. 2019;12(11):2161. [Google Scholar]
34. Wang ZA, Kang Y, Wang X, Li D, Shi H. Effects of modulation position on the impact performance of mechanically modulated pulsed water jet. J Manuf Processes. 2020;56:510–21. [Google Scholar]
35. Rhee SH, Joshi S. Computational validation for flow around a marine propeller using unstructured mesh based navier-stokes solver. JSME Int J Ser B. 2005;3(48):562–70. [Google Scholar]
36. Zsolnai-Fehér K. The flow from simulation to reality. Nat Phys. 2022;11(18):1260–1. [Google Scholar]
37. Nicoud F, Ducros F. Subgrid-scale stress modelling based on the square of the velocity gradient tensor. Flow Turbul Combust. 1999;62(3):183–200. [Google Scholar]
38. Ntilde T, D. O, Juica M, Portal-Porras K, Fernandez-Gamiz U, Zulueta E. Estimating the reattachment length by realizing a comparison between URANS k-omega SST and LES WALE models on a symmetric geometry. Symmetry. 2021;9(13):1555. [Google Scholar]
39. Zwart PJ, Gerber AG, Belamri T. A two-phase flow model for predicting cavitation dynamics. In: Int. Conf. on Multiphase Flow, 2004; Yokohama, Japan. p. 152. [Google Scholar]
40. Meyers LM, Msomi V. Hydrodynamic analysis of an underwater glider wing using ansys fluent as an investigation tool. Mater Today: Proc. 2021;6(45):5456–61. [Google Scholar]
41. Gurgul S, Kura T, Fornalik-Wajs E. Numerical analysis of turbulent heat transfer in the case of minijets array. Symmetry. 2020;11(12):1785. [Google Scholar]
42. Zhou Z, Ge Z, Lu Y, Zhang X. Experimental study on characteristics of self-excited oscillation pulsed water jet. J Vibroeng. 2017;19(2):1345–57. [Google Scholar]
43. Zhang Y, Wang X, Zhang Y, Liu C. Comparisons and analyses of vortex identification between Omega method and Q criterion. J Hydrodyn. 2019;31(2):224–30. [Google Scholar]
44. Wang Z, Sun X, Chen S. Multi-objective parameters optimization design of self-excited oscillation pulsed atomizing nozzle. J Braz Soc Mech Sci Eng. 2019;41(11):510. [Google Scholar]
45. Wang Y, Wang X, Zhang Z, Li Y, Liu H, Zhang X, et al. Optimization of a self-excited pulsed air-water jet nozzle based on the response surface methodology. Strojniški Vestnik–J Mech Eng. 2021;67(3):75–87. [Google Scholar]
Cite This Article
 Copyright © 2024 The Author(s). Published by Tech Science Press.
This work is licensed under a Creative Commons Attribution 4.0 International License , which permits unrestricted use, distribution, and reproduction in any medium, provided the original work is properly cited.
 Downloads
 Citation Tools