
 Submit a Paper
 Propose a Special lssue
 Open Access
ARTICLE
Numerical Analysis of Permeability of Functionally Graded Scaffolds
Laboratory of Mechanics of Biocompatible Materials and Devices, Perm National Research Polytechnic University, Perm, 614990, Russia
* Corresponding Author: Dmitry Bratsun. Email:
(This article belongs to the Special Issue: Advanced Problems in Fluid Mechanics)
Fluid Dynamics & Materials Processing 2024, 20(7), 1463-1479. https://doi.org/10.32604/fdmp.2024.047928
Received 22 November 2023; Accepted 29 December 2023; Issue published 23 July 2024
 View Full Text
 Download PDF
Abstract
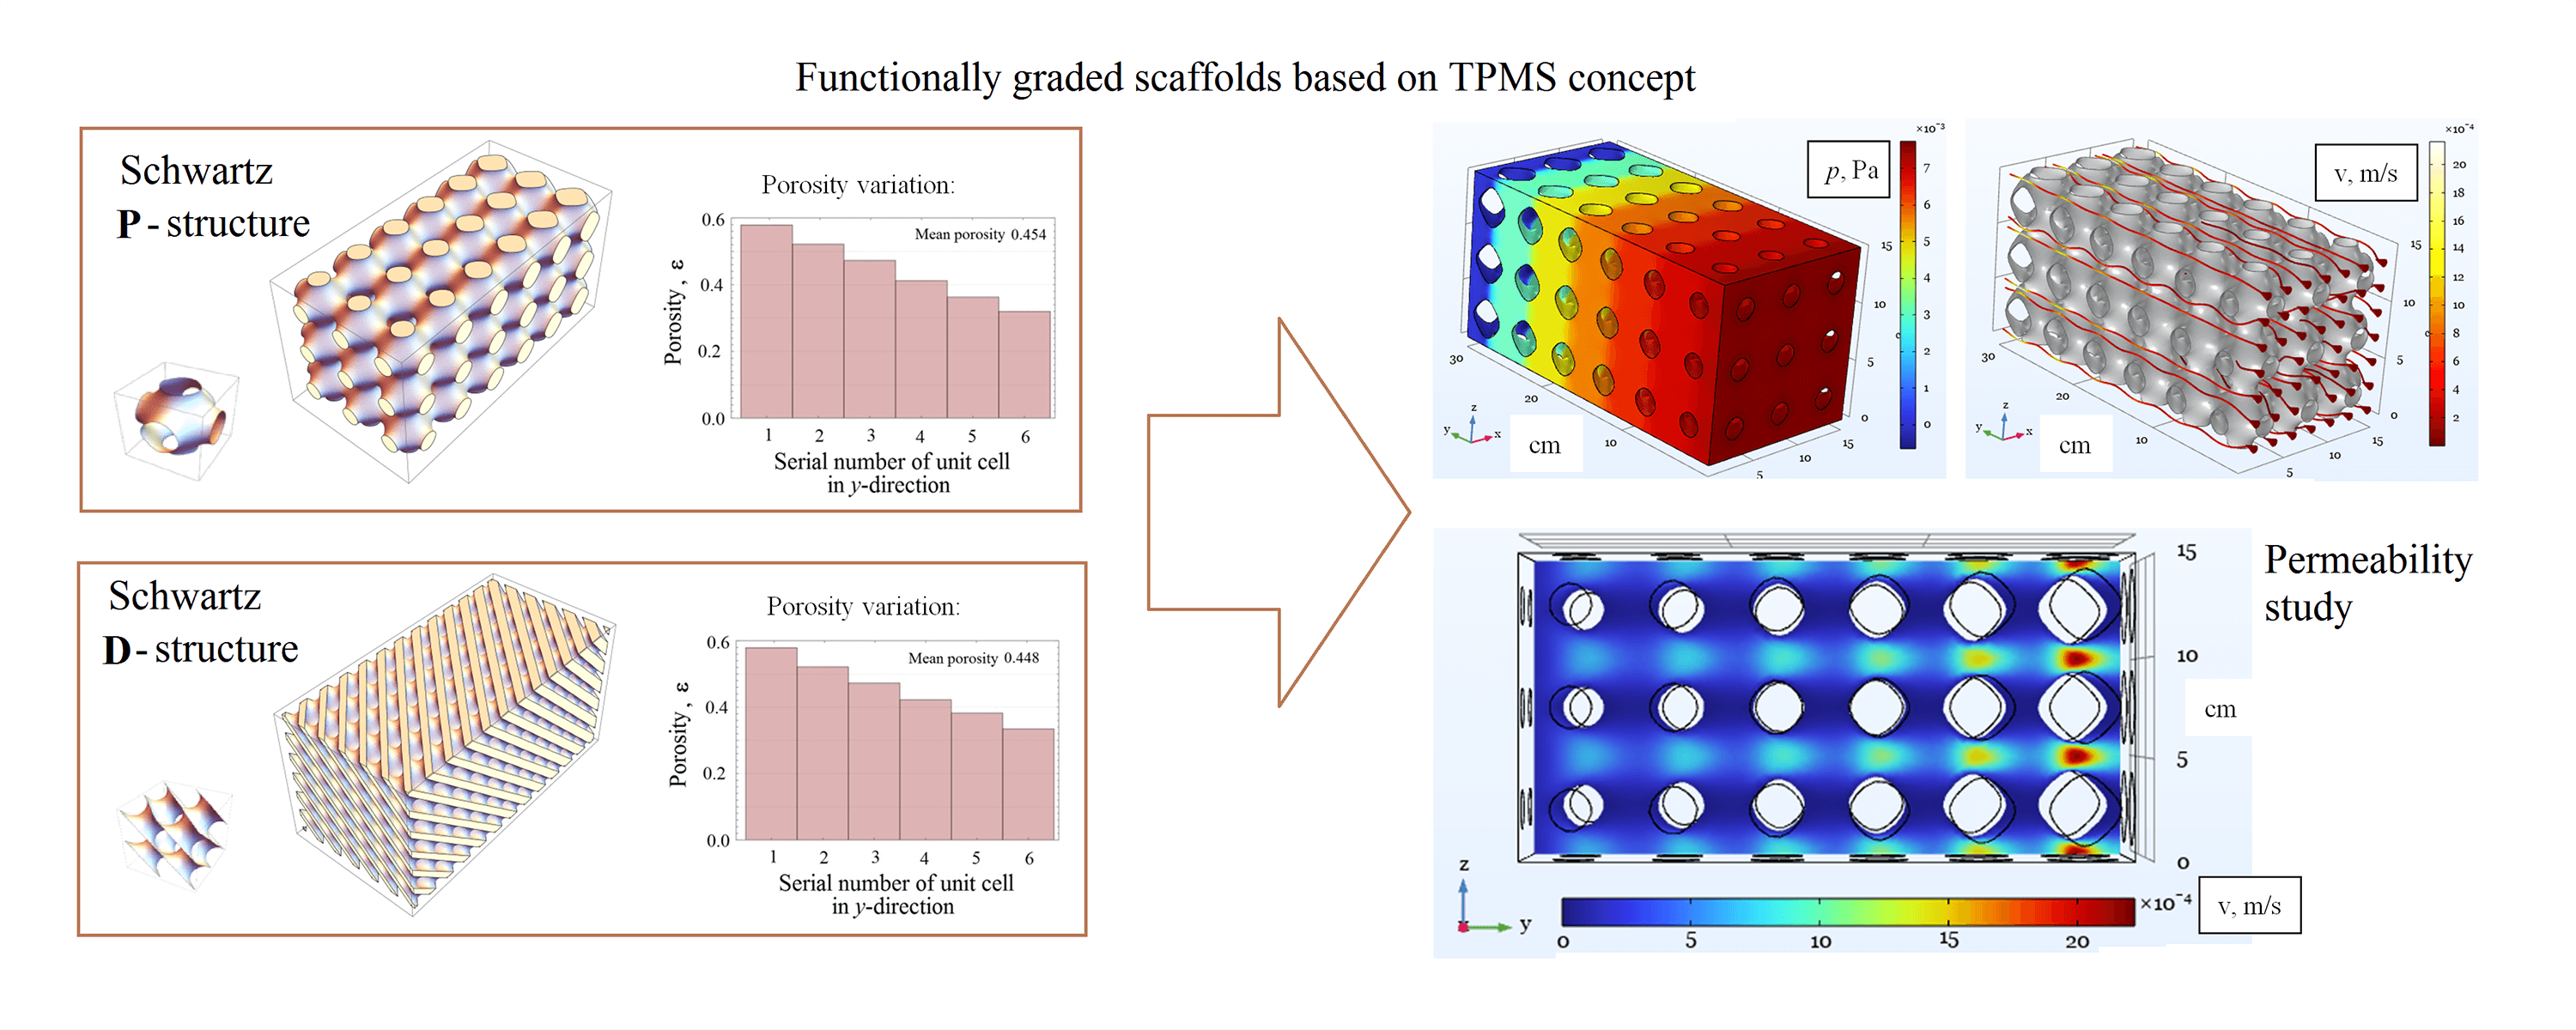
In this work, we numerically study the hydrodynamic permeability of new-generation artificial porous materials used as scaffolds for cell growth in a perfusion bioreactor. We consider two popular solid matrix designs based on triply periodic minimal surfaces, the Schwarz P (primitive) and D (diamond) surfaces, which enable the creation of materials with controlled porosity gradients. The latter property is crucial for regulating the shear stress field in the pores of the scaffold, which makes it possible to control the intensity of cell growth. The permeability of functionally graded materials is studied within the framework of both a microscopic approach based on the Navier-Stokes equation and an averaged description of the liquid filtration through a porous medium based on the equations of the Darcy or Forchheimer models. We calculate the permeability coefficients for both types of solid matrices formed by Schwarz surfaces, study their properties concerning forward and reverse fluid flows, and determine the ranges of Reynolds number for which the description within the Darcy or Forchheimer model is applicable. Finally, we obtain a shear stress field that varies along the sample, demonstrating the ability to tune spatially the rate of tissue growth.Graphic Abstract
Keywords
Nomenclature
| Abbreviations | |
| TPMS | Triply periodic minimal surfaces |
| Symbols | |
| A, B | Inlet and outlet boundaries of the sample |
| C, D, E, F | Lateral borders of the sample |
| cF | Forchheimer coefficient |
| fK | Filtration model parameter in Eq. (13) |
| K | Porous medium permeability coefficient |
| L | Sample length |
| p | Pressure |
| ReK | Reynolds number |
| r | Position vector |
| u | Fluid filtration rate in an averaged model of a porous medium |
| V | Volume of porous medium filled by liquid |
| v | Fluid velocity in a model based on a microscopic description |
| x, y, z | Cartesian coordinates |
| #1,#2 | Sample serial number |
| Greek Symbols | |
| ε | Medium porosity coefficient |
| μ | Dynamic viscosity coefficient |
| ν | Kinematic viscosity coefficient |
| ρ | Fluid density |
| ϕ | TPMS function |
The active development of 3-D printing technologies opens up opportunities for creating personalized designs in orthopedic surgery [1–3]. Specifically, bone tissue engineering based on highly porous scaffolds makes it possible to treat bone defects using implantation [4–6]. Currently, scaffolds are the principal tool used for tissue growth [7]. A scaffold is a porous or fibrous matrix of a definite structure seeded with undifferentiated cells of the presumable tissue. It is an integral part of the closed circuit of the perfusion bioreactor, which ensures the filtration of nutrient solution through the scaffold’s pores. For an implant to work reliably, it must mimic the heterogeneity of natural bone, both morphologically (by changing porosity) and mechanically (by changing mechanical properties). The main functions that a scaffold must perform in a biological environment include mechanical support of cells, ensuring their proliferation and differentiation, as well as control of the structure and functions of the tissue. Therefore, the structure that replaces damaged bone parts must have interconnected pores and relatively high porosity to allow cell penetration, vascular ingrowth, nutrient diffusion, and waste product removal [8]. Thus, the scaffold must be a biomimetic of targeted tissue. Bone tissue is heterogeneous both in its structure and in biomechanical characteristics. It means that an ideal scaffold should optimally combine sufficient porosity and strength, as well as withstand various mechanical loads in certain areas [9,10]. For example, to replace damaged trabecular bone tissue, one needs to design a scaffold with high porosity (about 50%–80%), while to replace cortical bone, scaffolds with low porosity (10%–30%) are required [11].
Scaffolds made using 3-D printing technology, as a rule, have a periodic cellular structure [12,13]. Changes in local porosity inherent in bone tissue can be reproduced in structures using a porosity gradient [14–16]. When designing functionally graded scaffolds, one of the most commonly used unit cells is cells based on triply periodic minimal surfaces (TPMS) [17,18]. This class of surfaces is defined as infinite surfaces, which are periodical in three mutually perpendicular directions [19]. The advantage of using these surfaces when designing implants is that the geometry of scaffolds based on TPMS has an explicit analytical expression. In this case, one can easily control the morphology of structures, allowing one to achieve an optimal balance between porosity and stiffness. The latter, in turn, promotes different rates of cell growth, as shown in [20]. Also, structures based on TPMS demonstrate a large specific surface area, which is the principal factor of cell attachment and proliferation, and also provides higher permeability in comparison with similar scaffolds.
It is important to note that hydrodynamic phenomena play a crucial role in the growth of cell mass since shear stresses in the solution stimulate cells to divide [21,22]. Research efforts in tissue engineering are focused on finding the most effective scaffold topology [23]. Numerous studies show that the rate of tissue growth can increase several times, but this effect of stress is not linear [24,25]. There is a critical value above which cells die. Notice that the interaction between the solid matrix and living cells has not yet been sufficiently studied since the scaffold is not the natural habitat of cells. The search for an advantageous scaffold architecture rather occurs through an empirical selection of its topology, as well as the size and shape of the pores of the solid matrix. Models for the cell mass growth in a scaffold are being actively developed at the microscopic level [26–28] and within the framework of continuous medium models [29,30].
When predicting the behavior of cells in scaffolds, the permeability of the structure plays a decisive role, which, in turn, can be controlled using a functional gradient [31]. The biological effectiveness of lattice structures directly depends on the internal architecture of the pores, which means that analysis of liquid permeability makes it possible to predict the cell activity at the stage of designing the lattice structure [32]. Controlling the internal pore structure using a functional gradient locally changes the permeability of the scaffold, which, in turn, directly affects the filtration rate [33] and, therefore, changes the rate of chemical and biological reactions.
Fluid filtration in inhomogeneous porous media was considered in many works; they are reviewed in the monograph by Nield et al. [34]. For example, in [35,36], the effect of the inhomogeneous distribution of medium characteristics on the flow was studied. An important example of natural porous media with heterogeneous properties is the filtration of a two-phase system of immiscible liquids in multilayer and fractured media. This requires the development of new filtration models [37,38]. Also, models of an inhomogeneous porous medium are used to describe the crystallization process [39,40]. It is worth noting that there is another hydrodynamic system for which models of homogeneous or inhomogeneous porous media are widely applied. It is the flow in a Hele-Shaw cell, which refers to the fluid between two flat parallel plates separated by a narrow gap. Several works by the authors have shown that manipulating various physical properties of the cell walls (it is equivalent to changing the properties of a porous medium) allows one to successfully control such flows by localized cooling [41,42] or the electro-osmotic trigger [43].
In this work, we numerically study the hydrodynamic permeability of two popular schemes of functionally graded scaffolds used for cell growth. Mathematical filtration models are based either on the Darcy or Forchheimer equations. Microscopic study is presented by direct numerical simulation based on the Navier-Stokes equation. The paper is organized as follows: In Section 2, we describe the design of functional-graded scaffolds based on triply periodic minimal surfaces. The mathematical formulation of the hydrodynamic problem is provided in Section 3. The numerical method is discussed in Section 4. In Section 5, we present numerical results.
2 Structural Design of Functional-Graded Scaffolds Based on TPMS Concept
Triple periodic minimal surfaces divide the volume, which is considered to be a unit cell, into two different subdomains [19]. Generally, the TPMS function is determined by the following expression [14]:
where
The functional gradient of porosity allows the percentage of pores in a structure to be continuously varied in one or two directions without changing the cell morphology. The solid structure with a functional gradient of porosity can be specified by the following expression based on Eq. (1):
where i is the index, which indicates a specific TPMS name, and
stands for the function that determines the initial and final values of the porosity. In (3), ki and Qi are the setting parameters. Eq. (3) provides a simple example of a linear gradient along one of the main axes, in this case, along the y-axis. If necessary, one can specify a gradient in an arbitrary direction, as well as specify a more complicated nonlinear dependence Ri on one or more coordinates. The parameters that define the gradient are selected depending on the requirements for the initial and final porosity of the cavity in the direction of the gradient. Calculation of local porosity value at the selected parameters is carried out analytically according to the following expression:
where
One must calculate the gradient parameters for a given initial and final porosity based on the assumption that the planes y = ymin and y = ymax correspond to the planes of homogeneous periodic structures with similar average porosity. In this work, we define the values of initial and final porosities as 0.6 and 0.3, respectively. To satisfy these requirements, we select the values of the parameter Q in Eq. (1) (let us denote them as Q60 and Q30, where the indices correspond to the required porosity values). Then, we solve a system of two linear algebraic equations for two unknown values ki and Qi :
In this work, we consider two materials with a functionally graded structure, which are specified by the following explicit analytical expressions developed within the framework of the TPMS concept:
(1) Schwarz surface P (primitive)
where
(2) Schwarz surface D (diamond)
where
Here, we assume that
where n = 3 is the number of cells in the x-direction. The sample length along the x-axis is a = 15 mm, the origin of the coordinate system is at (0,0,0), and xmin = 0, ymin = 0, zmin = 0, xmax = 15, ymax = 30, zmax = 15.
Eqs. (5) and (6) show how easily the variations of the porosity coefficient can be tuned in these artificial materials. The formulas are developed so that the connectivity of the pores in the porous medium samples is end-to-end, which is crucial for their permeability. Fig. 1 presents the appearance of both functionally graded samples, their main properties, and the dependence of the porosity coefficient of the medium on the coordinate in the direction of the porosity gradient vector.
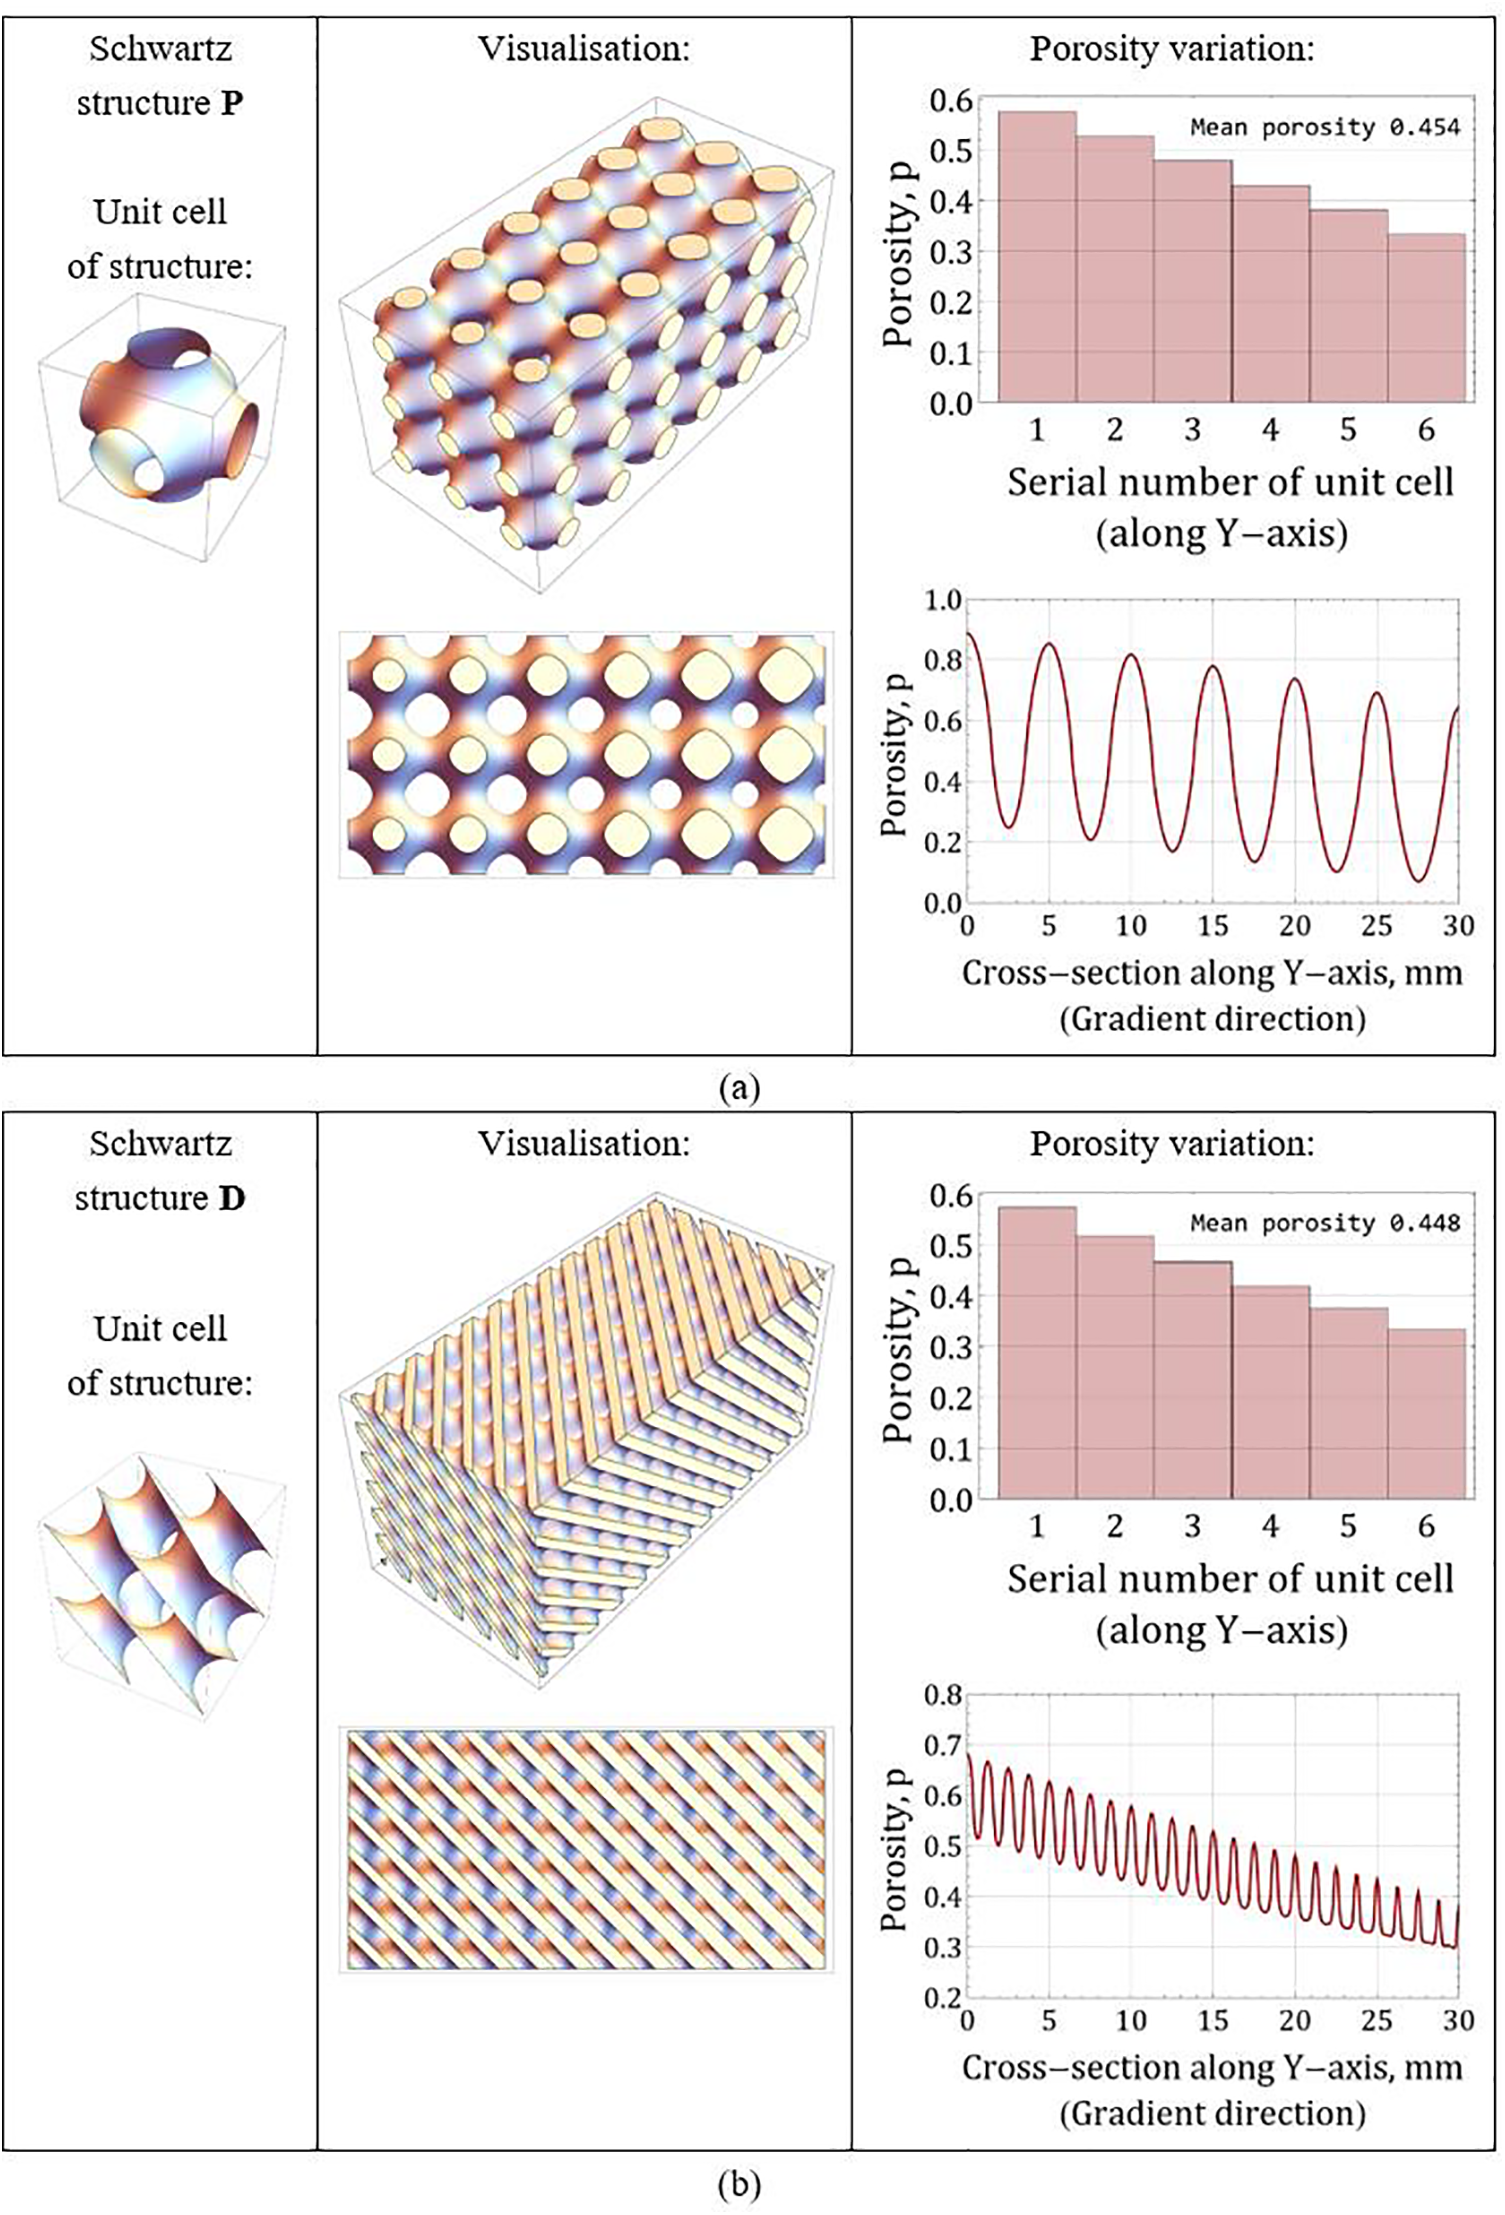
Figure 1: 3-D structures with a porosity gradient directed along the y-axis: (a) Schwarz surface P; (b) Schwarz surface D. Each structure consists of 3 × 6 × 3 unit cells
3 Mathematical Formulation in Microscopic and Macroscopic Description of Fluid Flow
A porous matrix characterized by a porosity gradient makes it possible to control tissue growing processes. A dynamic cellular structure is formed in a perfusion bioreactor, where the scaffold acts as a biochip. The study of flow through a porous matrix with a heterogeneous porosity structure implies the consideration of a scaffold with a specific topology. Let us consider the model structures shown in Fig. 1 from a fluid mechanics perspective.
There are two approaches to describing flow through a porous medium saturated with liquid. Let us briefly look at each of them. In a microscopic approach to studying the movement of incompressible fluid in pores, the following equations are used:
where Eq. (7) is the Navier-Stokes equation, and Eq. (8) is the continuity equation. Here ρ and μ denote the density and dynamic viscosity of the liquid, respectively. The pressure p and the fluid velocity in the pores v act as characteristics of fluid motion in Eqs. (7), (8). A microscopic description of fluid flow does not require averaging of Eqs. (7), (8), but depends on complete information about the topology of the solid matrix through which the fluid moves. Such information makes it possible to determine the liquid-solid interface and correctly set the boundary conditions for the problem. Generally, such a procedure is problematic since the structure of pores in the matrix can vary randomly in the shape of the pores and the nature of their branching. In this case, it makes sense to reduce Eqs. (7), (8) to the averaged equations of a porous medium saturated with liquid, for the solution of which detailed information about the structure of the pores is not necessary. This approach to describing a porous medium is called macroscopic.
In the macroscopic approach, the flow intensity is characterized by the filtration rate u, defined as the volumetric flow rate of liquid through a unit area in a porous medium. With this description, one introduces the medium porosity ε, a dimensionless quantity, which is defined as the ratio of the pore volume Vf to the entire volume of the selected element of the medium V:
The filtration rate is related to the average velocity of the liquid in the pores by the relation u = εv. The variety of natural and artificial porous materials determines the usage of different models to describe liquid filtration. When deriving averaged filtration equations, one usually assumes that
• the matrix is solid and non-deformable;
• there are no phase transitions from the dispersed component of the medium to the dispersive one and vice versa;
• the averaged tensor of viscous stresses in the liquid phase is negligible, and the influence of viscosity is taken into account only in the force of interphase interaction.
In this case, the flow of liquid at low filtration rates can be described based on Darcy’s law, which establishes direct proportionality between the pressure gradient and filtration rate:
where К is the permeability coefficient of the medium, which contains indirect information about the structure of the solid matrix and the properties of the liquid. This coefficient must be determined. For some simple media, the coefficient K can be obtained analytically. In other cases, a comparison of calculations made within the framework of a micro- and macroscopic description of the system is required.
By comparing Eqs. (7) and (10), one can notice that the Darcy approximation requires negligible inertia in the liquid phase, which is described by the nonlinear term in the Navier-Stokes in Eq. (7). This approximation is usually valid for porous media with a small porosity value, resulting in slow percolation of liquid through the media. This process can be estimated using the local Reynolds number, determined from the size of pores:
where ν is the coefficient of kinematic viscosity of the liquid.
If the filtration rate is not small (ReK > 1), and the magnitudes and directions of the velocities of liquid particles change significantly due to the tortuosity of the pore channels and the variability of their transverse dimensions, then the role of inertial forces increases, which leads to a deviation of the real filtration law from Darcy’s law (10). To take these effects into account, one applies the Forchheimer equation, in which inertia is taken into account by introducing the term quadratic in filtration rate [34]:
where cF is the dimensionless Forchheimer coefficient, the value of which also depends on the nature of the porous material. In calculations of typical natural porous media, the value of cF varies from zero (asymptotic to the Darcy model) to unity for media with moderate porosity. Note that the permeability coefficient in Eqs. (10) and (12), in the general case of a complex solid matrix, can be a function of coordinates. By comparing Eqs. (7) and (12), one can notice that the Forchheimer model accounts for the effect of fluid inertia but ignores the possible non-stationarity of flow and viscous forces in the liquid phase. To take these effects into account, even more complex macroscopic models have been developed, which we do not consider in this work.
To characterize the type of model, choosing between the Darcy (10) and the Forchheimer Eq. (12), we introduce the following dimensionless parameter (see [44]):
As is known [34], with the Darcy model, relation fK = 1/ReK is valid, and in the case of the system behavior approaching the Forchheimer model, fK tends to an asymptotic value 1.
In this paper, we use direct numerical simulation as a tool to gain insight into how fluid seeps through an artificial porous material with a complicated topology. The problem allows such an approach since the relief of the solid matrix can be derived analytically. Thus, we exactly know where the liquid-solid interface is located and can organize numerical simulations of the liquid behavior, taking into account the boundary conditions. The study at the pore scale is labor intensive. In return, it provides the universality of the obtained results: one can consider a wide variety of porous media over a wide range of Reynolds numbers. In our case, this is crucial since the solid matrix is substantially empty (the porosity coefficient varies from 0.3 to 0.6).
Thus, our study includes two stages. We first use direct numerical simulations to establish the limits of applicability of various averaged porous media models. Also, we determine the value of the permeability coefficient. In the second step, we consider the range of parameters where the macroscopic description works well and make simulations using an averaged model.
Let us numerically study the permeability of two solid matrices with a given model pore topology (Fig. 2). We will refer to the porous matrices given by Eqs. (5) and (6) as samples #1 and #2, respectively. Each sample is a parallelepiped with dimensions of 15 cm × 30 cm × 15 cm. We introduce the Cartesian coordinate system, as shown in the figure. As can be seen from the figure, the pore sizes along the y-axis change but remain fixed along the x- and z-axes. Thus, sample #1, shown in Fig. 2, can be used as a unit cell for building larger systems. For example, in the x and z directions, one can use the periodicity of the pore structure. Also, the topological properties of the sample are reproduced when it is scaled spatially.
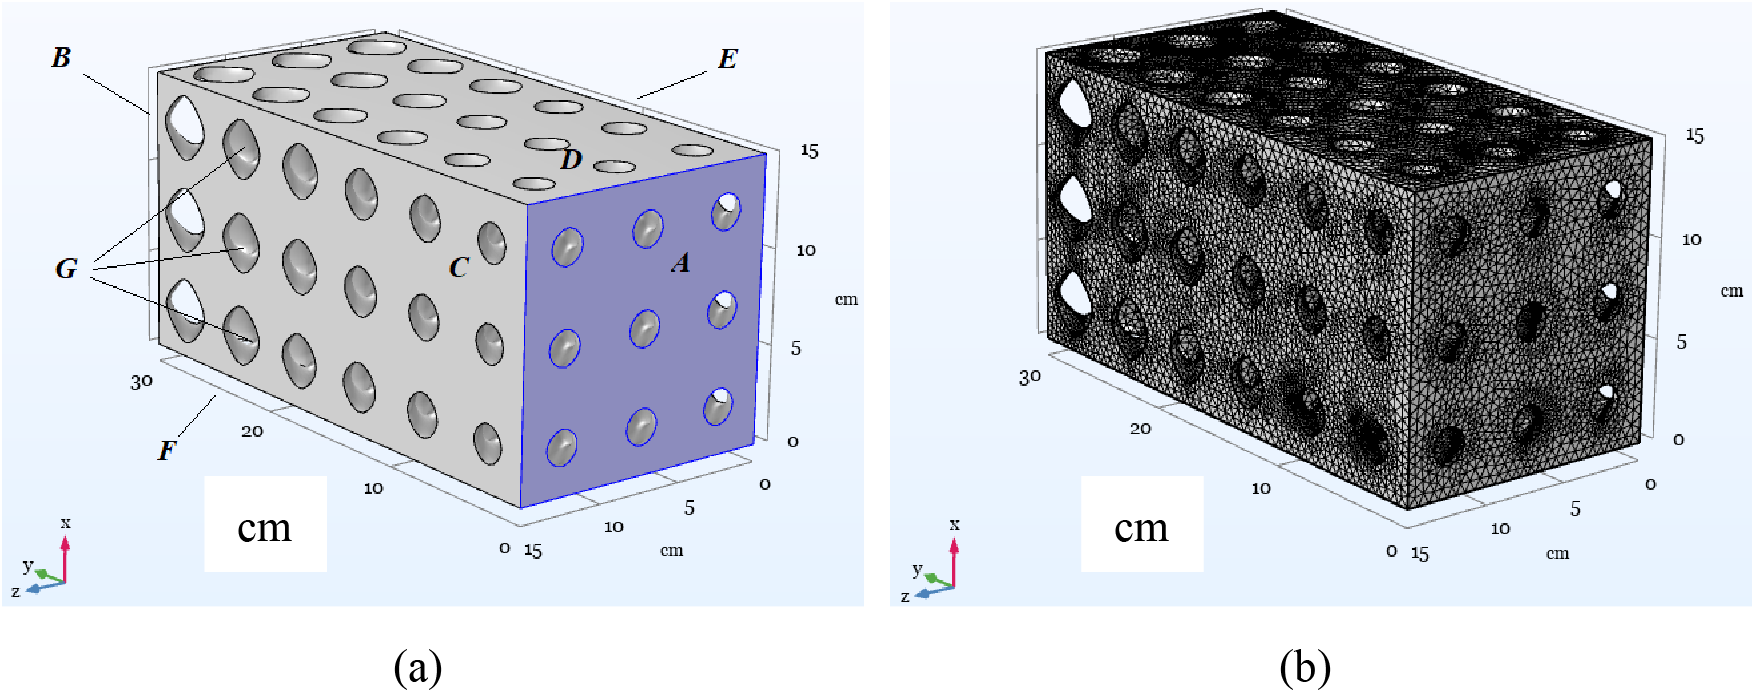
Figure 2: (a) Boundaries of the volume filled with liquid for sample #1: A, B–inlet and outlet surfaces; C, D, E, F–lateral borders; G–solid matrix inclusions; (b) Numerical grid developed for sample #1 in the liquid phase domain
Numerical simulations were performed using the commercial CFD software code Comsol Multiphysics. The samples of solid matrices of artificial porous materials studied theoretically in this work were initially 3-D printed to test their strength under load. The CAD programs having 3-D printing capabilities typically save models in STL format. The Comsol software is convenient for studying systems with complex topology as it allows direct import of STL files from a CAD program for further use, for example, in hydrodynamic research.
The Comsol software uses the finite element method to solve a fluid mechanics problem. As is known, this method is more complicated in implementation but can be applied to the problem with arbitrary topology of the computational domain. The software suggests two solvers (Fully_Coupled and Segregated ones) for fluid mechanics problems. The difference is as follows. For example, let us consider the mathematical model governed by equations L1 and L2 for two physical variables U1 and U2:
In the case Fully_Coupled solver, the code builds the general Jacobian of the system, which includes all equations and variables:
After the Jacobian is composed, a unified system of equations is solved:
However, the user can apply the alternative Segregated solver. In this case, the program calculates the Jacobian separately for each group of equations:
The equations are then solved sequentially in an iterative process:
The solution procedure is as follows. Based on the first calculated Jacobian, the program finds a solution to the first group of equations. Then, based on the obtained solution, U1 is refined. After this, the program calculates the second Jacobian and solves the second group of equations. Finally, the second variable U2 is specified. The iterative procedure is repeated until the iteration criterion is met. In our opinion, the Segregated solver is more efficient in terms of memory consumption and time spent to estimate the Jacobian. It is also better in terms of convergence radius concerning the initial conditions than the Fully_Coupled solver. In most cases, we used it in numerical simulations.
To determine the limits of applicability of the Darcy model, we use a microscopic description of the system based on the Navier-Stokes equation. Also, the purpose of the study is to determine the average values of the porous structure, such as ε and K, which are necessary for use within the framework of a simplified macroscopic description. Microscopic calculations were performed using Eqs. (7), (8) for a domain, which is a set of pores filled with liquid. Fig. 2a shows the pore space for sample #1. A domain is a channel through which fluid is pumped in the y-axis direction. A pressure difference
At the inlet A to the channel, we set the constant velocity:
At the lateral boundaries of the sample, a symmetry condition is set, which is usually applied when simulating systems with periodic porous matrices.
Fig. 2b shows the computational mesh developed for model system #1. As one can see from the figure, the mesh has condensations in the zone of action of viscous boundary layer flows adjacent to the solid-liquid interface. All simulations were performed for a liquid with a density ρ = 103 kg/m3 and a viscosity μ = 10–3 Pa·s.
The permeability of each sample is determined based on the Darcy model (10) when calculated with low Reynolds numbers ReK ~ 10–4. Approximating the pressure gradient by the pressure difference
where L stands for the channel length.
5 Numerical Results for Macroscopic Samples
Table 1 presents the calculated values of the porosity and permeability coefficients for two types of solid matrices shown in Fig. 1. To take into account the influence of the porosity gradient, we performed numerical simulations of the fluid filtration both in the positive direction of the y-axis and in the reverse direction. As one can see from the table, the permeability of sample #1 depends little on the sign of the porosity gradient, while the permeability of sample #2 shows a significant dependence on the direction of fluid flow. This result is explained by the different pore structures of the two matrices.
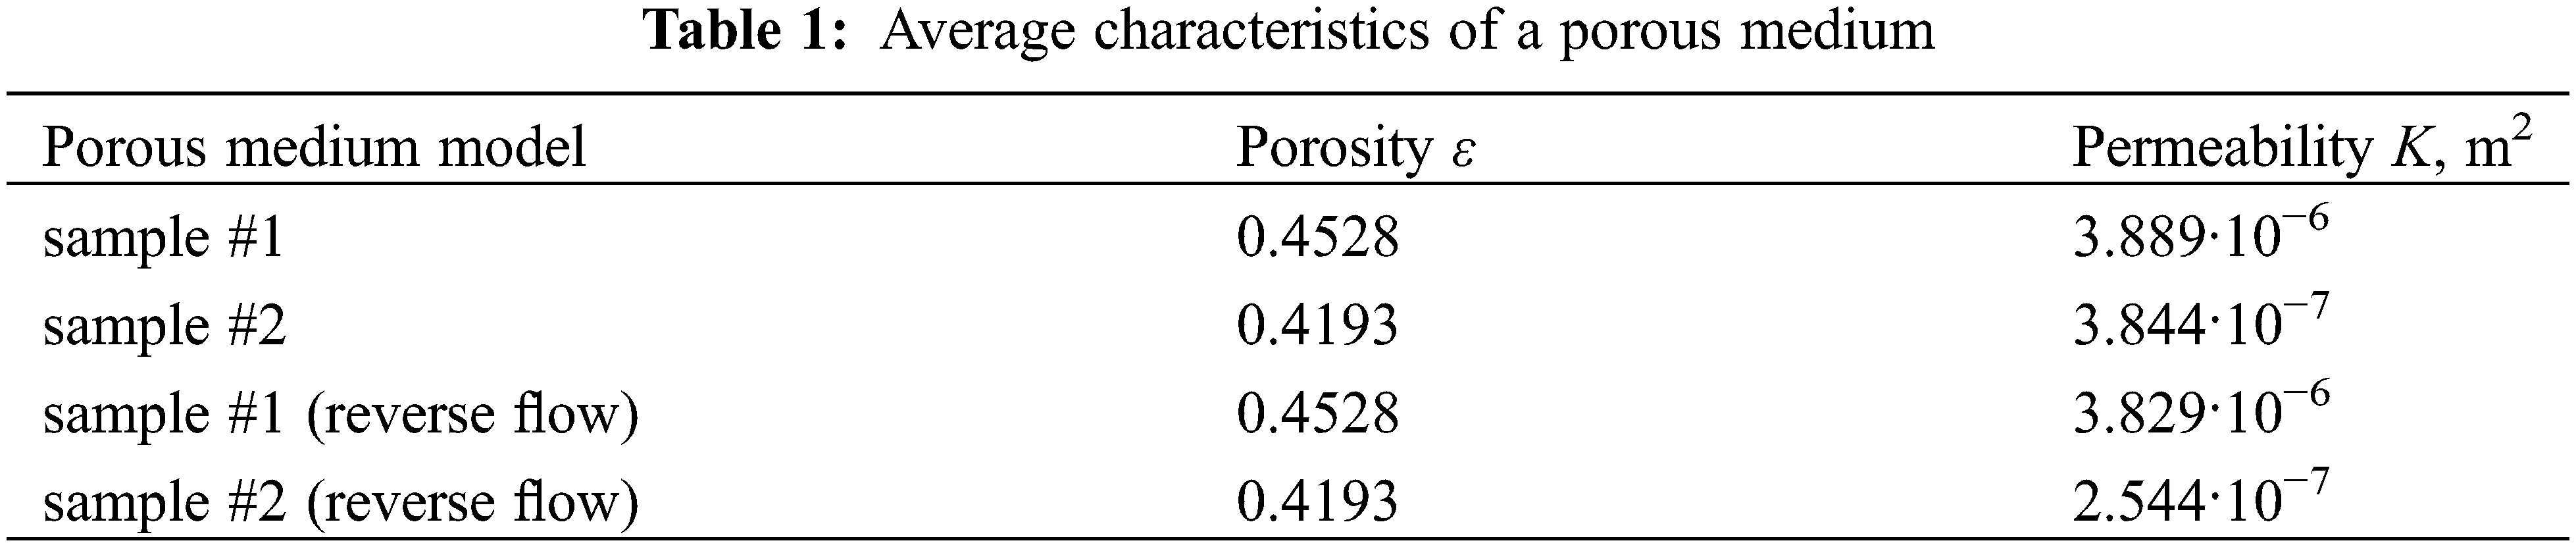
Fig. 3 shows the dependence of the parameter
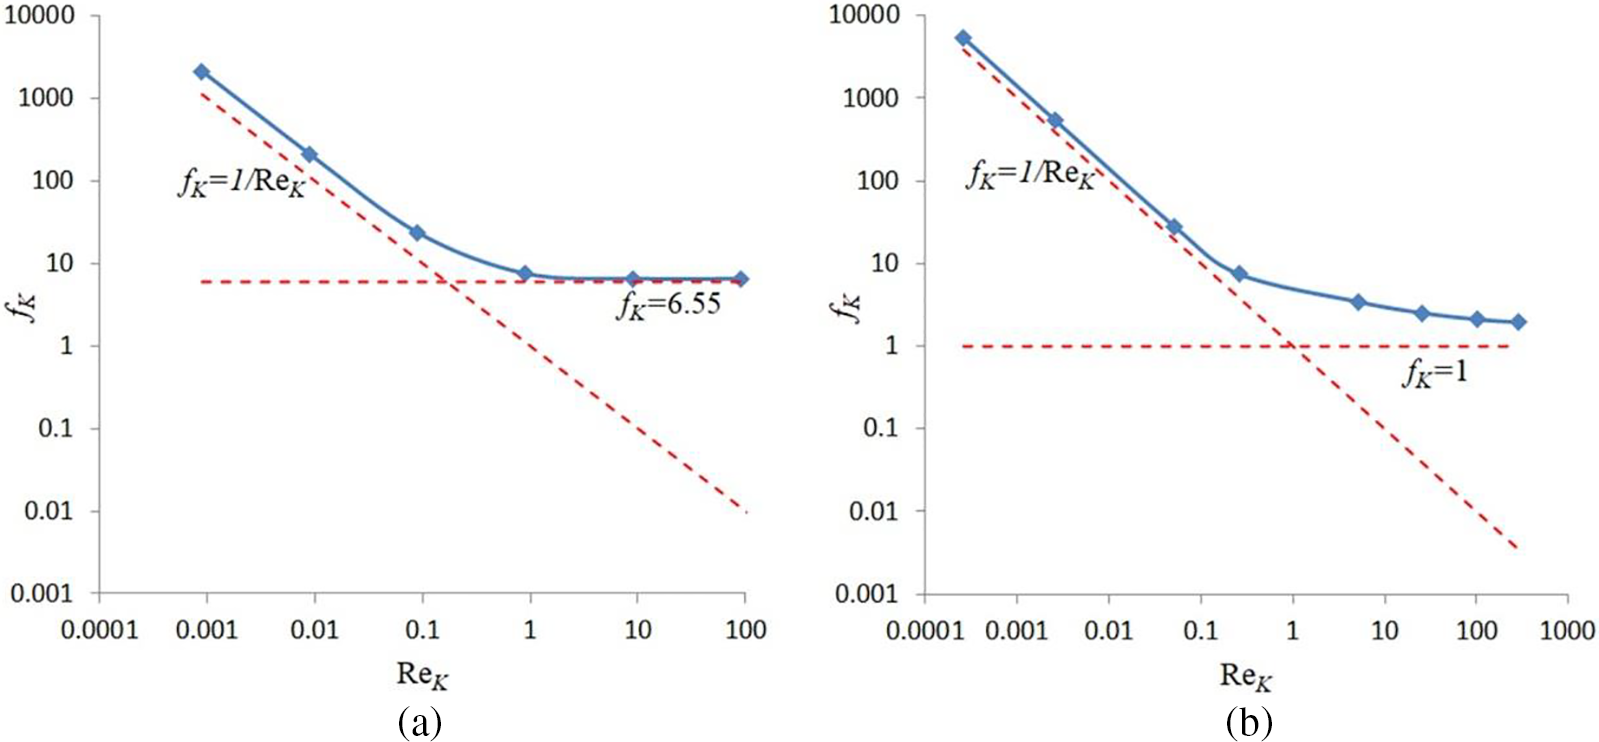
Figure 3: Transition from Darcy to Forchheimer flow for porous matrices #1 (a) and #2 (b)
Fig. 3 clearly demonstrates that the applicability of the hydrodynamic model within the framework of a macroscopic description must be resolved strictly individually for porous media with a specific internal structure of the solid matrix.
The following interesting point is worth noting. The Forchheimer coefficient for sample #1 occurs relatively large
Once we have determined the characteristics of the averaged continuum, we can perform a numerical study within the framework of a macroscopic description. The dimensions of the calculated domain coincide with the samples presented in Fig. 1. We performed the numerical simulations for a low flow rate vin = 10–4 m/s (approximately
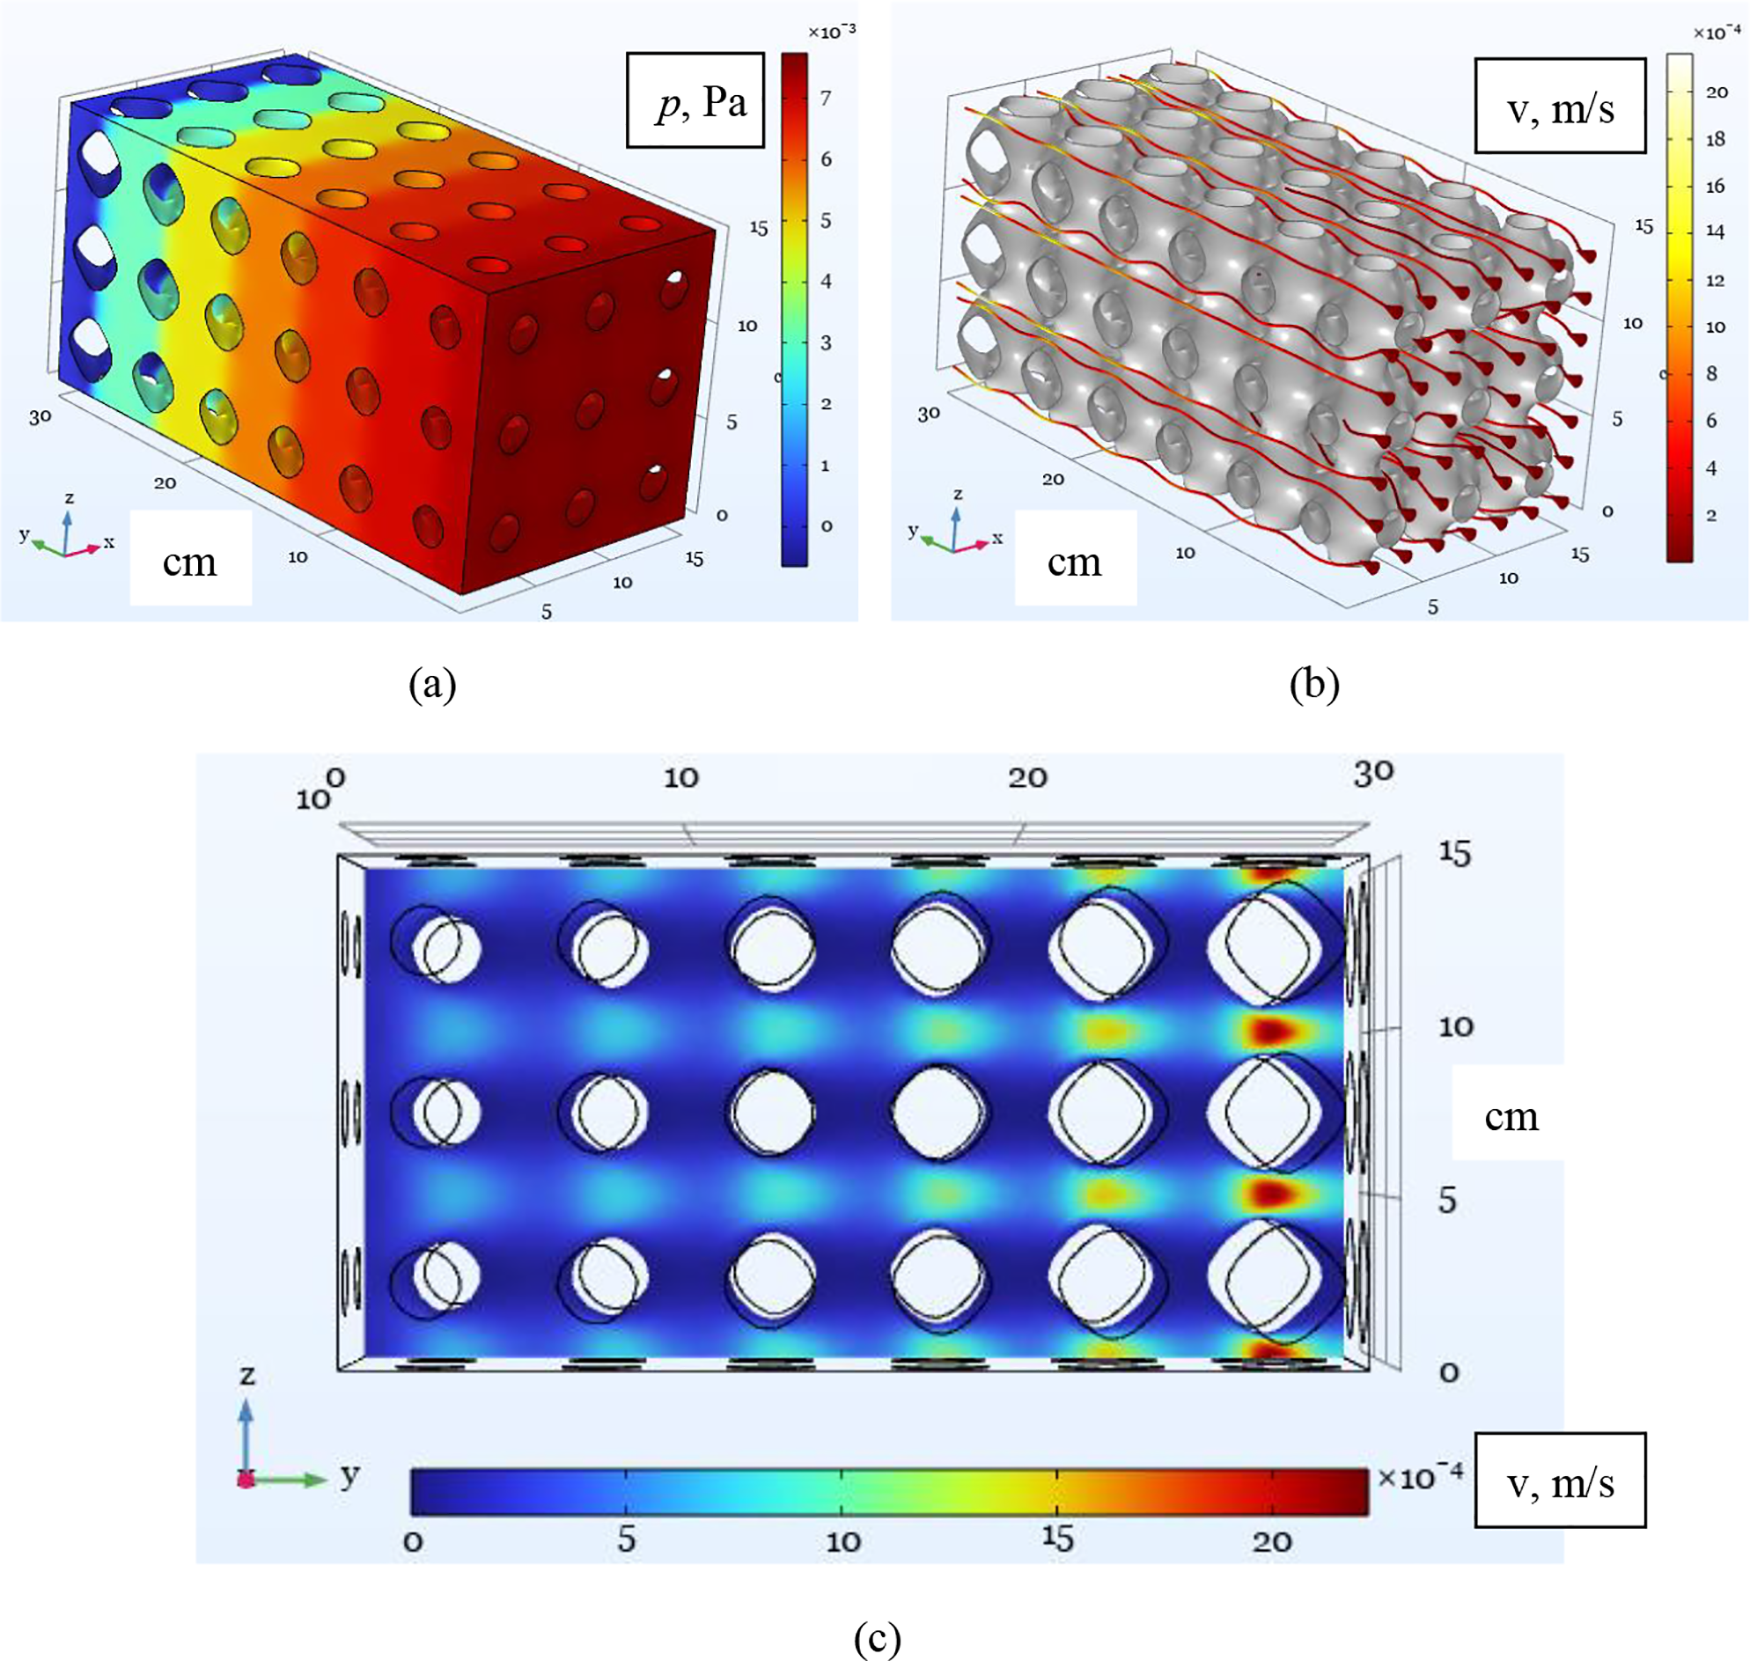
Figure 4: Numerical simulation of fluid flow through a porous medium performed within the framework of a microscopic description given by Eqs. (7), (8): the pressure field (a), the velocity streamlines (b), and the velocity magnitude shown in the cross-section x = 5 (c) for fluid seeping through sample #1. The input flow velocity is vin = 10–4 m/s
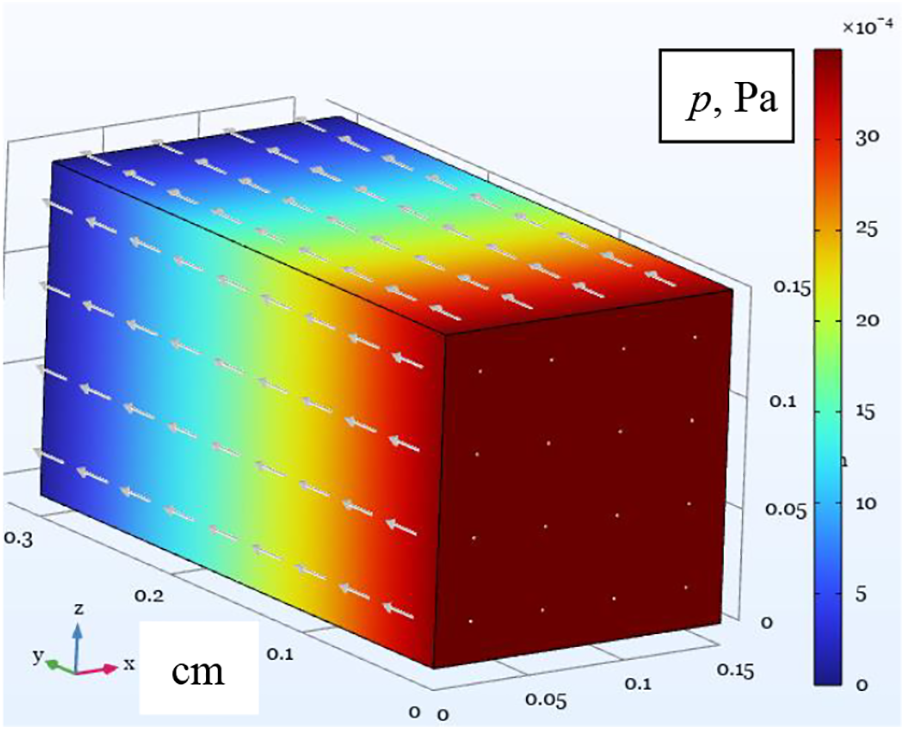
Figure 5: Numerical simulation of fluid flow through a porous medium performed within the framework of a macroscopic description given by Eq. (10): pressure field for fluid seeping through sample #1. The input flow velocity is uin = ε·10–4 m/s
6 Numerical Results for Microfluidic Samples
To grow tissue in a perfusion bioreactor, the sample must have a characteristic pore size of about hundreds of microns. In this case, the nutrient solution flow through the pores of the scaffold occurs under microfluidics conditions. Let us reduce sample #1 by 100 times (1.5 mm × 3.0 mm × 1.5 mm). In this case, the unit cell of the matrix is reduced to 500 µ, and the characteristic size of the pore itself varies from 200 to 300 µ. A pore size of 100 to 1000 µ is considered to be the working range for tissue growth. The mathematical formulation of the problem is exactly the same as above.
Fig. 6 presents a practical result calculated for microfluidic sample #1. The figure shows the dependence of the pressure drop that must be created in the sample to achieve the flow velocity at the entrance to the scaffold.
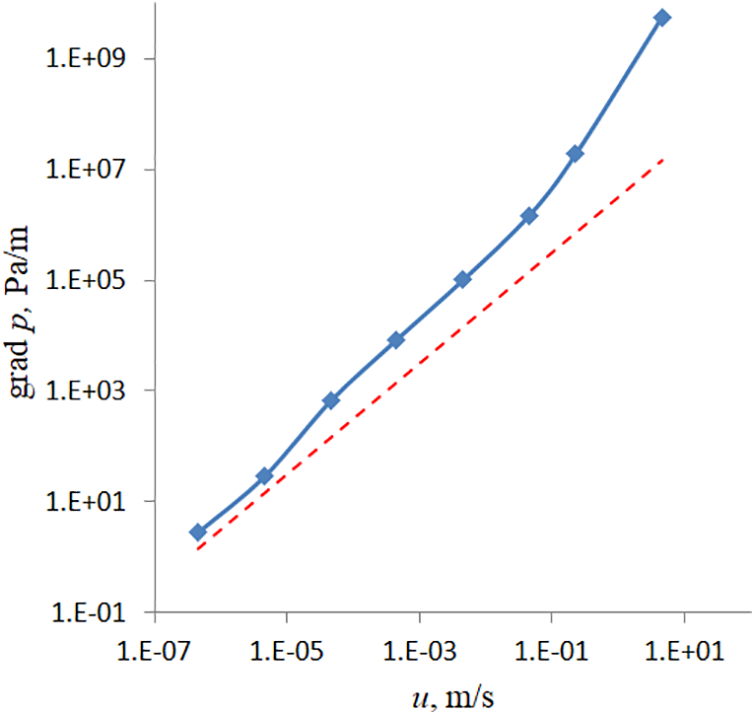
Figure 6: Variation of the specific pressure drop from the inlet fluid velocity calculated within the microscopic (solid line) and macroscopic description based on Darcy’s law (dashed line)
One can see from the figure that the Darcy model corresponds to a proportional relationship (dashed line). However, a microfluidic sample with a porosity gradient in the direction of pumping behaves in a more complex manner. At low Reynolds numbers, the dependence follows Darcy’s law. But starting from the value of about 10–5 m/s, one can observe a deviation toward increasing the pressure drop. Obviously, this is a price to pay for a more complex (biomimetic) structure of the solid matrix.
Let us consider the distribution of shear stresses in the pores of a microfluidic sample calculated on the walls of a solid matrix. The concept of a functionally graded material implies that the conditions for fluid filtration vary across space. It allows us to tune the field of shear stresses. As is known, the tensile forces of a particular medium element, determined by the shear stress at a given point, have a significant effect on the cell. In particular, the probability of cell division is very sensitive to this effect. The work [21] notes that low shear stresses stimulate cells to divide. There is even a stress value that ensures the most intense tissue growth (about 5·10–5 Pa). For different groups of cells, an increase in the division rate from 2 to 6 times is observed. However, the effect of shear stresses is not linear: with significant stretching, the fluid rather suppresses cell activity. When the stress reaches 5.7·10–2 Pa, cells begin to die.
Fig. 7 shows the distribution of shear stresses calculated on the walls of the solid matrix of a microfluidic sample at a typical inlet velocity of pumping solution through a perfusion bioreactor for tissue growth. As we can see from the figure, specifying the architecture of the solid matrix can determine the distribution of shear stresses in the sample. Therefore, the researcher can indirectly control the tissue growth conditions in different scaffold parts. The structure of the solid matrix becomes a crucial aspect of external control of processes in a bioreactor. Note also that the distribution of shear stresses depends not only on the architecture of the matrix but also on the filtration rate of the solution. The latter becomes a parameter that the researcher can directly change during the technological process.
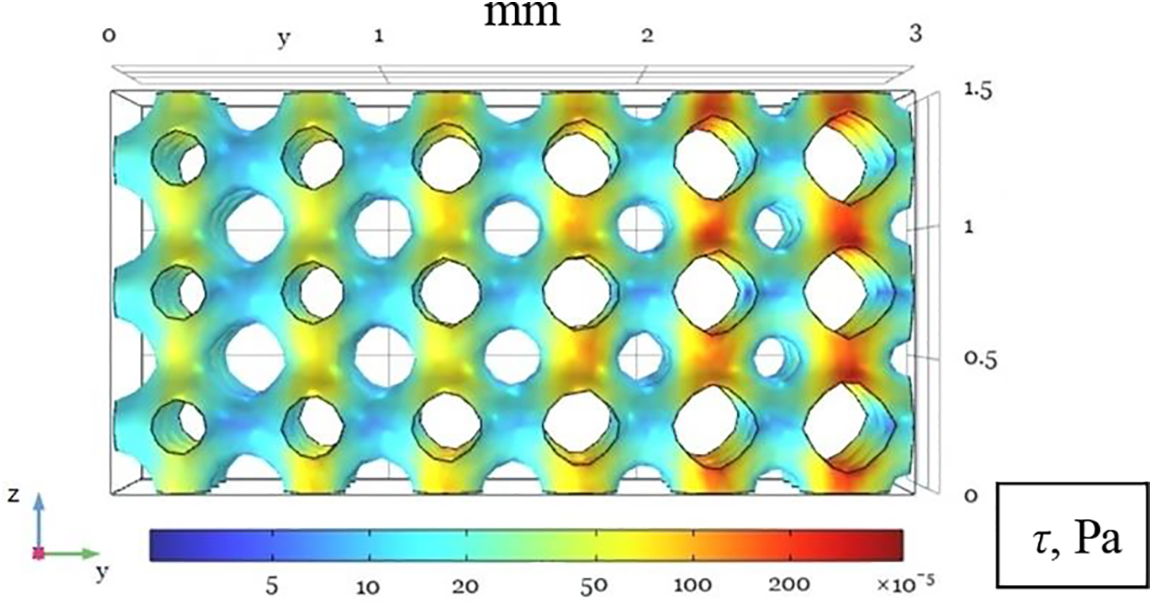
Figure 7: Distribution of viscous shear stresses τ on the solid matrix surface shown in the yz-projection. The input flow velocity is vin = 10–5 m/s. The flow direction is from left to right
In this work, we numerically investigated the hydrodynamic properties of two porous matrices of artificial origin. Porous materials constructed using the TPMS approach make it possible to change the topology of pores in a sample with precise control of the porosity coefficient value. We have shown that the hydrodynamic properties of a sample can be studied not only within the framework of a microscopic description but also using the averaged Darcy or Forchheimer filtration equations. It was shown that the field of tangential stresses in the studied samples varies significantly along the flow, which makes it possible to control the tissue growth conditions.
Acknowledgement: We would like to thank Prof. V. Silberschmidt for useful comments and stimulating discussions on the topic of this work.
Funding Statement: The authors gratefully acknowledge financial support under the Mega-Grants Program, contract No. 075-15-2021-578 of May 31, 2021, hosted by Perm National Research Polytechnic University.
Author Contributions: Conceptualization, D.B. and M.T.; software, R.S.; validation, R.S. and D.B.; numerical study, R.S. and N.E.; supervision, D.B.; writing—original draft preparation, D.B. and N.E.; writing—review and editing, D.B.; funding acquisition, M.T. All authors reviewed the results and approved the final version of the manuscript.
Availability of Data and Materials: The data that support the findings of this study are available from the corresponding author upon reasonable request.
Conflicts of Interest: The authors declare that they have no conflicts of interest to report regarding the present study.
References
1. Bracaglia LG, Smith BT, Watson E, Arumugasaamy N, Mikos AG, Fisher JP. 3D printing for the design and fabrication of polymer-based gradient scaffolds. Acta Biomater. 2017;56:3–13. doi:https://doi.org/10.1016/j.actbio.2017.03.030. [Google Scholar] [PubMed] [CrossRef]
2. Babilotte J, Guduric V, Le Nihouannen D, Naveau A, Fricain JC, Catros S. 3D printed polymer-mineral composite biomaterials for bone tissue engineering: fabrication and characterization. J Biomed Mater Res Part B, Appl Biomater. 2019;107(8):2579–95. doi:https://doi.org/10.1002/jbm.b.34348. [Google Scholar] [PubMed] [CrossRef]
3. Varma M, Kandasubramanian B, Ibrahim S. 3D printed scaffolds for biomedical applications. Mater Chem Phys. 2020;255:123642. doi:https://doi.org/10.1016/j.matchemphys.2020.123642. [Google Scholar] [CrossRef]
4. Zheng X, Li N, Xu Y, Zhang C, Ouyang Y, Meng D. A bilayer collagen scaffold with bevacizumab stabilizes chondrogenesis and promotes osteochondral regeneration. Mater Design. 2022;221:110981. doi:https://doi.org/10.1016/j.matdes.2022.110981. [Google Scholar] [CrossRef]
5. Ghassemi T, Shahroodi A, Ebrahimzadeh MH, Mousavian A, Movaffagh J, Moradi A. Current concepts in scaffolding for bone tissue engineering. Arch Bone Joint Surg. 2018;6(2):90–9. doi:https://doi.org/10.22038/ABJS.2018.26340.1713. [Google Scholar] [CrossRef]
6. Liu Y, Rath B, Tingart M, Eschweiler J. Role of implants surface modification in osseointegration: a systematic review. J Biomed Mater Res Part A. 2020;108(3):470–84. doi:https://doi.org/10.1002/jbm.a.36829. [Google Scholar] [PubMed] [CrossRef]
7. Mertsching H, Schanz J, Steger V, Schandar M, Schenk M, Hansmann J, et al. Generation and transplantation of an autologous vascularized bioartificial human tissue. Transplant. 2009;88(2):203–10. doi:https://doi.org/10.1097/TP.0b013e3181ac15e1. [Google Scholar] [PubMed] [CrossRef]
8. Gibson L. Cellular solids. MRS Bull. 2003;28(4):270–4. doi:https://doi.org/10.1557/mrs2003.79. [Google Scholar] [CrossRef]
9. Zhao S, Li S, Wang S, Hou W, Li Y, Zhang LC, et al. Compressive and fatigue behavior of functionally graded Ti-6Al-4V meshes fabricated by electron beam melting. Acta Mater. 2018;150:1–15. doi:https://doi.org/10.1016/j.actamat.2018.02.060. [Google Scholar] [CrossRef]
10. Derby B. Printing and prototyping of tissues and scaffolds. Sci. 2012;338(6109):921–6. doi:https://doi.org/10.1126/science.1226340. [Google Scholar] [PubMed] [CrossRef]
11. Kanwar S, Vijayavenkataraman S. Design of 3D printed scaffolds for bone tissue engineering: a review. Bioprint. 2021;24:e00167. doi:https://doi.org/10.1016/j.bprint.2021.e00167. [Google Scholar] [CrossRef]
12. Bargmann S, Klusemann B, Markmann J, Schnabel JE, Schneider K, Soyarslan C, et al. Generation of 3D representative volume elements for heterogeneous materials: a review. Prog Mater Sci. 2018;96:322–84. doi:https://doi.org/10.1016/j.pmatsci.2018.02.003. [Google Scholar] [CrossRef]
13. Liu F, Mao Z, Zhang P, Zhang DZ, Jiang J, Ma Z. Functionally graded porous scaffolds in multiple patterns: new design method, physical and mechanical properties. Mater Design. 2018;160:849–60. doi:https://doi.org/10.1016/j.matdes.2018.09.053. [Google Scholar] [CrossRef]
14. Zhianmanesh M, Varmazyar M, Montazerian H. Fluid permeability of graded porosity scaffolds architectured with Minimal Surfaces. ACS Biomater Sci Eng. 2019;5(3):1228–37. doi:https://doi.org/10.1021/acsbiomaterials.8b01400. [Google Scholar] [PubMed] [CrossRef]
15. Elenskaya N, Tashkinov M. Modeling of deformation behavior of gyroid and I-WP polymer lattice structures with a porosity gradient. Proc Struct Integr. 2021;32:253–60. doi:https://doi.org/10.1016/j.prostr.2021.09.036. [Google Scholar] [CrossRef]
16. Elenskaya N, Tashkinov M, Silberschmidt V. Numerical modeling of the deformation behavior of polymer lattice structures with a density gradient based on additive technologies. Vestnik St. Petersb Univ Math. 2022;9(4):443–52. doi:https://doi.org/10.1134/S1063454122040045. [Google Scholar] [CrossRef]
17. Zhang J, Chen X, Sun Y, Yang J, Chen R, Xiong Y, et al. Design of a biomimetic graded TPMS scaffold with quantitatively adjustable pore size. Mater Design. 2022;218:110665. doi:https://doi.org/10.1016/j.matdes.2022.110665. [Google Scholar] [CrossRef]
18. Dong Z, Zhao X. Application of TPMS structure in bone regeneration. Eng Regen. 2021;2:154–62. doi:https://doi.org/10.1016/j.engreg.2021.09.004. [Google Scholar] [CrossRef]
19. Wohlgemuth M, Yufa N, Hoffman J, Thomas EL. Triply periodic bicontinuous cubic microdomain morphologies by symmetries. Macromol. 2001;34(17):6083–9. doi:https://doi.org/10.1021/ma0019499. [Google Scholar] [CrossRef]
20. Ambu R, Morabito A. Porous scaffold design based on minimal surfaces: development and assessment of variable architectures. Symmetry. 2018;10(9):361. doi:https://doi.org/10.3390/sym10090361. [Google Scholar] [CrossRef]
21. Porter B, Zauel R, Stockman H, Guldberg R. computational modeling of media flow through scaffolds in a perfusion bioreactor. J Biomech. 2005;38(3):543–9. doi:https://doi.org/10.1016/j.jbiomech.2004.04.011. [Google Scholar] [PubMed] [CrossRef]
22. Zhao F, Vaughan T, McNamara L. Quantification of fluid shear stress in bone tissue engineering scaffolds with spherical and cubical pore architectures. Biomech Model Mechanobiol. 2016;15(3):561–77. doi:https://doi.org/10.1007/s10237-015-0710-0. [Google Scholar] [PubMed] [CrossRef]
23. Zhao F, Xiong Y, Ito K, van Rietbergen B, Hofmann S. Porous geometry guided micro-mechanical environment within scaffolds for cell mechanobiology study in bone tissue engineering. Front Bioeng Biotechnol. 2021;9:736489. doi:https://doi.org/10.3389/fbioe.2021.736489. [Google Scholar] [PubMed] [CrossRef]
24. Lappa M. Organic tissues in rotating bioreactors: fluid-mechanical aspects, dynamic growth models and morphological evolution. Biotechnol Bioeng. 2003;84(5):518–32. doi:https://doi.org/10.1002/bit.10821. [Google Scholar] [PubMed] [CrossRef]
25. Lappa M. A novel approach for the recognition, definition and characterization of the critical links between fluid-dynamics and soft tissue biomechanics. In: Greco GN, editor. Tissue Engineering Research Trends. New York, USA: Nova Science Publishers Inc.; 2008. p. 1–47. [Google Scholar]
26. Krasnyakov I, Bratsun D, Pismen L. Mathematical modelling of epithelial tissue growth. Russ J Biomech. 2020;24(4):375–88. doi:https://doi.org/10.15593/RJBiomech/2020.4.03. [Google Scholar] [CrossRef]
27. Bratsun D, Krasnyakov I, Pismen L. Biomechanical modeling of invasive breast carcinoma under a dynamic change in cell phenotype: collective migration of large groups of cells. Biomech Model Mechanobiol. 2020;19(2):723–43. doi:https://doi.org/10.1007/s10237-019-01244-z. [Google Scholar] [PubMed] [CrossRef]
28. Bratsun D, Krasnyakov I. Study of architectural forms of invasive carcinoma based on the measurement of pattern complexity. Math Model Nat Phenom. 2022;17:15. doi:https://doi.org/10.1051/mmnp/2022013. [Google Scholar] [CrossRef]
29. Jungreuthmayer C, Jaasma MJ, Al-Munajjed AA, Zanghellini J, Kelly DJ, O’Brien FJ. Deformation simulation of cells seeded on a collagen-GAG scaffold in a flow perfusion bioreactor using a sequential 3D CFD-elastostatics model. Med Eng Phys. 2009;31(4):420–7. doi:https://doi.org/10.1016/j.medengphy.2008.11.003. [Google Scholar] [PubMed] [CrossRef]
30. Mokhtari-Jafari F, Amoabediny G, Haghighipour N, Zarghami R, Saatchi A, Akbari J, et al. Mathematical modeling of cell growth in a 3D scaffold and validation of static and dynamic cultures. Eng Life Sci. 2016;16(3):290–8. doi:https://doi.org/10.1002/elsc.201500047. [Google Scholar] [CrossRef]
31. Maes F, Claessens T, Moesen M, van Oosterwyck H, van Ransbeeck P, Verdonck P. Computational models for wall shear stress estimation in scaffolds: a comparative study of two complete geometries. J Biomech. 2012;45(9):1586–92. doi:https://doi.org/10.1016/j.jbiomech.2012.04.015. [Google Scholar] [PubMed] [CrossRef]
32. Cho H, Jeong N, Sung H. Permeability of microscale fibrous porous media using the lattice Boltzmann method. Int J Heat Fluid Flow. 2016;44:435–43. doi:https://doi.org/10.1016/j.ijheatfluidflow.2013.07.013. [Google Scholar] [CrossRef]
33. Bratsun D, Siraev R. Controlling mass transfer in a continuous-flow microreactor with a variable wall relief. Int Commun Heat Mass. 2020;113:104522. doi:https://doi.org/10.1016/j.icheatmasstransfer.2020.104522. [Google Scholar] [CrossRef]
34. Nield D, Bejan A. Convection in porous media. New York: Springer Cham; 2017. doi:https://doi.org/10.1007/978-3-319-49562-0. [Google Scholar] [CrossRef]
35. Nield D, Kuznetsov A, Barletta A, Celli M. Local thermal non-equilibrium and heterogeneity effects on the onset of double-diffusive convection in an internally heated and soluted porous medium. Transport Porous Med. 2015;109:393–409. doi:https://doi.org/10.1007/s11242-015-0525-6. [Google Scholar] [CrossRef]
36. Nield D, Kuznetsov A, Barletta A, Celli M. The onset of convection in a sloping layered porous medium: effects of local thermal non-equilibrium and heterogeneity. Transport Porous Med. 2016;114:87–97. doi:https://doi.org/10.1007/s11242-016-0728-5. [Google Scholar] [CrossRef]
37. Coutelieris F, Delgado J. Transport processes in porous media. New York: Springer Cham; 2012. doi:https://doi.org/10.1007/978-3-642-27910-2. [Google Scholar] [CrossRef]
38. van Duijn C, Cao X, Pop I. Two-phase flow in porous media: dynamic capillarity and heterogeneous media. Transport Porous Med. 2016;114:283–308. doi:https://doi.org/10.1007/s11242-015-0547-0. [Google Scholar] [CrossRef]
39. Boussinot G, Apel M. Phase field and analytical study of mushy zone solidification in a static thermal gradient: from dendrites to planar front. Acta Mater. 2017;122:310–21. doi:https://doi.org/10.1016/j.actamat.2016.09.053. [Google Scholar] [CrossRef]
40. Alexandrov D, Alexandrova I, Ivanov A, Malygin A, Nizovtseva I. Nonlinear analysis of the stability of solidification with a mushy zone. Russ Metall. 2014;2014(8):606–17. doi:https://doi.org/10.1134/S0036029514080035. [Google Scholar] [CrossRef]
41. Bratsun D, Shi Y, Eckert K, de Wit A. Control of chemo-hydrodynamic pattern formation by external localized cooling. Europhys Lett. 2005;69(5):746–52. doi:https://doi.org/10.1209/epl/i2004-10417-9. [Google Scholar] [CrossRef]
42. Bratsun D, de Wit A. Control of chemoconvective structures in a slab reactor. Tech Phys. 2008;53(2):146–53. doi:https://doi.org/10.1134/S1063784208020023. [Google Scholar] [CrossRef]
43. Siraev R, Ilyushin P, Bratsun D. Mixing control in a continuous-flow microreactor using electro-osmotic flow. Math Model Nat Phenom. 2021;16:49. doi:https://doi.org/10.1051/mmnp/2021043. [Google Scholar] [CrossRef]
44. Ward JC. Turbulent flow in porous media. J Hydraul Eng. 1964;90:1–12. doi:https://doi.org/10.1111/j.1745-6584.2001.tb02353.x. [Google Scholar] [PubMed] [CrossRef]
Cite This Article
 Copyright © 2024 The Author(s). Published by Tech Science Press.
This work is licensed under a Creative Commons Attribution 4.0 International License , which permits unrestricted use, distribution, and reproduction in any medium, provided the original work is properly cited.
 Downloads
 Citation Tools