
 Submit a Paper
 Propose a Special lssue
 Open Access
ARTICLE
A Gasification Technology to Combine Oil Sludge with Coal–Water Slurry: CFD Analysis and Performance Determination
1 School of Petroleum Engineering, Changzhou University, Changzhou, China
2 Sinopec East China Petroleum Engineering Company, Nanjing, China
* Corresponding Author: Hailong Yu. Email:
Fluid Dynamics & Materials Processing 2024, 20(7), 1481-1498. https://doi.org/10.32604/fdmp.2024.047092
Received 24 October 2023; Accepted 30 January 2024; Issue published 23 July 2024
 View Full Text
 Download PDF
Abstract
The development of more environment-friendly ways to dispose of oil sludge is currently regarded as a hot topic. In this context, gasification technologies are generally seen as a promising way to combine oil sludge with coal–water slurry (CWS) and generate resourceful fuel. In this study, a novel five-nozzle gasifier reactor was analyzed by means of a CFD (Computational fluid dynamic) method. Among several influential factors, special attention was paid to the height-to-diameter ratio of the gasifier and the mixing ratio of oil sludge, which are known to have a significant impact on the flow field, temperature distribution and gasifier performances. According to the numerical results, the optimal height-to-diameter ratio and oil mixing ratio are about 2.4:1 and 20%, respectively. Furthermore, the carbon conversion rate can become as high as 98.55% with the hydrolysis rate reaching a value of 53.88%. The consumption of raw coal and oxygen is generally reduced, while the effective gas production is increased to 50.93 mol/%.Keywords
The production of oil sludge has significantly increased from the exploration phase to petroleum refining, posing a significant environmental challenge [1,2]. Oil sludge consists of complex chemical compositions, including high concentrations of hydrocarbons, heavy metals, and various harmful substances, such as benzene, phenol, anthracene, and polycyclic aromatic hydrocarbons (PAHs) [3]. Therefore, the effective disposal of oil sludge is vital in reducing environmental pollution and associated health risks [4–7].
Currently, the primary methods for disposing of oil sludge encompass incineration [8], solidification and stabilization [9], solvent extraction [10], ultrasonic treatment [11], pyrolysis [12], photocatalysis [13], chemical treatment [14], and biodegradation [15]. These technologies are designed to reduce or eliminate hazardous components, thereby mitigating environmental and health hazards. However, traditional methods such as landfill and solidification may lead to secondary pollution. In contrast, emerging techniques like microbial and plasma treatments require sustained operational capabilities. On the other hand, gasifier treatment technology stands out as relatively mature [16–19]. The gasification process, operating at high internal temperatures around 1300°C, can effectively prevent the formation of dioxins, furans, and other harmful substances.
Conventional gasification processes face challenges in directly disposing of oil sludge, mainly due to its distinct composition compared to coal [20,21]. This difference results in varied gasification properties, such as maximum flame temperature, syngas composition, and carbon conversion rates. To address this issue, a technique involving the mixture of coal, additives, and water to create an oil sludge-coal-water slurry (OS-CWS) has been developed. This approach allows the use of conventional gasification processes for oil sludge treatment. The resulting slurry is suitable for gasification, producing efficient gas that can be transformed into pure hydrogen, methanol, and synthetic natural gas (SNG) [22]. Numerical simulation plays a pivotal role in optimizing the gasification process. For instance, Guo et al. [23] investigated how the oxygen-to-carbon ratio affects particle size distribution during gasification. Watanabe et al. [24] studied the impact of the oxygen-to-coal ratio on synthesis gas composition, carbon conversion rate, and cold gas efficiency. Chen et al. [25] focused on understanding the effects of adding 20% oil sludge on maximum flame temperature and synthesis gas composition. Moreover, Chang et al. [26] examined the influence of the injection angle of the coal-water slurry on synthesis gas yield and average furnace temperature.
Multi-jet gasifiers represent promising approaches in gasification technology [27,28]. However, there is room for improvement in their energy utilization efficiency. The five-nozzle gasifier proposed by the study can effectively address these efficiency problems. It enhances the dispersion performance of coal-water slurry while maintaining the same processing capacity. Additionally, increased material circulation within the gasifier prolongs the residence time of the material, facilitating improved heat and mass transfer processes. Achieving the optimal height-to-diameter ratio in the gasifier is crucial, as an excessively high ratio can lead to clogging due to lower slag outlet temperatures, while a low ratio may adversely affect gasification efficiency. The stability of coal-water slurry is crucial for the effective storage and transport of oil sludge-water-coal slurry, as highlighted in studies [29,30]. These studies primarily focus on the impact of varying additives on the slurry’s stability. Given that oil sludge is rich in petroleum hydrocarbon organic matter, alterations in the quantity of additives can have a significant effect on the composition of the coal-water slurry, as well as on the characteristics of the resulting gasification products.
In this study, the PDF non-premixed combustion model was used. The pyrolysis process of combustible particles was addressed using the dual-competition pyrolysis model. The turbulence was modeled using the Realizable k-ε model. The radiation characteristics of the gasifier were simulated using the P-1 radiation model. The model’s validity was confirmed by comparing its predictions with industrial data. We studied substances’ fluid flow, temperature distribution, and molar fraction distribution through simulation and analysis under different operating conditions, including variations in aspect ratio and other oil sludge mixing ratios. This provides a theoretical basis for the practical application and improvement of the project in its next phase.
2 Model Description and Simulation Method
For the oil sludge-coal-water slurry gasification process in the gasifier, the complex physical and chemical processes mainly include slurry atomization, droplet evaporation, coal devolatilization, and both non-homogeneous and homogeneous reactions. This process also involves intricate fluid dynamics, heat transfer, and mass transfer processes [31]. Therefore, it is essential to develop a comprehensive numerical model to accurately simulate the gasification process and optimize its efficiency.
After the oil sludge-water-coal slurry is fed into the gasifier, it is atomized into fine droplets by the high-speed pure oxygen jet stream. For simplification, the oil sludge-water-coal slurry is considered fully atomized, and the droplet particle size distribution is assumed to be consistent with the coal powder in the slurry. The trajectory of coal particles is tracked using the random trajectory model in the Lagrangian coordinate system. This model also considers the coupling effects between the discrete phase (coal particles) and the continuous phase [32]. The equations for controlling particle motion in the Lagrangian coordinate system are as follows:
where
2.2 Droplet Vaporization and Coal Pyrolysis
After atomization, the oil sludge-coal-water slurry droplets are quickly heated. When the temperature of the droplet reaches the gasification temperature, the droplet begins to evaporate and continues until the droplet temperature reaches the boiling point. The volumetric vapor partial pressure and the vapor saturation pressure on the particle surface determine the evaporation rate.
The coal pyrolysis process is assumed to include two continuous steps: coal volatilization and volatile decomposition. However, due to the rapid temperature increase, the entire pyrolysis process of oil-coal can transpire almost instantaneously [33]. This study selects the dual-competition model to describe volatile precipitation in the gasifier. The dual-competition pyrolysis model employs two parallel equations to depict the precipitation of volatile fractions. Eq. (3) predominates at lower temperatures, with the corresponding kinetic reaction rate being
The emission rate of the volatile matter:
where
2.3 Combustion in the Gas Phase
This study uses the Mixture Fraction-Probability Density Function (Mixture Fraction/PDF) model [34] of the non-premixed combustion model to simulate the gasification process in the gasifier. It is based on the interplay between chemical reactions and turbulent flow and applies probability theory to simplify the combustion problem. In the non-preheated mixed combustion model, the transient thermochemical state of the fluid within the computational domain correlates with the mixing fraction, denoted as f, which controls the chemical reaction within the system. A single mixing fraction model is adopted, consisting of the fuel, oxidizer, and products. With the mixing fraction f, it is represented as in Eq. (6):
where Zi is the mass fraction of element I, Zi, o and Zi, fuel is referred to as the values of oxidant and fuel at the inlet, respectively.
In the gasifier, coke’s combustion and gasification reactions include combustion reactions of oil-coal coke, water-gas, hydrogenation, etc. Compared to the combustion reactions of volatiles and particles, the gasification rate of coke is relatively slow. The coke gasification reaction is crucial in controlling the conversion of fixed carbon to gas and determining the whole gasification process.
Eqs. (7) and (8) describe the diffusion-controlled and power-controlled combustion equations. When the operating temperature is high, the explosion of residual coke within pulverized coal particles is predominantly dominated by the diffusion-controlled combustion equation. Conversely, under lower temperatures, the power-controlled combustion equation primarily influences the explosion of residual coke in the pulverized coal particles. Subsequently, the coke combustion rate is determined by:
where R1 is the diffusion rate, TP is the temperature of discrete particles, T∞ is the temperature of the surrounding gas, R2 is the rate of chemical reaction kinetics, C1 and C2 are the prefactors, E is the activation energy, and dp is the diameter of discrete particles.
2.5 Governing Equations and Solution Methods
We solved the time-averaged steady-state Navier-Stokes equations, energy conservation, and gas transport equations to emulate the gas-phase turbulence occurring within the gasifier. The Realizable k-ε model describes the turbulent behavior in the gasifier. The radiation heat transfer is defined by the P-1 model [35]. The turbulence model, energy conservation equation, and Standard k-ε model equation are as follows [36]:
Continuity equation:
where ρ is the density of the fluid, t is the time of fluid motion, and u is the velocity vector.
Momentum equation:
where
where
Standard k-ε model equation:
where Gk is the turbulence kinetic energy, Gb is the turbulence kinetic energy, YM is the contribution of the fluctuating dilatation in compressible turbulence to the overall dissipation rate.
where
where μt is the turbulent viscosity, σk and σε are the turbulent Prandtl numbers for k and ε, respectively. C1ε, C2ε, Cμ, σk, and σε follow default values of 1.44, 1.92, 0.09, 1.0, and 1.3, respectively, which are most used in the model calculation.
Conservation of energy:
where λ is the thermal conductivity of the fluid, Sh is the internal heat source, Sh = 0, Φ is the thermal energy converted from mechanical energy under the influence of viscous forces, and P∇U is the work done by surface forces on the fluid.
The gas-phase two-phase flow and reaction process was numerically solved using Fluent 2020R2 CFD code, incorporating user-defined functions (UDFs) to accommodate multiphase reaction models. The solver used is a Pressure-Based Solver, utilizing the SIMPLE algorithm for pressure-velocity coupling. To ensure stable coupling with velocity, we applied the PRESTO! discretization scheme for pressure. We implemented the first-order upwind equation format to enhance computational precision and efficiency for other physical quantities (e.g., velocity, turbulent kinetic energy, and energy).
3 Simulation Grid and Condition
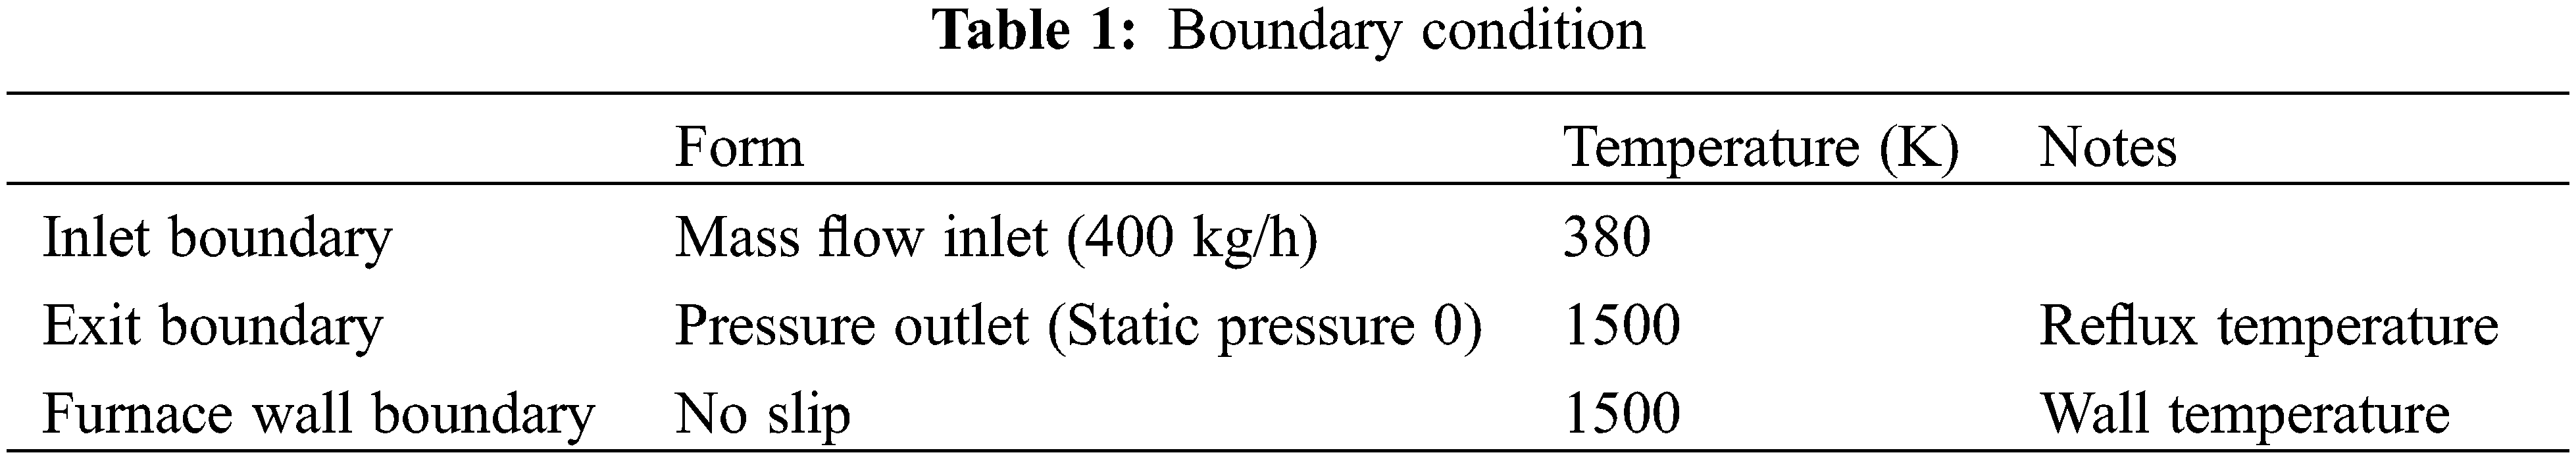
In the computational domain representing the entire gasifier, the operational pressure is set at 4 MPa and gravitational acceleration at 9.8 m/s2. All five nozzle inlets are configured to use mass flow rate inlets. The gasifier’s thermal load determines the total inflow of oil sludge-coal-water slurry, which is set at 400 kg/h, and pure oxygen is introduced at a 1:1 oxygen-to-carbon atomic ratio. The inlet temperatures for both fuel and oxidizer are maintained at 380 K. Regarding outlet boundary conditions, they are designated as pressure outlets with a reflux temperature of 1500 K. For tracking the droplets of oil sludge-coal-water slurry, the random trajectory model is utilized, and the particle size distribution is represented using the Rosin-Rammler expression. Other parameters are set to their default values, and supplementary boundary conditions are detailed in Table 1.
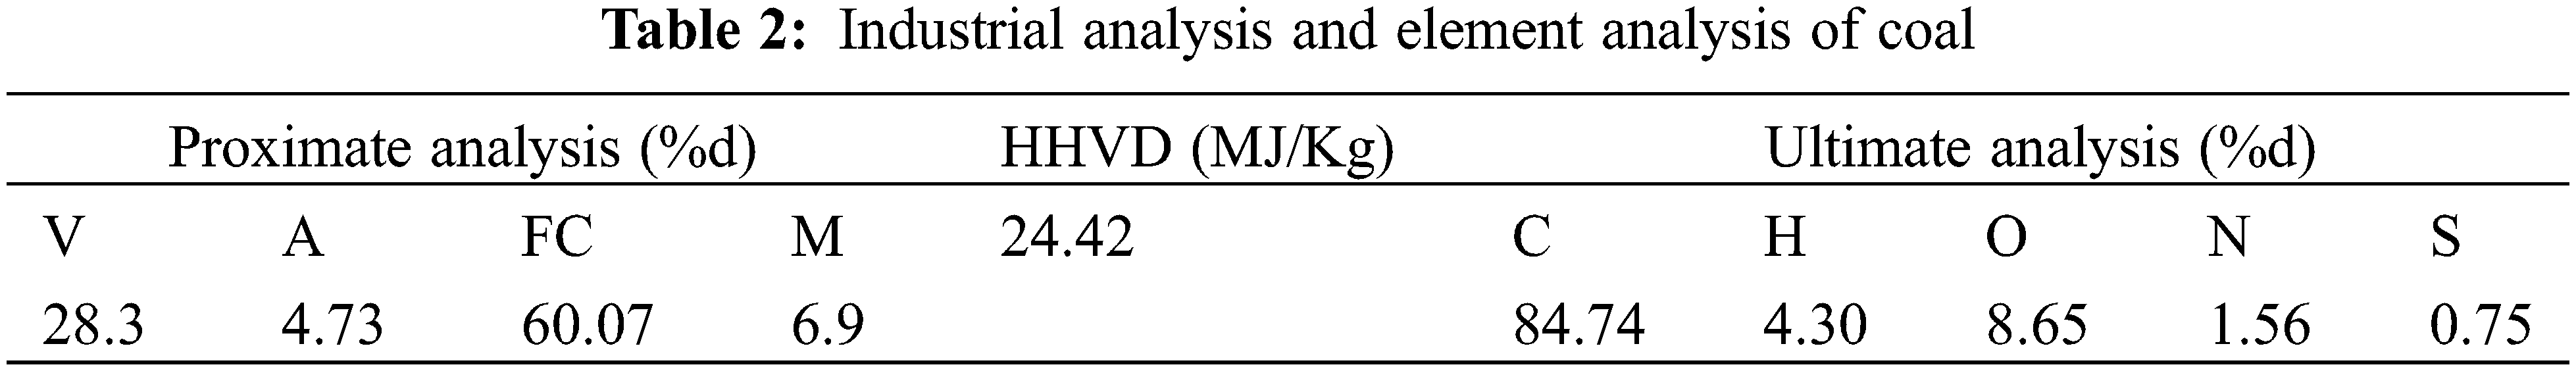
The Simulations are performed on a novel five-nozzle gasifier. The top coal slurry inflow rate is set at 200 kg/h, while each of the four side nozzles has a coal slurry inflow rate of 50 kg/h. Pure oxygen is employed as the oxidant for the gasification process. The gasifier is operating at an elevated pressure of 4 Mpa. All other parameters remain constant. The coal source is Shandong Liangzhuang bituminous coal, utilized in crafting the oil-adulterated slurry. A detailed industrial and elemental analysis of this coal is available in Table 2.
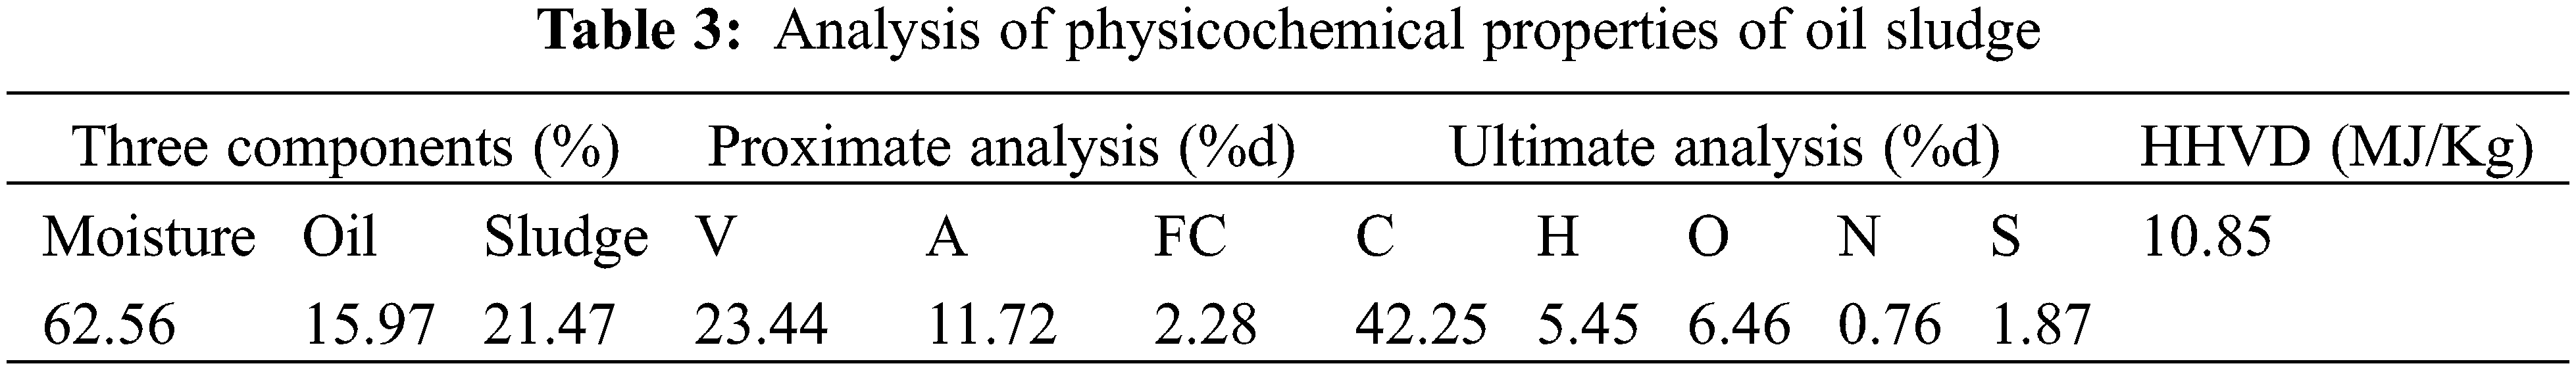
The selected oil sludge is generated from the sediment of a petrochemical refinery’s crude oil storage tank. Table 3 delineates its physicochemical attributes.
3.3 Simulation Grid and Numerical Solution
The gasifier geometry configuration and simulation grids are shown in Fig. 1. This research uses a cylindrical five-nozzle opposed gasifier with distinctive top and side nozzles [37]. The design includes four nozzle inlets evenly spaced around the circumference and one on the top, with an outlet positioned below. A comprehensive 3D model of the gasifier was developed using SolidWorks 3D modeling software. The model includes detailed specifications: a height of 1.0 m, an inner diameter of 0.5 m, a top nozzle inlet diameter of 0.012 m, and a furnace nozzle diameter of 0.006 m.
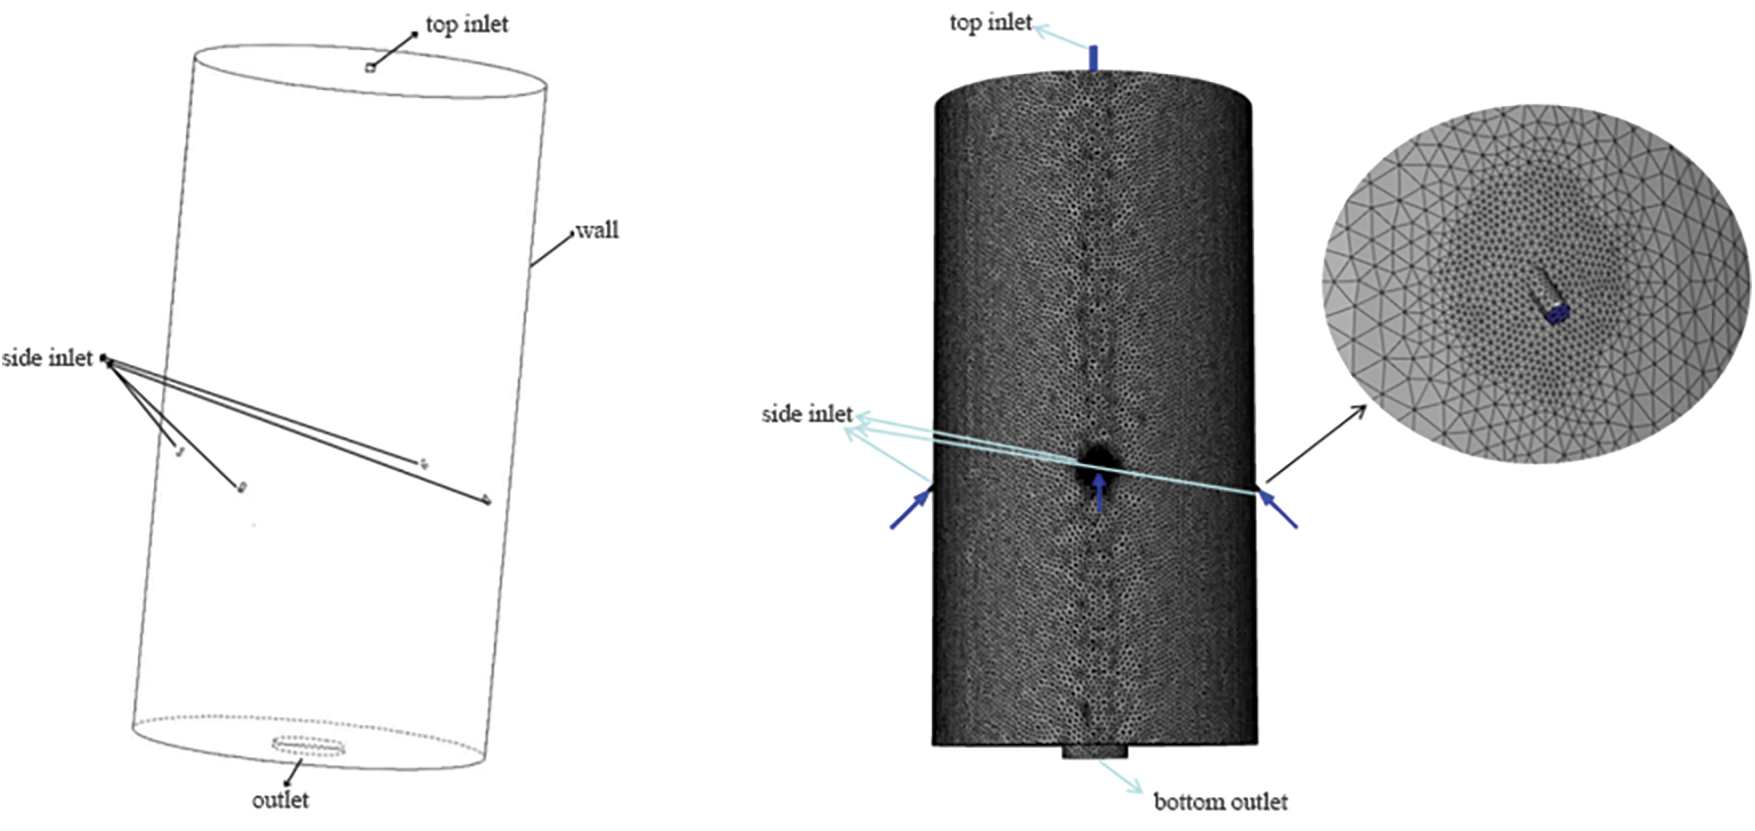
Figure 1: The gasifier geometry configuration and simulation grids
The 3-D model of the gasifier is imported into ICEM, where Part settings are applied to the inlet, outlet, and furnace walls. Parameters are adjusted to generate a tetrahedral mesh, with specific refinement at the five nozzles. The final mesh generated contains approximately 1.67 million elements, with mesh quality scores ranging from 0.42 to 1, indicating a high level of detail and accuracy.
The subsequent study investigated the gasifier at different aspect ratios (2.0:1, 2.4:1, 3.0:1) under high temperatures. Only the height of the gasifier varied, while other dimensions, such as nozzles, remained consistent. To ensure simulation reliability and mesh independence, the study selected a gasifier with an aspect ratio of 2:1 for evaluation, equivalent to a furnace height of 1 meter and an inner diameter of 0.5 meters. Adjustments to node distribution and mesh size resulted in three tetrahedral meshes with element numbers of 1.08 million, 1.67 million, and 2.68 million, respectively. Detailed results are presented in Table 4.
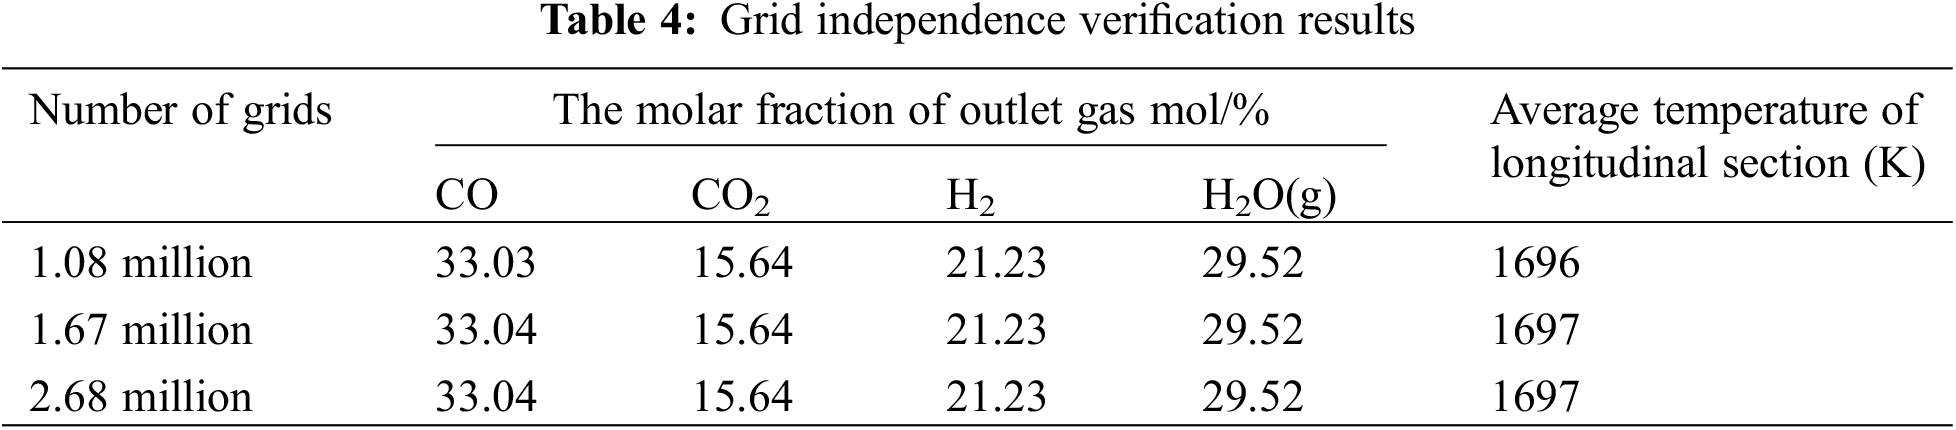
As indicated in the table, the results show minimal differences when simulations were done using three different mesh quantities. Only when the mesh quantity is 1.08 million is the outlet CO gas content lower by 0.01, and the average temperature on the longitudinal cross-section is lower by 1 K. When the mesh quantity exceeds 1.67 million, the calculation results remain consistent, demonstrating that mesh independence has been achieved. Consequently, this study opts for a mesh quantity of 1.67 million for all subsequent simulations and research efforts, optimizing the balance between accuracy and computational efficiency.
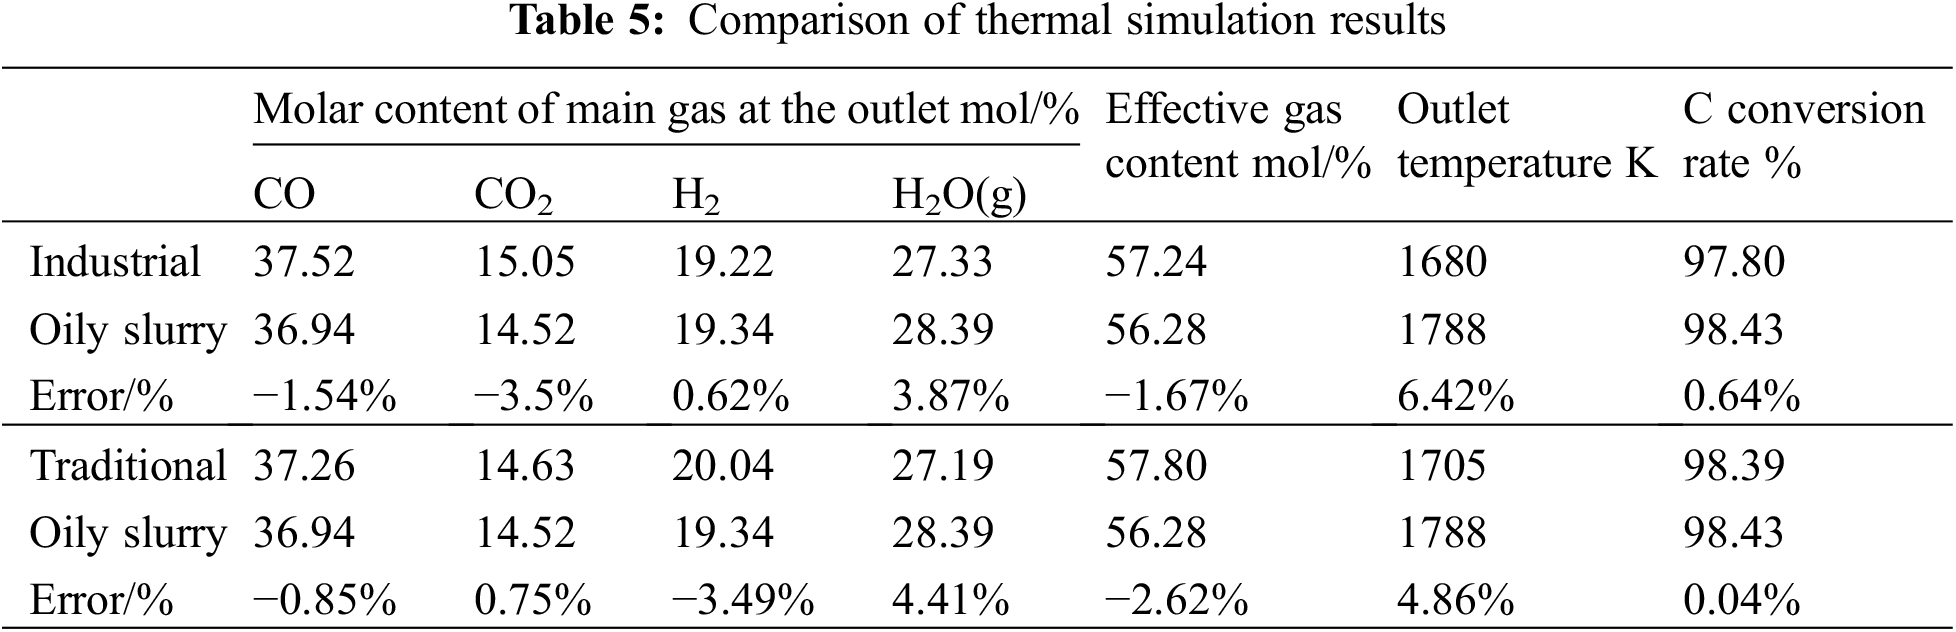
Considering that model validation is independent of the gasifier design and considering the current maturity and abundant industrial data available for Texaco gasifiers [38], this research selects a single-nozzle Texaco gasifier from a specific fertilizer plant for numerical model validation. The selected gasifier has a height of 6 meters and an inner diameter of 1.5 meters. Its upper part serves as the fuel inlet, while the bottom is the slag and wet coal gas outlet. It is designed to handle a rated coal slurry feed rate of 40 tons per hour, operating at an actual pressure of 6 MPa and a coal slurry concentration of 62%. Under the same operating conditions, gasification simulation calculations are conducted for oil-slurry coal and traditional water-coal slurry.
The simulation results for oil slurry coal provide data for four evaluation parameters at the gasifier outlet, including the main gas components (CO, CO2, H2, and H2O(g)), the effective molar fractions of CO and H2, the outlet temperature, and the carbon conversion rate. These data are compared with the results of the on-site industrial boiler operation [39] and traditional water-coal slurry simulation, as shown in Table 5. The analysis of these comparisons indicates that the overall errors are within an acceptable range. This outcome supports the feasibility of using the numerical model for slurry coal gasification, demonstrating its reliability and practical applicability.
4.1 Influence of Height-to-Diameter Ratio on Gasification Efficiency
The height-to-diameter ratio of the gasifier is a crucial factor, given its significant role in facilitating gasification reactions. With a constant inner diameter of 0.5 m, the heights of the gasifiers vary as 1.0, 1.2, and 1.5 m, corresponding to height-to-diameter ratios of 2.0:1, 2.4:1, and 3.0:1. The simulations compare flow field distribution, particle residence time, and temperature gradients to determine the optimal height-diameter ratio for the gasifier.
4.1.1 Influence of Height-to-Diameter Ratio on Flow Field Distribution.
Flow field distribution profoundly affects the gasifier’s temperature and gas product layouts. Fig. 2 illustrates the velocity distribution profiles at gasifier heights of 1.0, 1.2, and 1.5 m. Concurrently, Fig. 3 shows the associated velocity streamline patterns.
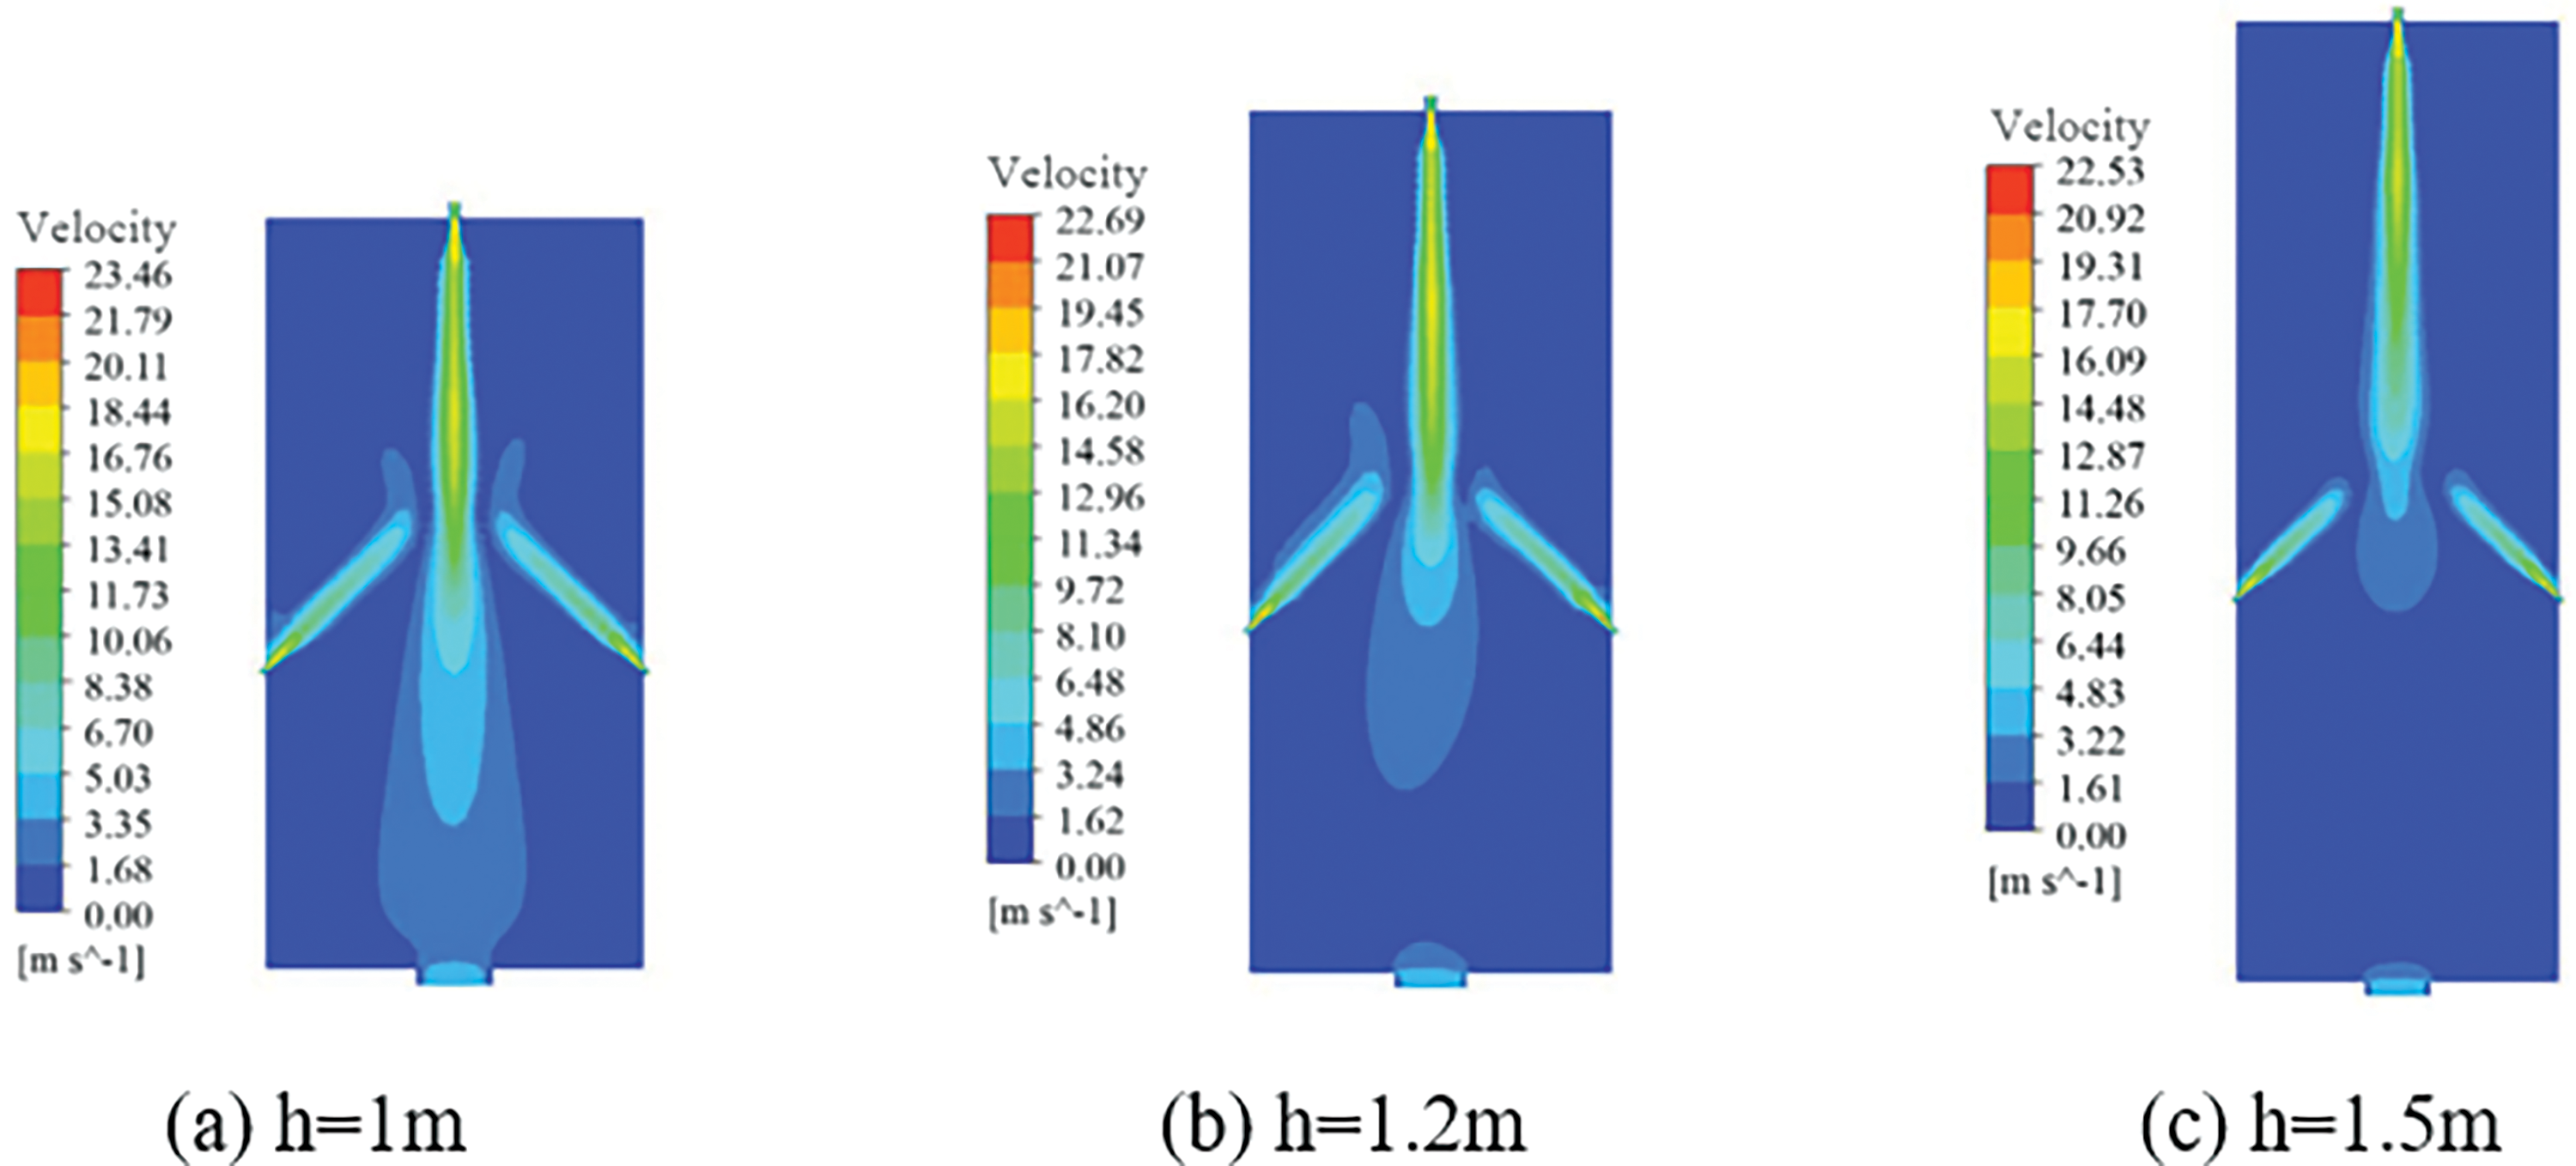
Figure 2: Velocity contour
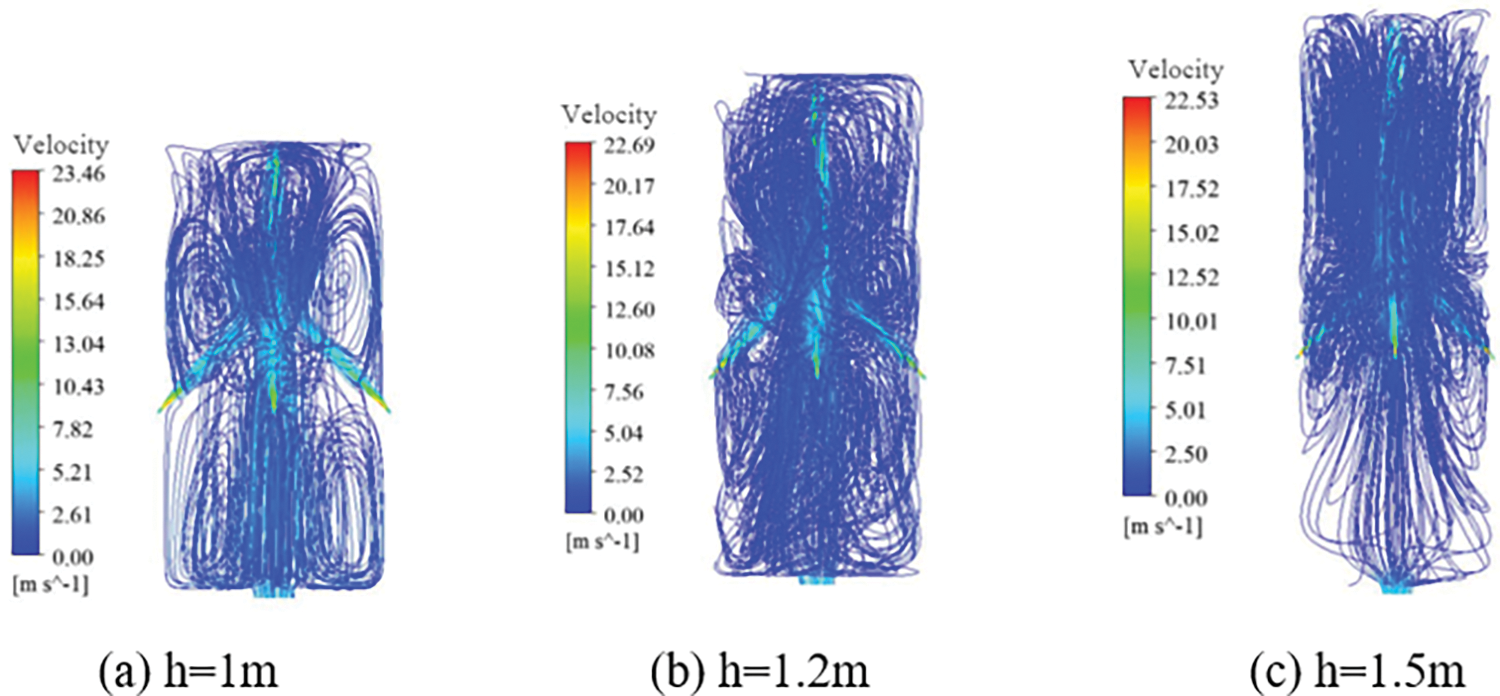
Figure 3: Velocity streamline diagram
Fig. 2a shows that when the height of the gasifier is 1 m, the cutting effect of the side nozzle on the top nozzle jet is poor, resulting in combustible particles directly rushing towards the bottom of the gasifier. This shortens the residence time of flammable particles in the gasifier and reduces gasification efficiency. Conversely, when the gasifier height is set at 1.2 and 1.5 m, corresponding to height-to-diameter ratios of 2.4:1 and 3.0:1, the gasification reaction mainly occurs in the central impact zone of the combustion chamber. This configuration mitigates the issue of the top nozzle jet flow directly moving towards the bottom outlet, significantly reducing the likelihood of the “short circuit” phenomenon.
Fig. 4 presents turbulence intensity cloud diagrams across the longitudinal axis section for different height-to-diameter ratios of the gasifier. According to Fig. 4, it can be observed that when the height of the gasifier is 1.2 m, the turbulent mixing intensity is the highest, reaching up to 379%. The turbulent intensity is lower for a gasifier height of 1.5 m. Its turbulence intensity cloud diagrams identify a substantial laminar flow region near the gasifier’s outlet, suggesting the localized reaction of combustion particles and the potential for direct ejection from the outlet. This can impede complete fuel particle reaction, compromising gasification efficiency. However, gasifiers with heights of 1.2 and 1.5 m show a more effective mitigation of this issue. Their turbulence intensity cloud diagrams indicate that reactions mainly occur in the central impingement zone of the combustion chamber and the upper side nozzle reflux area. This distribution of reactions leads to minimal impact at the furnace bottom and ensures more comprehensive reactions of fuel particles.
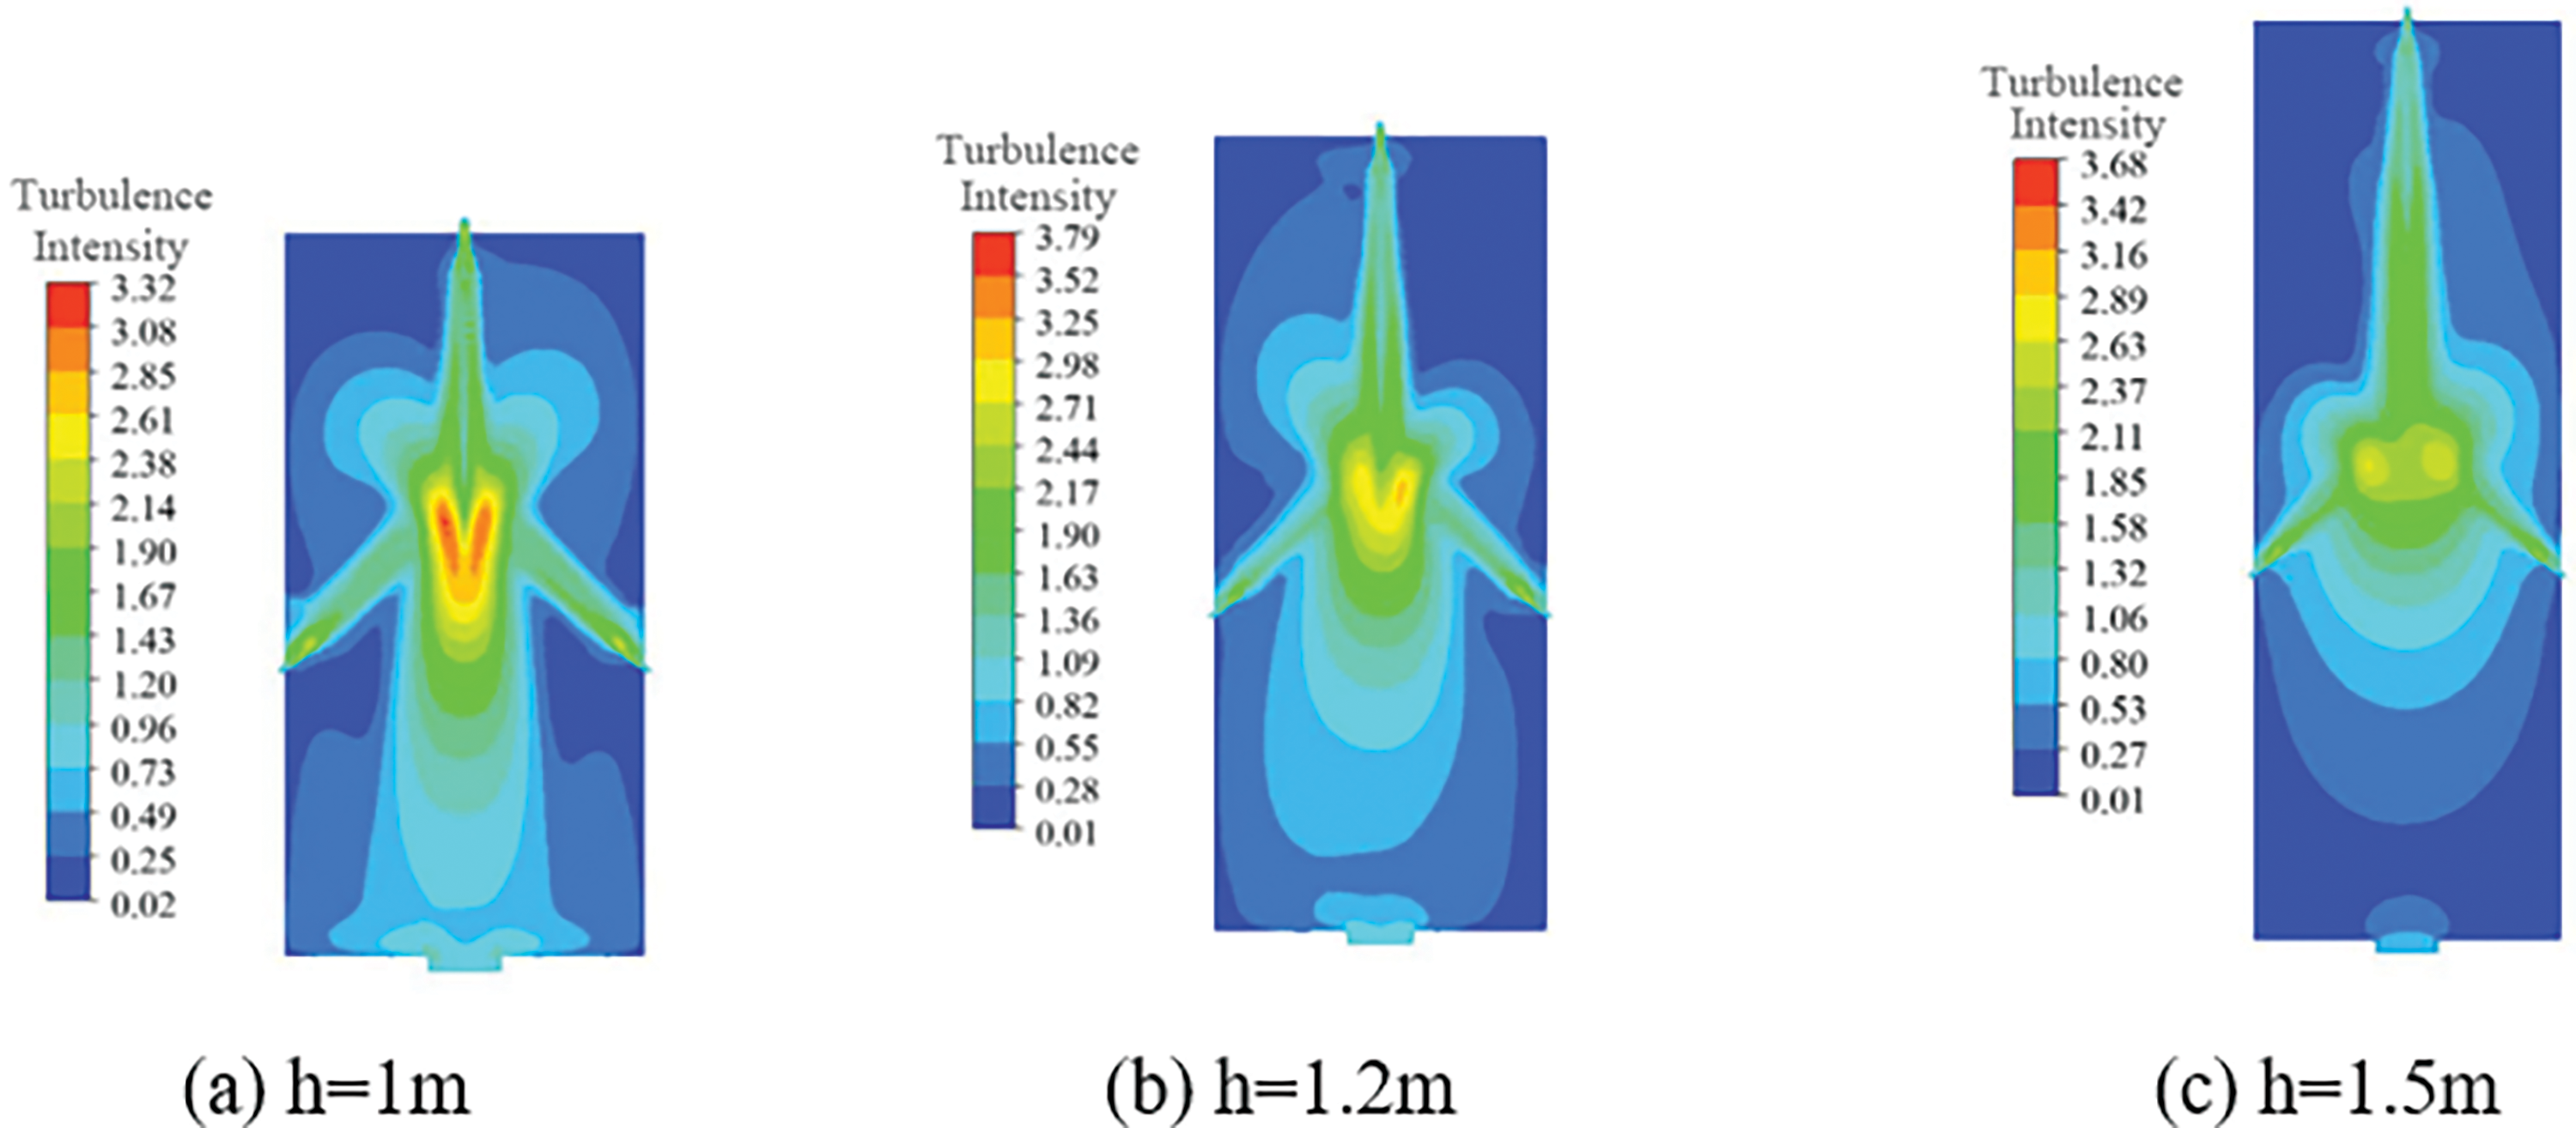
Figure 4: Turbulence intensity contour
Table 6 presents the particle residence times across the three gasifier configurations derived from simulations. The data clearly show that the gasifier with a height of 1.2 m provides the longest residence time for fuel particles. This increased duration inside the gasifier facilitates more complete reactions within the furnace. This observation is consistent with the previously noted phenomenon of maximum turbulent intensity during the gasification process in a gasifier of this height.
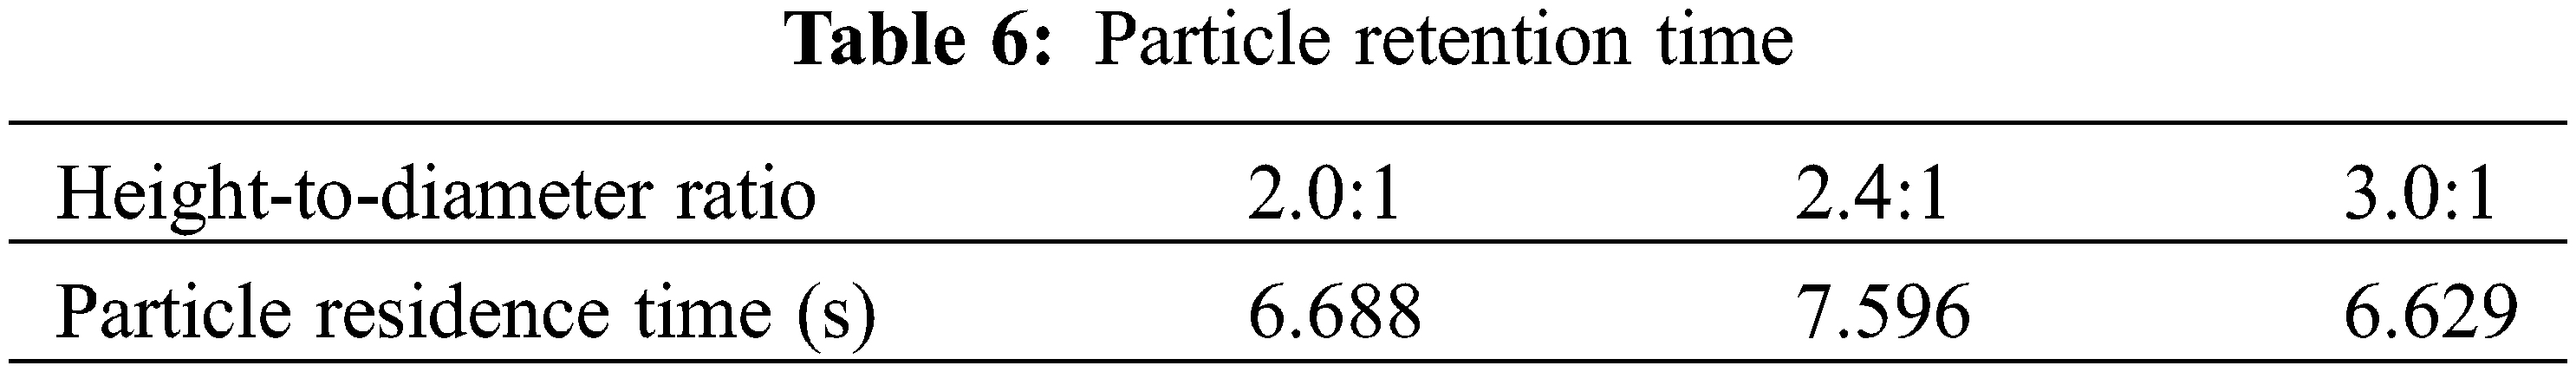
Upon integrating these findings with real-world conditions observed at industrial boiler sites, it is concluded that when the height of the gasifier is 1.2 m, corresponding to a height-to-diameter ratio of 2.4:1, the flow field inside the gasifier is more reasonable, leading to improved gasification efficiency.
4.1.2 Influence of Height-to-DIameter Ratio on Temperature Distribution
The temperature distribution within the gasifier serves as a crucial indicator of the combustion conditions inside the furnace. Fig. 5 depicts the temperature distribution cloud diagrams along the longitudinal axis when the gasifier height is set at 1, 1.2, and 1.5 m. As shown in the figure, the temperature at the nozzle outlet reaches its peak. This phenomenon is due to the abundant oxygen at this location, which triggers intense combustion reactions of volatile gases and residual carbon, releasing a significant amount of heat. In the regions at the end of the jet zone and the upper recirculation area of the side nozzles, a drop in temperature is noted. This reduction is due to the decreased oxygen content in these areas, which in turn initiates the gasification reaction of carbon. At the bottom exit of the gasification furnace, where the oxygen supply has been exhausted, the combustion reactions halt. Consequently, the carbon gasification reaction attains equilibrium, resulting in a gradual stabilization of temperature.
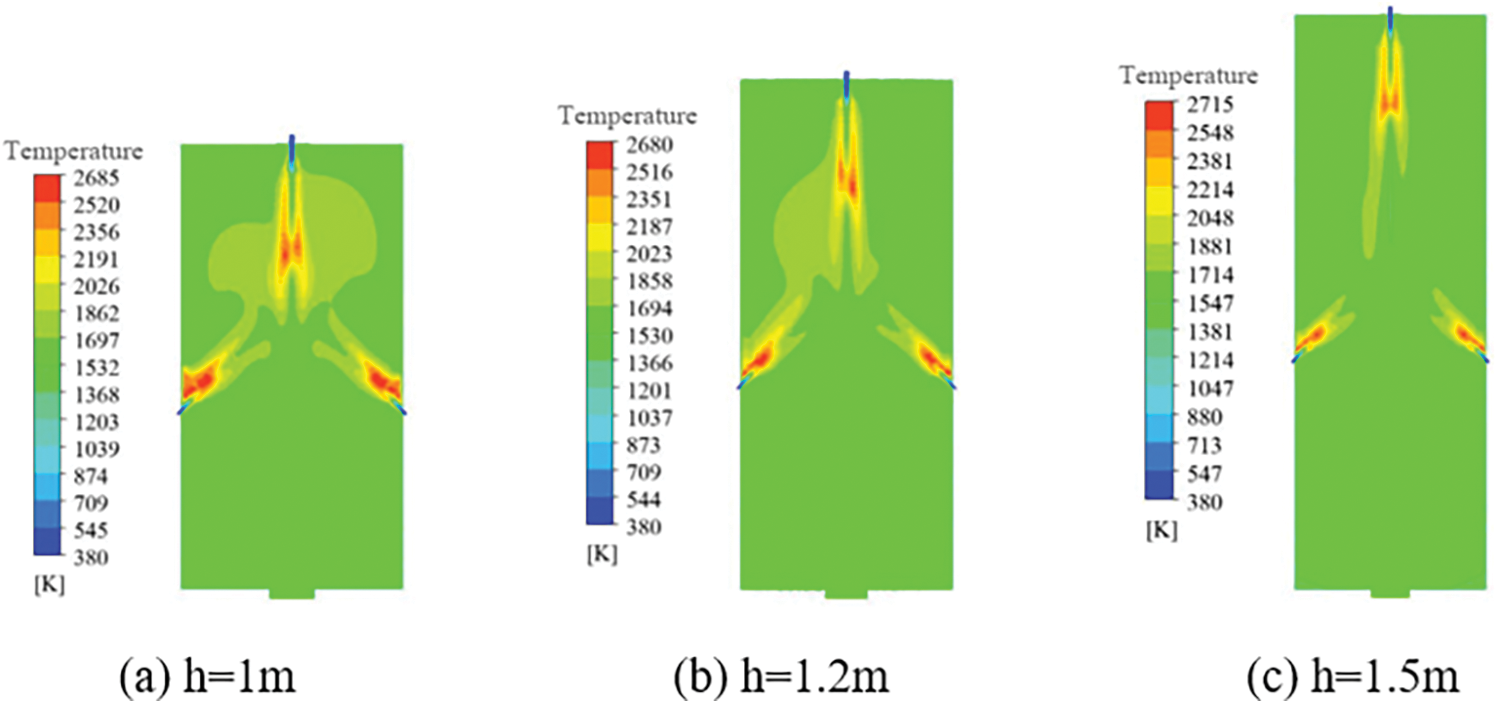
Figure 5: Temperature distribution contour
These observations confirm that the simulation results accurately mirror real combustion reaction phenomena. Particularly when the gasifier height is set at 1 and 1.2 m, the temperature distribution appears more uniform across the furnace. Such uniformity in temperature distribution can alleviate thermal stress effects on the furnace’s inner walls, thus enhancing the safety and operational stability of the gasifier.
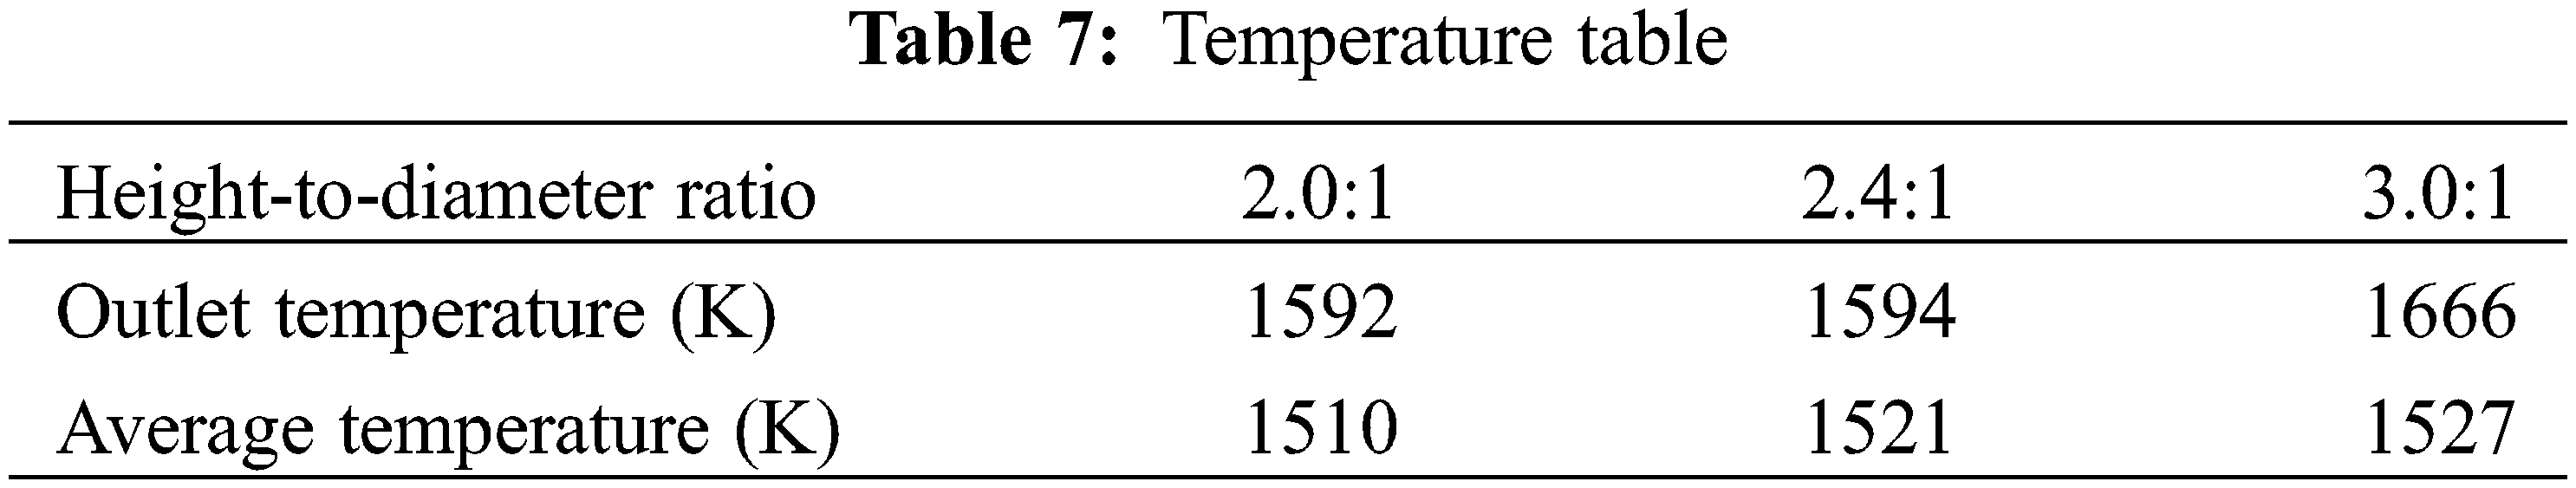
Table 7 enumerates the temperature data for the three distinct height-to-diameter ratios. The exit and average temperatures for a furnace height of 1.5 m are higher than those of the first two types of furnaces. Excessively high temperatures will reduce the lifespan of the gasifier and increase the operational difficulty of industrial gasifiers on-site. Therefore, choosing a gasifier design with a height-to-diameter ratio 3.0:1 is not advisable.
4.1.3 Influence of Height-to-Diameter Ratio on Gasification Results
The outcomes from the simulation of gasification in gasifiers with different height-to-diameter ratios are detailed in Table 8.
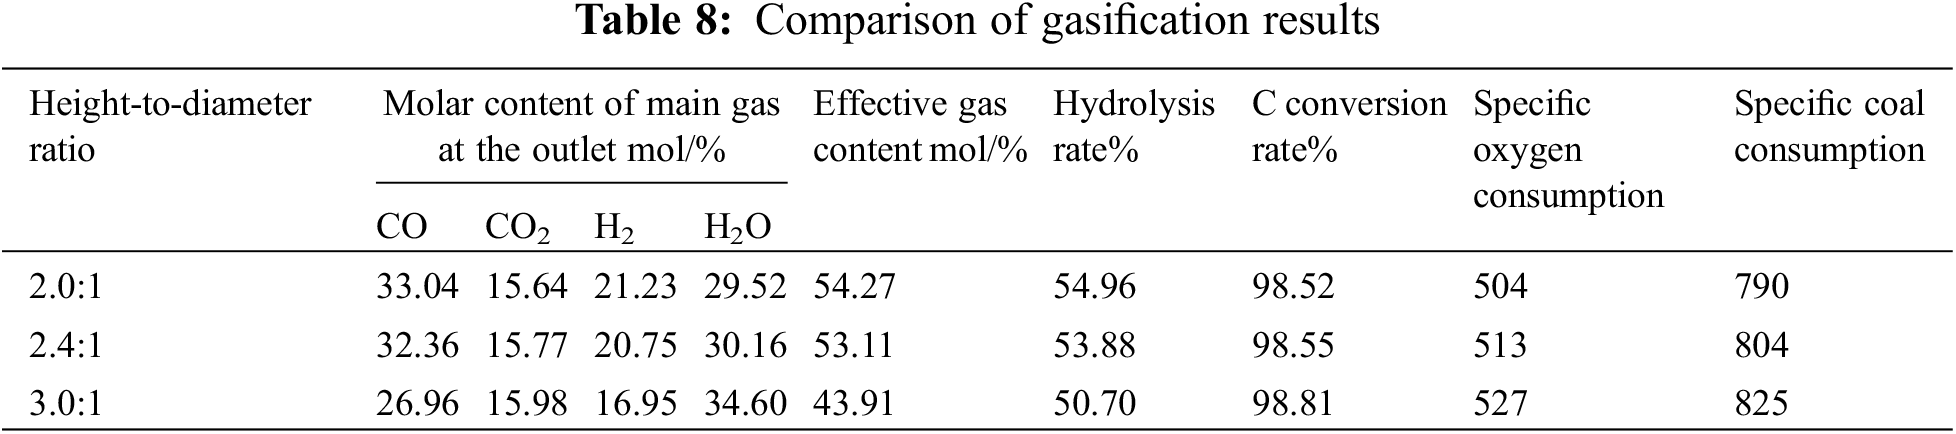
The effective gas (CO, H2) generated through gasification is a key byproduct and an essential measure of the gasifier’s efficiency. Generally, a higher effective gas content at the gasifier’s outlet is an indicator of superior performance. However, as the height-to-diameter ratio increases, the concentrations of CO and H2 at the outlet gradually decrease, dropping from 33.04 to 26.96 mol% for CO and from 21.23 to 16.95 mol% for H2. Concurrently, the concentration of H2O(g) at the outlet progressively increases, while the changes in CO2 concentration are not significant.
Furthermore, an increase in the height-to-diameter ratio leads to a slight rise in the carbon conversion rate, moving from 98.52% to 98.81%. Despite this increase, the proportion of effective gas content at the outlet gradually diminishes. This trend suggests a trade-off between enhancing the carbon conversion rate and maintaining high effective gas content, highlighting certain limitations in improving the gasifier’s carbon conversion efficiency.
After conducting a thorough analysis that includes the gasification flow field, turbulence intensity, temperature, main gas distribution, effective gas content, and carbon conversion rate, it becomes apparent that a gasifier with a height of 1.2 m and an inner diameter of 0.5 m is the most suitable configuration. This size not only ensures a balanced flow field and efficient reactions but also results in lower average and outlet temperatures, which contribute to an extended lifespan. Moreover, this configuration yields higher effective gas content and carbon conversion rates. In addition, it is more cost-effective regarding design and fabrication.
4.2 Influence of Oil Mixing Ratio on Gasification Performance
4.2.1 Influence of the Oil Mixing Ratio on Flow Field Distribution
Fig. 6 depicts the velocity distribution cloud diagrams along the center-axis cross-section for five different oil mixing ratios. These diagrams reveal that the variations in the flow field state within the furnace are relatively minor across different oil mixing ratios. Along the central axis of the top nozzle inlet, the fuel flow rate incrementally increases, reaching its peak velocity in the impact zone. Following this, there is a gradual decrease in velocity in the pipe flow area close to the bottom outlet. Interestingly, as the oil mixing ratio increases, there is a noticeable reduction in the fuel flow rate inside the gasifier, with the maximum speed decreasing from 23.51 to 22.98 m/s. This reduction in velocity is attributed to the higher oil mixing ratio, which increases the adhesiveness between fuel particles, thus slowing down their flow rate. Moreover, it is observed that at an oil mixing ratio of 30%, the pipe flow area shifts further away from the gasifier outlet, effectively preventing the fuel from directly streaming from the nozzle inlet to the bottom outlet.
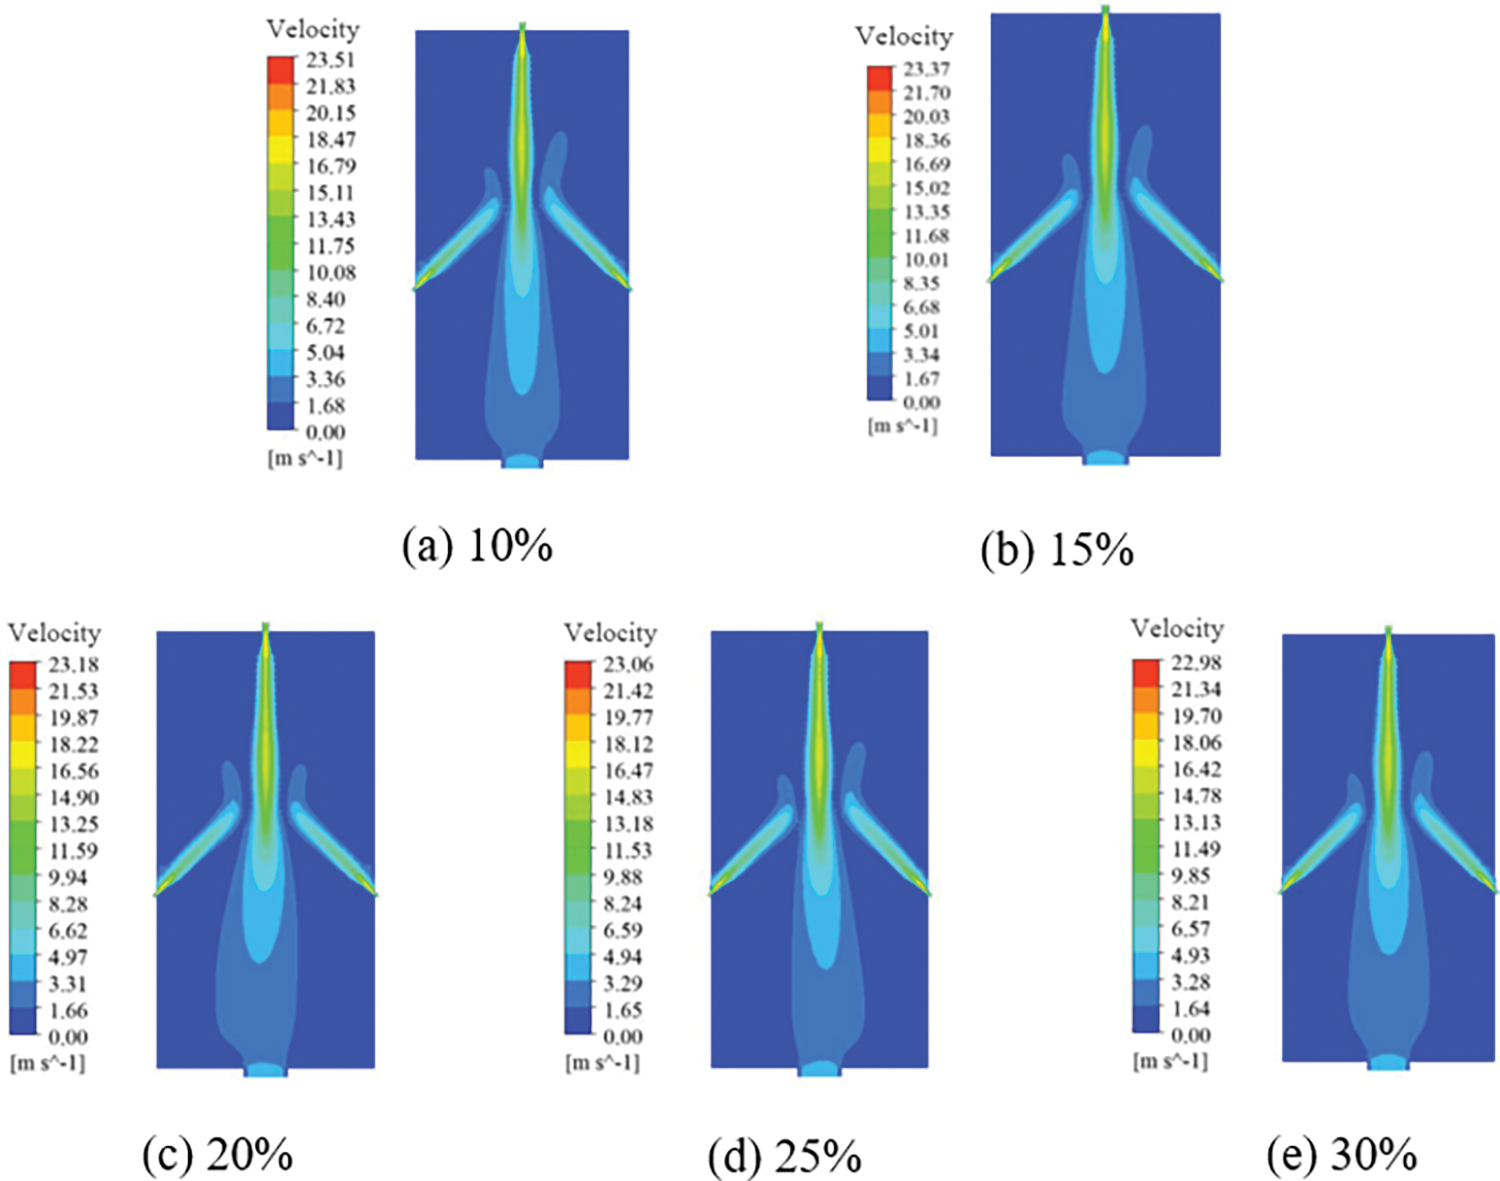
Figure 6: Velocity contour
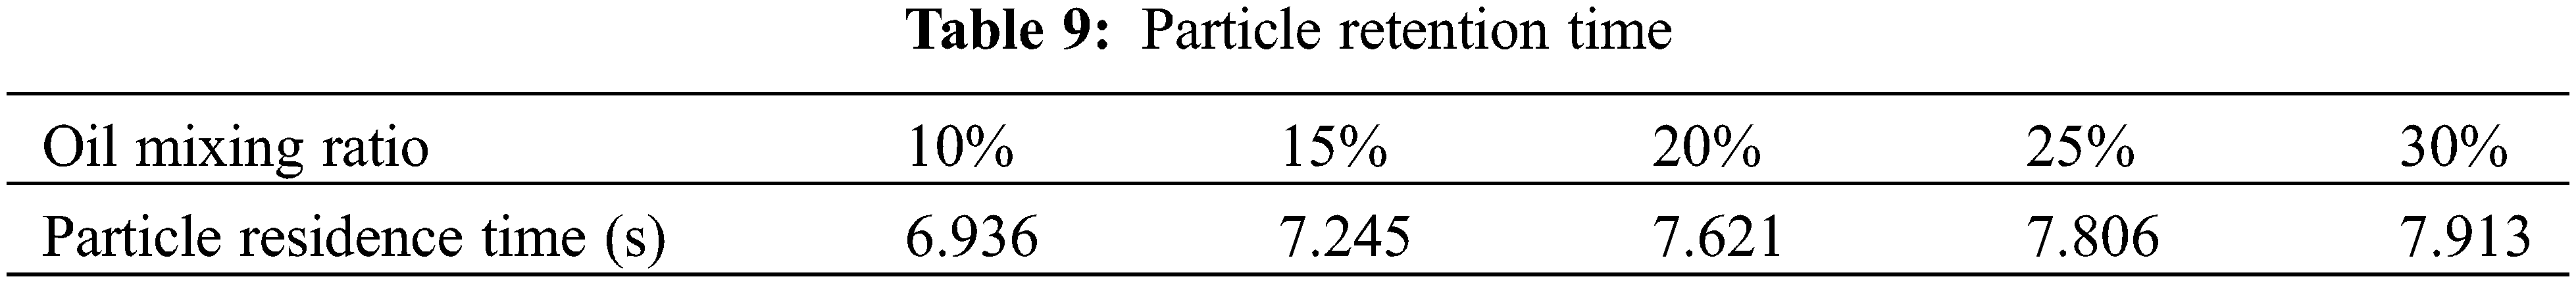
Table 9 provides the particle residence times obtained from simulations under various oil mixing ratios. A clear trend emerges as the oil mixing ratio increases; the residence time of fuel particles inside the furnace lengthens, spanning from 6.936 to 7.913 s. This indicates that a higher oil mixing ratio effectively extends the duration of fuel particle residence within the furnace, leading to more comprehensive combustion reactions. As a result, this contributes to an enhancement in the gasification process’s overall efficacy.
The velocity streamlines diagram presented in Fig. 7 illustrates that the flow fields within the furnace, as obtained from the gasification simulations, are essentially consistent across the five different levels of oily sludge addition. However, it is noted that with an increasing oil mixing ratio, the streamlined distribution within the furnace becomes progressively more concentrated. This concentration suggests an enhanced recirculation frequency of fuel particles, which in turn facilitates more complete combustion reactions.
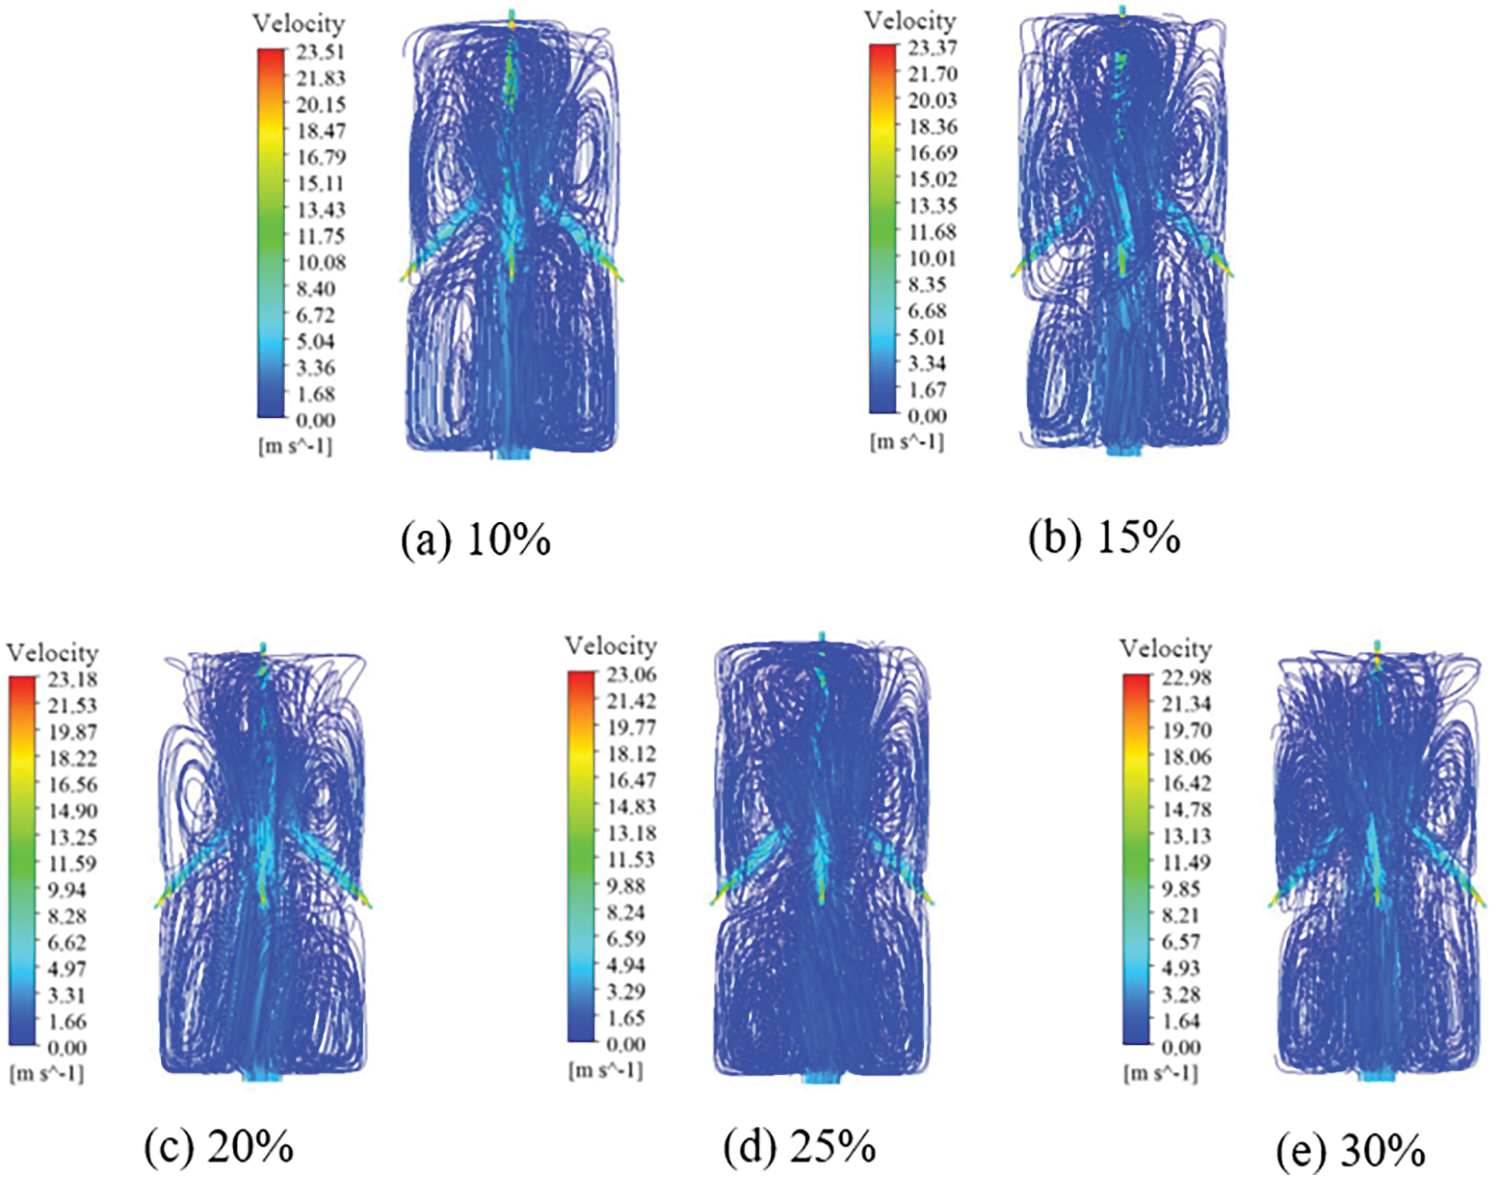
Figure 7: Velocity streamline diagram
The turbulence intensity cloud diagram in Fig. 8 shows that as the oil mixing ratio increases, the turbulence intensity grows, with the maximum turbulence intensity rising from 334% to 451%. This indicates that mixing fuel particles with oxygen inside the furnace becomes more thorough, leading to more intense reactions. Furthermore, the oil mixing ratio increases, the distance of the pipe flow zone from the bottom outlet becomes more significant, and the reaction area decreases, significantly reducing erosion on the walls of the gasification furnace.
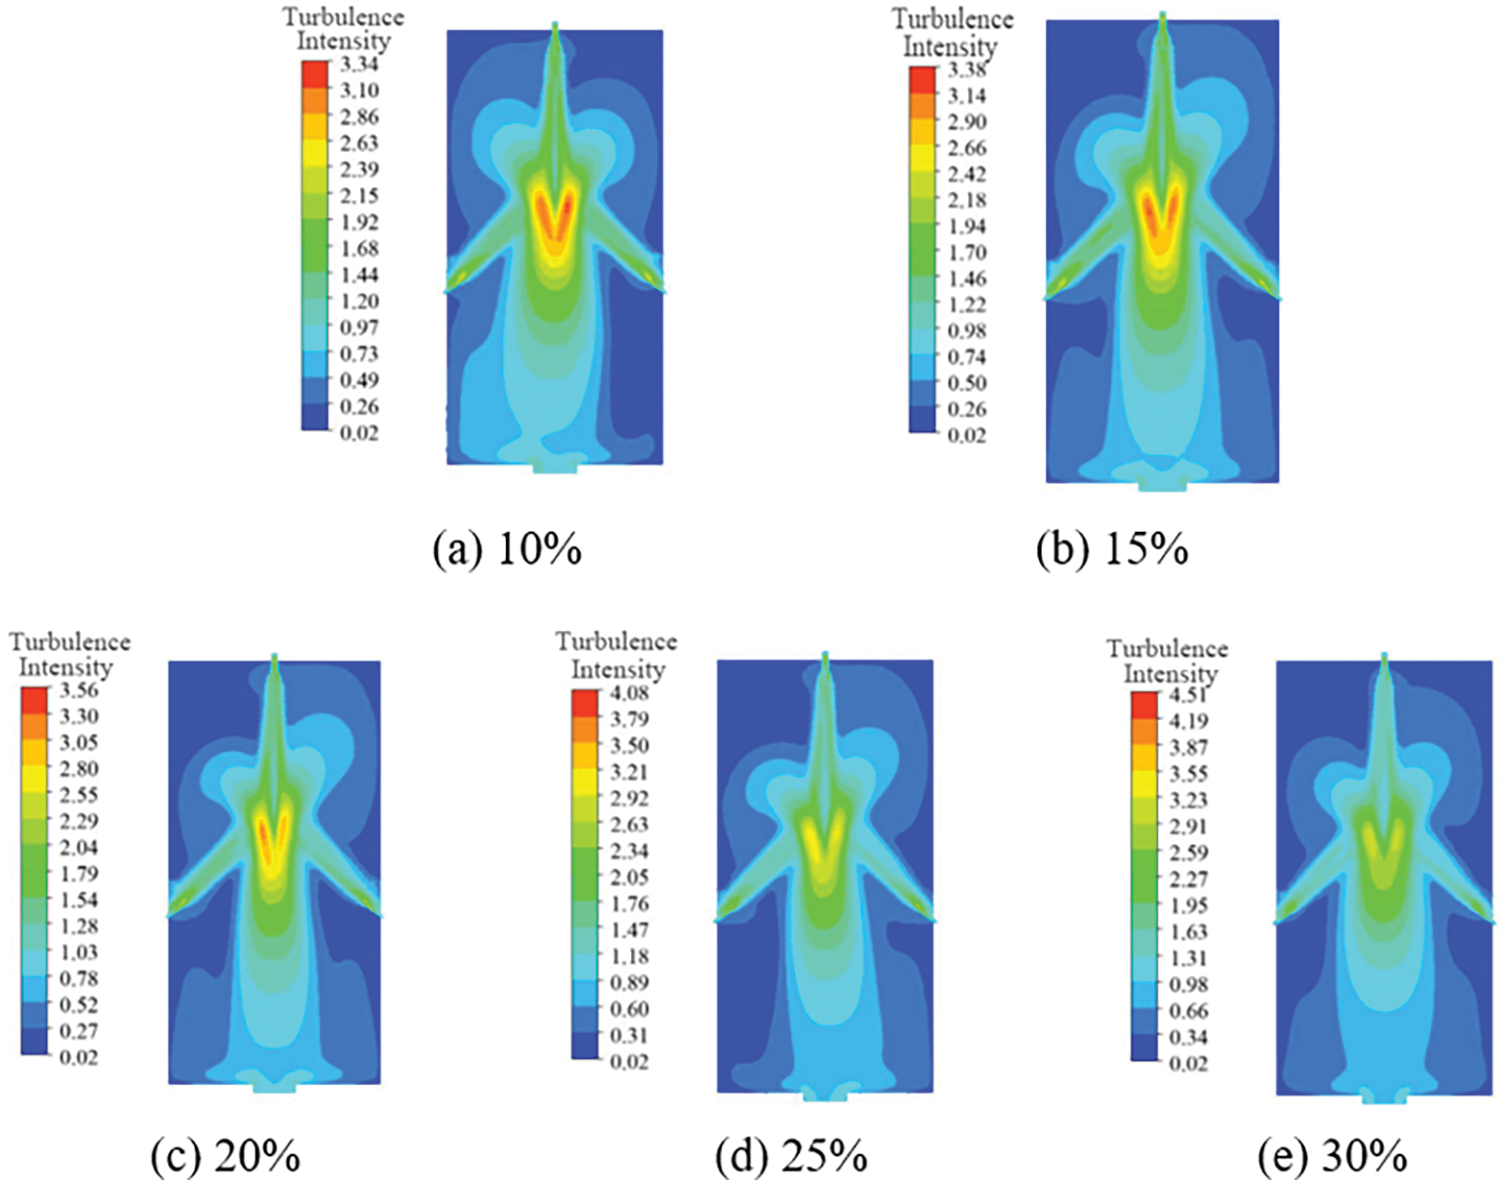
Figure 8: Turbulence intensity contour
4.2.2 Influence of the Oil Mixing Ratio on Temperature Distribution
The temperature distribution cloud charts along the central axis cross-section for combustion gasification in the furnace with five different oily sludge addition levels, as shown in Fig. 9, all exhibit an axially symmetric distribution, where the temperature first increases and then decreases along the central axis. However, the temperature distribution within the furnace for the concentrations shown in Figs. 9c and 9d is more uniform.
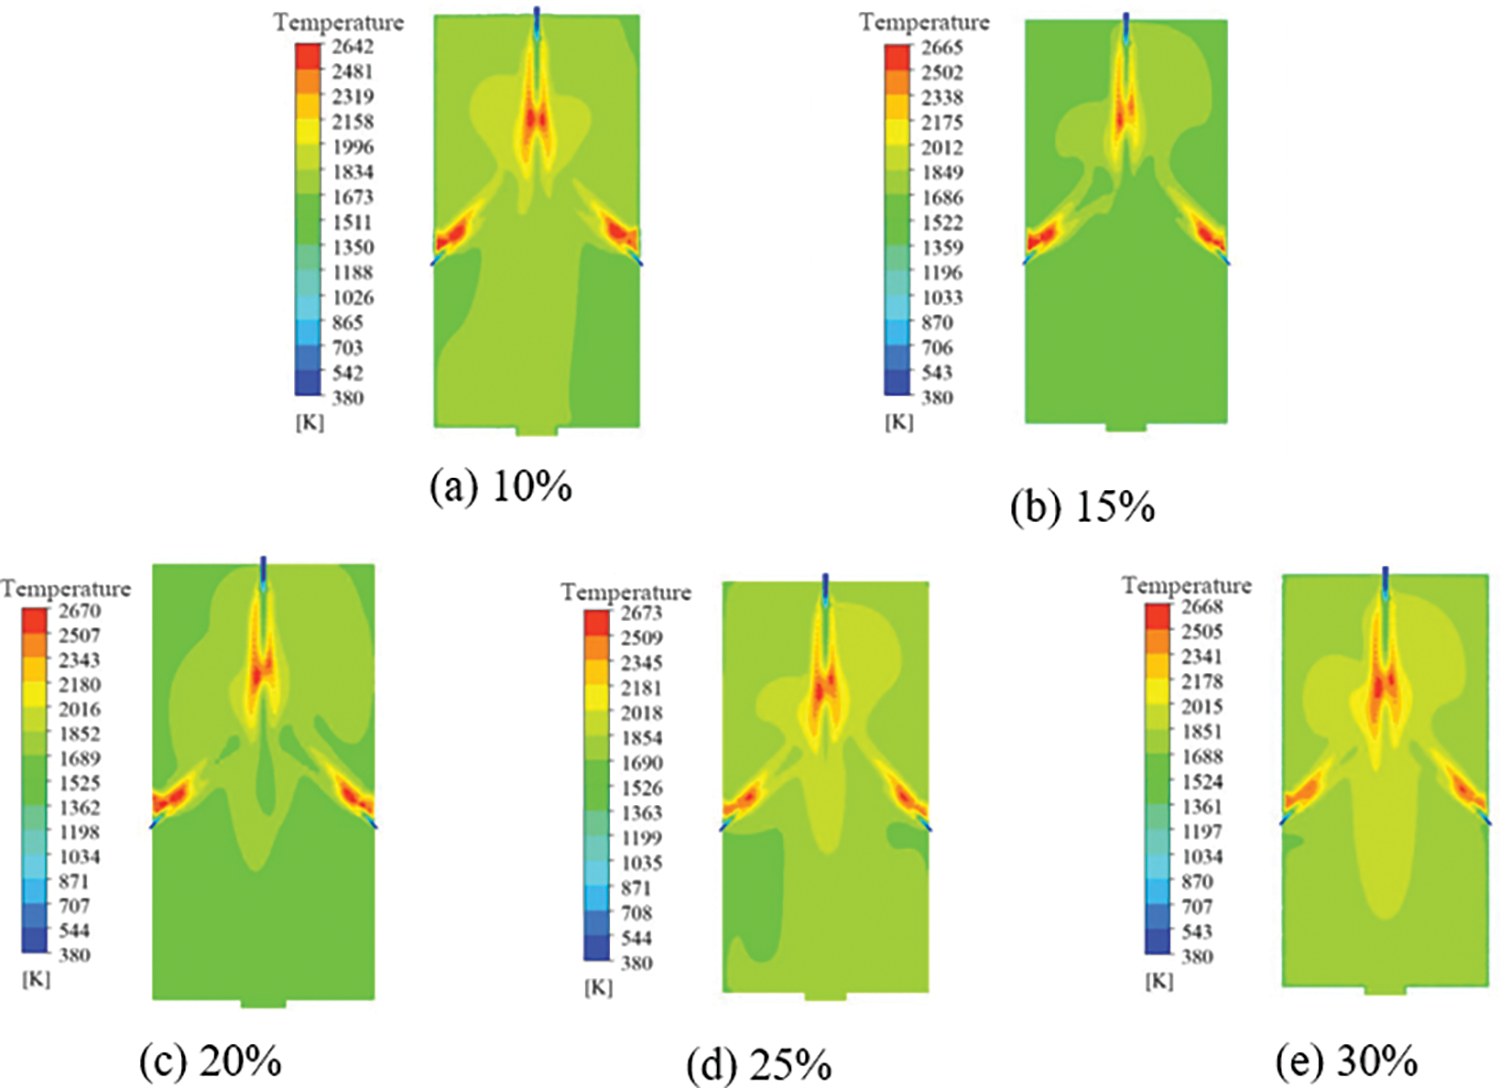
Figure 9: Temperature distribution contour
Table 10 shows the temperature tables for five different amounts of oil mixing ratio. As the oil mixing ratio increases, the exit temperature of the gasification furnace gradually rises. At a 20% oil mixing ratio, the furnace exhibited a more uniform temperature distribution.
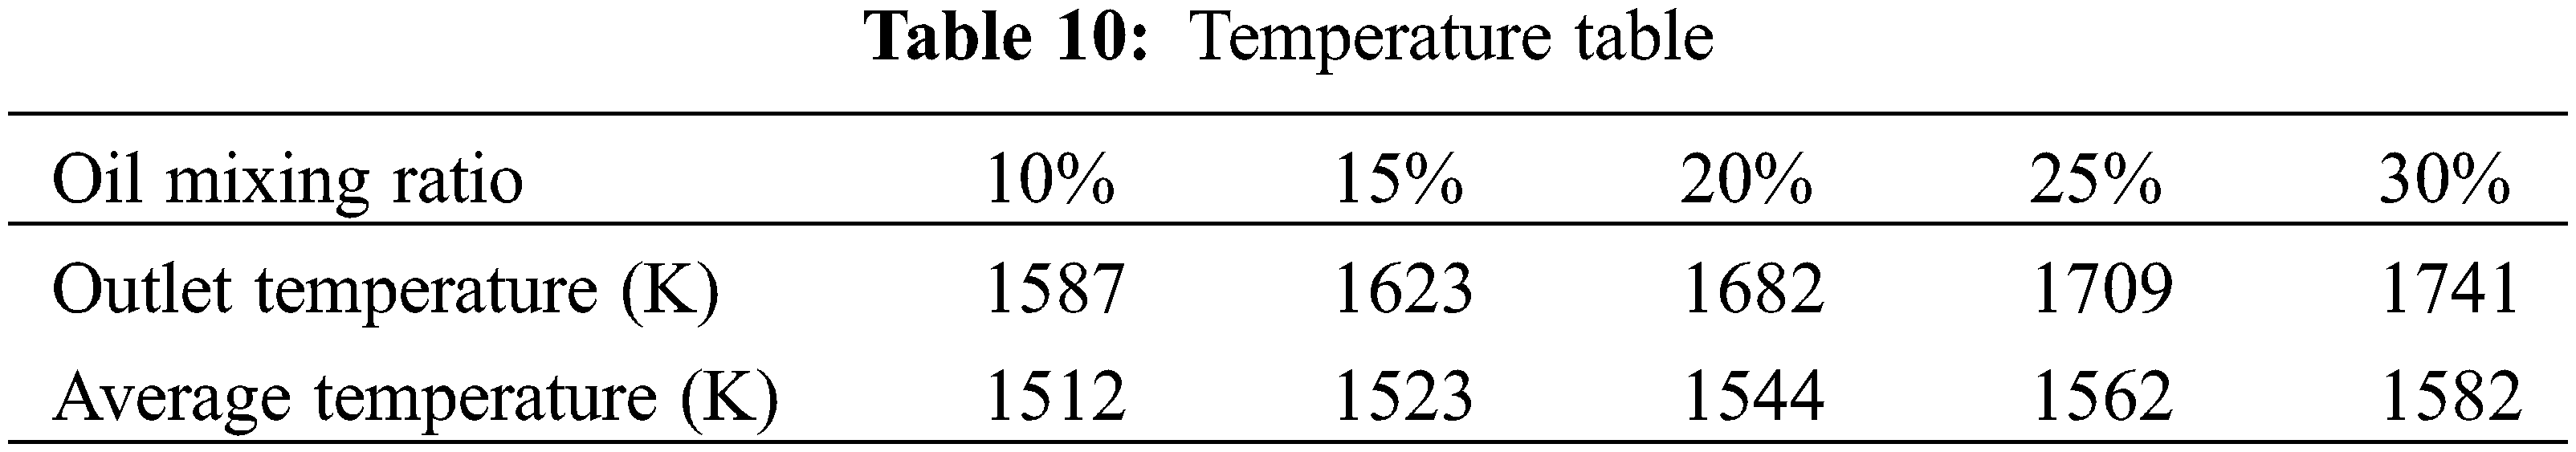
The inclusion of petroleum hydrocarbons in oil sludge augments the calorific value of the oil sludge coal slurry fuel, leading to an increased overall temperature in the gasifier and a consequent rise in outlet temperature. Although a higher outlet temperature facilitates the removal of liquid slag, it presents a challenge in utilizing high-temperature refractory bricks on the furnace wall. Consequently, keeping the gasifier’s outlet temperature around 1600 K is advisable for optimal performance.
4.2.3 Influence of Oil Mixing Ratio on Gasification Results
Table 11 presents a comparative analysis of gasification outcomes with five different oil mixing ratios. A clear trend emerges with the increase in the oil mixing ratio: there is a significant decrease in the content of CO and H2, with CO dropping from 33.11 to 24.96 mol/% and H2 from 21.35 to 16.04 mol/%. Alongside this decrease, there is a corresponding rise in the levels of CO2 and H2O(g), leading to a reduction in the effective gas content at the outlet. While the increase in CO2 content is modest, the escalation in H2O(g) content is quite substantial, advancing from 29.36 to 41.42 mol/%. This pattern can be ascribed to the hydrocarbons present in the oil sludge, which undergo combustion reactions with oxygen in the jet zone, resulting in the production of CO2 and H2O(g), thus boosting their concentrations. Furthermore, the inherent moisture in the oil sludge also plays a significant role. As the amount of oil sludge is increased, more moisture enters the furnace, consequently elevating the H2O(g) content at the gasification outlet.
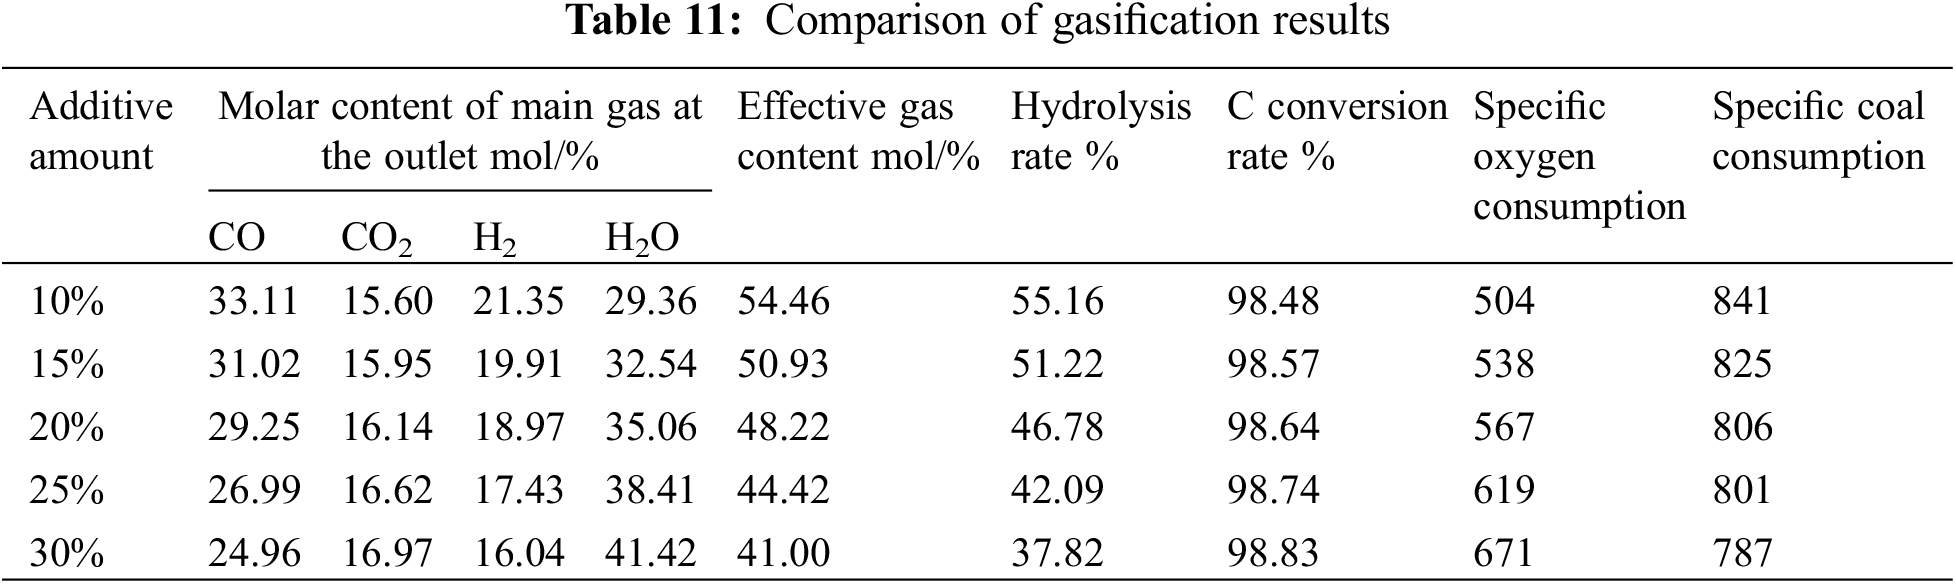
The carbon conversion rate in the gasifier shows a gradual increase in correlation with the oil mixing ratio. When the oil mixing ratio was increased by 30%, the carbon conversion rate reached an impressive 98.83%. This enhancement is primarily due to the elevated furnace temperature, which intensifies the heterogeneous reaction of coke, thereby boosting the carbon conversion rate. Additionally, incorporating oil sludge in the preparation of coal-water slurry reduces the total amount of carbon entering the gasifier.
As the oil mixing ratio rises, the specific oxygen consumption gradually increases from 504 Nm3/1000 Nm3 to 671 Nm3/1000 Nm3. This increase is largely due to the elevated organic content within the gasifier, necessitating more oxygen to complete the gasification process. Conversely, as the oil mixing ratio increases, there is a gradual reduction in specific coal consumption, dropping from 787 kg/1000 Nm3 to 841 kg/1000 Nm3. The high volatility and flammability of the organic compounds in oil sludge expedite their release during gasification, accelerating the reaction. These substances possess a specific calorific value and can substitute coal, thus decreasing coal consumption per unit.
Based on the preceding analysis, it is postulated that adding a certain quantity of oil sludge would lead to a decrease in the effective gas ratio and hydrolysis rate at the outlet. However, it also leads to an increase in the carbon conversion rate, a reduction in outlet temperature, and an increase in specific oxygen consumption. Simultaneously, coal consumption will be reduced. From an economic perspective, minimizing clear oxygen and coal consumption is imperative. The appropriate oil mixing can improve the carbon conversion rate of the whole gasifier and the production efficiency [40,41]. Therefore, adding 20% oil sludge is deemed the most suitable option. This level not only reduces reliance on coal feedstock but also promotes the environmentally friendly utilization of oil sludge resources.
Mixing oil with coal slurry produces an oil slurry, which can be converted into clean energy using gasification technology. This technology, central to our study, highlights the importance of numerical research in oil slurry gasification. The optimal gasifier, with a height-to-diameter ratio of 2.4:1, comprises a 1.2 m furnace height and a 0.5 m inner diameter. This configuration ensures uniform temperature distribution and rational flow field distribution, with a maximum turbulence intensity of 379%. These factors collectively improve the reaction intensity within the furnace, enhancing gasification efficiency.
When the oil mixing ratio increases, key parameters like effective gas content at the outlet, hydrolysis rate, and specific coal consumption decrease. Conversely, carbon conversion rate and specific oxygen consumption increase. In the furnace, denser flow lines facilitate better mixing of fuel particles with oxygen, leading to more intense reactions. However, considering the temperature distribution within the furnace and the operational temperature requirements of industrial boilers, a 20% oil mixing ratio is identified as the most effective
This study’s simulation analysis focuses on the gasifier’s height-to-diameter ratio and oil mixing ratio, pivotal in the gasification process. Nevertheless, in practical applications, other factors also affect gasification efficacy, such as nozzle inlet fuel velocity, fuel flow rate, and coal powder particle size. These additional factors merit in-depth research to fully understand their impact on gasification efficiency.
Acknowledgement: None.
Funding Statement: Enterprise Horizontal Project (Project Contract No. 2021K2450); Postgraduate Research & Practice Innovation Program of Jiangsu Province, China (SJCX22_1437).
Author Contributions: The authors confirm contribution to the paper as follows: study conception and design: Hailong Yu, Chaoqian Wang, Yunlan Sun; data collection: Haiqun Chen, He Zheng; analysis and interpretation of results: Xulei Wu, Panrong Wu; draft manuscript preparation: Xulei Wu. All authors reviewed the results and approved the final version of the manuscript.
Availability of Data and Materials: The data used to support the findings of this study are available from the corresponding author upon request.
Conflicts of Interest: The authors declare that they have no conflicts of interest to report regarding the present study.
References
1. Hassanzadeh M, Tayebi L, Dezfouli H. Investigation of factors affecting on viscosity reduction of sludge from Iranian crude oil storage tanks. Pet Sci. 2018;15(3):634–43. [Google Scholar]
2. Lashkarbolooki M, Ayatollahi S. Effects of asphaltene, resin and crude oil type on the interfacial tension of crude oil/brine solution. Fuel. 2018;223:261–7. [Google Scholar]
3. Jerez S, Ventura M, Molina R, Pariente MI, Martínez F, Melero JA. Comprehensive characterization of an oily sludge from a petrol refinery: a step forward for its valorization within the circular economy strategy. J Environ Manage. 2021;285:112124. [Google Scholar] [PubMed]
4. Jerez S, Ventura M, Molina R, Martínez F, Pariente MI, Melero JA. Application of a Fenton process for the pretreatment of an iron-containing oily sludge: a sustainable management for refinery wastes. J Environ Manage. 2022;304:114244. [Google Scholar] [PubMed]
5. Obi L, Atagana H, Adeleke R, Maila M, Bamuza-Pemu E. Potential microbial drivers of biodegradation of polycyclic aromatic hydrocarbons in crude oil sludge using a composting technique. J Chem Technol & Biotechnol. 2020;95(5):1569–79. [Google Scholar]
6. Mohit MA, Ghazban F, Omidvar B. Optimization of influential parameters of hydrocarbon recovery from waste oily sludge by solvent extraction using solvent blend. Environ Monit Assess. 2020;192:1–12. [Google Scholar]
7. Araka PP, Okparanma RN, Ayotamuno JM. Diagnostic screening of organic contaminant level in solidified/stabilized pre-treated oil-based drill cuttings. Heliyon. 2019;5(10):e02644. [Google Scholar] [PubMed]
8. Qin Y, Li H. The application of incineration technology for the treatment of oily sludge to the oilfields. Technol Superv Pet Indust. 2010;26(4):25–9. [Google Scholar]
9. Hamidi Y, Ataei SA, Sarrafi A. A highly efficient method with low energy and water consumption in biodegradation of total petroleum hydrocarbons of oily sludge. J Environ Manage. 2021;293:112911. [Google Scholar] [PubMed]
10. Zubaidy EAH, Abouelnasr DM. Fuel recovery from waste oily sludge using solvent extraction. Process Saf Environ. 2010;88(5):318–26. [Google Scholar]
11. Sivagami K, Anand D, Divyapriya G, Nambi I. Treatment of petroleum oil spill sludge using the combined ultrasound and Fenton oxidation process. Ultrason Sonochem. 2019;51:340–9. [Google Scholar] [PubMed]
12. Liu J, Jiang X, Zhou L, Han X, Cui Z. Pyrolysis treatment of oil sludge and model-free kinetics analysis. J Hazard Mater. 2009;161(2–3):1208–15. [Google Scholar] [PubMed]
13. da Rocha ORS, Dantas RF, Duarte MMMB, Duarte MML, da Silva VL. Oil sludge treatment by photocatalysis applying black and white light. Chem Eng J. 2010;157(1):80–5. [Google Scholar]
14. Wang J, Li J, Li C, Shen Y. Research progress in chemical treatment of oily sludge. Pet Chem Indust Appl. 2014;33(4):6–8. [Google Scholar]
15. Mora VC, Morelli IS, Rosso JA. Co-treatment of an oily sludge and aged contaminated soil: permanganate oxidation followed by bioremediation. J Environ Manage. 2020;261:110169. [Google Scholar] [PubMed]
16. Huang D, Duan Z, Yang X. Overview of oil sludge treatment technology. Guangdong Chem Indust. 2021;48(5):135–7. [Google Scholar]
17. Shi J, An X, Wang S. The current situation and development trend of coal water slurry gasification technology in China. Chinese and Foreign Energ. 2020;25(3):21–8. [Google Scholar]
18. Yang B. The current situation and development trend of coal water slurry gasification technology in China. Chem Design Commun. 2021;47(4):39–40. [Google Scholar]
19. Gaber C, Wachter P, Demuth M. Experimental investment and demonstration of pilot scale integration of oil water emissions and coal water sludge with raised water content at elevated temperatures with the use of pure oxygen. Fuel. 2020;282:118692. [Google Scholar]
20. Li H, Ji M, Li J. The effect of blended coal on the performance of coal water slurry. Coal Prep Technol. 2001;3:54–6. [Google Scholar]
21. Wang F, Zhou Z, Dai Z. Development and demonstration plant operation of an opposed multi-burner coal-water slurry gasification technology. Front Energ Power Eng China. 2007;1(3):251–8. [Google Scholar]
22. Liu H, Liang K, Zhang G. China’s natural gas development strategy under the constraints of carbon peak and carbon neutrality. Eng Sci. 2021;23(6):33–42. [Google Scholar]
23. Guo Q, Zhang Z, Xue Z, Gong Y, Yu G, Wang F. Coal char particle secondary fragmentation in an entrained-flow coal-water slurry gasifier. J Energ Inst. 2019;92(3):578–86. [Google Scholar]
24. Watanabe H, Tanno K, Umetsu H, Umemoto S. Modeling and simulation of coal gasification on an entrained flow coal gasifier with a recycled CO2 injection. Fuel. 2015;142:250–9. [Google Scholar]
25. Chen Y, Zhang W, Wang Y. Numerical simulation of high-temperature gasification characteristics of coal blended with oily sludge. Energ Res Utilization. 2021;3:44–9. [Google Scholar]
26. Sun Z, Dai Z, Zhou Z, Guo Q, Yu G. Numerical simulation of industrial opposed multiburner coal-water slurry entrained flow gasifier. Indust & Eng Chem Res. 2012;51(6):2560–9. [Google Scholar]
27. Lv Q, Wang L, Ma S, Jiang J, Liu L, Zhou Z, et al. Pyrolysis of oil-based drill cuttings from shale gas field: kinetic, thermodynamic, and product properties. Fuel. 2022;323:124332. [Google Scholar]
28. Hasse C, Debiagi P, Wen X, Hildebrandt K, Vascellari M, Faravelli T. Advanced modeling approaches for CFD simulations of coal combustion and gasification. Prog Energ Combust Sci. 2021;86:100938. [Google Scholar]
29. Das D, Dash U, Meher J, Misra PK. Improving stability of concentrated coal-water slurry using mixture of a natural and synthetic surfactants. Fuel Process Technol. 2013;113:41–51. [Google Scholar]
30. Meher J, Das D, Samal AK, Misra PK. Role of maceral composition on the formulation of concentrated coal-water slurry using a natural surfactant. Mater Today: Proc. 2019;9:542–50. [Google Scholar]
31. Huang J. Practice and problem analysis of mixing petroleum coke in coal water slurry gasification. Coal Chem Indust. 2021;49(1):68–71. [Google Scholar]
32. Papari S, Hawboldt K. A review on the pyrolysis of woody biomass to bio-oil: focus on kinetic models. Renew Sust Energ Rev. 2015;52:1580–95. [Google Scholar]
33. Su S, Cai X, Lu H, Sun L, Feng C, Wang X. Simulation of coal blended combustion with the two-mixture-fraction/PDF method. J Chin Electr Eng Sci. 2012;32(2):45–52. [Google Scholar]
34. Guo L. Numerical calculation and analysis of FLUENT radiation model. Refrig Air Cond. 2014;28(3):358–60. [Google Scholar]
35. Hikita T, Kudo S, Takai K, Hamakawa S. Effect of residual carbon properties on its gasification behavior. Energ. 2019;173:985–94. [Google Scholar]
36. Tang J. Ansys fluent 16.0 super learning manual. China: Posts and Telecommunications Press; 2016. p. 574. [Google Scholar]
37. Li YY, Hou SB. Coal water slurry gasifier burner service life analysis. Appl Mech Mater. 2015;733:485–8. [Google Scholar]
38. Van Ness HC, Abbott MM. The DeSoto coal-gasification process. Chem Eng Prog. 2017;49(4):165–73. [Google Scholar]
39. Wu Y. Application of simplified PDF model in three-dimensional numerical simulation of Texaco gasifier. J South China Unive Technol (Nat Sci Ed). 2011;39(5):111–6. [Google Scholar]
40. Wang L, Du X, Chen J, Wu Z. Numerical study on characteristics of biomass oxygen enriched gasification in the new gasifier on an experimental basis. Renew Energ. 2021;179:815–27. [Google Scholar]
41. Hwang IS, Sohn J, Lee UD, Hwang J. CFD-DEM simulation of air-blown gasification of biomass in a bubbling fluidized bed gasifier: effects of equivalence ratio and fluidization number. Energ. 2021;219:119533. [Google Scholar]
Cite This Article
 Copyright © 2024 The Author(s). Published by Tech Science Press.
This work is licensed under a Creative Commons Attribution 4.0 International License , which permits unrestricted use, distribution, and reproduction in any medium, provided the original work is properly cited.
 Downloads
 Citation Tools