
 Submit a Paper
 Propose a Special lssue
 Open Access
ARTICLE
Experimental Investigation of Wave–Current Loads on a Bridge Shuttle-Shaped Cap–Pile Foundation
1 College of Science and Technology, Ningbo University, Ningbo, 315300, China
2 Engineering Research Center of Industrial Construction in Civil Engineering of Zhejiang Province, Ningbo University of Technology, Ningbo, 315211, China
* Corresponding Authors: Chenkai Hong. Email: ; Zhongda Lyu. Email:
Fluid Dynamics & Materials Processing 2024, 20(7), 1565-1592. https://doi.org/10.32604/fdmp.2024.042685
Received 08 June 2023; Accepted 02 February 2024; Issue published 23 July 2024
 View Full Text
 Download PDF
Abstract
To scrutinize the characteristics of wave–current loads on a bridge shuttle-shaped cap–pile foundation, a 1:125 test model was considered in a laboratory flume. The inline, transverse and vertical wave–current forces acting on the shuttle-shaped cap–pile group model were measured considering both random waves and a combination of random waves with a current. The experimental results have shown that the wave–current forces can be well correlated with the wave height, the wavelength, the current velocity, the incident direction and the water level in the marine environment. An increase in the current velocity can lead to a sharp increase in the inline and transverse wave–current forces, while the vertical wave-current force decreases. Moreover, the wave–current forces are particularly strong when a combination of high tide, strong wave and strong current is considered.Keywords
In recent decades, a growing number of coastal regions worldwide have witnessed the construction of sea-crossing bridges. These bridges typically feature a substantial cap–pile group foundation, which plays a crucial role in their design and construction due to the harsh maritime conditions involving strong waves and currents in deep sea areas (Hallowell et al. [1–3]). The complex geometry of the composite structure, consisting of the cap and the pile group, coupled with intricate interactions among waves, currents, and the structure, pose challenges in accurately estimating the wave-current loads. Therefore, accurately predicting and analyzing the wave–current loads and the hydrodynamic effects on the cap–pile foundation is crucial for achieving a better design and safer construction.
The cap–pile foundation of a sea-crossing bridge typically consists of a composite structure, comprising a large-size cap and multiple small-size piles. Due to the significant disparity in sizes, the calculation of wave-current forces requires separate theoretical approaches. The assumption can be made that the diameter of a single pile relative to the wavelength is typically small, indicating minimal influence on the wave field. The Morison Equation is a classical method for evaluating the wave forces on a slender pile [4], and the key lies in selecting an appropriate wave theory and hydrodynamic coefficients (drag coefficient CD and inertial coefficient CM). Further validation and expansion of the Morison Equation have been conducted by Lighthill [5], and Moberg [6] through flume model experiments and analyses of cylinders with small diameters. Deng et al. [7] improved upon the Morison Equation for assessing non-linear wave forces on a cylinder by both model experiments and numerical simulations.
The spacing between piles in the pile group is small, resulting in significant interactions such as interference and shielding. Consequently, accurately and comprehensively analyzing wave-current loads on pile groups becomes challenging due to the highly complex pile group effect. As a solution, a series of experiments were conducted to develop practical evaluation methods. Shiravani et al. [8] examined the impact of cylinder arrays on wave diffraction and resulting wave forces. Bonakdar et al. [9] summarized the wave action on the pile groups based on extensive scaled model tests of single piles and small-scale pile groups, proposing a new hybrid model to estimate the effect coefficient of the pile group.
Sea-crossing bridges typically have large caps that generate scattering effects. The Morison Equation is inadequate for estimating the wave forces on the cap, as it does not account for wave diffraction near the structure. Instead, an analytical solution based on linear diffraction theory, developed by MacCamy and Fuchs, is commonly used to estimate the wave forces and moments on large circular cylinders [10]. The predictions of this method have been validated by experiments conducted on large circular cylinders subjected to regular waves by Chakrabarti et al. [11–13]. Iuppa et al. [14] conducted experiments to measure the fluctuating pressure and force caused by diffracted waves on the surface of a large circular cylinder. Additionally, Serinaldi et al. [15], and Seiffert et al. [16] studied wave-deck interactions through experiments and computations, proposing probabilistic models for maximum load estimation. The interaction between the incident wave field and a structure is intensified in the presence of currents, resulting in the generation of a complex diffracted wave–current field around the structure [17]. Furthermore, the size and shape of caps vary across different projects. Several researchers have investigated wave forces and wave–current forces on large structures. Based on model tests, Xu et al. [18] compared the variations in horizontal and vertical wave forces on caps at different depths and under varying wave conditions. Jeong et al. [19] measured the enhancement effect of the shoal on the long-term non-linear diffraction wave force of three-type specially shaped cylindrical foundations used in wind turbines. Kang et al. [20] examined the hydrodynamic coefficients of a dumbbell-shaped cofferdam under the combination of waves and currents. They varied the wave height and period, current velocity, and the incident direction of flow through experiments and numerical simulations. The results indicated that the hydrodynamic coefficient was strongly correlated with the sinusoidal value of the incident angle of flow. Wei et al. [21,22] conducted a model experiment on a large round-ended caisson foundation and determined that the wave–current–induced base shear force was approximately equal to the sum of the corresponding wave-induced and current-induced base shear forces. In engineering design, the wave force on the cap is typically calculated using linear diffraction theory, while the current force is calculated determined by the resistance formula. The wave–current load on the cap is then obtained by combining these forces, as has been reported by Mei et al. [23]. The wave load on the pile group is calculated using the Morison Equation. To obtain the overall wave-current load on the foundation, the wave–current loads on the pile group and the cap are added together, as demonstrated by Pan et al. [24].
However, the aforementioned methods fail to accurately represent the combine action of waves and the currents on the cap–pile group, leading to significant deviations from experimental data [25]. Deng et al. [26] conducted numerical modeling to analyze the impact of the cap on wave forces on the pile group. They concluded that the cap primarily affects the wave forces on piles located close to its front. Moreover, the ratios of the inline length and submerged depth of the cap to the wavelength were found to significantly influence on the effect coefficient of pile group.
Chen et al. [27] conducted numerical simulations to analyze the wave forces acting on a high-rise pile–cap structure. The results revealed that the maximum horizontal wave force on all piles with the cap increased by 30% compared to those without the cap. Similarly, the horizontal wave force on the cap with piles increased by 15%. These findings indicate that the conventional Morison Equation and diffraction theory underestimate the wave loads on both the piles and the cap in this scenario.
The design wave–current loads on the foundation of the sea-crossing bridge are primarily obtained by laboratory experiments. Liu et al. [28] conducted experiments on a scaled model of the pile–cap foundation of a bridge. They discovered that the wave loads increased in relation to both wave height and period. Furthermore, they observed that the trends in load variations under the combined action of waves and currents were similar to those under wave-only conditions. In a separate study, Liu et al. [29] analyzed the variation in the effect coefficient of pile group under the combined action of waves and currents based on model experiments on a cap–pile foundation for an offshore wind farm. They also discussed the impact of the cap on wave loads on the pile group under regular wave conditions.
A comprehensive review of the literature reveals the intricate nature of the wave–current loads on the cap–pile group structure, making accurate analysis challenging. The methods employed to estimate the loads on the cap–pile group in engineering also possess limitations, leading to uncertain results. Prior investigations have primarily assumed conventional wave and current conditions in this regard, with limited exploration of the loads on deep-water foundations of sea-crossing bridges under the combined action of intense waves and currents. However, with advancements in construction technology and the increasing necessity for sea-crossing bridges in deep waters, these foundations are subjected to harsh environment characterized by strong waves and currents. Consequently, the wave–current loads under the combined actions of these factors have become the dominant load in the design of sea-crossing bridge foundations [30].
To enhance adaptability to the deep-water environment characterized by waves and currents, the foundation of the main tower of a sea-crossing bridge incorporates a combined structure comprising a novel shuttle-shaped cap and 18 piles, with each pile having a diameter of 6.3 m (Fig. 1). However, there is limited understanding regarding the hydrodynamic load characteristics on the shuttle-shaped cap-pile foundation under the combined effects of waves and currents, which hampers structural design considerations and the development of an effective construction plan.
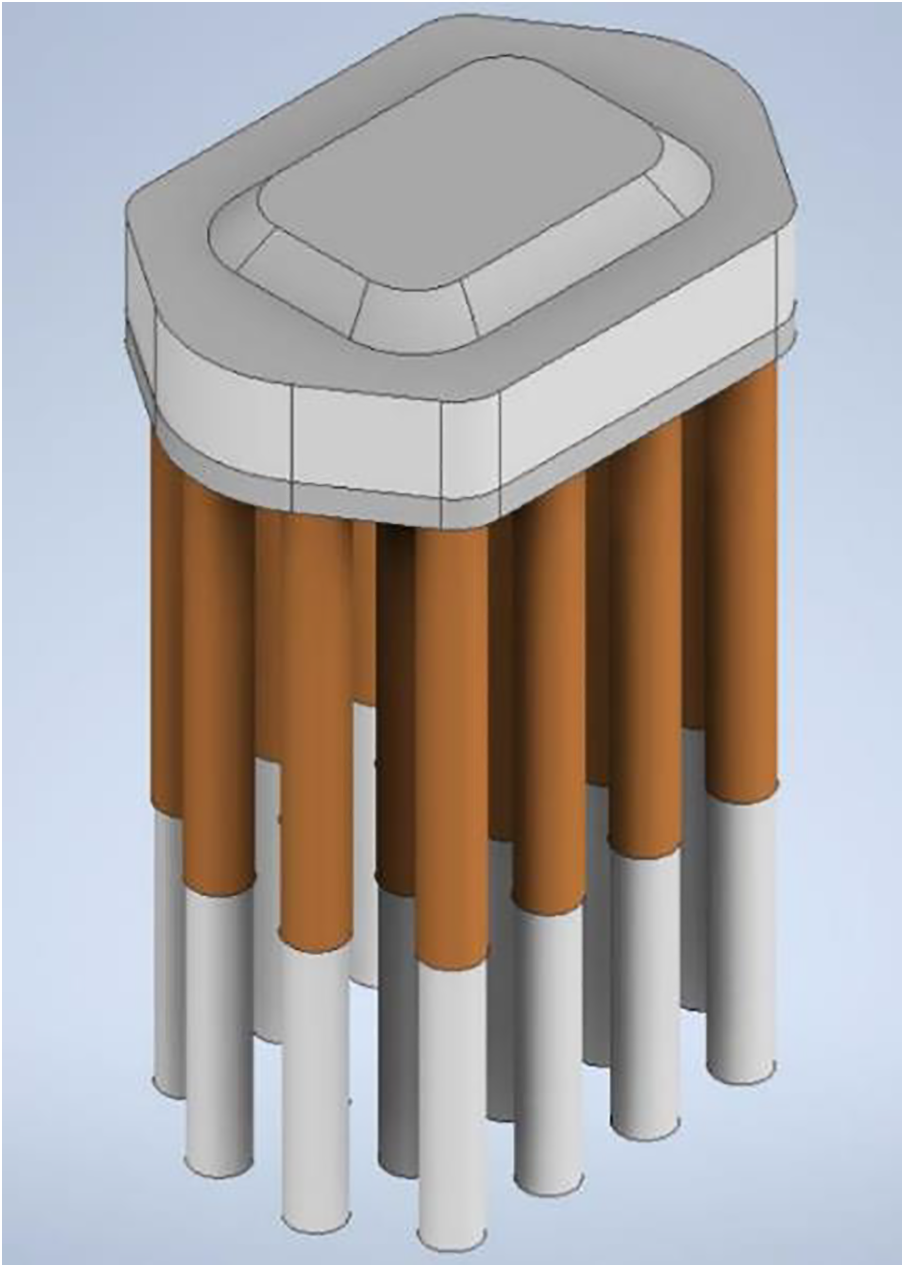
Figure 1: Shuttle-shaped cap-pile group foundation
This study utilizes a prototype of the aforementioned shuttle-shaped cap-pile group foundation to investigate the wave-current forces acting in three different directions (inline, transverse, and vertical). A model of the foundation was constructed, allowing for the measurement of inline, transverse, and vertical forces on the foundation at three distinct water depths. The variations in the forces on the foundation were then analyzed according to significant wave height and period, current velocity, incident flow direction, and water level. Furthermore, a comparative analysis was conducted to examine the characteristics of wave forces and wave–current forces, with a particular emphasis on the wave-current forces induced by strong waves and currents. The conclusions are expected to enhance the understanding of evaluating the wave–current loads on large shuttle-shaped cap–pile foundations and assist in their optimization design.
2 Experimental Design and Setup
2.1 Model of Shuttle-Shaped Cap–Pile Foundation
The wave flume used in the experiments was 75 m in length, 1.8 m in width, and 2 m in depth, and the maximum allowable operating depth of water was 1.5 m. As is shown in Fig. 2, a hydraulic piston-type wave generator installed on one side of the flume could generate one-way waves. On the other side, an efficient absorber beach was installed to minimize wave reflections. With an inlet and an outlet at the bottom of both ends, uniform currents could be generated by the circulation pump system.

Figure 2: Schematic diagram of wave flume (unit: m)
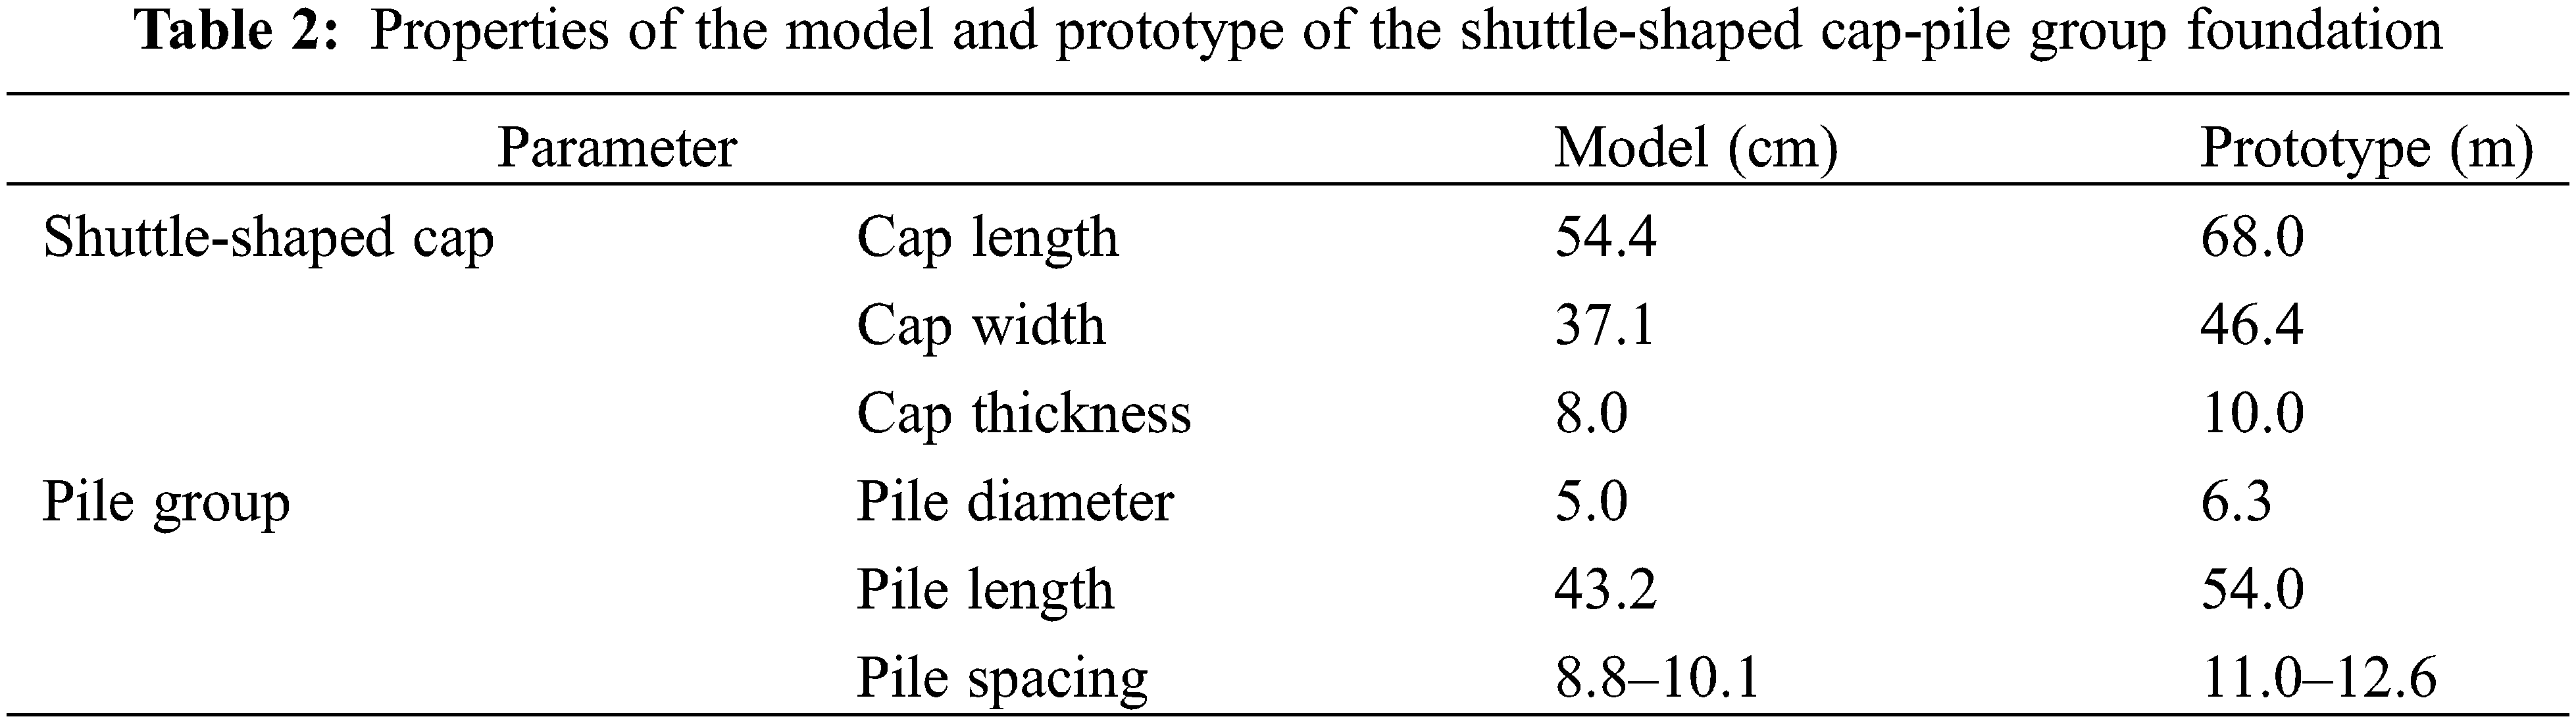
The prototype was a shuttle-shaped cap–pile foundation for the main tower of a sea-crossing bridge. The main feature of the foundation was its large shuttle-shaped cap, with dimensions of 68 m × 46.4 m × 10 m (length × width × height). Additionally, the pile group was densely arranged, with the pile center distance (11~12.6 m) ≤2 times of the pile diameter. The pile group consisted of 18 piles, each with a diameter of 6.3 m, and the distance between the bottom of the cap and the seabed was 54 m. In consideration of navigation safety, the cap was designed to remain partially submerged at both the highest and the lowest water levels, with a draft of 6 m under normal conditions. To account for the size of the flume, wave and current conditions, and the capacity of the measuring instrument, a test model at a 1:125 scale (model/prototype) was designed based on geometric similarity and Froude’s similarity criterion. The theoretical relationship between the model and the prototype is outlined in Table 1. The model was constructed using plexiglass, and its dimensions are shown in Fig. 3, with additional details provided in Table 2.
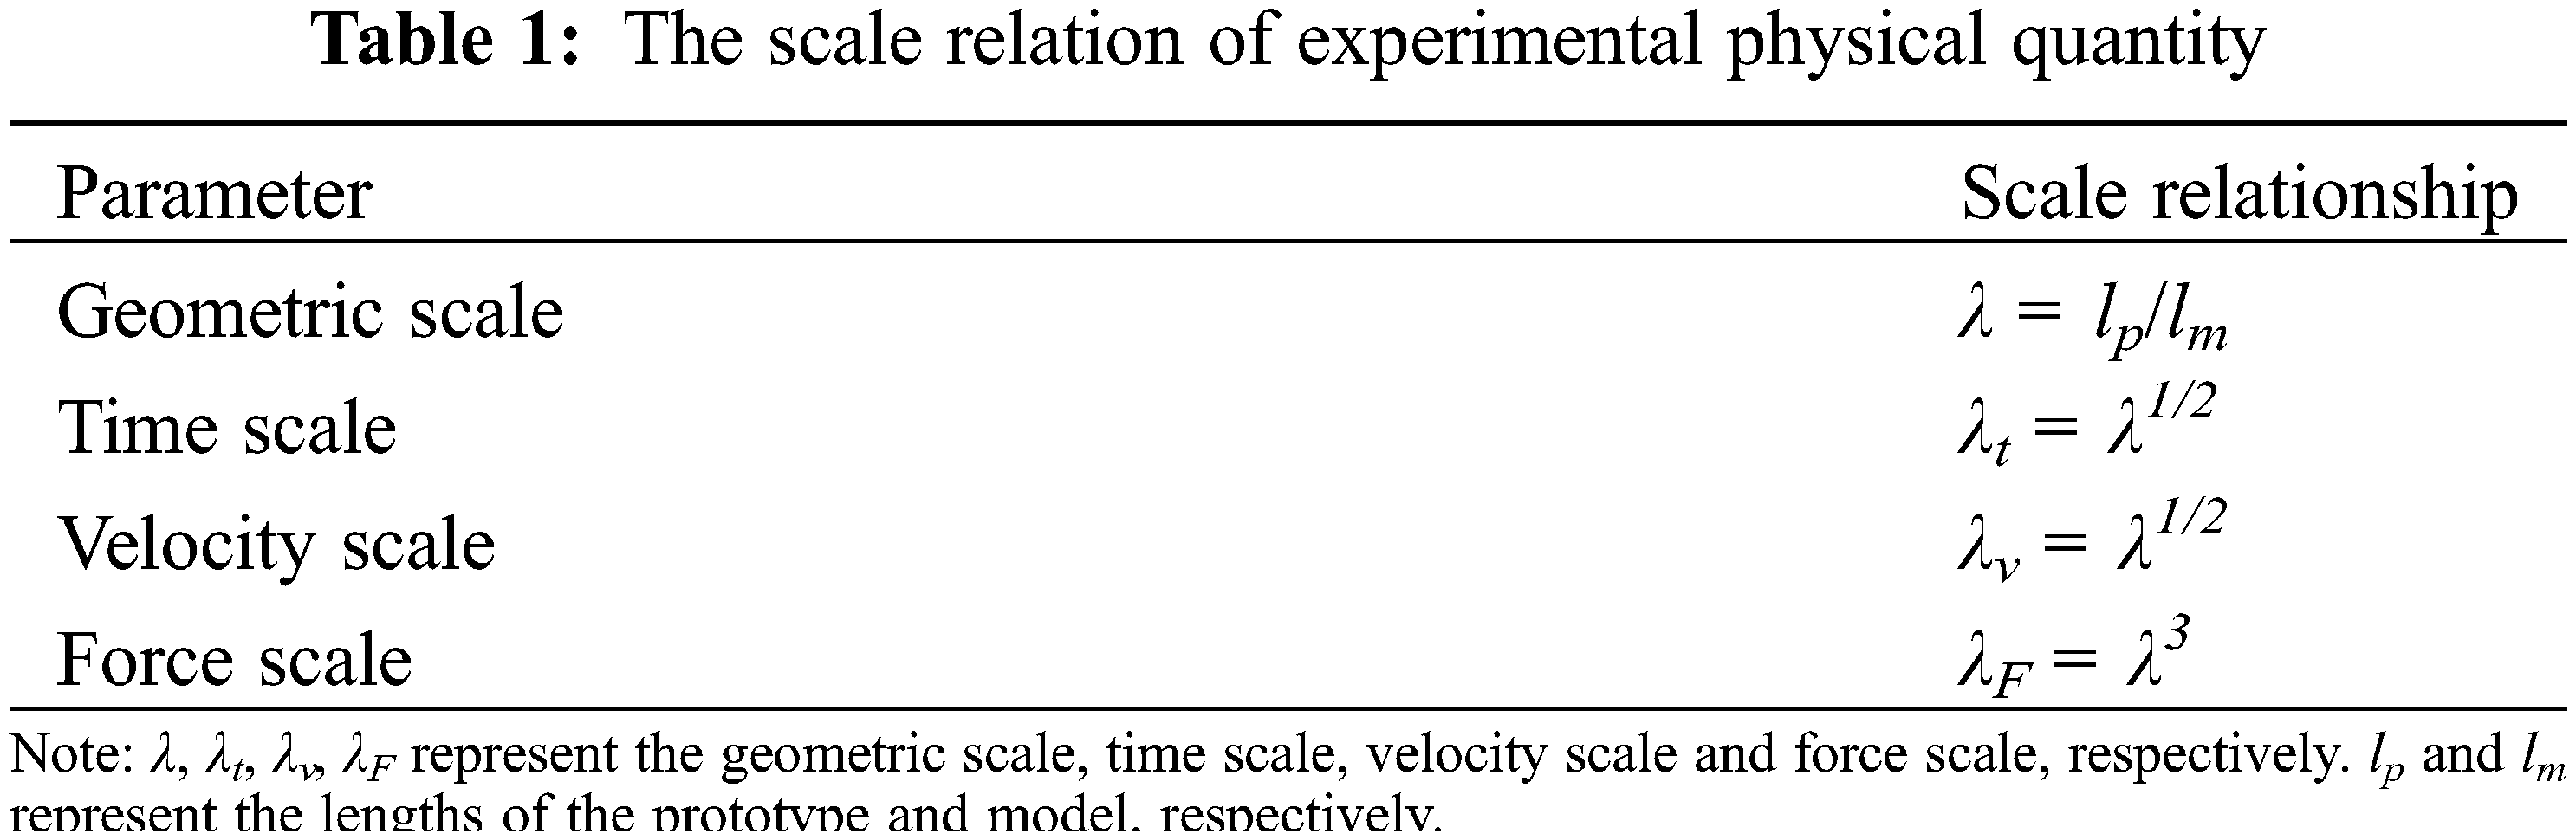

Figure 3: Shuttle-shaped cap-pile group model (unit: cm)
The test model was installed on a rigid steel frame (Fig. 4a), positioned approximately 35 m from the wave generator. Fig. 4b shows the installation diagram, perpendicular to the wave propagation direction. The fixed base, three-component force sensor, adapter clamp, and shuttle-shaped cap–pile group were connected by high-strength bolts to ensure the model mounting rigidity. The top of the cap was equipped with four M8 bolts to securely hold the model in place, while the adapter clamp had bolt-mounting holes spaced 22.5° apart. To prevent any interference from the ground, the bottom of the pile group was maintained 1 cm above the ground of the flume, thus ensuring accurate force measurements.

Figure 4: Installation diagram of shuttle-shaped cap-pile group model (unit: cm)
The flow field conditions for wave-only, current-only, and combined wave and current scenarios were simulated to evaluate the loads and their respective development trends on the shuttle-shaped cap–pile foundation. The water depth and the waves and currents conditions adopted in the experiment were derived from recorded data of the water channel.
The water depth at the bridge site was 60 m under normal conditions, with the highest and lowest tidal levels occurring over a 100-year return period as 3.5 and −2.6 m, respectively. For the experiments, three water depths (i.e., d = 47.0, 49.0 and 52.0 cm) were selected. The simulated water levels are depicted in Fig. 4b.
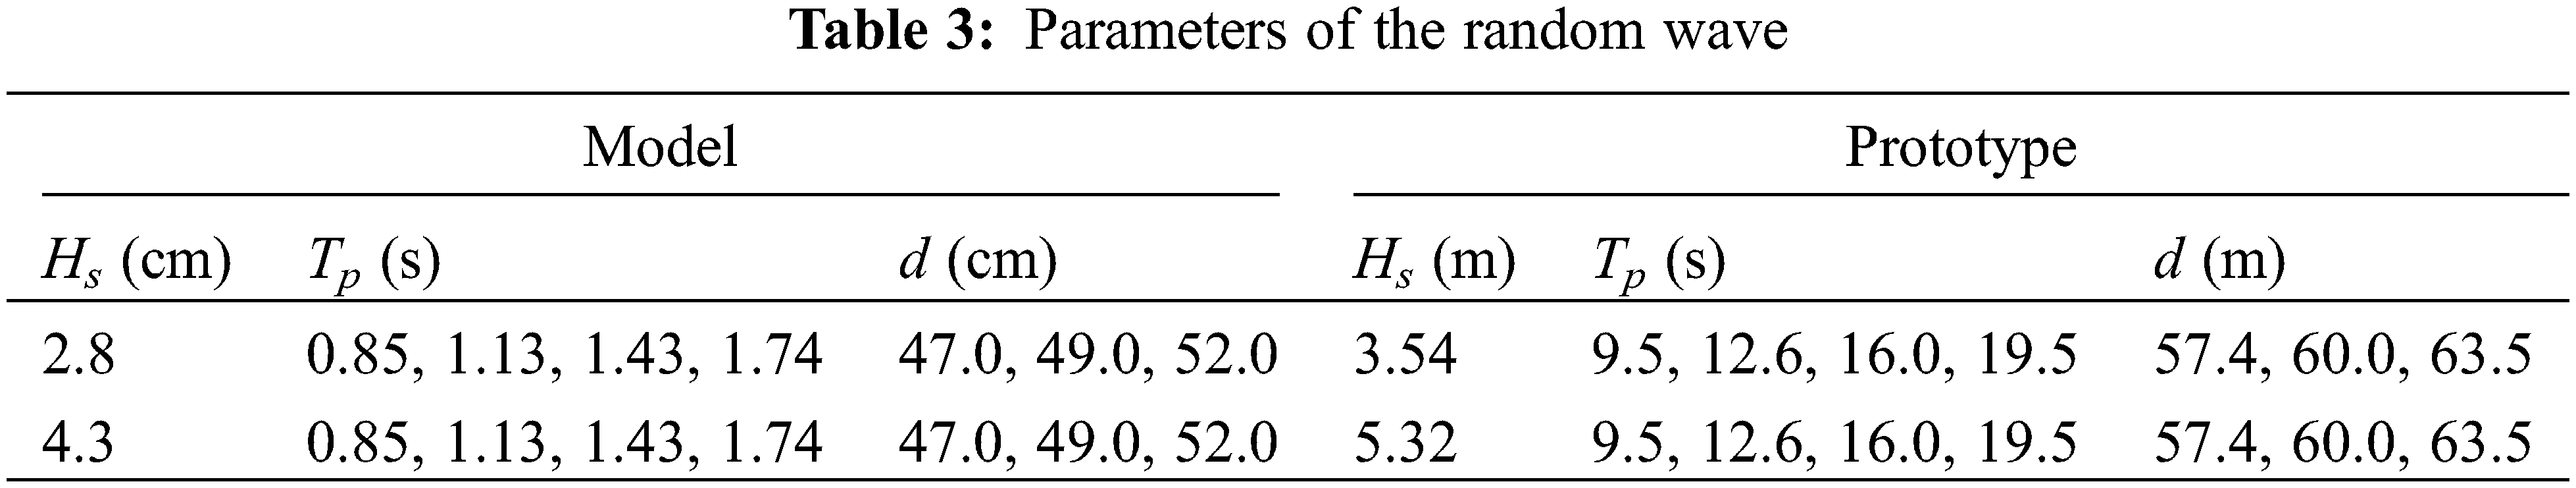
The wave heights corresponding to cumulative frequencies of 1% and 13% were 7.80 and 5.32 m, respectively, over a 100-year return period, with an average wave period of 10.4 s. Then, a JONSWAP spectrum was generated, featuring significant wave heights (Hs) of 5.32 and 3.54 m, as well as peak periods (Tp) of 12.6 and 9.5 s. In order to gain a deeper understanding of the dynamic loads acting upon the shuttle-shaped cap–pile foundation in response to long-period waves, peak periods Tp of 16 and 19.5 s were incorporated. To maintain consistency, a geometric scaling of 1:125 was applied following Froude’s similarity criterion. The corresponding relation between the model and the prototype regarding wave parameters is presented in Table 3.
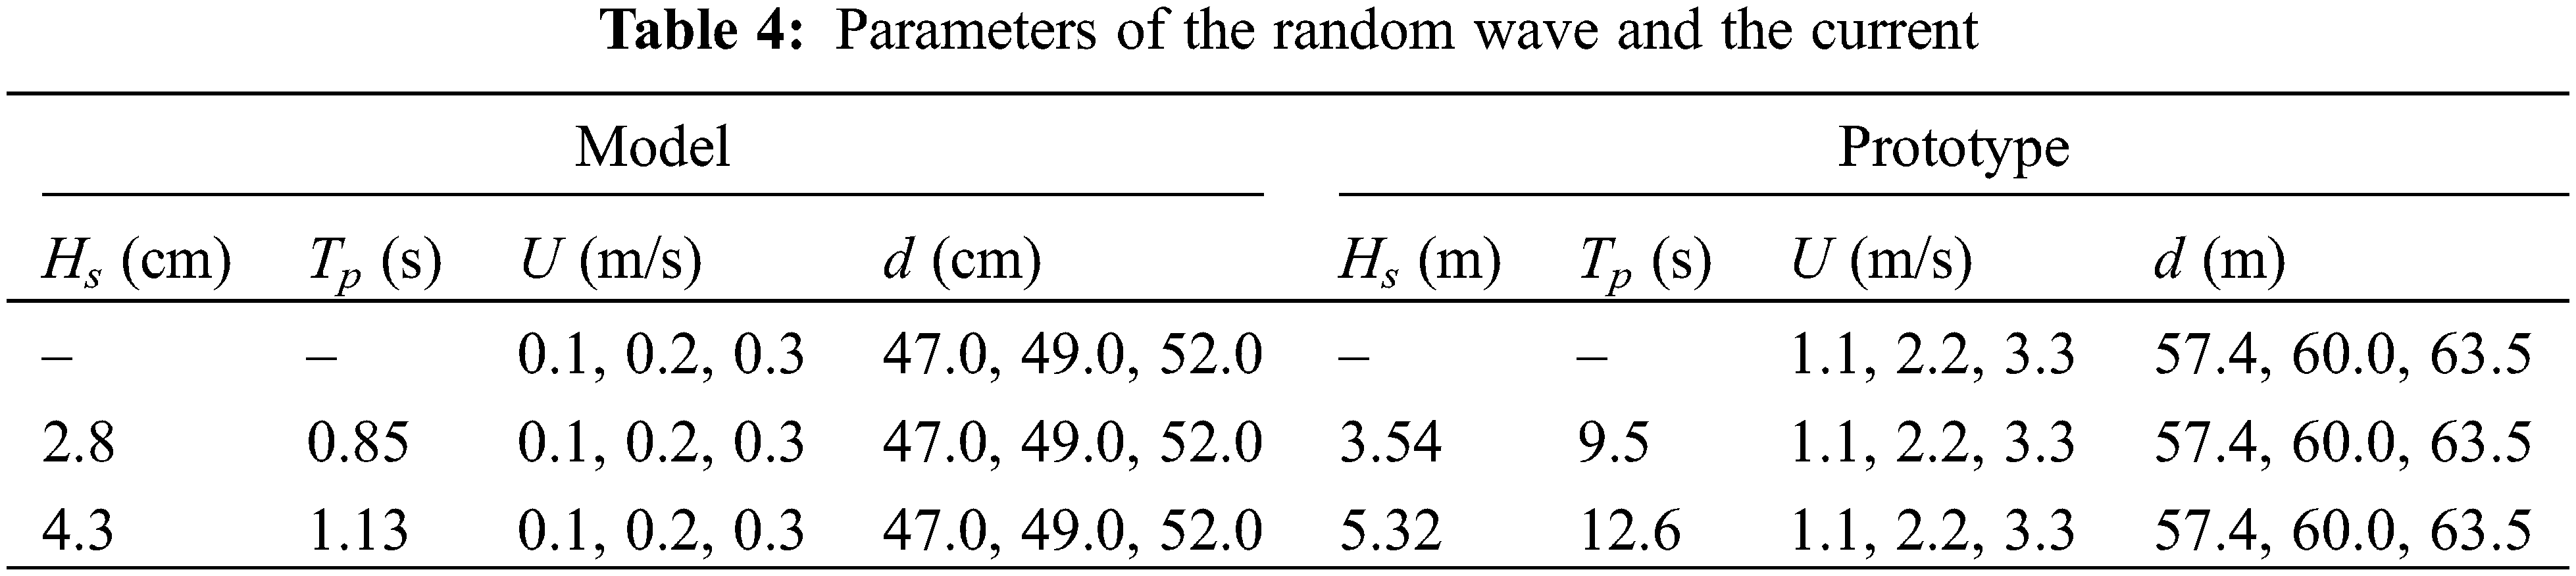
Under the current-only conditions, uniform currents with velocities (U ) of 1.1, 2.2, and 3.3 m/s were devised for the experiment, based on the design current velocity (U) of 3.3 m/s over a 100-year return period. For the combined actions of random waves propagating in the same direction as the currents, two scenarios were considered: random waves with Hs = 3.54 m and Tp = 9.5 s, and Hs = 5.32 m and Tp = 12.6 s were combined with currents with velocities U = 1.1, 2.2, and 3.3 m/s. The parameters of the waves and currents for both the model and prototype are displayed in Table 4. In addition, the simulation included three different incident angles (i.e., θ = 0°, 22.5°, 45°) for waves and wave currents, achieved by adjusting the mounting hole of M8 bolts, as shown in Fig. 3a.
2.3 Operation Mode of Wave and Current Conditions
This experiment adopted the same method applied by Kang et al. [20] for generating wave and the current conditions. For the wave-only conditions, random waves were generated by the reciprocal motion of the wave generator. For the current-only conditions, uniform currents were generated by adjusting the flow rate of the circulation pump system until a stable current velocity was achieved. For the wave–current interaction conditions, the current-only condition was initially established, and then the wave generator was activated using the same control parameters as in the wave-only condition. The measurements of wave–current forces on the model were conducted when both the waves and currents remained sufficiently stable.
2.4 Instrumentation and Data Sampling
In this study, three instruments were utilized for measurements: wave gauges, Acoustic Doppler Velocimetry (ADV) and a three-component force sensor. To capture the distribution of the wave field, six capacitance-type wave gauges (WG1~WG6) were arranged at different locations inside the flume, as shown in Fig. 2a. The wave gauges featured a length of 30 cm, a resolution of 0.1 mm, accuracy within ±0.3%, and a sampling frequency of 200 Hz. Specifically, WG1 was positioned 4.5 m upstream of the model to measure the incident waves, WG2 and WG3, WG5and WG6 were placed to record fluctuations around the model, while WG4 served the purpose of assessing waves at the same horizontal location outside the center area of the model.
An ADV (CM1) was positioned 6.5 m upstream of the model to measure the current velocity, as shown in Fig. 2a. The ADV system boasted an accuracy of 0.5% and operated at a sampling frequency of 100 Hz.
The forces acting on the model were measured by the three-component force sensor FC3D80, which was installed as shown in Fig. 4b. The calibrated sensor possessed the following performance-related characteristics: Fx and Fy were within a range of ±150 N, with a resolution of 0.015 N; while Fz was within a range of ±300 N, with a resolution of 0.03 N. The three-component force sensor had a sampling frequency of 200 Hz. Fx represented the inline force, consistent with the direction of the bridge; Fy represented the transverse force, perpendicular to the direction of the bridge; and Fz represented the vertical force.
All wave gauges, the ADV, and the three-component force sensor were calibrated prior to the experiment. The experiment was repeated three times for each set of conditions, and the resulting average value was utilized to minimize random error and improve accuracy.
Before the installation of the shuttle-shaped cap–pile group model, calibration tests were conducted separately for random waves and only currents. Furthermore, the variations in the significant wave height were measured under the combined actions of random waves and currents. The significant values of wave heights, wave forces and wave–current forces were determined by averaging the first third of the maximum crest or trough values of the time series of the measured data, as follows:
where
The ratio of the transverse dimension D of the model to the width B of the water flume is defined as the blocking ratio D/B. Due to limitations in the experimental setup, the blockage ratio for this study is approximately 0.2. According to the test conditions outlined in Tables 2 and 3, the corresponding Reynolds number is high (Re = 2.5 × 10⁴~1.5 × 10⁵). For the flow around a circular cylinder, Zdravkovich [31] noted that for high Reynolds numbers, when D/B < 0.1, the blockage effect can be ignored as it has minimal impact. However, when 0.1 < D/B < 0.6, the blockage effect slightly affects fluid flow; When D/B > 0.6, the blockage ratio becomes a control parameter, leading to a complete alteration of the flow pattern around the cylinder. Studies by Liu [32] showed that, with a blockage ratio of 0.2 and 0.05, the variation pattern of the wake vortex remained largely unchanged, with negligible impact from the wall surface. Additionally, when the blockage ratio did not exceed 0.2, the variations in the hydrodynamic coefficients CD and CL were relatively smooth. Griffith et al. [33] and Yang et al. [34] similarly suggested that the blockage effect has a minimal impact on flow when the blockage ratio D/B ≤ 0.2, warranting it being disregarded. Moreover, Al Mashan et al. [35] successfully obtained reasonable experimental results using a blockage ratio of D/B > 0.4 in an offshore platform model experiment. Therefore, in this study, the D/B is approximately 0.2 for most cases, implying that the blockage effect has an insignificant influence on the hydrodynamic loads on the shuttle-shaped cap–pile group foundation. Thus, subsequent analysis will not take the blockage effect into consideration.
3 Random Wave Field in the Currents
The experimental parameters are detailed in Tables 3 and 4. The analysis of test results for the wave surface at d = 49 cm is presented as follows:
3.1 Calibrating of Random Waves and Changes under the Influence of Currents
The representative time series of wave elevations for water depth d = 49 cm with random waves Hs = 2.8 cm and Tp = 0.85 s, and Hs = 4.3 cm and Tp = 1.13 s, both with and without the current, are presented in Figs. 5a and 5b. Comparisons between the measured and the target spectrums of the random waves are also shown.

Figure 5: Time series for surface elevations of random wave and random wave with current, and the comparison of spectrums
The measured spectrum for the random waves alone was in alignment with the target spectrum, which verified the accuracy of the simulated random waves. Furthermore, the time series of wave elevations clearly indicates that the influence of the current primarily manifests as a reduction in wave amplitude, which became more pronounced with increasing current velocity. Interestingly, the peak spectral S(ωm) exhibits a significant decrease with an increase in the current velocity, while the peak frequency ωm was nearly unaffected. Specifically, the peak spectral for Hs = 2.8 cm and Tp = 0.85 s decreased by 21.4% under a current velocity of U = 0.1 m/s, while the peak spectral for Hs = 4.3 cm and Tp = 1.13 s decreased by 48.3% under a current velocity of U = 0.3 m/s.
3.2 Influence of Current on the Significant Wave Height
Li et al. [36] conducted research on wave deformations under the influence of current, revealing that random waves can be regarded as a linear superposition of several simple harmonic waves based on the conservation principle of wave flux and the linear superposition principle of stationary random processes. For waves in deep water, the estimation of the current-affected significant wave height can still be achieved through the evaluation method applied to wave height under regular wave–current interaction. Therefore, the transformation of the wave height
where
Fig. 6 presents a comparison of significant wave heights between the measured data and the theoretical values under the combined actions of random waves with
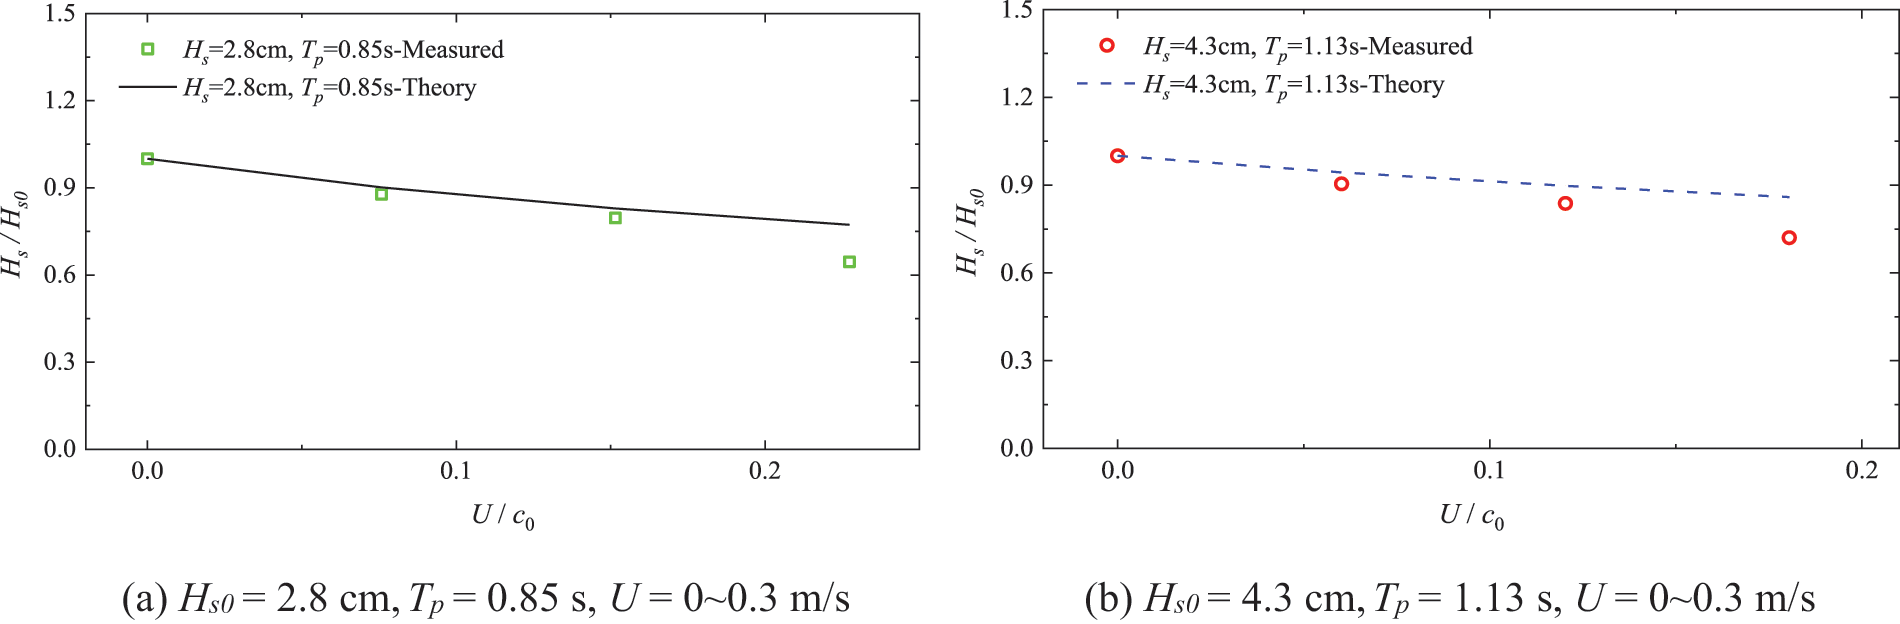
Figure 6: Comparison of significant wave heights between the measured data and the theoretical solutions with different current velocities (d = 49.0 cm)
The comparison of the data demonstrates that in deep water, the variation trend of significant wave heights aligns with the theoretical solution when considering changes in the current velocity, particularly within the range of
4 Experimental Results and Discussion
4.1 Significant Wave Forces on the Shuttle-Shaped Cap–Pile Group
4.1.1 Time Series of Typical Wave Force
The wave forces acting on the shuttle-shaped cap–pile group were measured under wave-only actions. Figs. 7a~7i illustrate the wave forces in three directions (i.e., inline (


Figure 7: Wave force time series in three directions (x, y and z) on the model for Hs = 4.3 cm, Tp = 1.13 s, θ = 0°
The study investigated the effects of wave incident directions and water depth on significant wave forces over a wide range of relative wavelengths (i.e., the longitudinal length of the cap/wavelength,
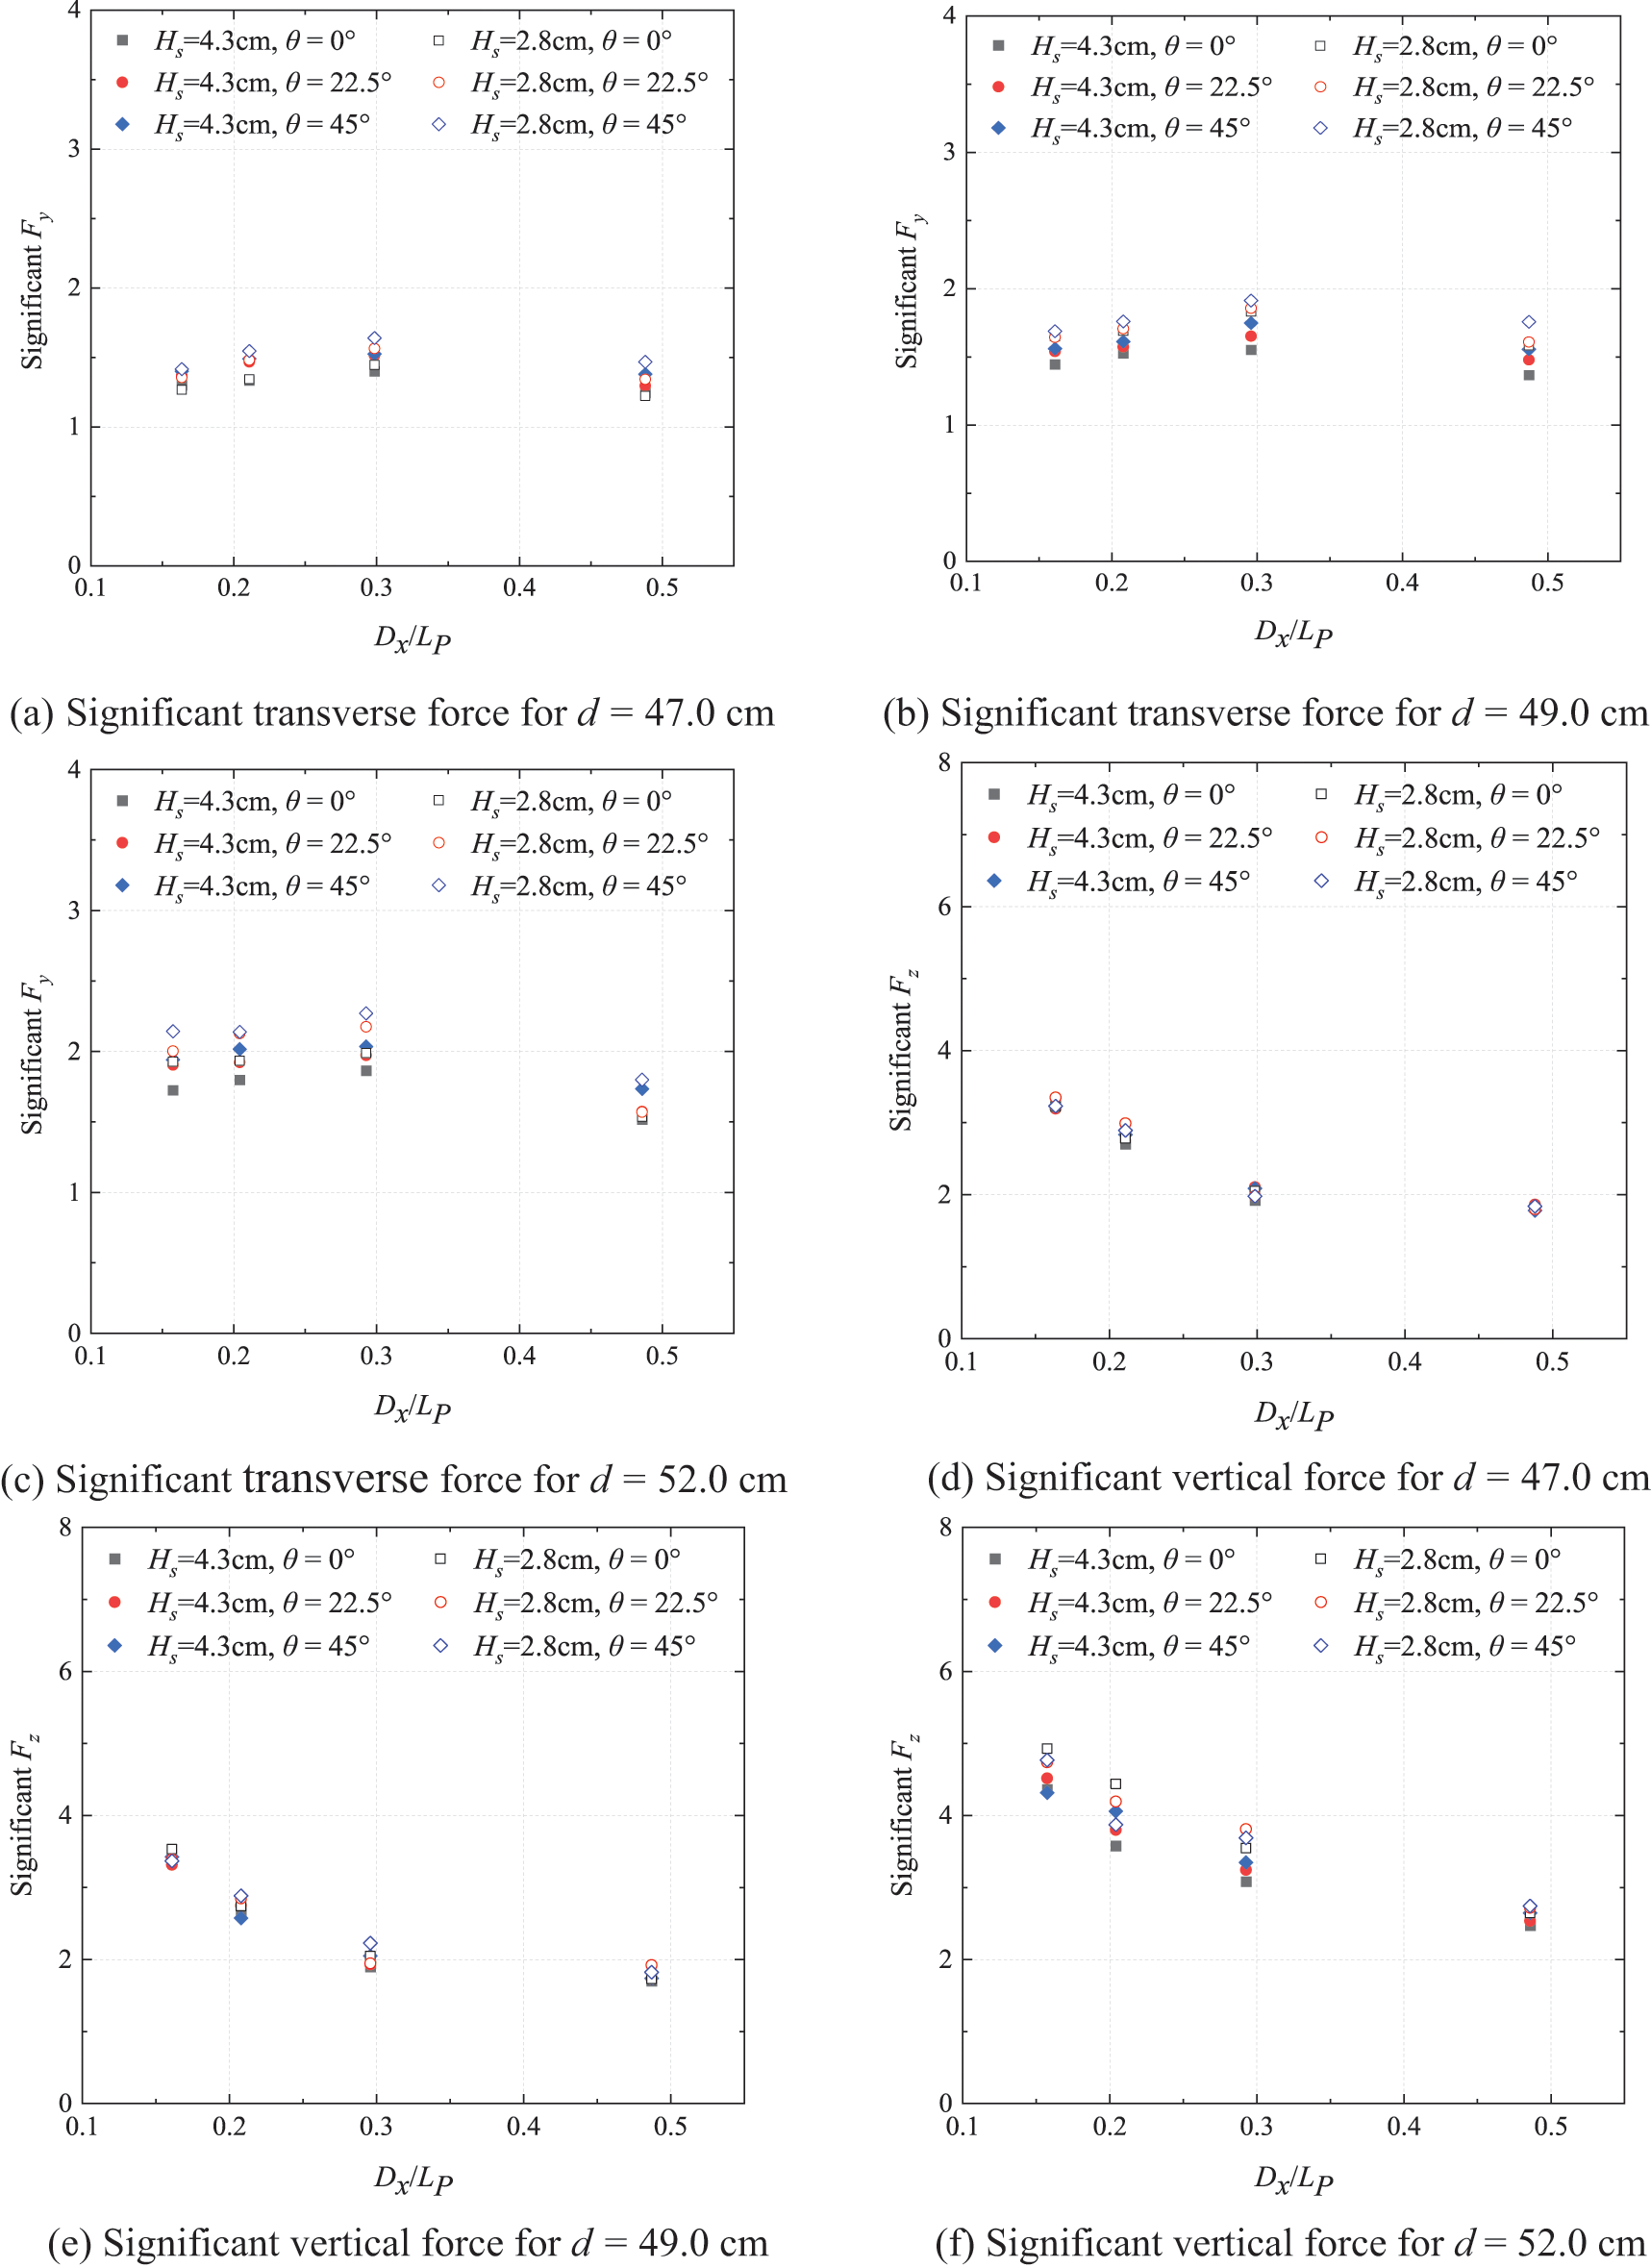
Figure 8: Significant transverse and vertical wave forces with respect to relative wavelength for different water depth and incident angles for
Figs. 8a~8c reveal that the transverse significant wave force
The incident direction of the wave exerts a certain influence on the transverse significant wave force. On one hand, a larger incident angle θ results in a greater water-blocking area for the structure. On the other hand, as shown in Fig. 3, the relatively dense arrangement of the pile group causes the forward piles to shield the rear piles due to the wave diffractions. Simultaneously, within the range of incident angles θ from 0° to 45°, the angle between the geometric connection of the front and rear piles and the wave propagation increases. thereby weakening the shielding effect. Additionally, the projected length of the model in the wave propagation direction decreases, leading to a decrease in phase lag. The combined effect of these factors causes the transverse wave force to increase with the incident angle. Moreover, the difference in transverse significant wave force slightly increases with the relative wavelength under the three wave incidence angles. For most wave conditions, when the incident angle was 45° or 0°, the difference in
For the same wave conditions, the transverse significant wave force increases with the water level. In particular, for the case of
Figs. 8d~8f illustrate that the vertical significant wave force
The incidence angle has minimal effect on the vertical significant wave force
The water level has a significant impact on the vertical significant wave force
The above analyses indicate that the combination of a long wave and a high tide results in the transverse and vertical wave loads being the primary design loads on the shuttle-shaped cap–pile group.
4.2 Significant Wave–Current Forces on the Shuttle-Shaped Cap–Pile Group
4.2.1 Times Series of Typical Wave–Current Forces
The forces acting on the shuttle-shaped cap–pile group, including inline (
The forward amplitudes of the transverse forces exhibit a significant increase with high current velocity, while their reverse amplitudes decrease rapidly. Conversely, low-velocity currents have minimal effect on the transverse force, as shown in Figs. 9a~9f. When the current velocity is
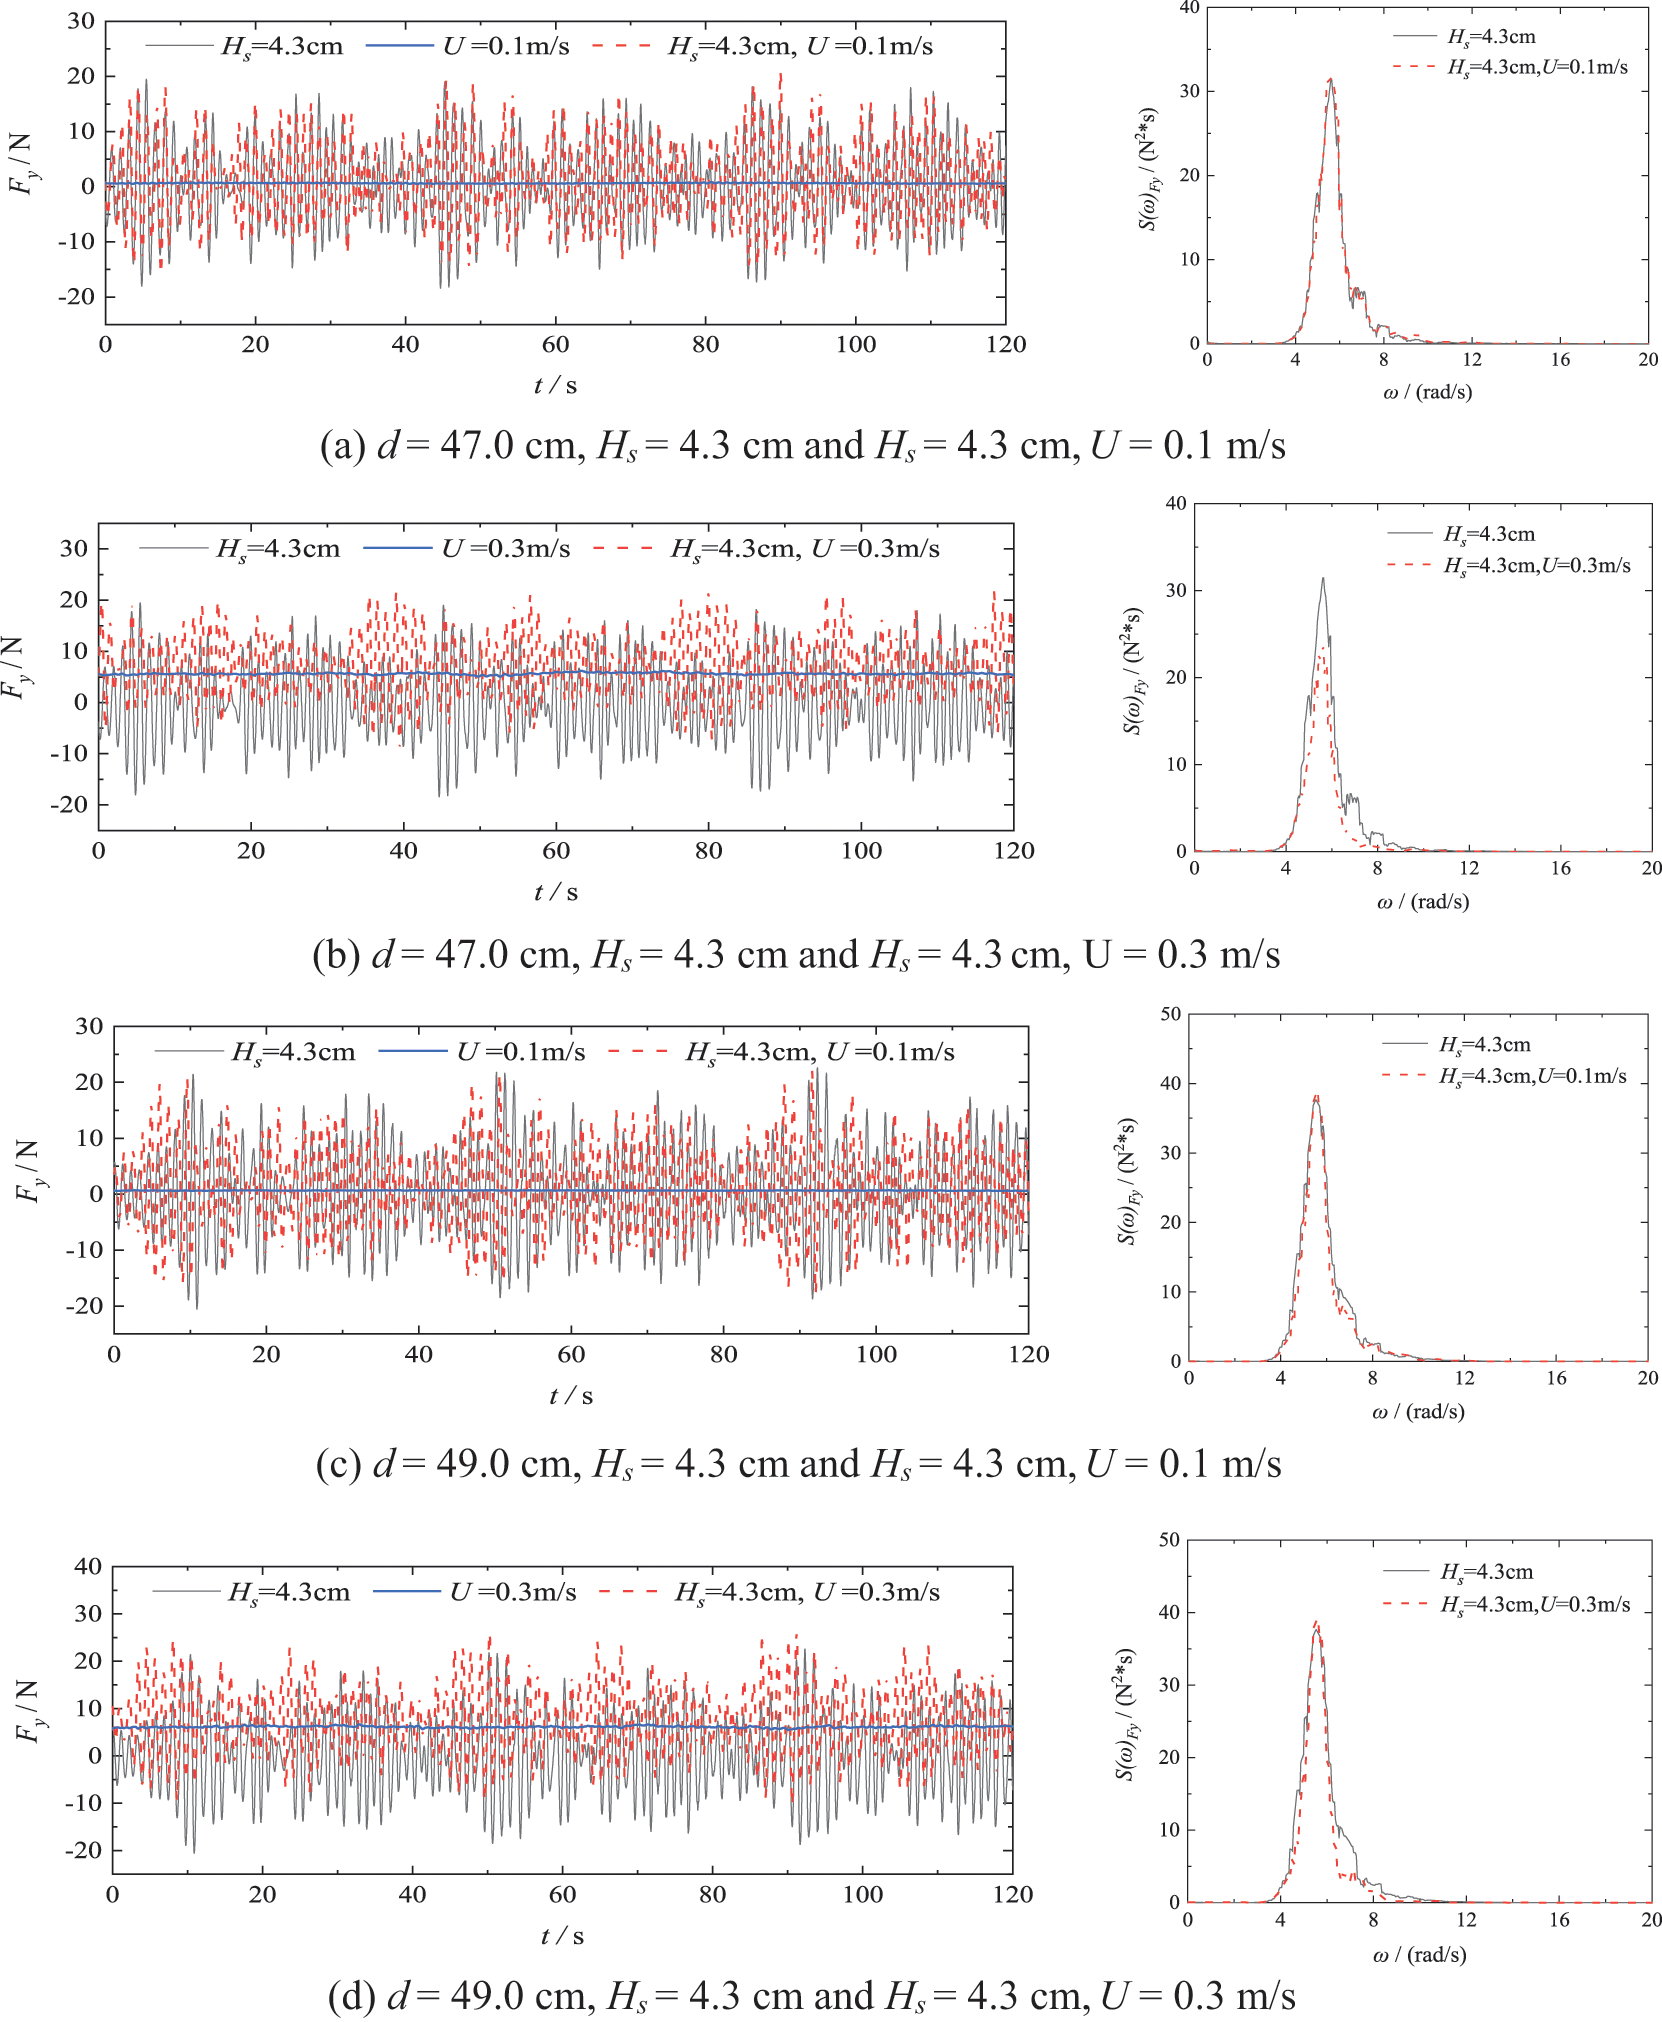

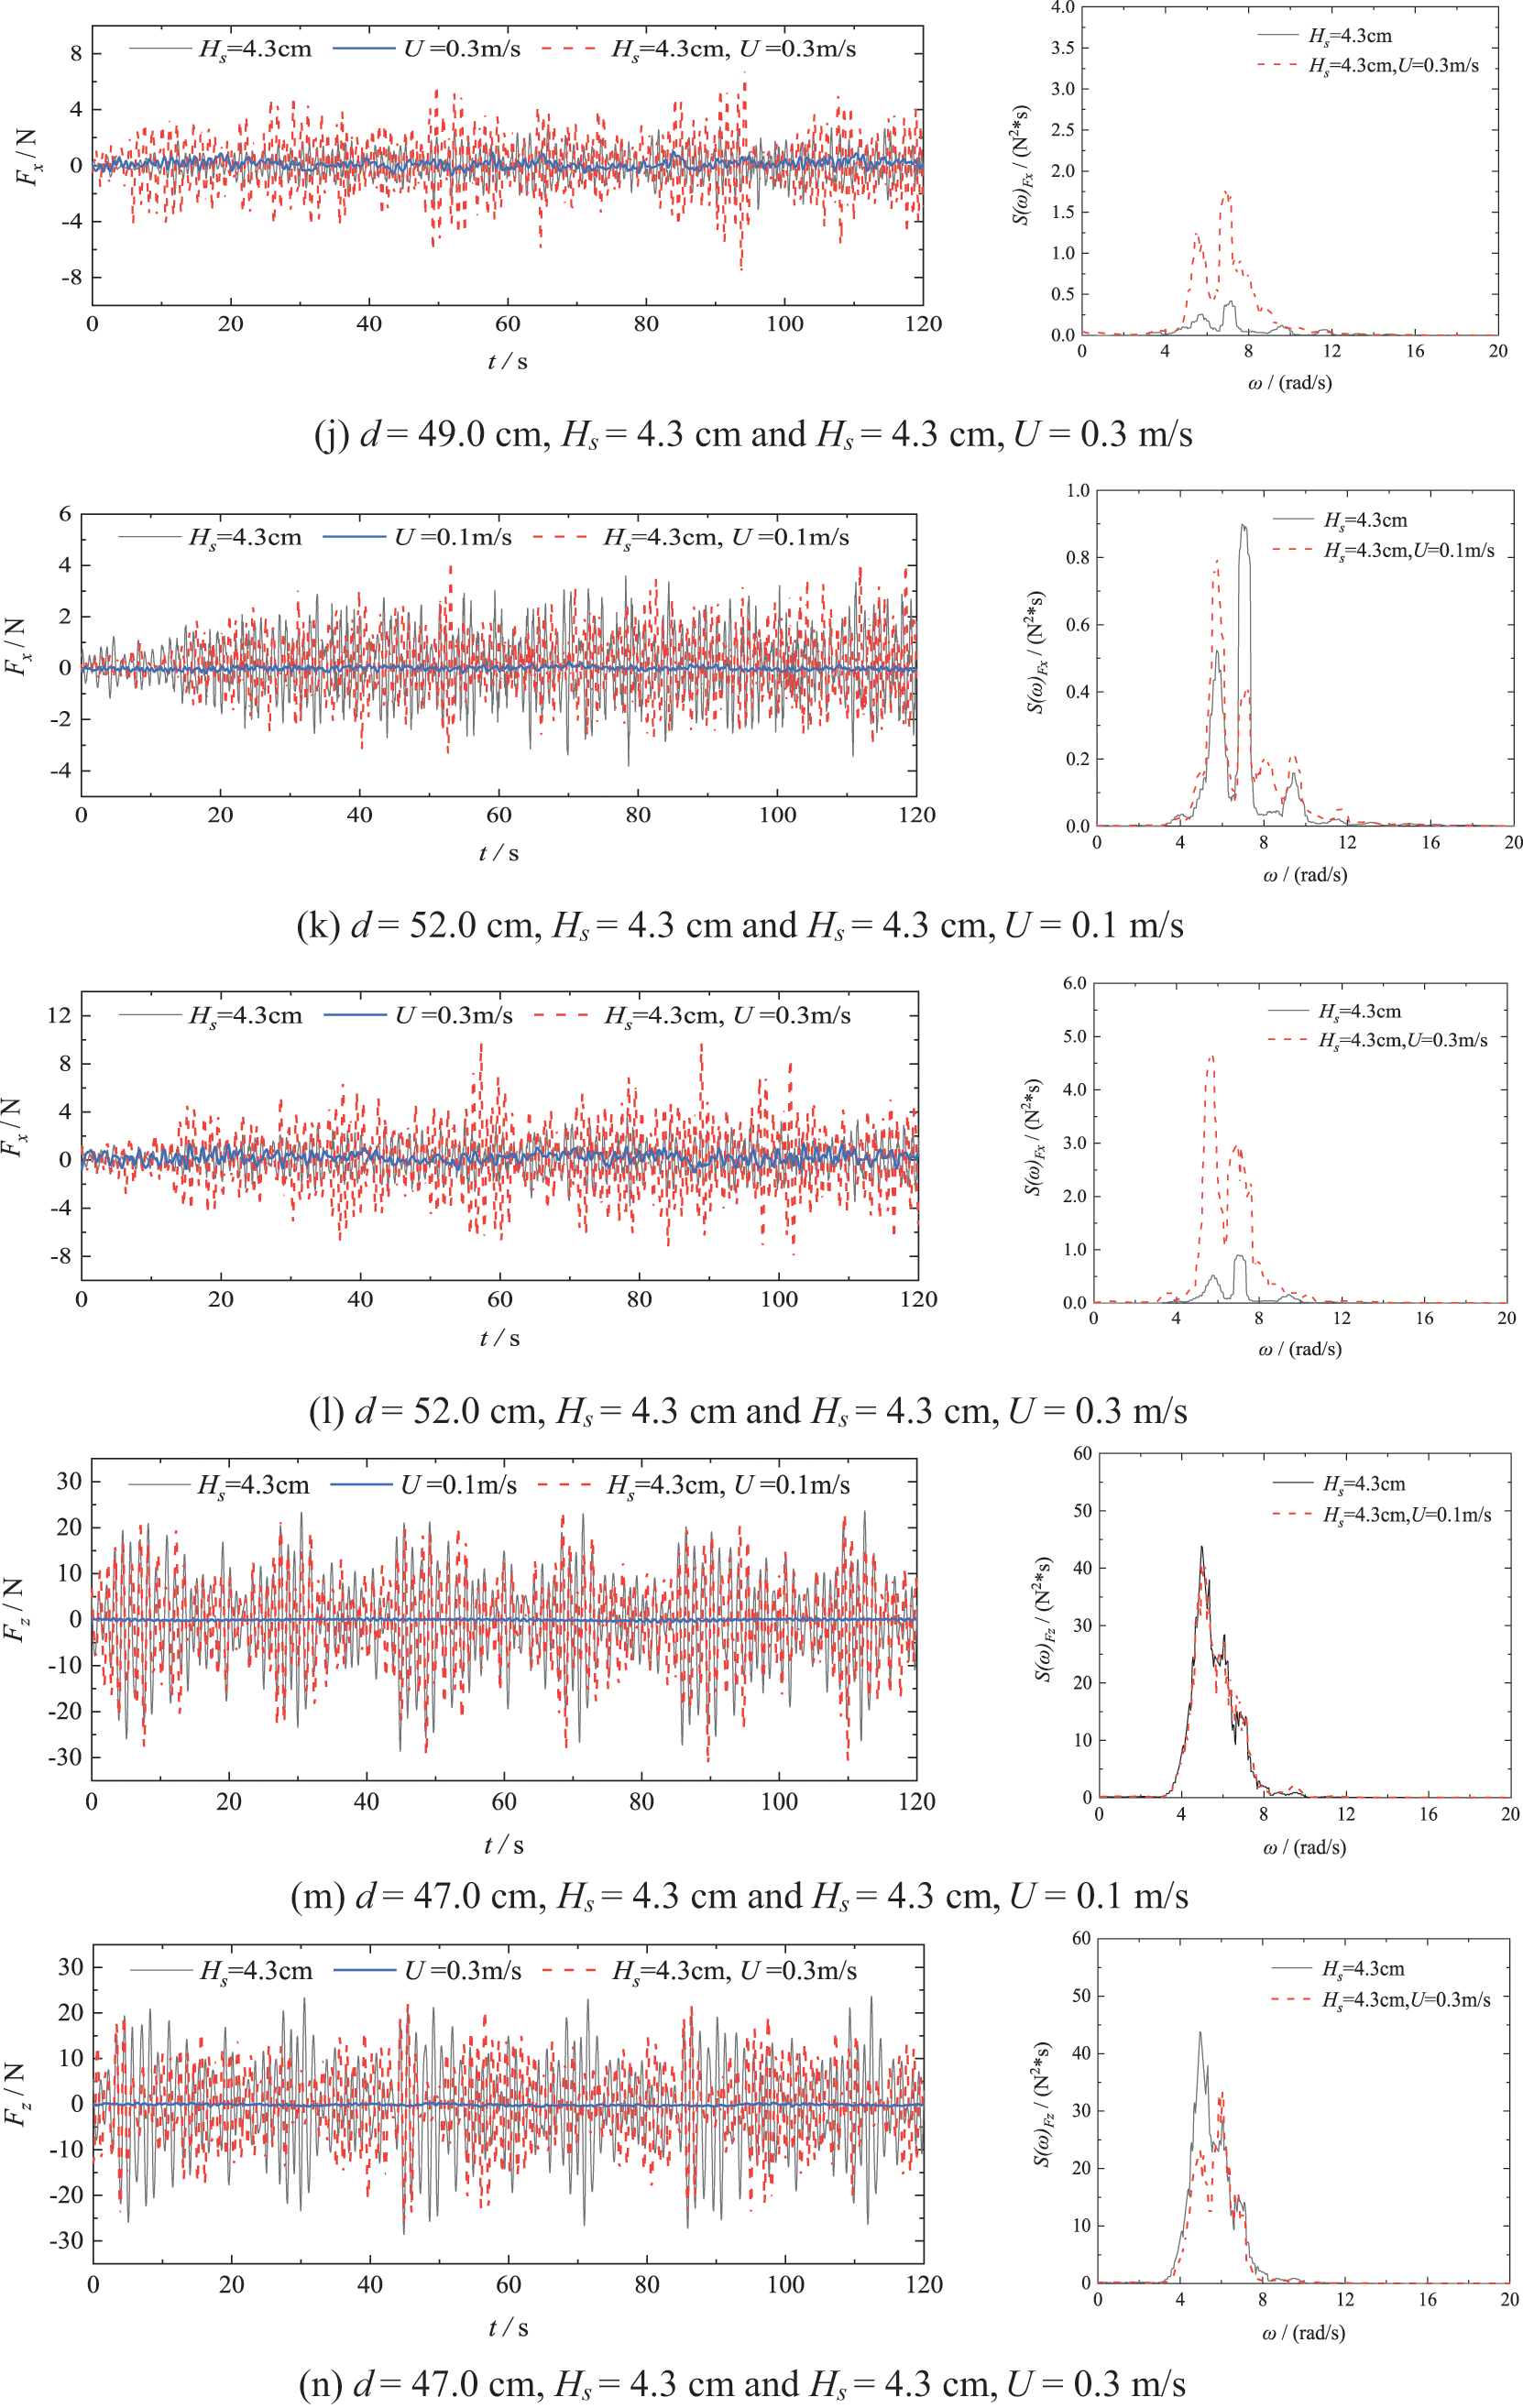
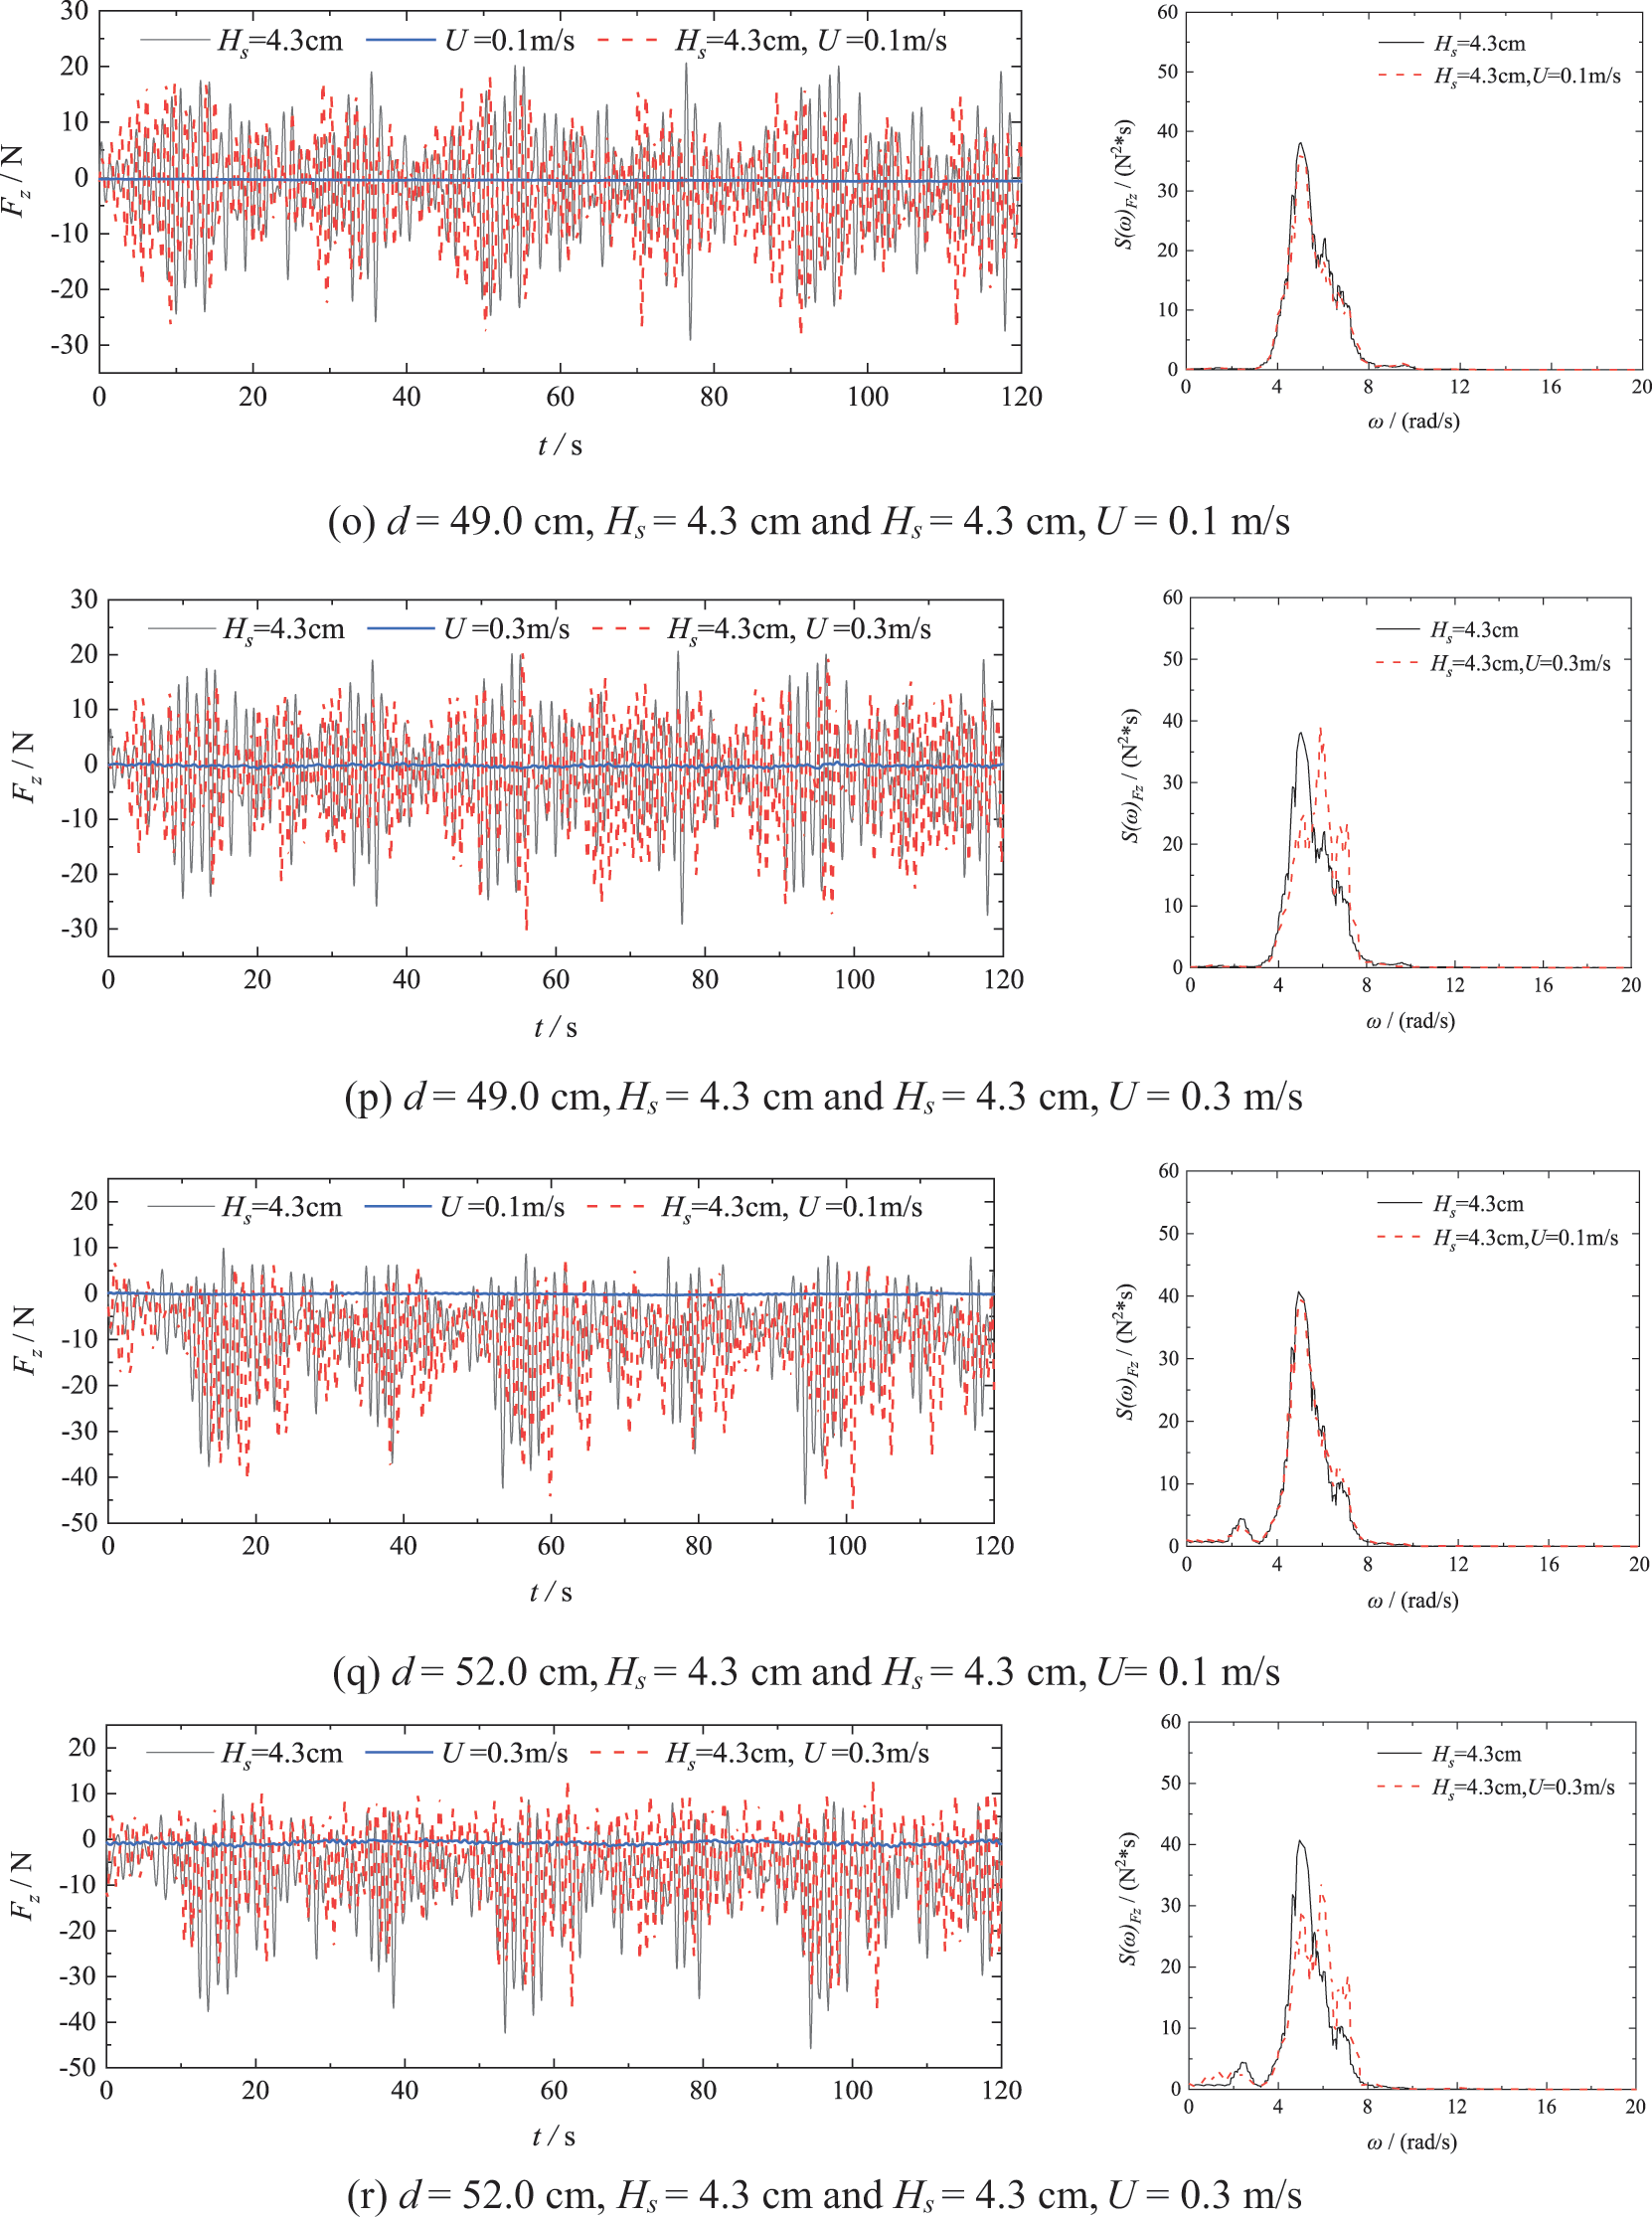
Figure 9: Time series and spectrums for forces in three directions (x, y and z) on the model driven by random waves, currents, and random waves combine with currents
The amplitude of the inline force
The amplitude of the vertical force
The effects of the water level on forces in all three directions during wave-current actions are found to be similar to those under wave-only actions. With consistent parameters for waves and currents, the amplitude of the transverse forces increases as the water level rose. Notably, the amplitude of the downward vertical forces experiences a noticeable increase with rising water level, while the amplitudes of the uplift forces gradually decrease. However, the water level does not noticeably affect the amplitude of the inline forces.
In general, a high-velocity current results in significantly higher inline and transverse forces on the shuttle-shaped cap–pile group under wave–current actions compared to wave-only actions. In particular, the amplitude of the inline force increases several times.
4.2.2 Significant Wave–Current Forces
The study investigated the impact of the structure orientation and the water depth on significant wave–current forces over a wide range of relative velocities (U/c). Fig. 10 demonstrates the variations in dimensionless significant forces (i.e., inline (
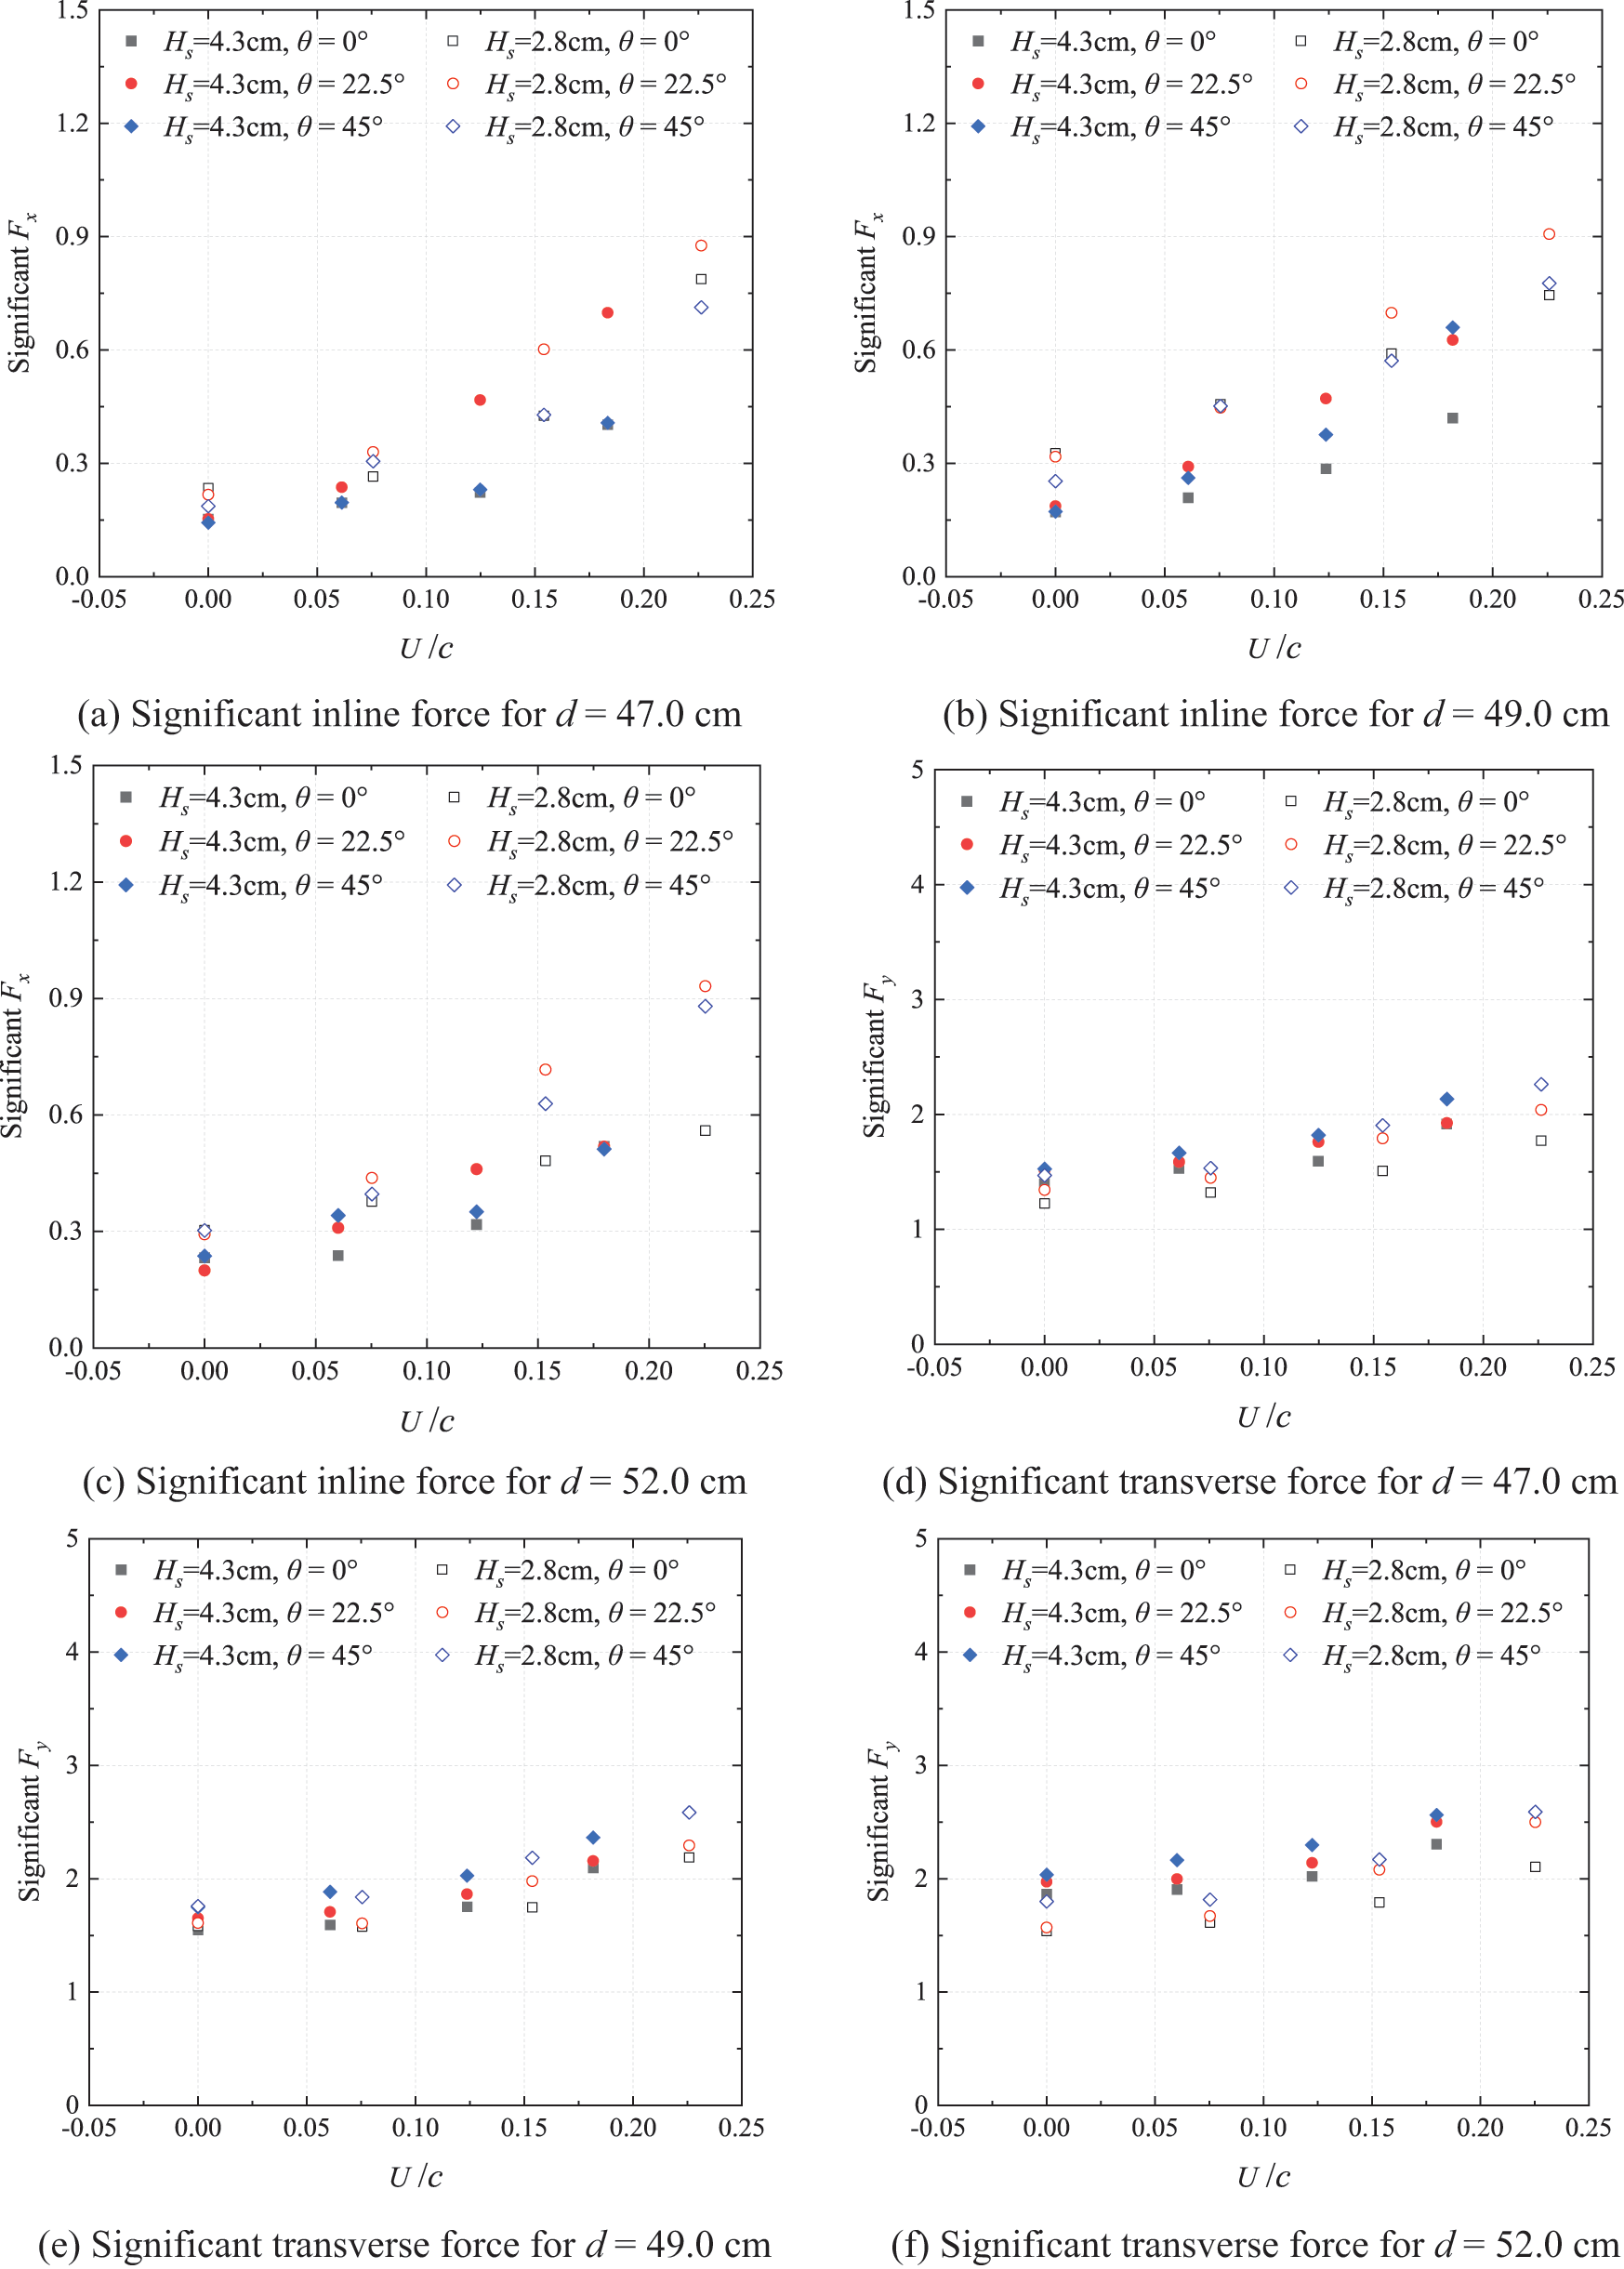

Figure 10: Significant inline, transverse and vertical wave-current forces with respect to relative velocity for different water depth and orientation for Hs = 2.8 and 4.3 cm
Figs. 10d~10f reveal the rapid increase in the transverse significant wave-current force
The impact of high-velocity currents on inline wave–current forces is found to be significant. As shown in Figs. 10a~10c, the combination of random waves with heights
The significant vertical wave-current force undergoes a reduction to some extent due to the influence of high-velocity current, which is significantly affected by the water level. Figs. 10g~10i demonstrate that, for water levels in the middle of the cap (i.e., d = 47 and 49 cm), the significant vertical wave–current force
The experimental results demonstrate the necessity of considering the influence of current in evaluating the design loads of the shuttle-shaped cap–pile foundation. Moreover, wave height, current velocity, incidence flow direction and water level at the bridge site are significantly determinants of wave–current loads of the foundation. To accurately evaluate and optimize the wave–current forces acting on the bridge foundation, all the aforementioned factors must be carefully taken into account during the design process. These experimental results serve as a valuable reference for the design of the cap–pile foundation.
4.3 Comparison with Simple Methods of Estimating Significant Wave–Current Forces
In practice applications, the wave-only transverse force and current-only transverse force are commonly linearly summed to estimate the wave–current transverse force on the deep-water foundation, as presented by Mei et al. [23] and Pan et al. [24]. In this section, we examined the disparities between the measured significant transverse wave–current forces (
Figs. 9a~9f illustrate the slight fluctuations observed in the measured current forces under the current-only actions. The current force (
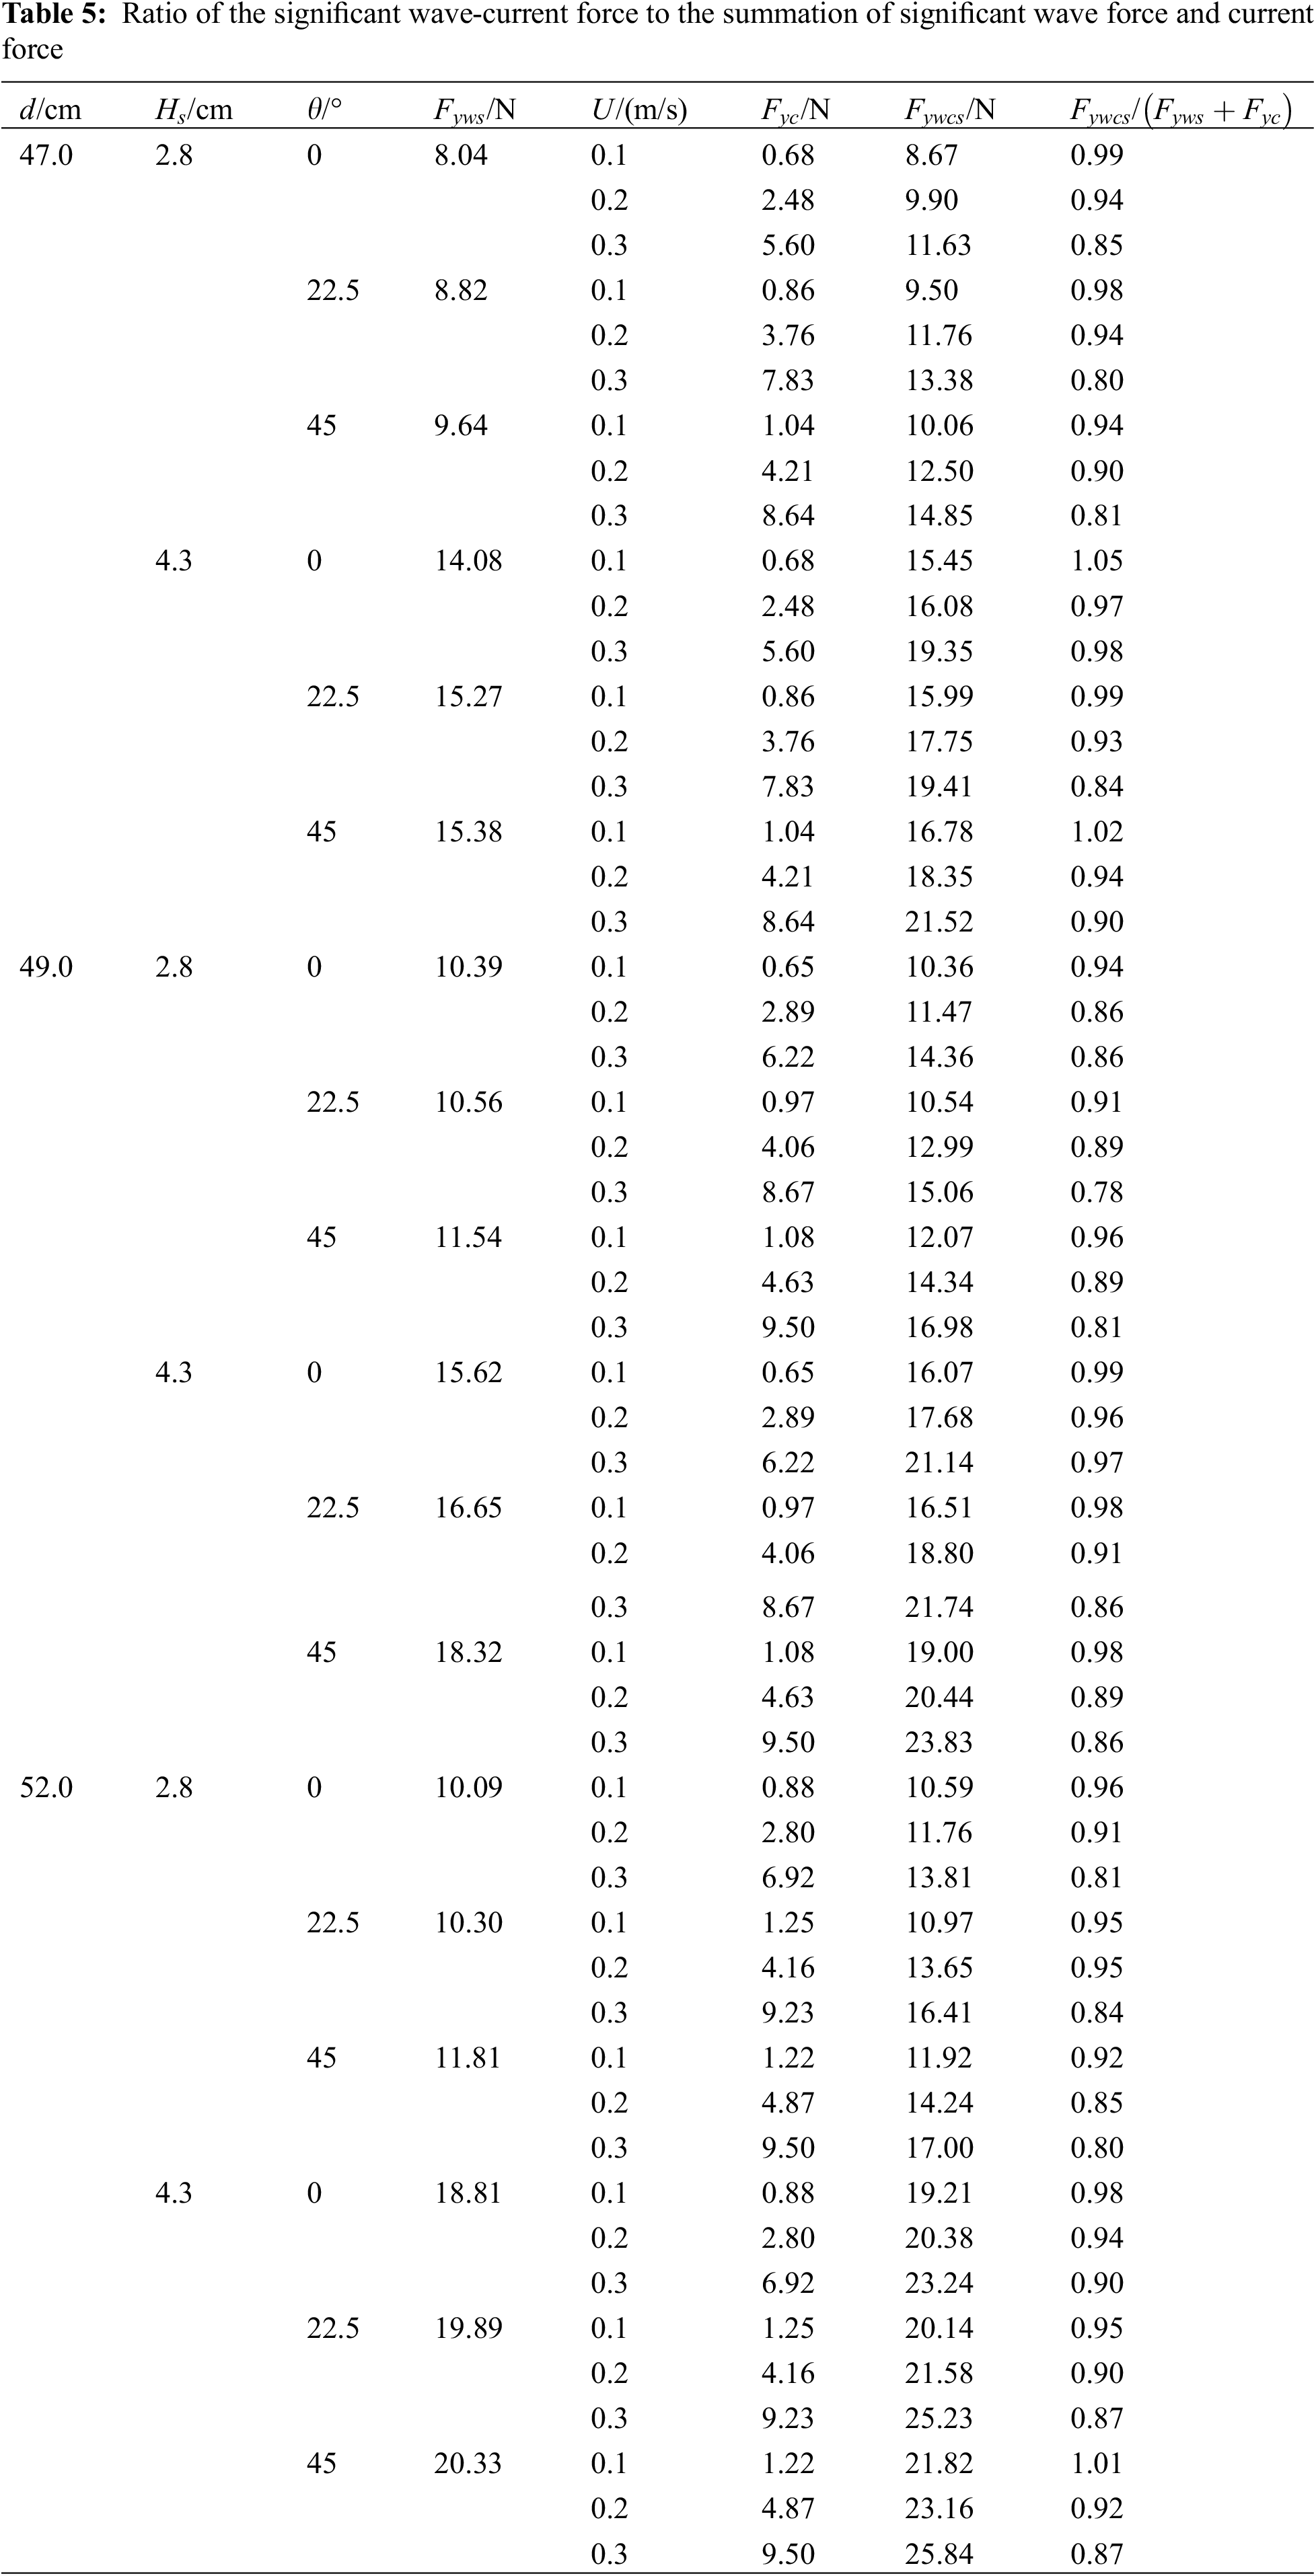
The findings suggest that for high waves with low velocities, the significant transverse wave–current force is approximately equal to the combined linear sum of the significant transverse wave force and the current force. However, due to non-linear wave–current interactions, the linear summation of the significant transverse wave force and the current force overestimate the actual significant transverse wave–current force acting on the shuttle-shaped cap–pile foundation in the majority of wave–current scenarios. In practice, relying on this simple superposition method to estimate wave–current forces on deep-water foundations may result in unnecessary waste of resources and financial burden. Conducting precise model experiments of wave-current interaction provides a more accurate and dependable approach to evaluating the wave-current load on such structures.
This study experimentally investigated the effects of random waves and random wave–currents on a model of a shuttle-shaped cap–pile deep-water foundation for a sea-crossing bridge. The study measured the inline, transverse, and vertical forces generated by these interactions at various water levels and incident angles. The following conclusions can be drawn:
Under the random wave-only conditions, the shuttle-shaped cap–pile deep-water foundation primarily experienced transverse and vertical wave forces. When the relative wavelength
The tests conducted under the combined actions of waves and currents revealed that an increase in relative current velocity resulted in higher inline and transverse forces on the structure. Notably, the transverse force showed a significant increase under the combinations of strong waves and currents, in contrast to the scenario where waves acted alone.
In actual engineering design for large deepwater foundations, the combination of high tide, strong waves, and strong currents emerged as the key control load condition. The shuttle-shaped cap–pile foundation experienced the most significant hydrodynamic load in this scenario, with the peak values of inline and transverse wave-current forces. These findings provide vital insights for the design of large deepwater foundation structures.
Under high water level conditions, the hydrodynamic load of the shuttle-shaped cap–pile foundation was even more significant. For the same wave conditions, the transverse wave force and vertical wave force under high water level conditions increase by more than 30% and 50%, respectively, compared to low water level conditions.
The impact of wave-current incidence angle on the hydrodynamic loads of the foundation was relatively limited. When
Furthermore, the study indicates that the linear summation wave-only and current-only forces would overestimate the actual significant transverse wave-current forces acting on the shuttle-shaped cap–pile foundation in most wave-current combined cases. Hence, this calculation approach is not a reasonable method for estimating wave-current forces, particularly under combined actions of waves and stronger currents.
Acknowledgement: This model test was conducted in the Laboratory of Offshore Engineering at Zhejiang University of Technology.
Funding Statement: This study was supported by the Major Special Science and Technology Project of “Ningbo Science and Technology Innovation 2025” (Grant No. 2019B10076), Natural Science Foundation of Zhejiang Province (No. LY23E080001).
Author Contributions: Conceptualization, Zhongda Lyu; Data curation, Chenkai Hong; Formal analysis, Lei Wang; Funding acquisition, Zhongda Lyu and Fei Wang; Methodology, Chenkai Hong; Project administration, Zhuo Zhao; Resources, Zhongda Lyu and Zhuo Zhao; Validation, Fei Wang and Lei Wang; Writing–original draft, Chenkai Hong; Writing–review & editing, Zhongda Lyu. All authors have read and agreed to the published version of the manuscript.
Availability of Data and Materials: The data supporting this study have been provided within this paper.
Conflicts of Interest: The authors declare that they have no conflicts of interest to report regarding the present study.
References
1. Hallowell S, Myers AT, Arwade SR. Variability of breaking wave characteristics and impact loads on offshore wind turbines supported by monopiles. Wind Energy. 2016;19(2):301–12. [Google Scholar]
2. Jameel M, Oyejobi DO, Siddiqui NA, Ramli Sulong NH. Nonlinear dynamic response of tension leg platform under environmental loads. KSCE J Civ Eng. 2017;21(3):1022–30. [Google Scholar]
3. Akiyama M, Frangopol DM, Arai M, Koshimura S. Reliability of bridges under tsunami hazards: emphasis on the 2011 Tohoku-oki earthquake. Earthq Spectra. 2013;29:295–314. [Google Scholar]
4. Morison JR, O’Brien MP, Johnson JW, Schaaf SA. The force exerted by surface waves on piles. J Petro Tec. 1950;2(5):149–54. [Google Scholar]
5. Lighthill J. Waves and hydrodynamic loading. In: Proceedings of the Second International Conference on the Behaviour of Offshore Structures, 1979; London, UK. p. 1–40. [Google Scholar]
6. Moberg G. Wave forces on a vertical slender cylinder; 1988. London. Available from: https://www.proquest.com/docview/2395197306?pq-origsite=wos&accountid=28172&sourcetype=Dissertations%20&%20Theses. [Accessed 2023]. [Google Scholar]
7. Deng Y, Tian X, Li X. Study on nonlinear characteristics of freak-wave forces with different wave steepness. China Ocean Eng. 2019;33(5):608–17. [Google Scholar]
8. Shiravani G, Sadeghi K. Diffraction of water waves with arrays of vertical cylinders. Tehran: ICOPMAS; 2008. [Google Scholar]
9. Bonakdar L, Oumeraci H, Etemad-Shahidi A. Wave load formulae for prediction of wave-induced forces on a slender pile within pile groups. Coastal Eng. 2015;102:49–68. [Google Scholar]
10. MacCamy R, Fuchs R. Wave forces on piles: a diffraction theory. U.S. Army Corps of Engineers Beach Erosion Board, Technical Memorandum No. 69, Washington DC, USA; 1954. Available from: https://www.semanticscholar.org/paper/Wave-forces-on-piles%3A-a-diffraction-theory-Ahmy-Cupy/cc2be94af8d14f2646c54946e5d797fce3a88c36. [Accessed 2023]. [Google Scholar]
11. Chakrabarti SK, Tam WA. Gross and wave load on a large vertical cylinder—theory and experiment. In: Proceedings of Offshore Technology Conference, 1973; Dallas, USA. [Google Scholar]
12. Neelamani S, Sundar V, Vendhan CP. Dynamic pressure distribution on a cylinder due to wave diffraction. Ocean Eng. 1989;16(4):343–53. [Google Scholar]
13. Sundar V, Neelamani S, Vendhan CP. Diffracted wave field and dynamic pressures around a vertical cylinder. Ocean Eng. 1990;17(1–2):125–54. [Google Scholar]
14. Iuppa C, Carlo L, Foti E, Faraci C. Calibration of CFD numerical model for the analysis of a combined caisson. Water. 2021;13(20):2862. [Google Scholar]
15. Serinaldi F, Cuomo G. Characterizing impulsive wave-in-deck loads on coastal bridges by probabilistic models of impact maxima and rise times. Coast Eng. 2011;58:908–26. [Google Scholar]
16. Seiffert B, Hayatdavoodi M, Ertekin RC. Experiments and computations of solitary-wave forces on a coastal-bridge deck. Part I: flat plate. Coast Eng. 2014;88:194–209. [Google Scholar]
17. Miles J, Martin T, Goddard L. Current and wave effects around windfarm monopile foundations. Coastal Eng. 2017;121:167–78. [Google Scholar]
18. Xu B, Wei K, Qin S, Hong J. Experimental study of wave loads on elevated pile cap of pile group foundation for sea-crossing bridges. Ocean Eng. 2020;197:106896. [Google Scholar]
19. Jeong YJ, Park MS, Kim J, Song SH. Wave force characteristics of large-sized offshore wind support structures to sea levels and wave conditions. Appl Sci. 2019;9(9):1855. [Google Scholar]
20. Kang A, Zhu B, Lin P, Ju J, Zhang D. Experimental and numerical study of wave-current interactions with a dumbbell-shaped bridge cofferdam. Ocean Eng. 2020;210:107433. [Google Scholar]
21. Wei C, Zhou D, Ou J. Experimental study of the hydrodynamic responses of a bridge tower to waves and wave currents. J Waterw Port Coast. 2017;143(3):4017002. [Google Scholar]
22. Wei C, Zhou D, Ou J. Wave and wave-current actions on a bridge tower: an experimental study. Adv Struct Eng. 2019;22(6):1467–78. [Google Scholar]
23. Mei D, Liu QJ, Hu Y, Wang D. Study of calculation methods and composite coefficient of wave-current forces for sea-crossing bridge pile caps and implementation. World Bridges. 2017;45:51–5 (In Chinese). [Google Scholar]
24. Pan JN, Wang DT, Wang XG, Nie F. Wave-current force on bridge foundation. In: Proceedings of the 7th International Conference on Asian and Pacific Coasts, 2013; Makassar, Indonesia: Hasanuddin University Press. p. 549–54. [Google Scholar]
25. Chakrabarti SK, Tam WA. Interaction of waves with large vertical cylinder. J. Ship Res. 1975;19:23–33. [Google Scholar]
26. Deng L, Yang W, Li Q, Li A. CFD investigation of the cap effects on wave loads on piles for the pile-cap foundation. Ocean Eng. 2019;183:249–61. [Google Scholar]
27. Chen L, Zhou J, Wang X, Wang Z. Nonlinear wave loads on high-rise pile cap structures in the Donghai bridge wind farm. Int J Offshore Polar. 2018;28(3):263–71. [Google Scholar]
28. Liu M, Liu H, Ma J, Ge L, Chen H. Experimental study of the wave load on the main pier of Huangmaohai bridge under wave-current coupling effect. IOP Conf Ser Earth Environ Sci. 2021;621(1):012155. [Google Scholar]
29. Liu H, Wang B, Xue L, He Y. Recent progress in wave-current loads on foundation structure with piles and cap. Appl Math Mech. 2013;37:1098–1109. [Google Scholar]
30. Wei K, Qin S, Zhao W, Zhu B, Xu G. State-of-the-art review of bridge hydrodynamics in 2020. J Civ Environ Eng. 2021;43:31–42 (In Chinese). [Google Scholar]
31. Zdravkovich MM. Flow around circular cylinders: volume 2: applications. London, UK: Oxford University Press; 1997. [Google Scholar]
32. Liu L. Research on computing method of wave-current force on sea-crossing bridge substructures (Ph.D. Dissertation). Southwest Jiaotong University: China; 2017. [Google Scholar]
33. Griffith MD, Leontini J, Thompson MC, Hourigan K. Vortex shedding and three-dimensional behaviour of flow past a cylinder confined in a channel. J Fluid Struct. 2011;27(5):855–60. [Google Scholar]
34. Yang H, Yang W, Li Q, Kou J. Experimental investigation of current forces on floating cylinder during the sinking process. Ocean Eng. 2019;178:134–44. [Google Scholar]
35. Al Mashan N, Neelamani S, Al-Houti D. Experimental investigations on wave impact pressures under the deck and global wave forces and moments on offshore jacket platform for partial and full green water conditions. Ocean Eng. 2021;234:109324. [Google Scholar]
36. Li YC, Teng B. Wave action on maritime structures. China: China Ocean Press; 2015. p. 127–167 (In Chinese). [Google Scholar]
Cite This Article
 Copyright © 2024 The Author(s). Published by Tech Science Press.
This work is licensed under a Creative Commons Attribution 4.0 International License , which permits unrestricted use, distribution, and reproduction in any medium, provided the original work is properly cited.
 Downloads
 Citation Tools