
 Submit a Paper
 Propose a Special lssue
 Open Access
ARTICLE

Modeling of Leachate Propagation in a Municipal Solid Waste Landfill Foundation
Institute of Continuous Media Mechanics of the Ural Branch, Russian Academy of Science, Perm, 614013, Russia
* Corresponding Author: Nadezhda Zubova. Email:
(This article belongs to the Special Issue: Advanced Problems in Fluid Mechanics)
Fluid Dynamics & Materials Processing 2024, 20(6), 1407-1424. https://doi.org/10.32604/fdmp.2024.051130
Received 28 February 2024; Accepted 17 May 2024; Issue published 27 June 2024
 View Full Text
 Download PDF
Abstract
The study deals with the numerical modeling of leachate distribution in the porous medium located under a municipal solid waste disposal landfill (MSWLF). The considered three-layer system is based on geological data obtained from field measurements. For simplicity, the problem is investigated by assuming a two-component approach. Nevertheless, the heat produced by landfills due to biological and chemical processes and the thermal diffusion mechanism contributing to pollution transport are taken into account. The numerical modeling of the propagation of leachate in the considered layered porous medium is implemented for parameters corresponding to natural soil and for the case where disruption of the porous medium structure is due to cracks formation or erosion. The latter is accompanied by an increase in rock permeability. In this case, the emergence of multi-vortex flow in the layer of high permeability is observed to substantially influence the bottom layers and cause intensification of the leachate propagation. These effects should be taken into account when estimating the parameters and properties of materials required for the construction of solid waste disposal facilities.Keywords
Leakage of hazardous substances from sludge storage facilities, and landfills for household and industrial waste can have a critical impact on the natural environment due to the high risk of penetration of contaminants into groundwater [1,2]. For municipal solid waste landfills (MSWLF), one of the most dangerous pollutants is leachate, which is produced as rainwater filters through landfill wastes and can leak out of the landfill body. The leachate has a complex composition resulting from the diversity of waste types, and contains high concentrations of organic and inorganic pollutants, heavy metal ions, etc. [1,3–5]. In the case of leachate penetration into the soil under the landfill, there is a high probability of its long-range spread by filtration. It should be noted that leachate formation starts from the beginning of landfill operation and lasts for decades after its closure, which further increases its harmful effect [6].
The review of modern leachate treatment technologies [7] demonstrates the importance of proper organization of MSWLF. Different methods of the leachate treatment, including biological and physicochemical methods, as well as their combinations, have been considered in [8–10]. It is concluded in [8] that individual biological or physicochemical methods are unable to provide satisfactory leachate utilization efficiency. The maximum cleaning effect is achieved through the application of a combination of two or more physicochemical treatments, or a combination of biological and physicochemical treatments.
Identification of landfill leachate migration routes by the development and application of mathematical models is one of the ways to solve the problem of harmful substance leakage [2,11,12]. Modeling systems such as MSWLF is a rather complex task. The difficulties are due to a number of uncertainties associated with the estimation of the parameters of a model, which should adequately describe the complex biological, chemical and physical processes occurring in landfills. In [13], the authors present a review of mathematical models designed to simulate the formation and distribution of leachate in MSWLF. The paper also describes future needs for more effective approaches and potential improvements to existing models.
In [14], it is shown that a filter separator layer between the waste and the drainage layer reduces the leachate strength entering the gravel drainage layer and extends the time to clog the drainage layer. In particular, the effect of the filter layer is more significant when the drainage layer consists of pea gravel rather than coarse gravel. Numerical simulation of seepage in the landfill leachate layers was performed in [15]. It was found that the maximum saturation depth is affected by the drainage pipe’s ability to discharge. The saturation depth linearly increased with the infiltration of leachate and drastically decreased with the increasing drainage slope.
In the design and construction of solid waste landfills, it is necessary to take into account the geological features of the area. According to the requirements for such objects, their foundation must consist of waterproof rocks. In addition, it is necessary to isolate soils from the effect of leachate during the operation of the landfill and for a long time after its conservation. In modern MSWLF the isolation is provided by installing a screen, which is currently made of modern materials, and in previous times–of specially prepared and compacted top soils (clays and loams). At the same time, due to the average nature of geological surveys and measurements, the probability of heterogeneity of screen properties increases when old construction standards are used. Nowadays, a number of landfills of former design are still in operation. The model describing a part of such landfill unit will be considered in this article.
The paper is structured as follows. In the next section, the problem formulation is proposed and the governing equations and boundary conditions are considered. Then, the numerical setup is considered and mesh convergence is analyzed. The results of numerical simulations are first presented for parameters of field measurements taking into account the effect of thermal diffusion. Then the analysis is extended to the case when one of the porous layers has high permeability. In the conclusion section, our main findings are summarized.
The ground base of the MWLF has a complicated soil composition, which is usually a combination of soils of different types having rather complex structures. For example, Fig. 1 shows a fragment of a geological section of the solid waste disposal facility, which has been in operation since 1978. As one can see, the base of the unit is a porous medium consisting of layers of clay loam, siltstone and mudstone (from top to bottom). Obviously, the specific features of this structure should be taken into account during the modeling of the leachate distribution. The base of a solid waste facility is modeled as a system of three horizontal layers of a porous medium, shown in Fig. 1. Geometry of the problem corresponds to the field measurements carried out at the MWLF site in 2017 [16]. On the other hand, the considered structure is typical, and the obtained results can be applied to a number of practical situations.
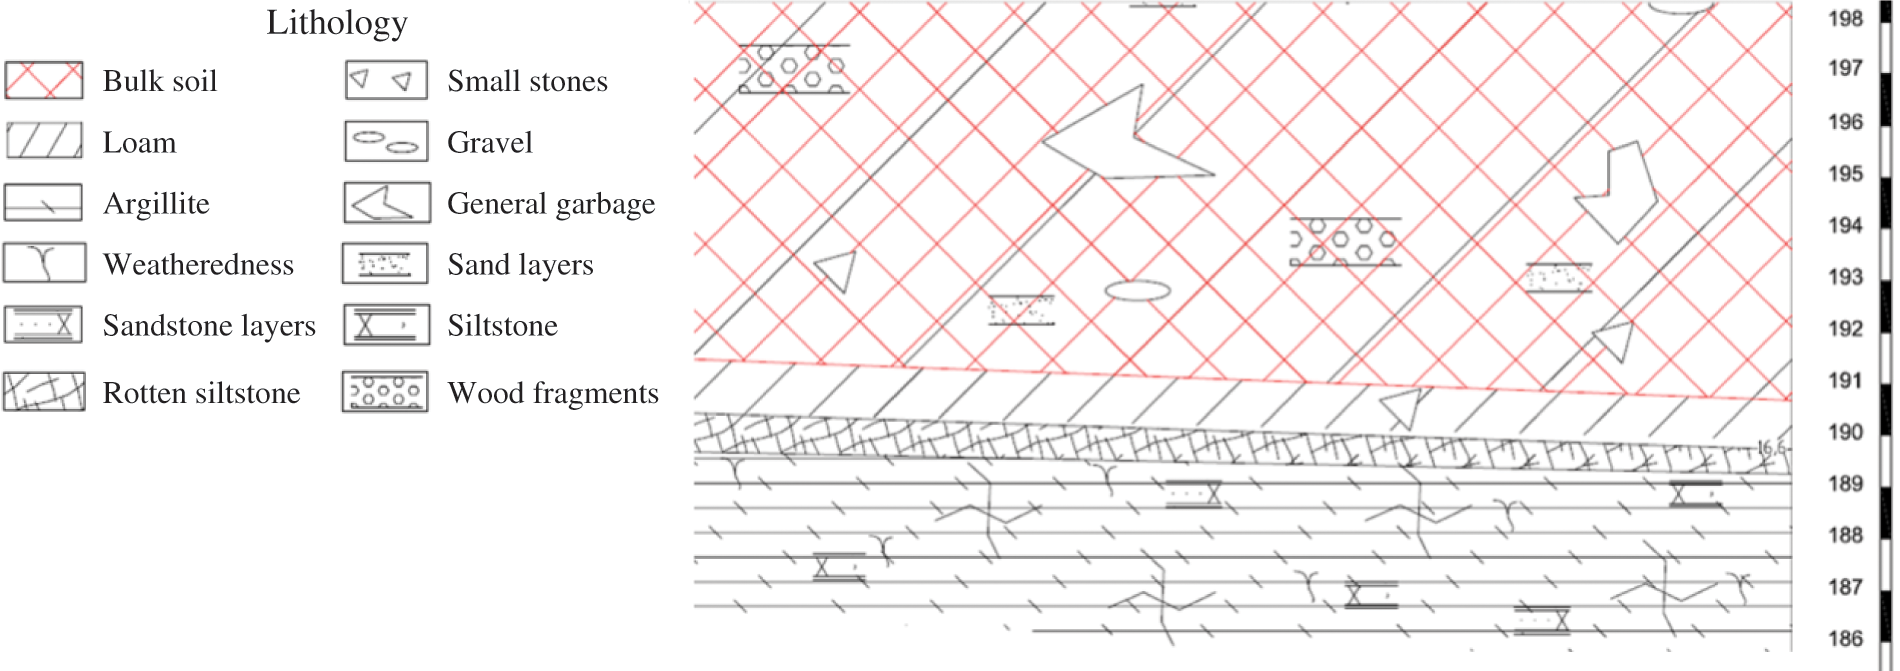
Figure 1: Fragment of a geological section of a municipal solid waste disposal facility
Due to a large number of impurities, the modeling of leachate dynamics based on a full multicomponent model is rather difficult because it is hardly possible to completely determine its structure over the entire length of the MSWLF. Therefore, in this work, the leachate is described within the framework of a simplified model based on a two-component approach. Thus, the variety of contaminant compositions in the examined area is disregarded and the leachate is described as a mixture of impurities (containing all kinds of contaminants) in pure water. It is also assumed that the influence of the rock wettability variation on the leachate spreading can be neglected [17]. At the same time, thermal diffusion is taken into account because it can affect the distribution of impurities at low filtration rates.
Thermoconcentration convection of a binary mixture in a porous medium is described within the framework of the Darcy-Boussinesq model, taking into account the thermal diffusion properties of the mixture. It is assumed that the density of the mixture linearly depends on temperature,
Here,
The cavity under consideration has a rectangular shape of length

Figure 2: Problem geometry
In the framework of the Darcy-Boussinesq model, the nonstationary equations of thermoconcentration convection of a mixture of two viscous incompressible fluids in a porous medium, taking into account the effect of thermal diffusion, read
Here, index
The lateral boundaries are assumed to be impenetrable, which excludes the outflow and diffusion of the fluid. The upper and lower horizontal boundaries of the system are maintained at constant temperatures
The boundary conditions are
Here,
where
Initially, the porous medium saturated with a stationary solvent (water), and the temperature linearly dependent on the vertical coordinate are considered. The temperature at the upper boundary is taken to be 343 K. This value corresponds to the maximum temperature recorded inside the landfill. It is assumed that the landfill screen is heated uniformly to this value over the entire surface. The lower boundary is at a fixed temperature of 283 K, which corresponds to the average soil temperature at a depth of 5 m. Despite the significant temperature difference, the condition for the application of the Boussinesq approximation is satisfied.
The physical parameters of the leachate are shown in Table 1. It is to be noted that the value of the molecular diffusion coefficient and the value of the thermal diffusion coefficient were taken as the values typical of aqueous solutions of inorganic salts and hydroxides [18–20]. The parameters of porous media are taken from the field measurements [16] and listed in Table 2.


3 Numerical Modeling and Mesh Convergence Analysis
Calculations were carried out using the ANSYS Fluent software package, which implements the finite volume method. The spatial discretization was performed using the third-order MUSCL scheme (Monotone Upstream-Centered Schemes for Conservation Laws). At each time step the convergence criterion for the velocity components was used. The absolute scaled residual errors should be less than 0.001 (“scaled” means that the residual error is divided by the flow rate through the domain). For the problem under consideration, it is convenient to use a stream function to describe the filtration flows. It should be noted that in the ANSYS Fluent the stream function,
The calculations were carried out using the structured mesh with square cells. Table 3 presents the comparison of the results obtained for different spatial steps and the interpolation of the results to the zero grid step. Time

4 Modeling Based on Parameters of Field Measurements: Porous Media of Low Permeability
Data presented in the reference literature allows us to estimate the value of the diffusion coefficient for different binary mixtures, including solutions of inorganic compounds contained in the leachate. However, the case is different for the thermal diffusion coefficient. Moreover, the effect of thermal diffusion can be both positive and negative, which significantly affects the behavior of the mixture. The sign of the thermal diffusion coefficient of the mixture components indicates whether they diffuse into an area at higher or lower temperatures. The former case corresponds to the positive thermodiffusion effect, and the latter- to negative thermodiffusion. It is worthy of note that the negative coefficient of thermal diffusion of a heavy component and heating from above can lead to unstable density stratification and the onset of convection. To identify the possible impact of thermodiffusion, first, it is necessary to investigate the dynamics of leachate without considering thermodiffusion (
The results of calculations show that for parameters of field measurements a convective flow does not occur in the region under consideration. Slow penetration of the contaminant into the rock mass under the landfill is observed. After a long period of time (more than 500 years), the concentration is defined as a piecewise linear function of depth. This time is generally consistent with the characteristic time scale for diffusion (
Let us model the evolution of the impurity concentration at natural environmental parameters, taking no account of thermal diffusion. The simulation has been carried out for a time period of 800 years. Fig. 3 shows how the difference in the concentrations between the centers of the horizontal boundaries of the loam and siltstone layers changes with time. It can be seen that the impurity slowly spreads downwards and reaches the lower boundary of the loam in about 0.8 years and the lower boundary of the siltstone in about 1.3 years. It is in good agreement with the values that can be obtained for purely diffusive pollution transport based on the values of the filtration coefficients for these media (see Table 2). At the end of the simulation time, the concentration difference in the loam and siltstone layers tends to reach identical values. At the same time, the concentration difference in the loam layer becomes slightly lower than the concentration difference in the siltstone layer (Fig. 3), which is also explained by the properties of the media.

Figure 3: Evolution of concentration difference between upper and lower part of the loam (
The distribution of impurity along the central vertical line at different times is shown in Fig. 4. It can be seen that after five years the small quantities of impurity reach the mudstone layer, and 50 years after the beginning of continuous leachate flow into the rock of the landfill base the concentration of impurity becomes significant at a depth of more than 3 meters.

Figure 4: Evolution of vertical profiles of impurity concentration in the center of the cavity for: 1–5, 2–10, 3–50, 4–100 years
4.2 The Effect of Thermal Diffusion
In the case when the effect of thermal diffusion is taken into account, only minor quantitative differences can be observed in the first decades. In particular, the values of the concentration difference between the loam and the siltstone boundaries differ from the case

Figure 5: Temporal evolution of the concentration difference between the centers of the horizontal boundaries of the loam (
The retarding effect of the negative thermal diffusion is demonstrated in Fig. 6, where the distribution of impurities along the vertical center line of the cavity is shown at the time

Figure 6: Vertical profiles of impurity concentration along the center of the cavity at time 800 years for: 1–
5 The Influence of Permeability Variation
In this section permeability of the loam, siltstone and mudstone layers obtained in field measurements is taken as
5.1 The Case of the Loam Layer Weathering
Let us consider an increase in permeability of the loam layer (

Figure 7: Time dependence of the maximum value of the stream function in the cavity (a, b) and the difference in impurity concentrations between the centers of the upper and lower boundaries of loam (c, d) and siltstone (e, f) at

Figure 8: Stream function for

Figure 9: Leachate concentration for

Figure 10: Vertical profiles of impurity concentration in the center of the cavity in the case
The change in the flow structure and the evolution of the impurity concentration distribution in the cavity are shown in Figs. 8 and 9. The flow that occurs after the impurity reaches the lower boundary of the loam layer has a multi-vortex structure and is localized only in this layer (Fig. 8,
Isolines of the leachate concentration evolution are presented in Fig. 9. It can be seen that after a few decades, the spread of pollution occurs more slowly. Even at these moments of time, the concentration of the leachate in the lower part of the cavity is uniform. When a local flow occurs in the loam layer, the concentration isolines are significantly deformed (Fig. 9,
As time passes, the flow becomes “large-scale” and the impurity reaches the lower boundary of the cavity; curvatures of the concentration isolines are observed throughout the cavity (Fig. 9,
5.2 The Effect of the Increased Permeability of Bottom Layers
Further the effect of increasing permeability of the siltstone and argillite layers is demonstrated for the case of a negative effect of thermal diffusion. As can be seen from Fig. 11, convection in the cavity begins when the impurity reaches the corresponding layer with high permeability. Thus, in the mudstone layer, the flow occurs more than 10 years after the beginning of the simulation (Fig. 11a). The flow that arises in the cavity exists for quite a long time but eventually fades out. The flows occurring in the cavity with increasing permeability of loam and siltstone layers have nearly the same intensity, provided that the heights of these layers are equal, and their permeability is of the same order of magnitude. The highest flow intensity is observed with increasing permeability of the mudstone layer; apparently, this is due to the greatest thickness of this layer and its higher initial permeability (see Table 2). The flow provoked by an increase in permeability enhances the mixing of the leachate and, accordingly, the rate of penetration of pollution (the difference in concentrations between the boundaries of the layers decreases, Fig. 11b and 11c). This can have the most dangerous consequences in the case when the integrity of the lower layers, which might be in close proximity to groundwater, is violated.

Figure 11: Time dependence of the maximum value of the stream function in the cavity (a, b) and the difference in impurity concentrations between the centers of the upper and lower boundaries of loam (c, d) and siltstone (e, f). Gray lines are for
An increase in permeability of the siltstone and mudstone layers leads to the emergence of a “local” convective flow (Figs. 12 and 13). In the case of
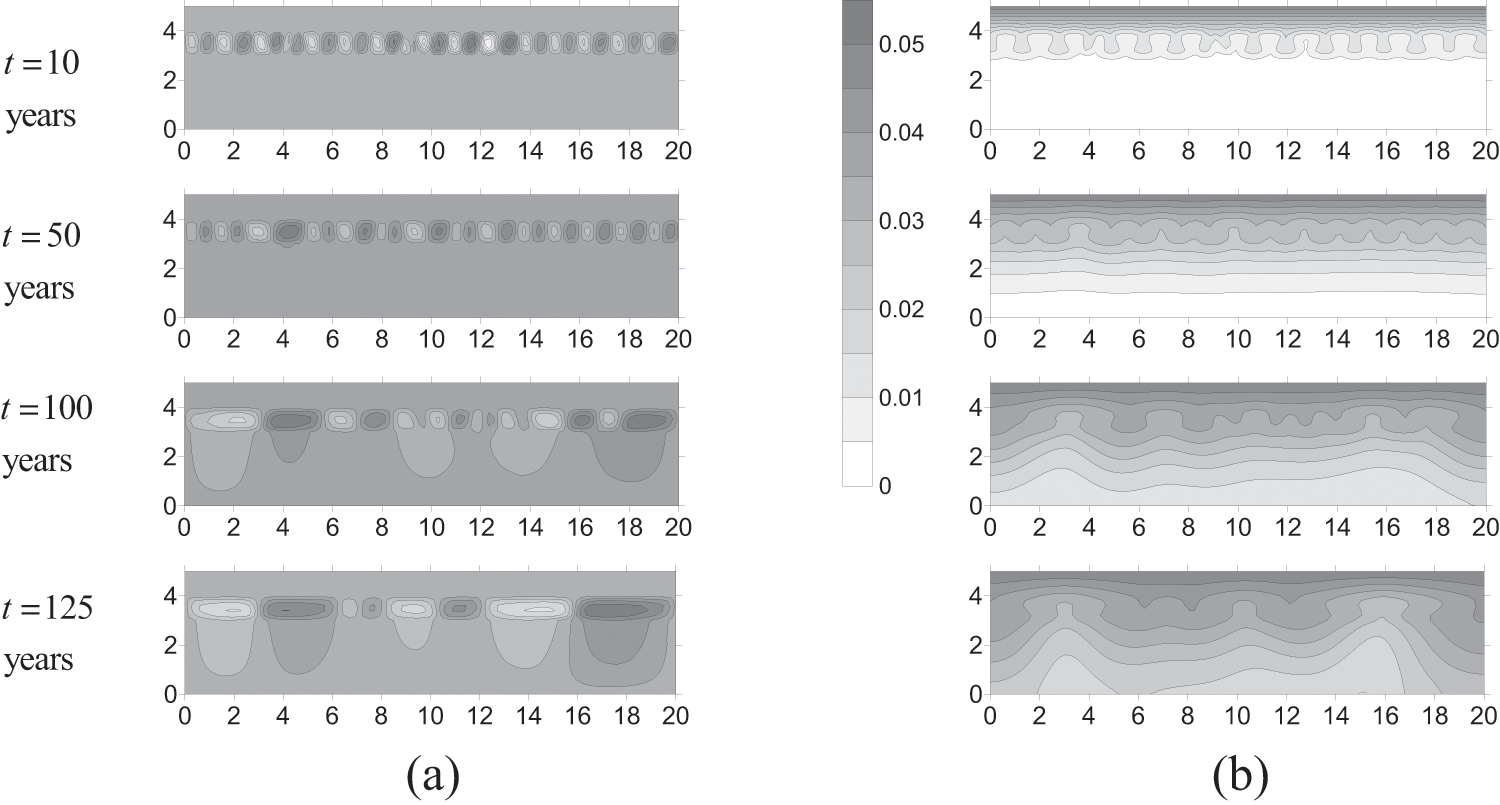
Figure 12: Isolines if flow function (a) and the leachate concentration (b) for

Figure 13: Isolines of flow function (a) and the leachate concentration (b) for
The flow weakly penetrates into the loam layer, whose permeability is lowest. Comparison of time dependence of

Figure 14: Vertical profiles of the impurity concentration in the center of the cavity for
In the case of increased permeability of the mudstone layer (
As can be seen from Figs. 13b, 14b, the flow in the argillite layer is quite strong, and therefore prevents high impurity concentration due to dilution. After a year, the distribution of concentration in the loam and siltstone layers is close to linear, and in the mudstone layer the concentration practically does not change. After a longer time, when the flow weakens and the impurity penetrates into the lower layer, the concentration isolines are seen to be strongly deformed by the flow (Fig. 13b for
5.3 Discussion on Permeability Influence
The rate of leachate propagation due to diffusion is low (see Figs. 3 and 4). Convection is known to be able to intensify the impurity transport by several times. In the cases under consideration, filtration flows cannot be initiated by natural thermal convection due to internal heat sources in the MSWLF body, which leads to heating from above. On the other hand, as shown above, concentration convection can develop in a layer of high permeability when the critical difference in concentration values exceeds the stability threshold.
An important finding of the modeling is that convective flows, which initially developed in the layer of high permeability, penetrate into the neighboring layers and enhance the leachate transport in them. The effect is particularly pronounced in the layers adjacent to the bottom of the high permeability layer (see Fig. 12). This phenomenon can be explained by the formation of finger-like structures in the layer with high permeability, which moves downwards and introduces significant perturbations in the concentration field of the bottom layer. Consequently, the concentration convection develops in the bottom layer and results in a “large-scale” convection in the system, which substantially increases the rate of leachate propagation.
The dependence of the average impurity concentration at the bottom of the computational domain is shown in Fig. 15a for two upper layers of the porous medium of different permeability. In particular, the figure presents three curves corresponding to the parameters of field measurements, high permeability of the loam layer and high permeability of the siltstone layer. As can be seen, the high permeability of the loam layer leads to a 25% increase in the concentration at the layer bottom, and in the case of the high permeability of the siltstone layer, the increase is more than 30%. This growth cannot be explained by extensive convection in only one layer. The effect is especially remarkable if the middle layer (siltstone) is of high permeability. In Fig. 15b, the dependence of the concentration growth rate reaches a maximum after approximately 125 years in this case. The dependence of the flow function in Fig. 13a demonstrates the same behavior, which conforms to the development of “large-scale” flows. Thus, the existence of a layer with high permeability can significantly influence the process of leachate propagation because intensive convection flows in this layer are able to penetrate into the bottom layers, accelerating the transport of contaminants.

Figure 15: Evolution of impurity concentration (a) and concentration growth rate (b) at the bottom of the mudstone layer for different values of permeability “1” corresponds to field measurements (
The results of direct numerical simulation of the process of contaminant propagation through the porous medium saturated with pure liquid have been discussed. The modeling was carried out for the problem of leachate seepage from the MSWLF into the foundation soil of the landfill. According to the field measurements, the landfill base should be treated as a complex medium consisting of three layers of porous media: loam, siltstone and argillite. The influence of thermal diffusion on the leachate dynamics was investigated under conditions of internal heating of the MSWLF body by considering both the positive and negative thermal diffusion and making a comparison with the results obtained without the influence of the thermal diffusion. Then the effect of variation in soil layer permeability, which is caused by crack formation due to increased squeezing in the process of MSWLF operation, was studied in detail. For the values of layer permeability obtained from the field measurements, it has been shown that filtration flows in the examined area are of low intensity, and the impurity slowly penetrates into the porous medium primarily by diffusion. The penetration of contaminants into porous media was traced over a long period of time (up to 800 years). Under these conditions, the effect of thermal diffusion significantly affects the distribution of impurities for a long time, accelerating or slowing down the penetration of impurities deep into the medium, depending on the sign of the thermal diffusion coefficient. It has been shown that positive thermal diffusion reduces the rate of impurity propagation, at the same time, it also slightly reduces the threshold for the onset of convective instability. Negative thermal diffusion leads to an increase in the rate of leachate propagation. Within a period of less than 100 years, the effect of thermal diffusion is weak and can be neglected.
As soon as the protective properties of the layer forming the base of the landfill have degraded, the permeability of this layer increases, which results in the occurrence of a local multi-vortex flow. It has been shown that convection that initially occurs “locally” in the layer of growing permeability is intensified, penetrates into other layers, and turns into a “large-scale” flow. This flow accelerates the penetration of impurities deep into the base. Thus, the existence of a layer of high permeability in the foundation of MSWLF can lead to a significant acceleration of impurity spreading. In particular, the degradation of the siltstone layer leads to an up to 25% increase in the leachate concentration in groundwater after 125 years of MSWLF construction (see Fig. 15a). These effects should be taken into account during the assessment of the risk of leachate infiltration into the foundation soils of MSWLF.
Acknowledgement: Computations were performed on the Uran supercomputer at the IMM UB RAS.
Funding Statement: The research was supported by a grant from the Russian Science Foundation (Project No. 23-11-00214).
Author Contributions: The authors confirm contribution to the paper as follows: study conception and design: N. Zubova, A. Ivantsov; data collection: N. Zubova; analysis and interpretation of results: N. Zubova, A. Ivantsov; draft manuscript preparation: N. Zubova, A. Ivantsov. All authors reviewed the results and approved the final version of the manuscript.
Availability of Data and Materials: The data presented in this study are available on request from the corresponding author.
Conflicts of Interest: The authors declare that they have no conflicts of interest to report regarding the present study.
References
1. Lindamulla, L., Nanayakkara, N., Othman, M., Jinadasa, S., Herath, G. et al. (2022). Municipal solid waste landfill leachate characteristics and their treatment options in tropical countries. Current Pollution Reports, 8, 273–287. https://doi.org/10.1007/s40726-022-00222-x [Google Scholar] [CrossRef]
2. Lyubimova, T. P., Lepikhin, A. P., Parshakova, Ya, N., Tsiberkin, K. B. (2015). Numerical modeling of liquid waste infiltration from storage facilities into surrounding groundwater and surface water bodies. Computational Continuum Mechanics, 8(3), 310–318. https://doi.org/10.7242/1999-6691/2015.8.3.26 [Google Scholar] [CrossRef]
3. Aziz, S. Q., Bashir, M., Aziz, H., Mojiri, A., Abu Amr, S. et al. (2018). Statistical analysis of municipal solid waste landfill leachate characteristics in different countries. Journal of Pure and Applied Sciences, 30, 85–96. [Google Scholar]
4. Al-Wabel, M. I., Al Yehya, W. S., AL-Farraj, A. S., El-Maghraby, S. E. (2011). Characteristics of landfill leachates and bio-solids of municipal solid waste (MSW) in Riyadh City, Saudi Arabia. Journal of the Saudi Society of Agricultural Sciences, 10, 65–70. https://doi.org/10.1016/j.jssas.2011.03.009 [Google Scholar] [CrossRef]
5. Salem, Z., Hamouri, K., Djemaa, R., Allia, K. (2008). Evaluation of landfill leachate pollution and treatment. Desalination, 220, 108–114. https://doi.org/10.1016/j.desal.2007.01.026 [Google Scholar] [CrossRef]
6. Parvin, F., Tareq, S. M. (2021). Impact of landfill leachate contamination on surface and groundwater of Bangladesh: A systematic review and possible public health risks assessment. Applied Water Science, 11, 100. https://doi.org/10.1007/s13201-021-01431-3. [Google Scholar] [PubMed] [CrossRef]
7. Luo, H., Zeng, Y., Cheng, Y., He, D., Pan, X. (2020). Recent advances in municipal landfill leachate: A review focusing on its characteristics, treatment, and toxicity assessment. Science of the Total Environment, 703, 135468. https://doi.org/10.1016/j.scitotenv.2019.135468. [Google Scholar] [PubMed] [CrossRef]
8. Silva, T. F. C. V., Soares, P. A., Manenti, D. R., Fonseca, A., Saraiva, I. et al. (2017). An innovative multistage treatment system for sanitary landfill leachate depuration: Studies at pilot-scale. Science of the Total Environment, 576, 99–117. https://doi.org/10.1016/j.scitotenv.2016.10.058. [Google Scholar] [PubMed] [CrossRef]
9. Torretta, V., Ferronato, N., Katsoyiannis, I. A., Tolkou, A. K., Airoldi, M. (2017). Novel and conventional technologies for landfill leachates treatment: A review. Sustainability, 9(1), 9. [Google Scholar]
10. Wiszniowski, J., Robert, D., Surmacz-Gorska, J., Miksch, K., Weber, J. V. (2006). Landfill leachate treatment methods: A review. Environmental Chemistry Letters, 4, 51–61. https://doi.org/10.1007/s10311-005-0016-z [Google Scholar] [CrossRef]
11. Parshakova, Y., Ivantsov, A. (2022). Dynamics of pollution in the hyporheic zone during industrial processing brine discharge. Water, 14, 4006. https://doi.org/10.3390/w14244006 [Google Scholar] [CrossRef]
12. Maryshev, B. S., Parshakova, Y. N., Ivantsov, A. O., Zubova, N. A. (2022). Removal of pollution accumulated in the process of wastewater discharge from the bottom layer of river systems. Computational Continuum Mechanics, 15(2), 209–222. https://doi.org/10.7242/1999-6691/2022.15.2.16 [Google Scholar] [CrossRef]
13. El-Fadel, M., Findikakis, A. N., Leckie, J. O. (1997). Modeling leachate generation and transport in solid waste landfills. Environmental Technology, 18, 669–686. https://doi.org/10.1080/09593331808616586 [Google Scholar] [CrossRef]
14. Kerry Rowe, R., Yu, Y. (2013). Modeling of leachate collection systems with filter separators in municipal solid waste landfills. Journal of Environmental Engineering, 139, 1042–1052. https://doi.org/10.1061/(ASCE)EE.1943-7870.0000716 [Google Scholar] [CrossRef]
15. Li, G., Zhang, J., Liu, J. (2020). Numerical simulation of seepage in the landfill leachate layers. IOP Conference Series: Earth and Environmental Science, 545, 012038. [Google Scholar]
16. Parshakova, Y. N., Viskov, M. V., Kataev, R. I., Kartavykh, N. N. (2024). Numerical simulation of migration of filtration water of solid municipal waste disposal objects through ground protective structures. Computational Continuum Mechanics, 17(2), 24–32. [Google Scholar]
17. Khalilnezhad, A., Simjoo, M., Hamidian, N. (2021). Insights into viscous fingering effect induced by wettability alteration processes: A fractional flow study. Journal of Petroleum Science and Engineering, 201, 108491. https://doi.org/10.1016/j.petrol.2021.108491 [Google Scholar] [CrossRef]
18. Takeyama, N., Nakashima, K. (1983). Thermodynamics of thermal diffusion in aqueous ionic solutions. The Physical Society of Japan, 52, 2699–2705. https://doi.org/10.1143/JPSJ.52.2699 [Google Scholar] [CrossRef]
19. Vitagliano, V., Lyons, P. A. (1956). Diffusion coefficients for aqueous solutions of sodium chloride and barium chloride. Journal of the American Chemical Society, 78, 1549–1552. https://doi.org/10.1021/ja01589a011 [Google Scholar] [CrossRef]
20. Hazel, J. R., Sidell, B. D. (1987). A method for the determination of diffusion coefficients for small molecules in aqueous solution. Analytical Biochemistry, 166, 335–341. https://doi.org/10.1016/0003-2697(87)90582-3. [Google Scholar] [PubMed] [CrossRef]
Cite This Article
 Copyright © 2024 The Author(s). Published by Tech Science Press.
This work is licensed under a Creative Commons Attribution 4.0 International License , which permits unrestricted use, distribution, and reproduction in any medium, provided the original work is properly cited.
 Downloads
 Citation Tools