
 Submit a Paper
 Propose a Special lssue
 Open Access
ARTICLE

Impact of Osmotic Pressure on Seepage in Shale Oil Reservoirs
Oil and Gas Technology Research Institute, PetroChina Changqing Oilfield Company, Xi’an, 710018, China
* Corresponding Author: Jie Bai. Email:
(This article belongs to the Special Issue: Solid, Fluid, and Thermal Dynamics in the Development of Unconventional Resources )
Fluid Dynamics & Materials Processing 2024, 20(6), 1365-1379. https://doi.org/10.32604/fdmp.2024.049013
Received 25 December 2023; Accepted 05 January 2024; Issue published 27 June 2024
 View Full Text
 Download PDF
Abstract
Following large-scale volume fracturing in shale oil reservoirs, well shut-in measures are generally employed. Laboratory tests and field trials have underscored the efficacy of fracturing fluid imbibition during the shut-in phase in augmenting shale oil productivity. Unlike conventional reservoirs, shale oil reservoirs exhibit characteristics such as low porosity, low permeability, and rich content of organic matter and clay minerals. Notably, the osmotic pressure effects occurring between high-salinity formation water and low-salinity fracturing fluids are significant. The current understanding of the mobilization patterns of crude oil in micro-pores during the imbibition process remains nebulous, and the mechanisms underpinning osmotic pressure effects are not fully understood. This study introduces a theoretical approach, by which a salt ion migration control equation is derived and a mathematical model for spontaneous imbibition in shale is introduced, which is able to account for both capillary and osmotic pressures. Results indicate that during the spontaneous imbibition of low-salinity fluids, osmotic effects facilitate the migration of external fluids into shale pores, thereby complementing capillary forces in displacing shale oil. When considering both capillary and osmotic pressures, the calculated imbibition depth increases by 12% compared to the case where only capillary forces are present. The salinity difference between the reservoir and the fracturing fluids significantly influences the imbibition depth. Calculations for the shut-in phase reveal that the pressure between the matrix and fractures reaches a dynamic equilibrium after 28 days of shut-in. During the production phase, the maximum seepage distance in the target block is approximately 6.02 m.Keywords
Nomenclature
| vwD | Water phase Darcy seepage velocity, cm·s−1 |
| voD | Oil phase Darcy seepage velocity, cm·s−1 |
| k | Permeability, μm2 |
| krw | Water-phase relative permeability |
| kro | Oil-phase relative permeability |
| μw | Water viscosity, mPa·s |
| μo | Oil viscosity, mPa·s |
| x | Length, cm |
| pw | Water pressure, 105Pa |
| po | Oil pressure, 105Pa |
| t | Time, s |
| Swc | Bound water saturation |
| C0 | The initial salt concentration of the solution inside the reservoir, mol·cm−3 |
| P0 | The initial oil phase pressure of the solution inside the reservoir, 105Pa |
| pcb | Capillary back pressure, 105Pa |
| Cw | Salt concentration of solution outside the reservoir, mol·cm−3 |
| L | Model length, m |
| pc | Capillary pressure, 105Pa |
| nw | Water phase relative permeability curve fitting index |
| no | Oil phase relative permeability curve fitting index |
| Sor | Irreducible oil saturation |
| krw(Sor) | Relative permeability of water phase under irreducible oil saturation |
| kro(Swc) | Relative permeability of oil phase under bound water saturation |
| pmc | Maximum capillary force, 105Pa |
| nc | Capillary force curve fitting index |
Global estimates suggest significant shale oil reserves, positioning this resource as a key area for future oil and gas exploration and development [1,2]. Shale oil, characterized as hydrocarbons and various organics stored within organic-rich shale formations, exhibits features such as low porosity, low permeability, and a rich organic content [3]. Unlike conventional reservoirs, shale oil typically lacks stable natural production, necessitating large-scale hydraulic fracturing to enhance near-well permeability and thus boost well productivity [4]. Given the pronounced capillary effects in the micro-to-nano scale pores of shale reservoirs and the significant presence of fracturing fluids in the complex fracture networks post-fracturing, these fluids can be imbibed into the matrix pores via capillary forces, displacing the crude oil into hydraulic fractures [5]. Currently, post-fracturing soaking measures, based on imbibition, have emerged as an effective strategy to supplement reservoir energy and enhance shale oil recovery [6]. It is imperative to elucidate the imbibition characteristics of shale reservoirs under capillary and osmotic pressures, reveal the soaking mechanisms post-fracturing, and compute the effective seepage distance during the imbibition and production phases of shale oil reservoirs.
Subsequent research has validated that spontaneous imbibition in conventional reservoirs is primarily driven by capillary forces [7]. The imbibition behavior in sandstones is influenced by various factors. These include the heterogeneity of pore types and their geometric shapes [8–10]. Additionally, the behavior is affected by the electrochemical potential, which is induced by clay hydration and osmotic effects [11,12]. In shale formations, osmotic effects have garnered scholarly attention, recognized as a pivotal mechanism driving fluid invasion [13,14]. Several scholars have recently employed mathematical models to investigate the osmotic mechanisms during spontaneous imbibition in shale formations, particularly emphasizing seepage distance. The advancements in modeling have provided a better understanding of the underlying mechanisms and the influencing factors, which have contributed to more accurate predictions of fluid behavior in both conventional and unconventional reservoirs. Wu et al. [15] utilized the CMG software to develop a numerical model capturing the characteristics of the flowback process in shale gas wells. Their findings emphasize the significance of optimizing the drainage–production system post hydraulic fracturing due to the retention of fracturing fluid. Ghanbari et al. [16] explored water and oil imbibition in gas shales, revealing that water uptake exceeds oil uptake in intact shale samples. Their findings highlight the contrasting wettability in connected and poorly connected pores, providing key insights for fluid treatment in shale reservoirs. Su et al. [17] focused on the spontaneous imbibition characteristics in shale oil reservoirs influenced by osmosis. Their experiments delineated distinct stages in the high-salinity fluid imbibition process and underscored the role of osmosis in shaping these stages. Uzun et al. [18] explored enhanced oil recovery in unconventional reservoirs, demonstrating that osmotic pressure induced by low-salinity water can significantly enhance oil extraction. This approach highlights the potential of osmotic pressure gradients in improving shale reservoir recovery. Conclusively, they postulate that gas recovery’s effectiveness from water imbibition hinges on liquid diffusion, induced fractures by imbibed water, and the formation’s sensitivity.
Within the domain of hydraulic fracturing in hydrocarbon reservoirs, the extent of fluid migration in fractures is pivotal [19]. A suite of investigations has delved into this specific flow dynamic. Wang et al. [20] proposed a semi-analytical model elucidating pressure transient behaviors in wells with asymmetric fractures. Xue et al. [21] introduced a model delineating transient flow dynamics, offering a perspective on fluid movement across horizontal fractures. Guppy et al. [22] underscored the implications of non-Darcy flow, which markedly affects the fluid’s traversal distance in vertical fractures with finite conductivity. Mahmoodi et al. [23] introduced an advanced fluid flow model that accounts for the non-uniform geometry and variable permeability of fractures. This model, applicable to shale gas reservoirs and tight formations, refines our understanding of fluid migration in fractured systems and promises more accurate predictions of reservoir behavior. Wang et al. [24] advanced a model encompassing fluid-solid interactions in microfracture grouting seepage. Numerical analyses revealed a pronounced influence of this coupling on grout seepage traits, with both grouting pressure and fracture aperture demonstrating nonlinear decay along the seepage trajectory.
At present, the mechanisms underpinning osmotic effects during shale’s spontaneous imbibition remain ambiguous and are in the preliminary stages of exploration. Investigations into osmotic effects during this process predominantly employ in-lab core experiments, with limited direct, quantitative studies grounded in seepage theory. Thus, it is essential to harness mathematical models of spontaneous imbibition, integrated with relevant osmotic effect equations, to elucidate the dynamics of osmotic pressure further. This article presents a mathematical model of spontaneous imbibition, factoring in capillary forces and osmotic pressures. It quantifies the effective seepage distance of matrix clusters during the post-fracturing soaking and backflow phases. The derived insights offer a theoretical framework for refining post-fracturing soaking interventions in shale oil reservoirs and assessing seepage distances.
To investigate the influence of osmotic pressure between low-salinity fracturing fluids and high-salinity shale formation waters on imbibition, we formulated a one-dimensional mathematical model for shale oil matrix flow. This model is grounded in seepage theory, osmotic pressure equations, and solute transport principles. By considering an arbitrary position between fractures as a unit, the model integrates both capillary forces and osmotic pressures arising from salinity differentials as imbibition driving forces. Upon numerical resolution of this model, we delved into the fluid distribution and pressure propagation characteristics within the core, determining the effective seepage distance under various pressure differentials.
2.1 Mathematical Modeling and Analysis
To delve into the impact of osmotic pressure between low-salinity fracturing fluids and high-salinity shale formation waters on the imbibition process, a uni-dimensional shale oil matrix flow mathematical model was developed. This model is rooted in three main pillars: seepage theory, osmotic pressure calculations, and solute transport mechanisms. By analyzing a specific position between fractures, the model captures both capillary effects and osmotic pressures, which arise due to salinity disparities. The goal is to provide a more accurate representation and understanding of the imbibition behavior within shale oil reservoirs.
Considering the model’s foundation, the following assumptions were made:
1) The process remains isothermal.
2) Compressibility influences from both rock and fluid are negligible.
3) No distinction between inorganic and organic pores is made; only the macroscopic hydrophilicity of shale is considered.
4) Effects related to gravitational forces, capillary pressure, relative permeability hysteresis, and solute transport on fluid density are omitted.
To investigate the influence of osmotic pressure on imbibition, stemming from the salinity difference between low-salinity fracturing fluid and high-salinity shale formation water, we established a one-dimensional mathematical model for flow within the shale oil matrix. This model takes into consideration the osmotic pressure generated by salt concentration disparities.
In the context of one-dimensional oil-water flow, Darcy’s law is articulated as:
Using an enhanced Darcy’s flow, Olsen [25] described the aqueous phase movement in shale formations and provided the governing equation for two-phase oil-water flow.
Additionally, the continuity principles for this bi-phase flow were integrated. Combining the previous equations provides a holistic view of the oil-water dynamic:
In shale reservoirs, the dominant mechanisms for salt ion movement include advection, in compliance with Darcy’s principle, and dispersion, as described by Fick’s principle. Under conditions of consistent flow in a homogenous and isotropic medium, one can deduce a representation for salt ion dynamics rooted in mass conservation principles.
Let the total pore area with an ideal osmotic pressure be denoted as Aπ, which constitutes a fraction E of the total water-phase pore area. In these pores, salt ion migration is not feasible. The total pore area with zero osmotic pressure is represented as AwD, accounting for a fraction (1−E) of the total water-phase pore area. In these pores, water flow adheres to Darcy’s law, and salt ions can freely pass through. AwD can be expressed as:
For advection, the solute moves at a pace dictated by Darcy’s principle, aligning with the fluid it is suspended in. Our model, based on a one-dimensional bi-phase flow scenario, defines the salt volume moving through the AwD pore area in the x-direction over a specified duration as:
In the aforementioned equation, uwD represents the actual velocity of the water phase in the water-phase pore without osmotic pressure, measured in cm·s−1. The computational formula is as follows:
Incorporating Eq. (5) into Eq. (6) and accounting for fluid dynamic dispersion, the salt volume moving through the AwD pore space in the x-direction over a fixed duration due to fluid dynamic dispersion is:
The following analysis derives the advection-dispersion equation for salt migration within porous media. As depicted in Fig. 1, a differential control volume is selected within the flow domain. This elemental volume has a length of Δx and a cross-sectional area, A. The rightward horizontal direction is designated as the positive direction along the x-axis.
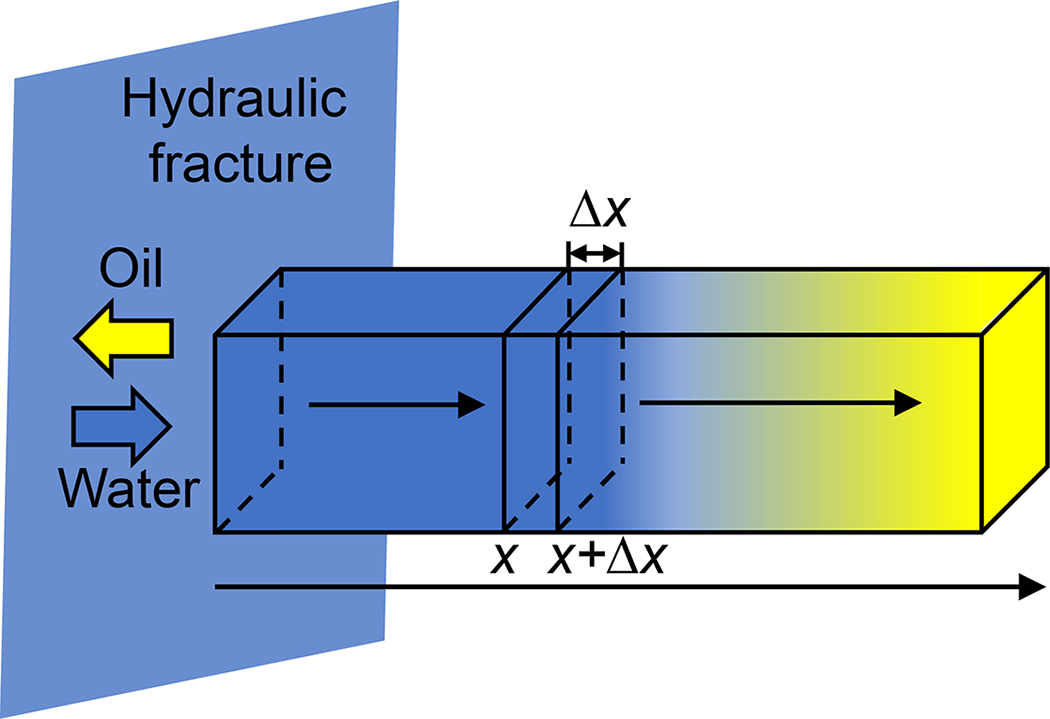
Figure 1: One-dimensional flow unit physical model
Let F denote the quantity of salt transported per unit time along the x-direction across a unit cross-sectional area of the rock core, as illustrated in the subsequent equation.
The negative sign for the dispersion term in the equation implies solute movement towards regions with lower concentration.
From the conservation of mass principle, we can derive:
Dividing both sides of the equation by ΔxΔtA and taking the limit as Δx and Δt approach zero, we obtain:
Substituting Eq. (8) into Eq. (10), we obtain:
Upon further simplification, we have:
A subsequent analysis culminates in the advection-dispersion equation for salt movement within porous media under bi-phase flow conditions. This equation encapsulates the change in fluid’s salt concentration at a specific true velocity, uwD. Interpolating Eq. (6) into Eq. (12) and organizing yields:
By substituting Eq. (1) into Eq. (13) and rearranging, we derive:
The initial conditions for the model are set as follows:
Boundary specifics for the model are outlined: The left boundary maintains a constant pressure, whereas the right boundary is impermeable. Moreover, the salt concentration in the external reservoir solution is kept static.
The relative permeability curve is defined as follows:
The capillary pressure curve is presented as follows:
2.2 Numerical Simulation and Solution
In the computational model, a block-centered grid approach is adopted. It is imperative to note that all grid dimensions are uniform and represented by Δx. Specifically, the grid at i = 1 acts as the primary water source grid, whereas the grid at i = n serves as the boundary grid. Within the domain of the water source grid, the water phase pressure is consistently maintained at zero. Concurrently, the oil phase pressure remains at the capillary counter-pressure, and the water saturation is perpetually set to unity.
The auxiliary equations and boundary conditions are combined and solved using the Implicit Pressure Explicit Saturation (IMPES) method to ensure computational accuracy while managing computational costs. This approach first solves the water and oil pressures implicitly and then explicitly determines the saturation and solute concentration distributions. Eq. (3) is discretized using finite difference methods after merging the oil and water equations, resulting in Eq. (19). Eq. (14) is discretized to yield Eq. (20).
In our study, we identified the effective seepage distance by observing the pressure field. Once a noticeable decline in the pressure field was observed, it indicated the commencement of seepage. The length over which this decline was observed was defined as the effective seepage distance.
Considering the aforementioned solution process and based on the fundamental simulation parameters presented in Table 1, the established seepage mathematical model was subjected to computational programming.
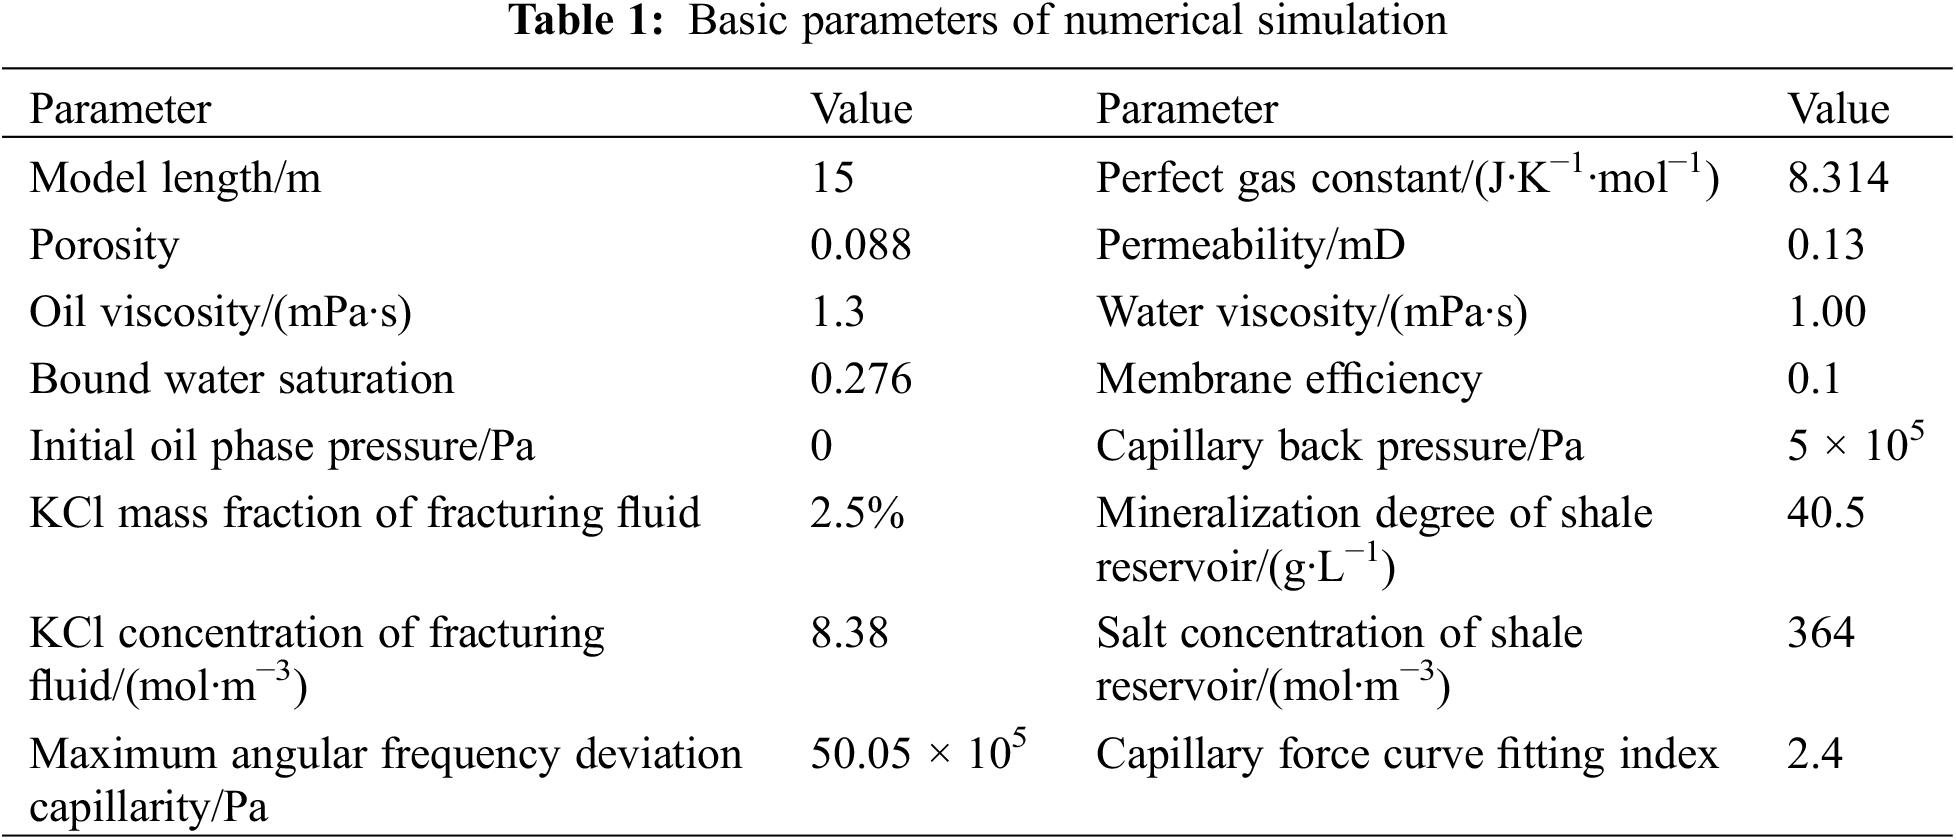
The relative permeability curves and capillary pressure curves used in this study are illustrated in Fig. 2.
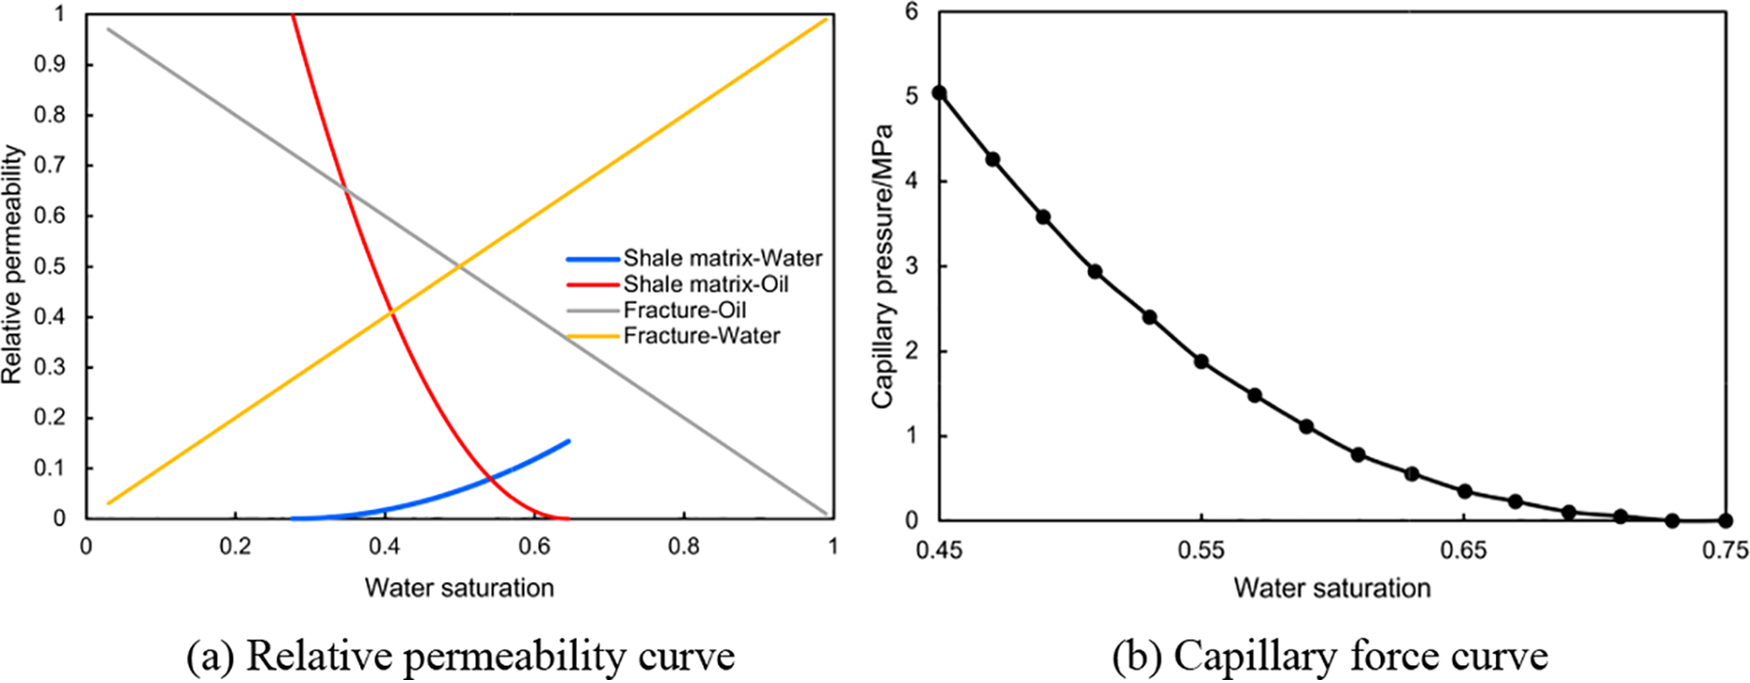
Figure 2: Relative permeability curve and capillary force curve
In this study, data were utilized from a typical shale oil reservoir characterized by low rock brittleness index and a relatively high horizontal stress difference. This reservoir exhibits significant variation in rock mechanical parameters, indicating strong reservoir heterogeneity. Such heterogeneity is a key factor affecting the establishment of an efficient displacement seepage system post volume fracturing [26–28]. Moreover, due to the extremely low permeability of the shale, pressure propagation within the matrix unit is slow, and the effective seepage distance is controlled by the dynamic pressure boundary. Based on the constructed mathematical model and numerical simulation parameters, the matrix blocks’ seepage patterns and effective seepage distances during the two-phase oil-water shut-in and backflow stages were studied.
3.1 Impact of Osmotic Action on Imbibition
In the preceding sections, a shale seepage mathematical model was constructed, taking into account both osmotic pressure and capillary forces. To compare the effects of different driving forces on post-fracturing shale seepage, we plotted the seepage depth variation curves considering both capillary forces and osmotic pressure, as well as those considering only capillary forces while neglecting osmotic pressure. In this study, the seepage depth is defined as the range of saturation fluctuations in the shale matrix reservoir. As depicted in Fig. 3, with the increase in soaking time, the seepage depth rises rapidly and then gradually slows down. After 552 h (23 days), the seepage depth reaches equilibrium. The primary driving force for spontaneous imbibition is the capillary force. However, osmotic pressure also plays an indispensable role. The osmotic enhancement effect of KCl ions in the fracturing fluid additives can significantly improve the imbibition recovery rate of shale oil reservoirs. When both capillary and osmotic pressures are considered, the equilibrium seepage depth is 0.95 m, which is approximately 12% greater than when only capillary forces are considered. Therefore, in studies related to enhancing the recovery rate of shale oil reservoirs through imbibition, osmotic action should be regarded as a crucial mechanism, second only to capillary action.
Figure 3: Curves of seepage depth under different driving forces
To investigate the influence of different fracturing fluid salinities on imbibition, numerical simulations were conducted by varying the salinity at the fracture face and the external reservoir solution. The study aimed to understand the impact of varying salinity differences on shale imbibition. The selection of mass fractions of KCl in the external reservoir solution, ranging from 0% to 10%, was based on practical field applications of fracturing fluids. Specifically, a concentration of 2.5% KCl represents the actual concentration applied in the target reservoir. The imbibition depth variation under different salinity differences is depicted in Fig. 4. It was evident that changes in salinity difference significantly influenced the degree of extraction. As the mass fraction of KCl in the fracturing fluid increased, the enhancing effect of the fracturing fluid’s imbibition gradually weakened. In practical field applications, the mass fraction of KCl in the fracturing fluid is 2.5%, corresponding to an imbibition depth of 0.95 m. In contrast, when there is no salinity difference between the fracturing fluid and the formation fluid, the spontaneous imbibition depth of the fracturing fluid is only 0.82 m, a reduction of 13.7%. When the internal reservoir solution salinity remains constant, a decrease in the external reservoir solution salinity increases the salinity difference between the internal and external solutions, subsequently increasing the imbibition depth. Therefore, for hydraulic fracturing development of shale oil reservoirs, it is advisable to reduce the salinity of the fracturing fluid and increase the salinity difference between the formation water and the fracturing fluid. This promotes the imbibition of the fracturing fluid into the shale, thereby enhancing the recovery rate of shale oil.
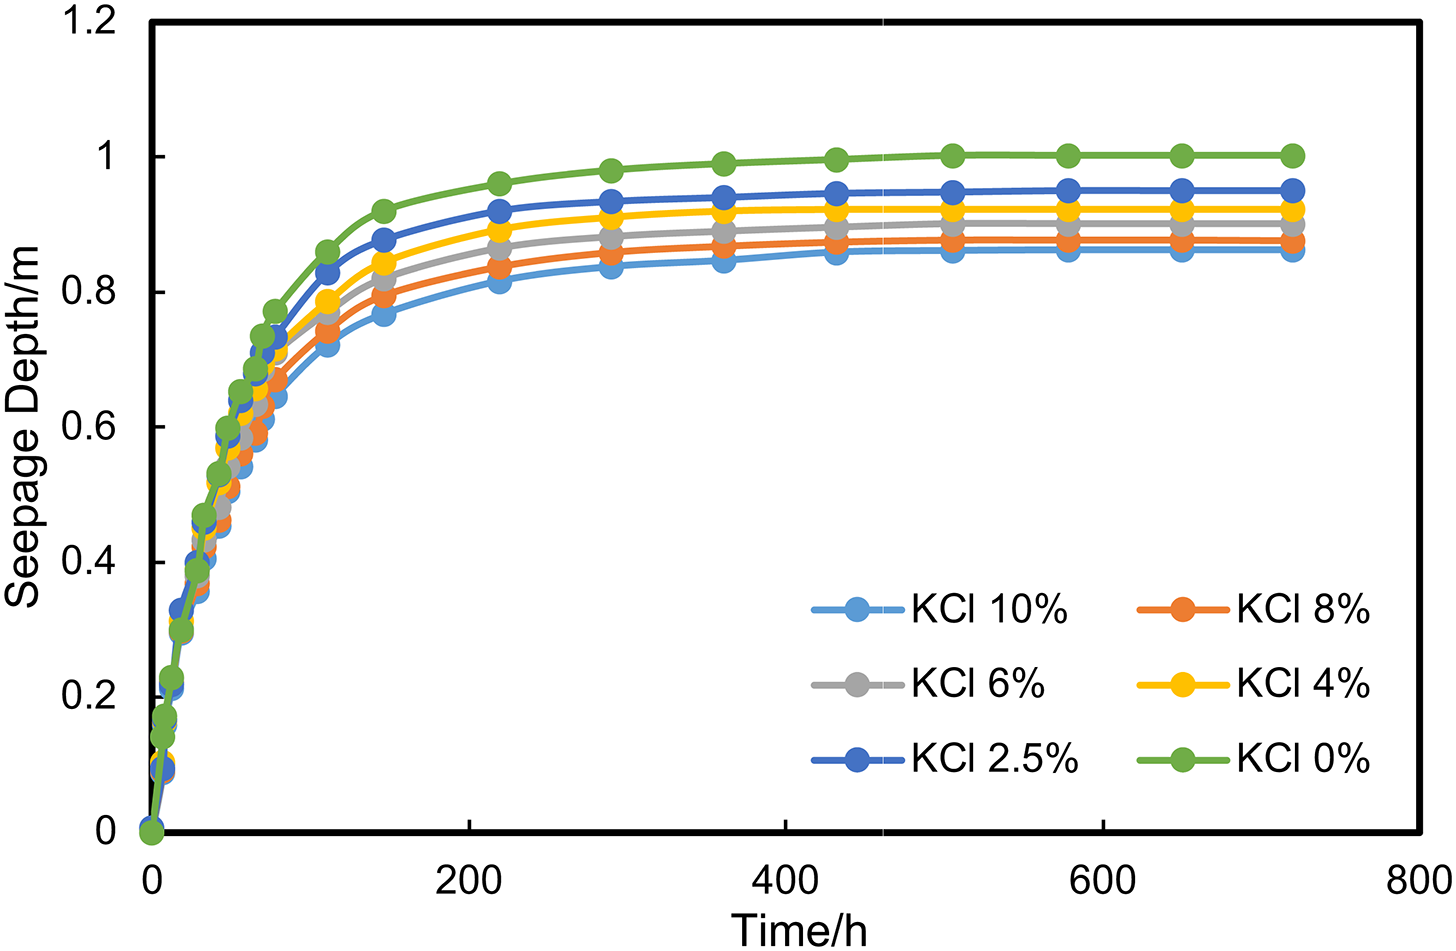
Figure 4: Curves of seepage depth under different salinity differences
3.2 Matrix-Fracture Pressure Dynamics in Shale Imbibition
In this study, we utilized the established seepage mathematical model to examine the matrix-fracture pressure equilibrium during the forced imbibition process in shale after the enhancement of the fracturing fluid. We deduced the bottom-hole flowing pressure post-enhancement using wellhead pressure data and the wellbore pressure loss model. This pressure was then set as the initial fracture wall pressure. We simulated 30 days to observe the saturation and pressure changes within the inter-fracture matrix of the shale reservoir.
Fig. 5 depicts the changes in oil saturation within the shale matrix reservoir over different shut-in durations. One day after shut-in, forced imbibition had driven the fracturing fluid deeper into the reservoir, achieving a seepage depth of 0.48 m. This phenomenon can be attributed to the capillary action and the differential pressure between the fracture and the matrix. As the fluid imbibed, it displaced the oil, leading to changes in saturation. By the 15th day, a distinct fracturing fluid invasion zone had emerged near the fracture, extending the seepage depth to 1.42 m. The expansion of this zone indicates the continuous movement of the fracturing fluid, driven by the pressure gradient. By the end of the 30-day period, the seepage depth had plateaued at 1.78 m, suggesting that the matrix had reached near-saturation with the fracturing fluid.
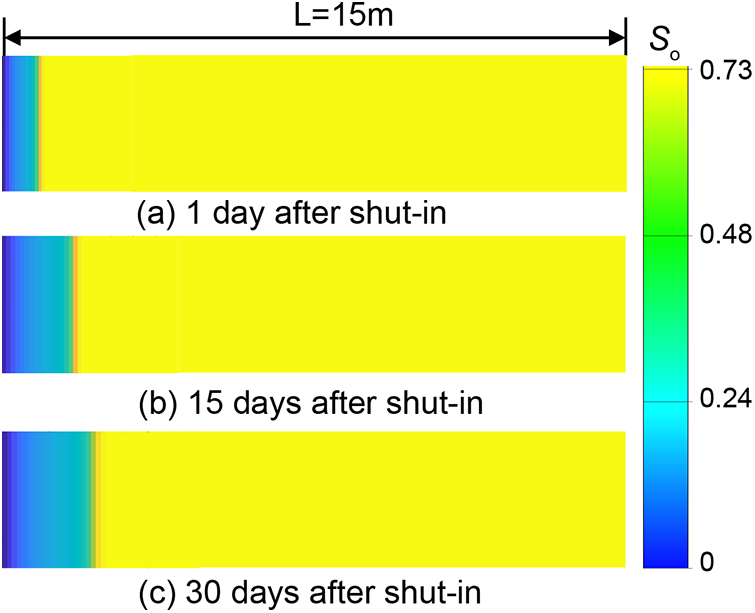
Figure 5: Variations in shale matrix oil saturation over different shut-in durations
Fig. 6 illustrates the pressure dynamics in the shale reservoir over the shut-in period. Initially, the energizing effect of the fracturing fluid had elevated the fracture wall pressure to around 31 MPa. However, as the shut-in period progressed, this pressure began to decline, while the shale matrix reservoir pressure steadily increased, suggesting an evolving equilibrium between the fracture and matrix.
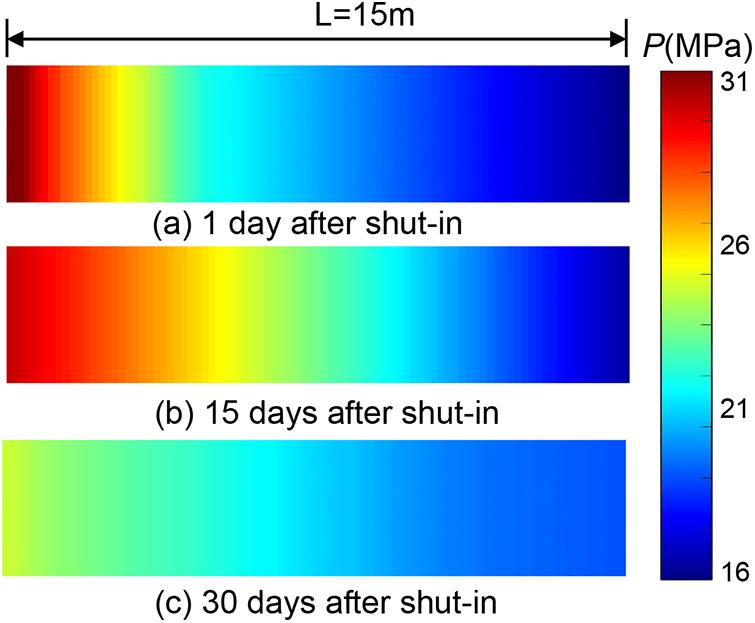
Figure 6: Variations in shale matrix pressure over different shut-in durations
Fig. 7 presents the vertical pressure variations within the reservoir over different shut-in durations. There was a pronounced pressure disparity between the fracture and matrix in the early shut-in stages. This disparity is a direct consequence of the initial injection, creating a pressure differential that drives fluid movement. However, by the 28th day, this disparity had diminished, with the system stabilizing around a pressure of 19.8 MPa.
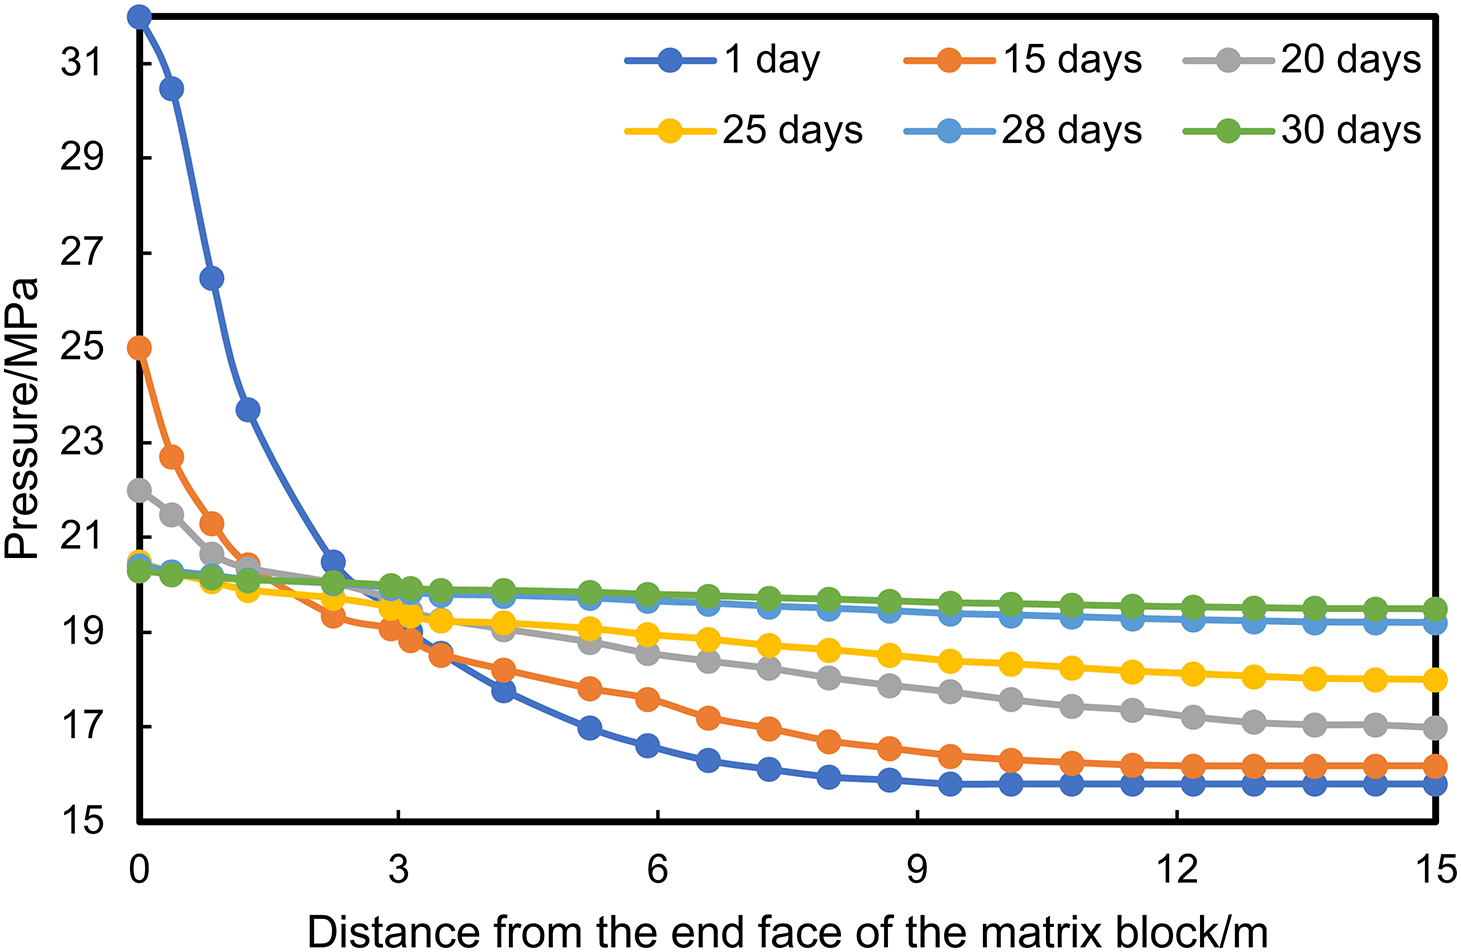
Figure 7: Pressure variations in the vertical reservoir over different shut-in durations
3.3 Seepage Distance during the Flowback Production Phase
Building on the insights from the previous section, we employed the developed imbibition mathematical model to elucidate the mechanisms by which enhanced permeability influences the imbibition and displacement efficiency in shale oil during the soaking phase. This section delves into the pressure and saturation distribution dynamics during the backflow production phase of shale oil. By establishing a constant pressure boundary at the fracture face for backflow production, we aim to define the limiting seepage distance and explore the variations in pressure and saturation within the shale matrix reservoir over different production durations.
Considering the bubble point pressure of the target reservoir to be approximately 9.1 MPa, the model’s fracture face pressure was set at 9.2 MPa, slightly above the bubble point, for production purposes. The initial reservoir pressure of the model was established at 19.8 MPa, reflecting the final stabilized pressure during the soaking phase. This setup aimed to simulate the flow dynamics of both oil and water during the production phase.
In this study, the term “limiting seepage distance” is introduced to represent the maximum distance to which pressure propagates in the reservoir when production extends indefinitely. The definition of the limiting seepage distance is based on the assumption of infinite production duration. Specifically, under the conditions of a startup pressure gradient (in this study, a gradient of 0.13 MPa/m is used), the distance to which pressure propagates to its utmost limit is regarded as the limiting seepage distance.
Fig. 8 depicts the relationship between the distance from the face of the matrix block and the corresponding pressure values over varying production durations, ranging from one to ten years. As observed from the figure, with the progression of production time, the pressure depletion zone gradually shifted from the left fracture wall deeper into the shale reservoir. The range affected by pressure changes expanded, indicating an increasing effective seepage distance in the shale reservoir. Moreover, as production time extended, the rate of increase in the effective seepage distance gradually decelerated. The calculated limiting seepage distance was determined to be 6.02 m.
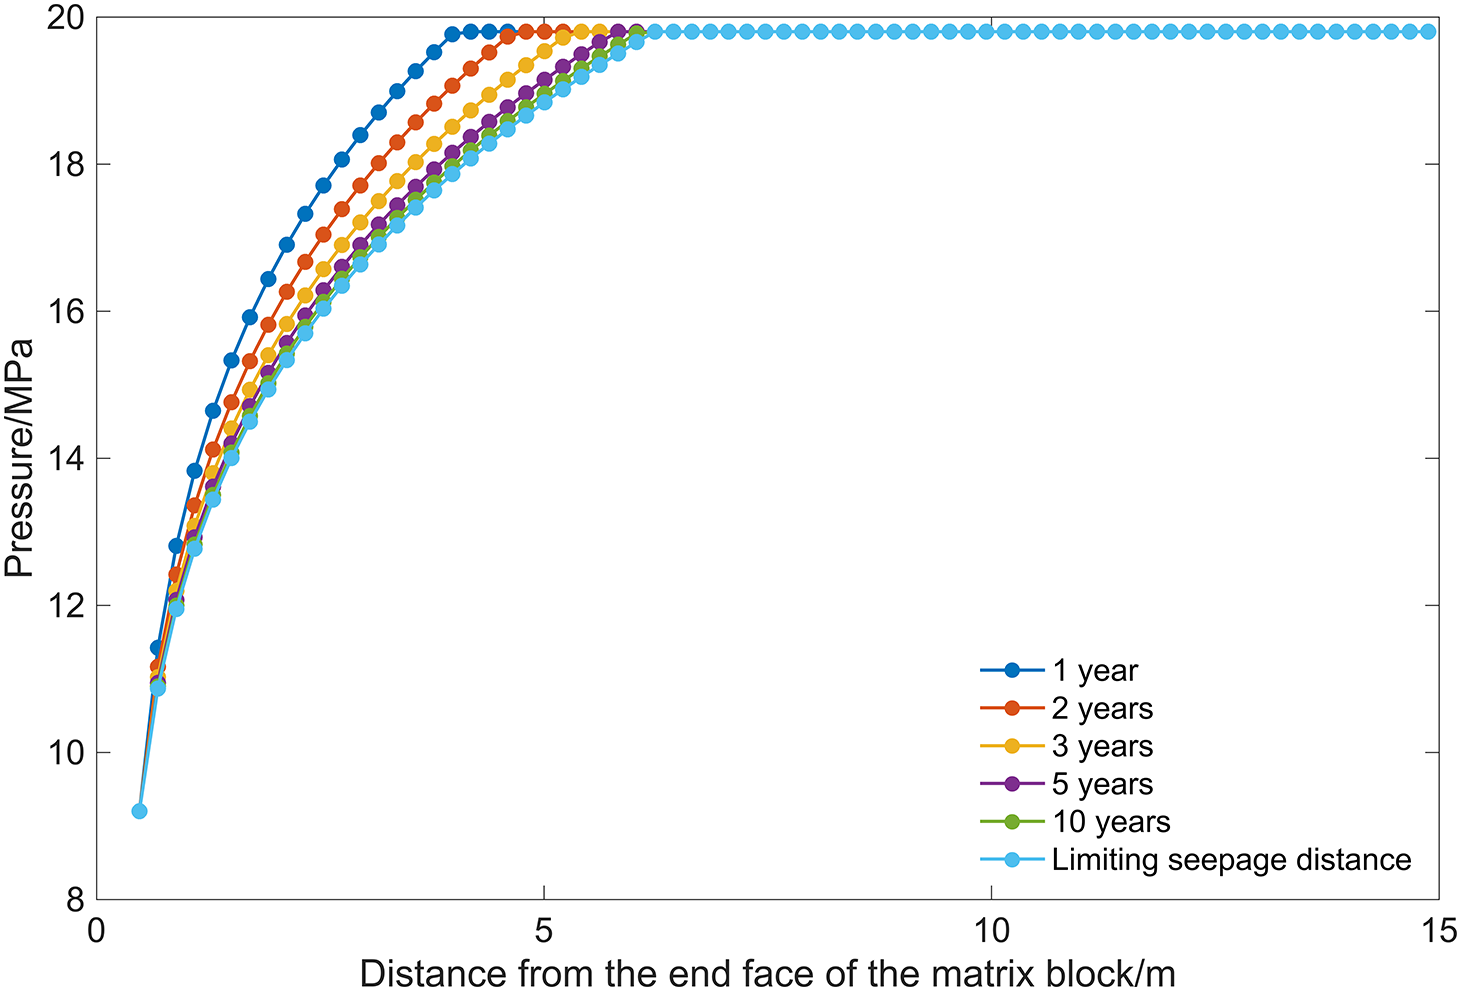
Figure 8: Vertical profile of reservoir pressure variation during the production phase
Fig. 9 illustrates the relationship between the distance from the face of the matrix block and the oil saturation over various production durations. The reservoir’s oil saturation had exhibited a trend similar to that of pressure over time. Under the conditions of ultimate seepage, the reservoir’s oil saturation had decreased from 0.726 to approximately 0.68.
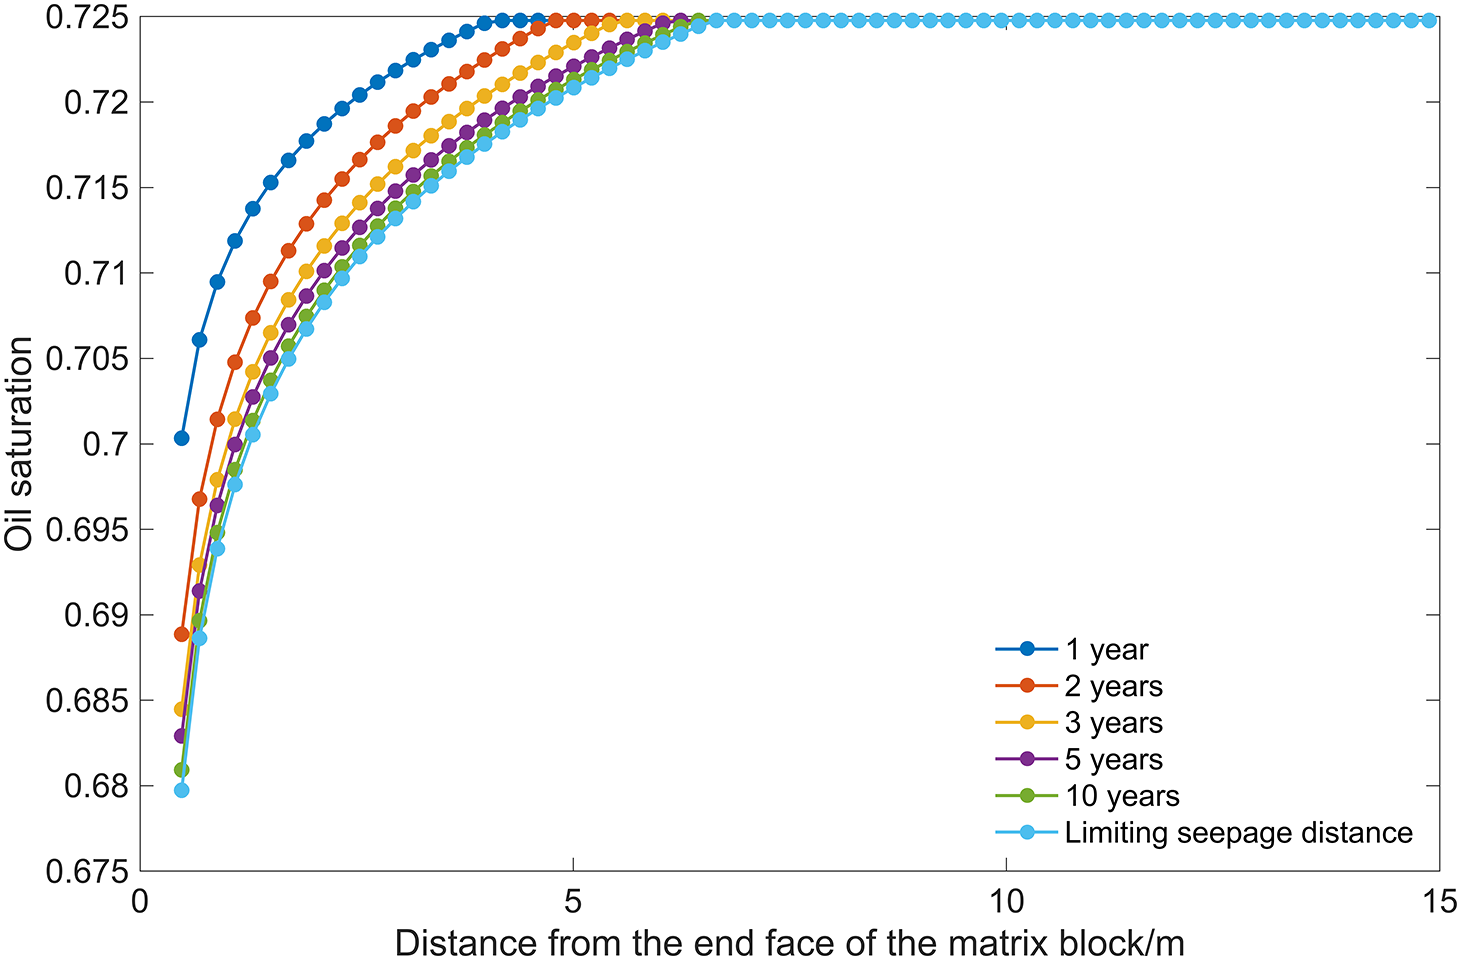
Figure 9: Vertical profile of oil saturation (Dimensionless) changes in the reservoir during the production phase
By analyzing the distribution changes of reservoir pressure and saturation during the backflow phase of shale oil, it was determined that the maximum effective seepage distance is 6.02 m. This suggests that when the matrix block length is approximately 12 m, the shale matrix reservoir can be fully utilized. This insight can be applied to the study of differentiated fracture-matrix effective seepage boundaries, further guiding the optimization of fracturing spacing and cluster spacing.
In this study, we address the phenomenon of ‘enhanced imbibition due to low salinity’ in shale oil reservoirs. By considering any position between fractures as a unit, we established a one-dimensional mathematical model for shale oil reservoir flow, incorporating both capillary forces and osmotic pressure. Numerical simulations were employed to solve the model, investigating the two-phase flow mechanism based on matrix block size. We further analyzed the characteristics of enhanced imbibition in shale reservoirs, determining the effective seepage distances during both the shut-in imbibition and production phases. The primary conclusions drawn are:
Capillary forces primarily drive spontaneous imbibition. However, osmotic pressure can significantly enhance the imbibition recovery rate. Osmotic effects should be considered as a crucial mechanism for enhanced imbibition, second only to capillary action. When both capillary and osmotic forces are considered, the calculated imbibition depth increases by 12% compared to considering only capillary forces. The salinity difference between the reservoir and the fracturing fluid significantly impacts the imbibition depth. As the mass fraction of KCl in the fracturing fluid increases, the enhancing effect of the fluid’s imbibition weakens. For hydraulic fracturing development in shale oil reservoirs, it is advisable to reduce the salinity of the fracturing fluid and increase the salinity difference between the formation water and the fracturing fluid to enhance shale oil recovery.
For the shut-in phase, we calculated the equilibrium between matrix and fracture pressures during the forced imbibition process post-fracturing fluid energization. Results indicate that, in the early shut-in period, forced imbibition displaces the fracturing fluid deeper into the reservoir, with an imbibition depth (or effective seepage distance) of 1.78 m. After a shut-in period exceeding 28 days, the pressure between the matrix and the fracture gradually reaches a dynamic equilibrium, stabilizing around 19.8 MPa.
During the production phase, a constant pressure boundary was set at the fracture face for back-production. Following the principle that the pressure gradient between the shale matrix reservoir and the fracture face exceeds the threshold pressure gradient, the maximum effective seepage distance is the pressure propagation limit distance. Simulations suggest that the maximum seepage distance for the target block is approximately 6.02 m. This implies that the shale matrix reservoir can be fully utilized when the matrix block length is around 12 m. This understanding can be applied to differentiate the effective seepage limits between fractures and matrices, further guiding the optimization of fracture spacing in hydraulic fracturing design.
Acknowledgement: The authors express sincere gratitude to PetroChina Changqing Oilfield Company for their invaluable support in this research. The funding, data, and resources provided by PetroChina Changqing Oilfield Company were instrumental in the successful completion of this study. The continuous encouragement and assistance from the company have played a crucial role in the research endeavors of the authors.
Funding Statement: This study was supported by China National Petroleum Corporation’s Fourteenth Five-Year Plan’s Prospective Fundamental Project on ‘Research on Key Technologies and Equipment for Reservoir Reconstruction’ (2021DJ45).
Author Contributions: The authors confirm contribution to the paper as follows: study conception and design: Lijun Mu, Jie Bai; data collection: Jie Bai; analysis and interpretation of results: Xiaojia Xue, Xiaoyan Li, Xueliang Han; draft manuscript preparation: Jie Bai, Xiaoyan Li. All authors reviewed the results and approved the final version of the manuscript.
Availability of Data and Materials: The data used in the context of this study is confidential due to its sensitive nature and agreements made with relevant stakeholders. As such, it cannot be publicly disclosed or made accessible. We acknowledge the importance of data transparency in research and have taken steps to provide as much detail as possible in the manuscript without compromising the confidentiality agreements.
Conflicts of Interest: The authors declare that they have no conflicts of interest to report regarding the present study.
References
1. Deng, Y., Wang, W., Du, X., Su, Y., Sun, S. et al. (2023). An automated data-driven workflow for identifying fractured horizontal well sweet spots in shale reservoirs. 57th U.S. Rock Mechanics/Geomechanics Symposium, ARMA-2023-0672, Atlanta, Georgia, USA. [Google Scholar]
2. Deng, Y., Wang, W., Du, X., Su, Y., Sun, S. et al. (2023). Machine learning based stereoscopic triple sweet spot evaluation method for shale reservoirs. Proceedings of the 11th Unconventional Resources Technology Conference, URTEC-3864421-MS, Colorado Convention Center, Denver, Colorado, USA. [Google Scholar]
3. Markus, G., Diego, C., Ignacio, E. (2023). Mathematical programming models for shale oil & gas development: A review and perspective. Computers & Chemical Engineering, 177, 108317. https://doi.org/10.1016/j.compchemeng.2023.108317 [Google Scholar] [CrossRef]
4. Sharifi, M., Kelkar, M., Karkevandi-Talkhooncheh, A. (2021). A workflow for flow simulation in shale oil reservoirs: A case study in woodford shale. Advances in Geo-Energy Research, 5(4), 365–375. https://doi.org/10.46690/ager [Google Scholar] [CrossRef]
5. Wang, W., Xie, Q., Wang, H., Su, Y., Rezaei-Gomari, S. (2023). Pseudopotential-based multiple-relaxation-time lattice Boltzmann model for multicomponent and multiphase slip flow. Advances in Geo-Energy Research, 9(1), 106–116. [Google Scholar]
6. Marsden, H., Basu, S., Striolo, A., MacGregor, M. (2022). Advances of nanotechnologies for hydraulic fracturing of coal seam gas reservoirs: Potential applications and some limitations in Australia. International Journal of Coal Science & Technology, 9(1), 27. https://doi.org/10.1007/s40789-022-00497-x [Google Scholar] [CrossRef]
7. Kurotori, T., Murugesu, M., Zahasky, C., Vega, B., Druhan, J. et al. (2023). Mixed imbibition controls the advance of wetting fluid in multiscale geological media. Advances in Water Resources, 175, 104429. https://doi.org/10.1016/j.advwatres.2023.104429 [Google Scholar] [CrossRef]
8. Deng, Y., Wang, W., Su, Y., Sun, S., Zhuang, X. (2023). An unsupervised machine learning based double sweet spots classification and evaluation method for tight reservoirs. Journal of Energy Resources Technology, 145(7), 072602. https://doi.org/10.1115/1.4056727 [Google Scholar] [CrossRef]
9. Sun, Y., Bai, B., Wei, M. (2015). Microfracture and surfactant impact on linear cocurrent brine imbibition in gas-saturated shale. Energy Fuels, 29(3), 1438–1446. https://doi.org/10.1021/ef5025559 [Google Scholar] [CrossRef]
10. Schulz, H., Yang, S., Schovsbo, N., Rybacki, E., Ghanizadeh, A. et al. (2021). The furongian to lower ordovician alum shale formation in conventional and unconventional petroleum systems in the Baltic Basin–A review. Earth-Science Reviews, 218, 103674. https://doi.org/10.1016/j.earscirev.2021.103674 [Google Scholar] [CrossRef]
11. Binazadeh, M., Xu, M., Zolfaghari, A., Dehghanpour, H. (2016). Effect of electrostatic interactions on water uptake of gas shales: The interplay of solution ionic strength and electrostatic double layer. Energy Fuels, 30(2), 992–1001. [Google Scholar]
12. Siddiqui, M., Ali, S., Fei, H., Roshan, H. (2018). Current understanding of shale wettability: A review on contact angle measurements. Earth-Science Reviews, 181, 1–11. https://doi.org/10.1016/j.earscirev.2018.04.002 [Google Scholar] [CrossRef]
13. Simpson, J. P., Dearing, H. L. (2000). Diffusion osmosis-an unrecognized cause of shale instability. IADC/SPE Drilling Conference, SPE-59190-MS, New Orleans, Louisiana, USA. [Google Scholar]
14. Al-Bazali, T. M., Zhang, J., Chenevert, M. E., Sharma, M. M. (2009). An experimental investigation on the impact of capillary pressure, diffusion osmosis, and chemical osmosis on the stability and reservoir hydrocarbon capacity of shales. SPE Offshore Europe Oil and Gas Conference and Exhibition, SPE-121451-MS, Aberdeen, UK. [Google Scholar]
15. Wu, J., Di, Y., Zhang, J., Li, P., Zhang, D. et al. (2021). Numerical simulation research on influencing factors of post-fracturing flowback of shale gas wells in the Sichuan Basin. Frontiers in Earth Science, 9, 745393. https://doi.org/10.3389/feart.2021.745393 [Google Scholar] [CrossRef]
16. Ghanbari, E., Dehghanpour, H. (2015). Impact of rock fabric on water imbibition and salt diffusion in gas shales. International Journal of Coal Geology, 138, 55–67. https://doi.org/10.1016/j.coal.2014.11.003 [Google Scholar] [CrossRef]
17. Su, Y., Sun, Q., Wang, W., Guo, X., Xu, J. et al. (2022). Spontaneous imbibition characteristics of shale oil reservoir under the influence of osmosis. International Journal of Coal Science & Technology, 9, 69. https://doi.org/10.1007/s40789-022-00546-5 [Google Scholar] [CrossRef]
18. Uzun, O., Kazemi, H. (2021). Assessment of enhanced oil recovery by osmotic pressure in unconventional reservoirs: Application to Niobrara chalk and Codell sandstone. Fuel, 306, 121270. https://doi.org/10.1016/j.fuel.2021.121270 [Google Scholar] [CrossRef]
19. Zhang, Q., Wang, W., Su, Y., Chen, W., Lei, Z. et al. (2023). A semi-analytical model for coupled flow in stress-sensitive multi-scale shale reservoirs with fractal characteristics. Petroleum Science (In Press). [Google Scholar]
20. Wang, L., Dai, C., Li, X., Chen, X., Xia, Z. (2019). Pressure transient analysis for asymmetrically fractured wells in dual-permeability organic compound reservoir of hydrogen and carbon. International Journal of Hydrogen Energy, 44(11), 5254–5261. https://doi.org/10.1016/j.ijhydene.2018.08.082 [Google Scholar] [CrossRef]
21. Xue, L., Chen, X., Wang, L. (2019). Pressure transient analysis for fluid flow through horizontal fractures in shallow organic compound reservoir of hydrogen and carbon. International Journal of Hydrogen Energy, 44(11), 5245–5253. https://doi.org/10.1016/j.ijhydene.2018.08.084 [Google Scholar] [CrossRef]
22. Guppy, K. H., Cinco-Ley, H., Ramey, H. J., Samaniego-V., F. (1982). Non-darcy flow in wells with finite-conductivity vertical fractures. Society of Petroleum Engineers Journal, 22(5), 681–698. https://doi.org/10.2118/8281-PA [Google Scholar] [CrossRef]
23. Mahmoodi, S., Mahdi, A., Mohammad, S. (2019). New fluid flow model for hydraulic fractured wells with non-uniform fracture geometry and permeability. Journal of Natural Gas Science and Engineering, 68, 102914. https://doi.org/10.1016/j.jngse.2019.102914 [Google Scholar] [CrossRef]
24. Wang, K., Wang, L., Ren, B., Fan, H. (2021). Study on seepage simulation of high pressure grouting in microfractured rock mass. Geofluids, 2021, 1–12. [Google Scholar]
25. Olsen, H. W. (1972). Liquid movement through kaolinite under hydraulic, electric, and osmotic gradients. AAPG Bulletin, 56(10), 2022–2028. [Google Scholar]
26. He, Y., He, Z., Tang, Y., Xu, Y., Xu, J. et al. (2023). Interwell fracturing interference evaluation in shale gas reservoirs. Geoenergy Science and Engineering, 231, 212337. https://doi.org/10.1016/j.geoen.2023.212337 [Google Scholar] [CrossRef]
27. He, Y., He, Z., Tang, Y., Xu, Y., Long, J. et al. (2023). Shale gas production evaluation framework based on data-driven models. Petroleum Science, 20(3), 1659–1675. https://doi.org/10.1016/j.petsci.2022.12.003 [Google Scholar] [CrossRef]
28. Pidho, J., Cheng, Y., Li, Y., Yan, C. (2022). Parametric effects on fracture geometries from multi-fracture propagation emanating from neighbouring wellbores in quasi-brittle rocks. Natural Gas Industry B, 9(4), 347–364. https://doi.org/10.1016/j.ngib.2022.07.001 [Google Scholar] [CrossRef]
Cite This Article
 Copyright © 2024 The Author(s). Published by Tech Science Press.
This work is licensed under a Creative Commons Attribution 4.0 International License , which permits unrestricted use, distribution, and reproduction in any medium, provided the original work is properly cited.
 Downloads
 Citation Tools