
 Submit a Paper
 Propose a Special lssue
 Open Access
ARTICLE

A Well Productivity Model for Multi-Layered Marine and Continental Transitional Reservoirs with Complex Fracture Networks
1 Sichuan Changning Natural Gas Development Company Limited, PetroChina Southwest Oil and Gas Field Company, Yibin, 644399, China
2 Sichuan Shale Gas Exploration and Development Company Limited, PetroChina Southwest Oil and Gas Field Company, Neijiang, 641100, China
3 New Energy Division, PetroChina Southwest Oil and Gas Field Company, Chengdu, 610051, China
* Corresponding Author: Zhijian Hu. Email:
Fluid Dynamics & Materials Processing 2024, 20(6), 1313-1330. https://doi.org/10.32604/fdmp.2024.048840
Received 31 July 2023; Accepted 26 December 2023; Issue published 27 June 2024
 View Full Text
 Download PDF
Abstract
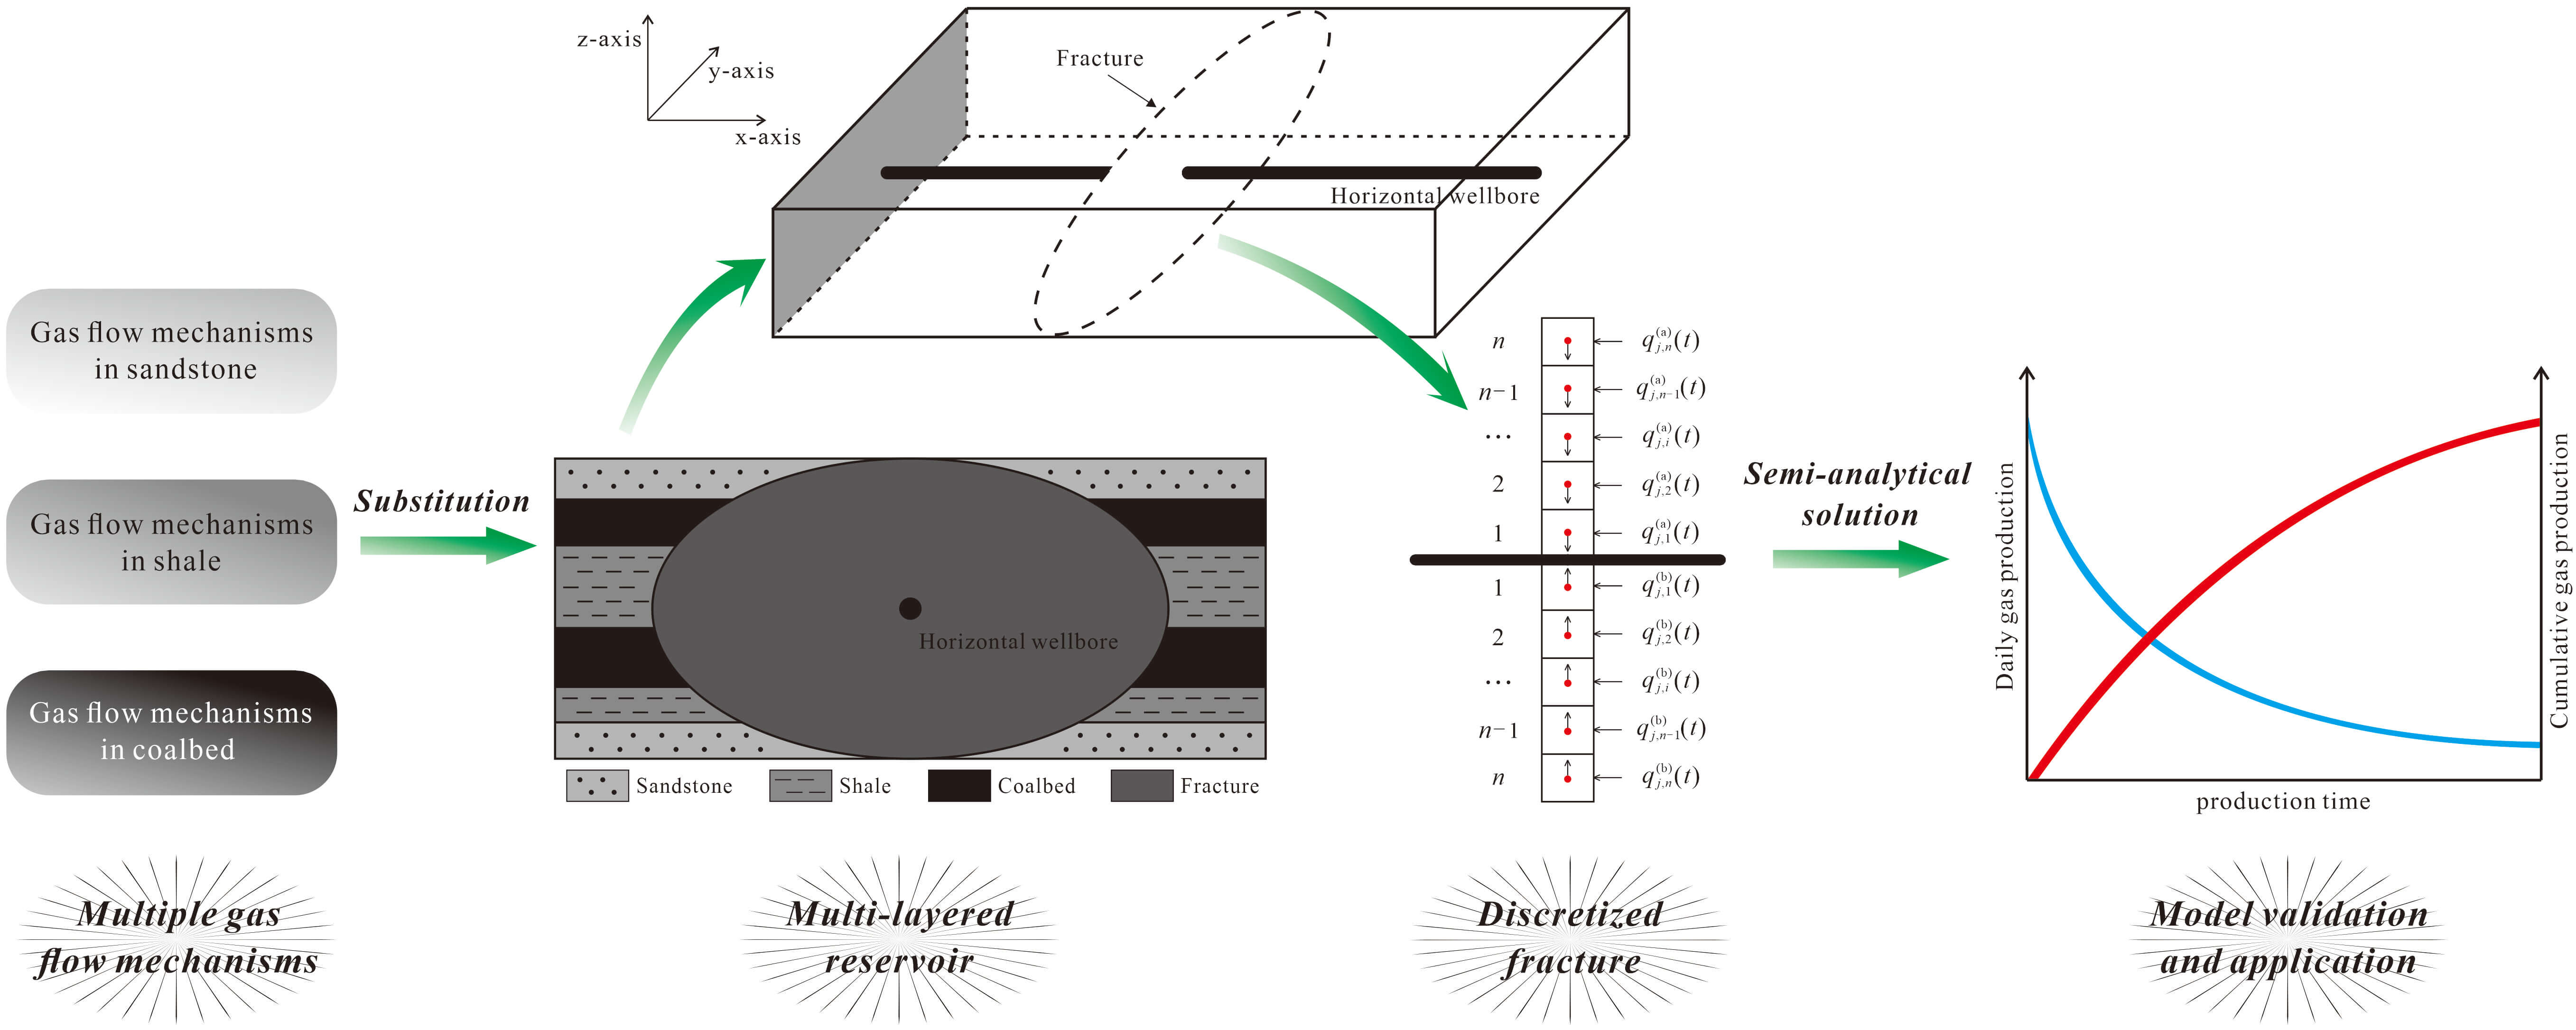
Using the typical characteristics of multi-layered marine and continental transitional gas reservoirs as a basis, a model is developed to predict the related well production rate. This model relies on the fractal theory of tortuous capillary bundles and can take into account multiple gas flow mechanisms at the micrometer and nanometer scales, as well as the flow characteristics in different types of thin layers (tight sandstone gas, shale gas, and coalbed gas). Moreover, a source-sink function concept and a pressure drop superposition principle are utilized to introduce a coupled flow model in the reservoir. A semi-analytical solution for the production rate is obtained using a matrix iteration method. A specific well is selected for fitting dynamic production data, and the calculation results show that the tight sandstone has the highest gas production per unit thickness compared with the other types of reservoirs. Moreover, desorption and diffusion of coalbed gas and shale gas can significantly contribute to gas production, and the daily production of these two gases decreases rapidly with decreasing reservoir pressure. Interestingly, the gas production from fractures exhibits an approximately U-shaped distribution, indicating the need to optimize the spacing between clusters during hydraulic fracturing to reduce the area of overlapping fracture control. The coal matrix water saturation significantly affects the coalbed gas production, with higher water saturation leading to lower production.Graphic Abstract
Keywords
Nomenclature
| Dp | Pore area fractal dimension |
| Dt | Tortuosity fractal dimension |
| Dmax | The maximum pore diameter (m) |
| Dmin | The minimum pore diameter (m) |
| L | The characteristic length of the capillary bundle (m) |
| Dav | The average pore diameter (m) |
| D | The pore diameter (m) |
| p | The reservoir pressure (MPa) |
| T | The reservoir temperature (K) |
| Z | The compressibility factor |
| R | The gas constant (J/(mol·K)) |
| Mg | The molar mass of the gas (kg/mol) |
| Cg | The gas compressibility factor (1/MPa) |
| Kn | The Knudsen number |
| DB | The surface diffusion coefficient considering gas molecule coverage |
| dm | The gas molecule diameter (m) |
| NA | Avogadro’s constant |
| pL | The Langmuir pressure (MPa) |
| qL | The Langmuir volume (m3/kg) |
| Dav_eff | The average effective pore diameter of coal matrix (m) |
| Dp_c | The pore area fractal dimension of the coal seam |
| Dt_c | The tortuosity fractal dimension of the coal seam |
| Lc | The characteristic length of the capillary bundle along the flow direction in the coal matrix (m) |
| pint | The original reservoir pressure (MPa) |
| p(x, y, z, t) | The pressure at any point in this layer (MPa) |
| q(a)j,i (t) | The flow rate of the i-th element on the upper wing of the j-th fracture (m3/s) |
| psc | The pressure at standard conditions (MPa) |
| Tsc | The temperature at standard conditions (K) |
| Ct | The comprehensive compressibility factor (1/MPa) |
| xe, ye, ze | The length, width, and thickness of the layer (m) |
| xw, yw, zw | The coordinates of the drainage point (m) |
| x, y, z | The coordinates of any point in the layer (m) |
| t | Time (s) |
| Klayer | The permeability of the layer (mD) |
| p(a)j,i | The pressure of the i-th element on the upper wing of the j-th fracture (MPa) |
| R(i, j) | The pressure drop coefficient of the reservoir (MPa/m3) |
| pwf | The bottomhole flowing pressure (MPa) |
| Kf | The permeability of the hydraulic fracture (mD) |
| L(a)fj | The length of the j-th fracture on the upper wing (m) |
| wf | The width of the j-th fracture (m) |
| q | The fracture flow rates |
| | The flow rate of the j-th fracture |
| O | The zero matrix |
| | The pressure drop matrix of the j-th fracture |
| F(a)j | The upper wing matrix of the j-th fracture |
| Greek Symbols | |
| φ | The porosity of the matrix |
| τa | The average tortuosity |
| μg | The gas viscosity (mPa·s) |
| α | The coefficient for the rarefied gas effect |
| α0 | The coefficient for the rarefied gas effect when Knudsen number approaches infinity |
| α1 | A constant |
| β | A constant |
| θ | The gas molecule coverage |
| εs | The proportion of organic matter in the shale matrix |
| | The porosity of coal matrix |
| | The porosity of this layer |
As conventional oil and gas resources continue to be depleted, unconventional natural gas resources such as shale gas, tight gas, and coalbed gas are becoming increasingly important in the world’s energy structure [1,2]. However, unconventional gas reservoirs are characterized by ultra-low porosity and ultra-low permeability [3,4]. Conventional vertical well extraction methods are not effective in recovering natural gas resources, necessitating the use of large-scale hydraulic fracturing technology to create a network of fractures within the reservoir and enabling economically efficient development [5–7]. Marine and continental transitional shale gas reservoirs provide a stable depositional environment in which tight sandstone gas and coalbed gas are often vertically stacked [8–10]. These reservoirs have become a focal point for the exploration and development of unconventional natural gas resources.
The heterogeneity of reservoirs in the vertical direction and the flow characteristics of gas in microscale and nanoscale pores in the different layers are significantly different for transitional gas reservoirs and conventional gas reservoirs. Existing productivity calculation methods, such as analytical methods [11,12], often assume that the reservoir is a multiple-component medium and divide it into several flow regions. The analytical solution for production in the Laplace domain is obtained using Laplace transformation. However, this method cannot describe the complex characteristics of the fracture network. Discrete fracture models [13,14], although capable of characterizing the morphology of complex fracture networks, cannot describe the vertical heterogeneity of the reservoir, leading to inaccurate calculation results. Numerical simulation methods [15–17] can simulate calculations by finely dividing the grid and assigning differentiated values to the grid, but they are complex in practice, require a significant workload, have a slow computation speed, and have difficulty simulating the flow characteristics of gas at the microscale and nanoscale. Therefore, there is a need to develop a method for predicting productivity that considers both the multiple flow mechanisms of gas and the characteristics of the vertically superimposed layers in the reservoir and describes the complex morphology of the fracture network. This method provides theoretical and technical support for the productivity evaluation of hydraulic fractured horizontal wells in marine and continental transitional reservoirs.
In this paper, we vertically divide the reservoir into different types of layers, including tight sandstone gas, shale gas, and coalbed gas. Considering the multiple flow mechanisms of gas and the different flow characteristics in the different types of layers, the fractal theory of a tortuous capillary bundle is utilized to calculate the apparent permeability of the different types of layers. The hydraulic fracture is discretized into fracture elements using the theory of real space source-sink functions and is combined with the principle of pressure drop superposition to establish a coupled flow model. The semi-analytical solution for the production is obtained using the matrix iteration method. A well in a real reservoir is selected for example fitting, and the calculation results are analyzed. The results of this study have theoretical and practical significance for the efficient development of marine and continental transitional gas reservoirs.
2 Apparent Permeability for Each Layer
Because the pores in tight sandstone are typically microscale and nanoscale pores, the dynamics of the gas molecules and their interaction with the pore surface are notable, which causes the flow behaviors to deviate from that predicted by the conventional Navier–Stokes equations [18]. The transport dynamic should be characterized by the Knudsen number, defined as the ratio of the molecular mean free path to the pore size [19]. That is, the flow of unconventional natural gas at the microscale and nanoscale cannot be simply described by viscous flow, and the slip effects should also be considered [20,21]. For tight sandstone matrix pores (Fig. 1), due to the absence of adsorbed gas molecules, only viscous flow and Knudsen diffusion exist within the pore channels.
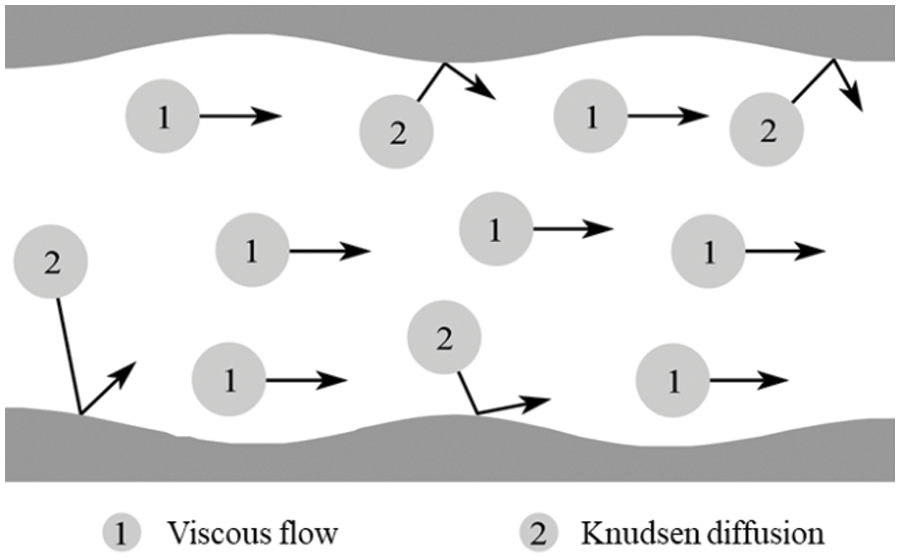
Figure 1: Gas transport mechanisms in the pores of tight sandstone
The pore size distribution of a tight sandstone reservoir generally ranges from several micrometers to nanometers, which is usually larger than that within shale and coalbed reservoirs. The actual pore structure of the matrix exhibits complexity and randomness. Therefore, the tortuous capillary bundle fractal theory [22] is used to describe the matrix pores. The fractal parameters include Dp and Dt. The pore area fractal dimension describes the complexity of the pore cross-section, while the tortuosity fractal dimension describes the complexity of the pore structure. Both of these fractal parameters significantly affect the flow of gas molecules within the pore channels. Their calculation formulas are as follows [23]:
The average tortuosity reflects the degree of curvature of the capillary bundle, while the average pore diameter and characteristic length reflect the size of the capillary bundle. The formulas for calculating the average tortuosity, average pore diameter, and characteristic length of the capillary bundle are as follows:
Knudsen diffusion is the collision of gas molecules with pore walls during the flow process. The mass flux of the viscous flow [24] and Knudsen diffusion [25] in the matrix pores of tight sandstone can be calculated using the following formulas:
The slip effect refers to the phenomenon where the velocity of gas molecules on the pore wall is not zero. As the pore size decreases, the collision between gas molecules and the pore wall gradually increases. Therefore, considering the slip effect and the rarefied gas effect, the correction formula for the mass flow rate of viscous flow is
The formula for calculating the coefficient for the rarefied gas effect is
α0 = 1.19, α1 = 4, and β = 0.4.
The formula for calculating the Knudsen number is
The total mass flux in the matrix pores of tight sandstone is
The total mass flow rate in the matrix pores of tight sandstone is
Applying Darcy’s law, the apparent permeability of tight sandstone can be calculated as follows:
Unlike tight sandstone matrix pores, shale matrix pores are divided into inorganic and organic pores. The flow characteristics of the gas molecules within the inorganic pores in shale are similar to those in the tight sandstone matrix, where both viscous flow and Knudsen diffusion occur. However, in the case of organic pores, gas molecules in the adsorbed state occupy the pore surfaces [26]. As the reservoir pressure decreases, the desorption and diffusion of the adsorbed gas molecules contribute significantly to the gas flow and cannot be neglected [27,28]. Therefore, in organic pores, in addition to the two types of flow mentioned above, there is also desorption and diffusion of gas molecules (Fig. 2), which should be carefully considered during modeling.
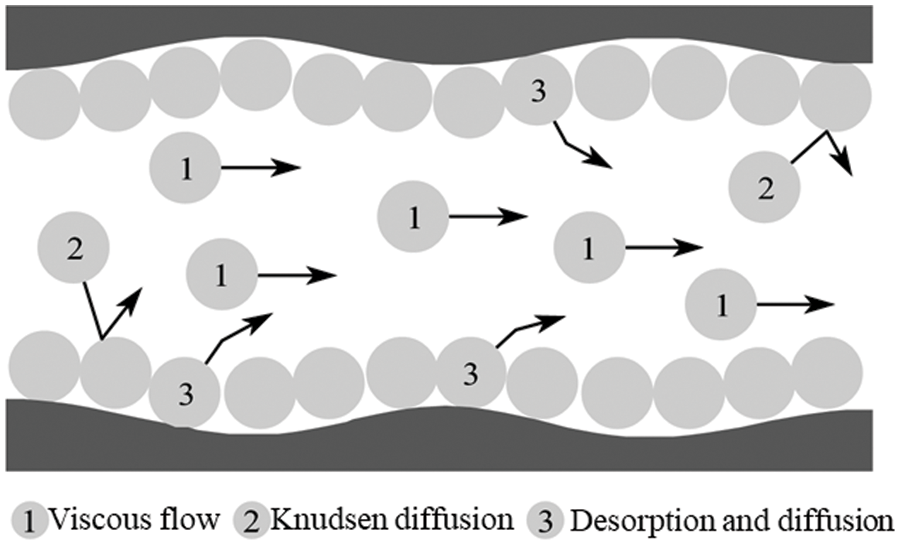
Figure 2: Gas transport mechanisms within organic nanopores of shale
The mass flux of desorption and diffusion is [29]
where DB is 1.57 × 10⁻⁷, and NA is 6.02 × 10²³/mol.
The formula for gas molecule coverage is [30]
The total mass flux in the organic pores in shale is
The total mass flow rate in the organic pores in shale is
The apparent permeability of the organic pores in shale is
The calculation method for the apparent permeability of inorganic pores in shale is the same as that for tight sandstone. By combining the apparent permeability of these two types of pores, the apparent permeability of shale can be obtained using the following equation:
In coal matrix pores, viscous flow, Knudsen diffusion, and surface diffusion occur (Fig. 3). However, compared with the organic matrix of shale, the matrix of coal has a higher adsorbed gas content. When analyzing matrix pores in coal, it is necessary to consider the influence of the adsorbed gas thickness on the gas flow.
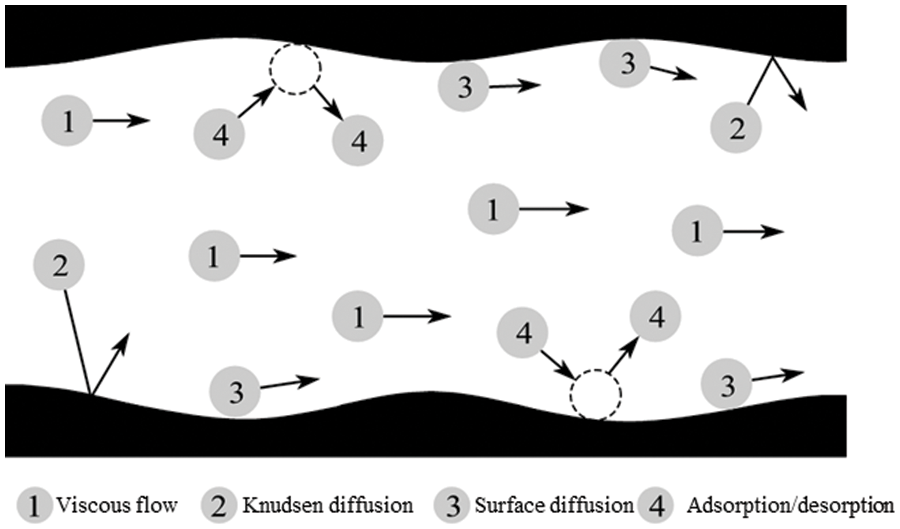
Figure 3: Gas transport mechanisms within nanopores in the coal matrix
The formula for calculating the quantity of adsorbed gas considering the real gas effect is
The formulas for calculating the effective pore diameter and effective porosity of the coal matrix are as follows:
The mass flux of the viscous flow, Knudsen diffusion, and surface diffusion in a single capillary cross-section of the coal matrix are as follows:
The total mass flux in a single capillary cross-section of the matrix of coal is obtained by summing the above equations. After multiplying by the cross-sectional area and integrating along the pore diameter range, the apparent permeability of the pores in the coal matrix can be calculated using Darcy’s law:
3 Productivity Model for Multi-Layered Reservoir
A schematic diagram of a multi-layered superimposed reservoir model is presented in Fig. 4. To establish a mathematical model, the following assumptions are made. (1) The hydraulic fractured horizontal well is located at the center of the reservoir and parallel to the x-axis. (2) The horizontal well has a total of n hydraulic fractures, numbered from 1 to n. (3) The hydraulic fractures are perpendicular to the horizontal well and fully penetrate the reservoir. (4) The flow within the reservoir is a single-phase gas flow, and the influence of gravity is neglected. (5) The gas flow in each layer is independent and only enters the wellbore through the hydraulic fractures. (6) The pressure drop in the wellbore is not considered.
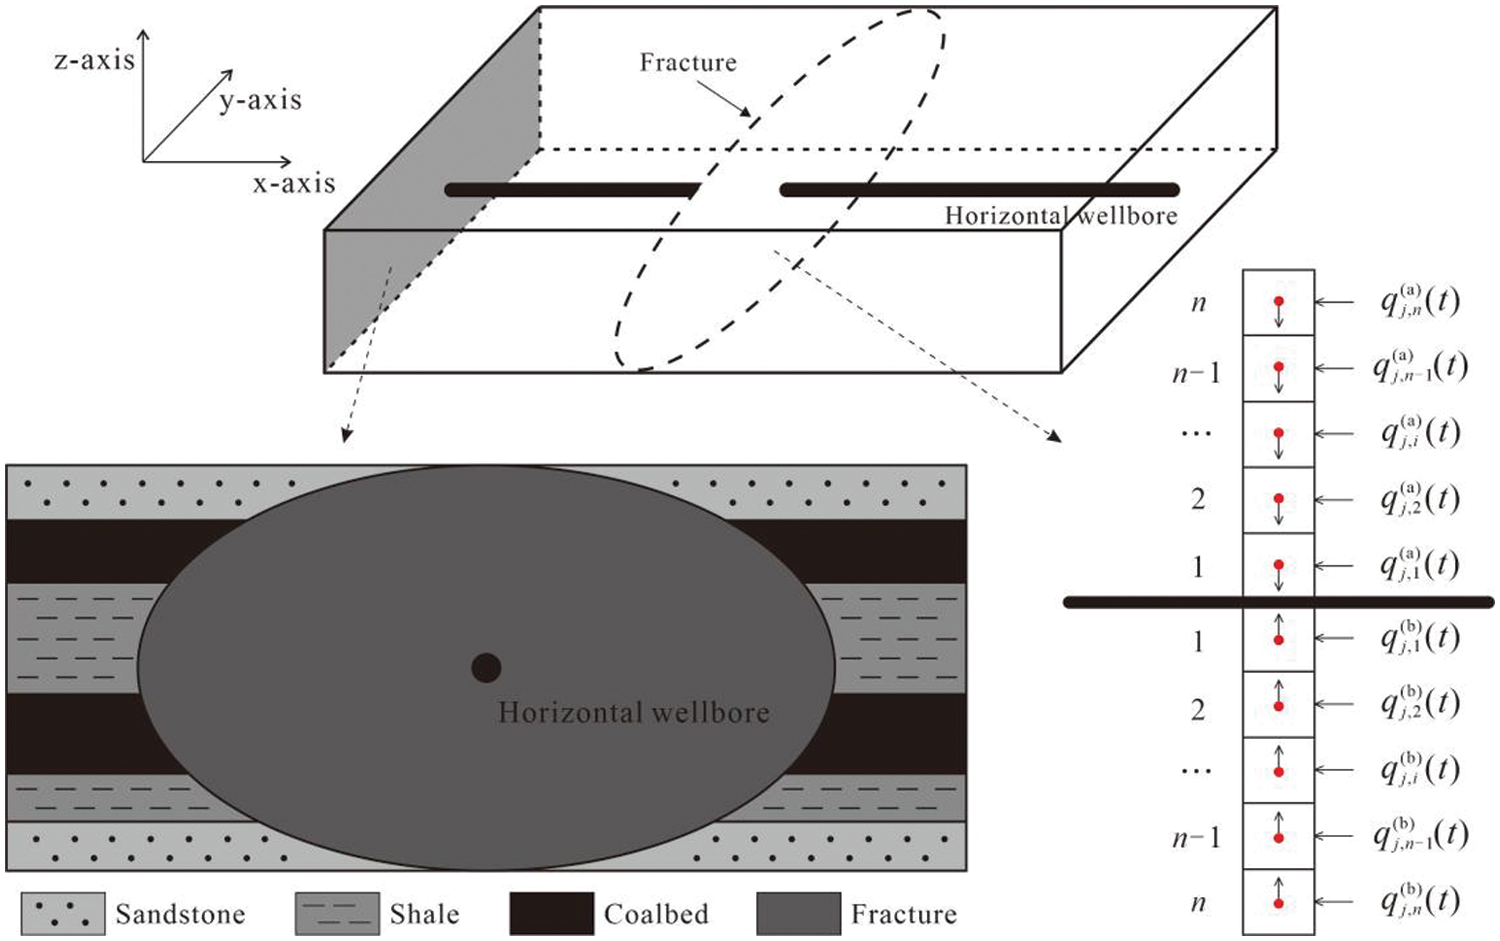
Figure 4: Schematic diagram of a multi-layered reservoir model with hydraulic fractures
The reservoir is divided into several layers, and each layer is numbered from 1 to N from top to bottom. For a particular layer, each hydraulic fracture is discretized into n segments on both the upper and lower wings. The number of fracture elements in this layer is 2n2, and each element can be viewed as a drainage point. At the initial time, there is no gas flow at the sealed boundary of the reservoir. According to the drainage point function [31], the pressure drop generated by the ith element on the upper wing of the jth fracture at any point in this layer can be expressed as follows:
In the above equation, layer represents the different types of gas reservoirs, which include tight sandstone gas, shale gas, and coalbed gas. The superscript a denotes the upper wing, while the subscript b denotes the lower wing. The equations for the upper and lower wings are symmetric, and only the equation for the upper wing is provided here. The same applies to the lower wing.
The drainage point functions in three directions are as follows:
The principle of pressure drop superposition refers to the algebraic sum of the pressure drop at any point in the formation when multiple wells are producing simultaneously, which is equal to the pressure drop caused by each well working alone at that point. Eq. (27) expresses the pressure drop generated by a fracture element. Using the principle of pressure drop superposition, the total pressure drop generated by the fracture elements on the upper wing can be obtained as follows:
Considering the gas flow in the hydraulic fracture as a one-dimensional linear flow, according to Darcy’s law, the pressure drop from the ith element on the upper wing of the jth fracture to the wellbore is as follows:
By neglecting the pressure drop in the wellbore, combining Eqs. (31) and (32) leads to the following coupled flow equation:
The linear system of equations is expressed as follows:
The system consists of the pressure, total pressure drop matrix, and fracture flow rates:
The total pressure drop matrix A is obtained by adding the reservoir pressure drop matrix and the fracture pressure drop matrix:
O and
Within the above matrix, the pressure drop matrix coefficients of the upper and lower wing of the jth fracture are
Using the Gauss–Seidel iterative method in Eq. (34), the production of the layer can be obtained. The total production of the horizontal well is obtained by summing the flow rates of all of the layers.
A flowchart of the model solution procedure is presented in Fig. 5.
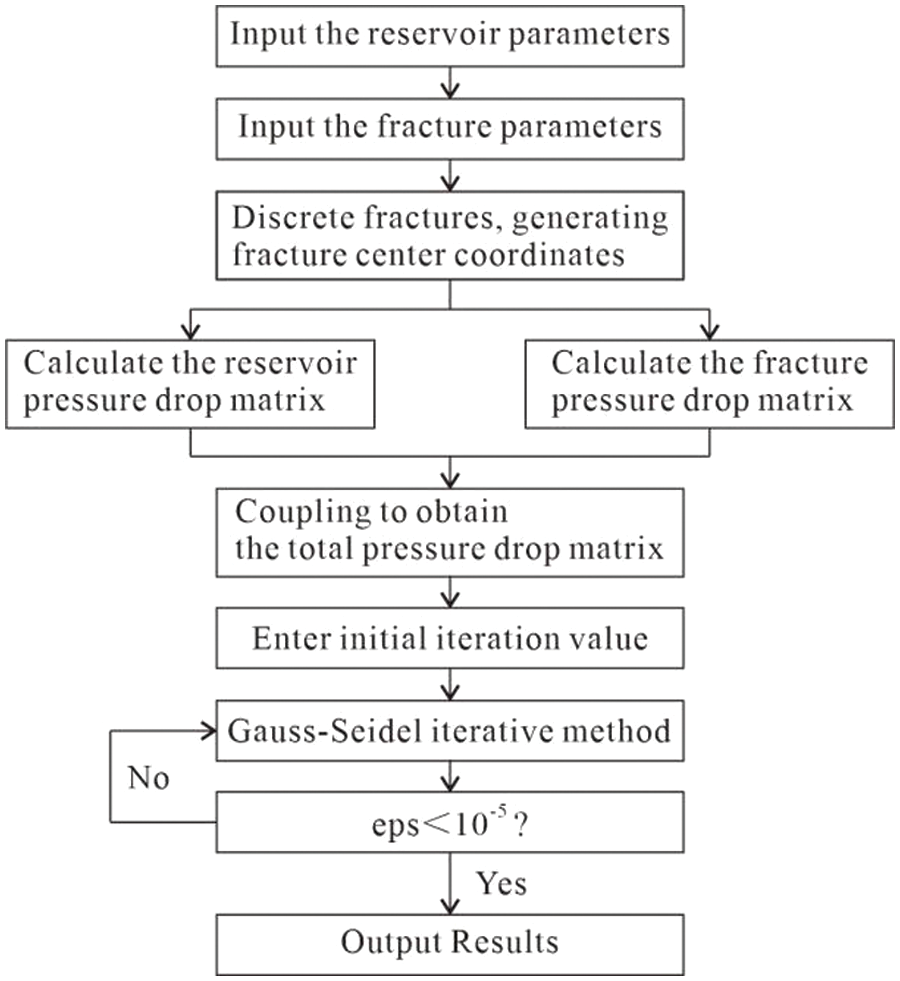
Figure 5: Flowchart of the model solution procedure
To verify the accuracy of the model presented in this paper, commercial software is used to compare and establish three small layers with different physical parameters. Considering that the extension length of the fracturing fractures in each layer is consistent, the stacking relationship from top to bottom is tight sandstone, shale, and coalbed.
The calculation results are shown in Fig. 6. In the mid-term, the cumulative gas production calculated using the simulation software is 1.85 million cubic meters, while the cumulative gas production calculated using the model presented in this paper is 1.91 million cubic meters, with a difference of 3.24%. Finally, the cumulative gas production calculated using the numerical simulation software is 2.75 million cubic meters, while the cumulative gas production calculated using the model presented in this paper is 2.69 million cubic meters, with a difference of 2.23%, verifying the accuracy of the model presented in this paper.
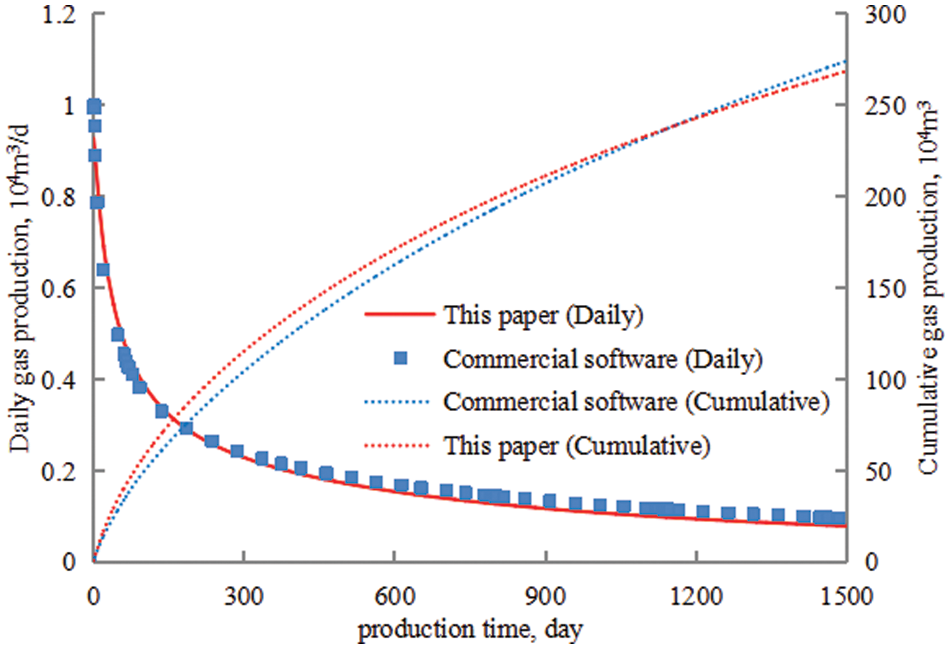
Figure 6: Comparison of production calculated using the proposed model and commercial software
5.1 Geologic Background of the Study Area
The study area is located in the eastern part of the Ordos Basin, spans Shanxi and Shaanxi provinces, and is within the boundaries of Daning County, Jixian County, and Shilou County. During the Late Carboniferous to Middle Permian, this area underwent a paleogeographic evolution process dominated by marine sedimentation, including epicontinental marine, marine-continental transitional, and fluvial clastic rock deposits, during which multiple transgressive events occurred [32].
5.2 Overview of Well and Reservoir
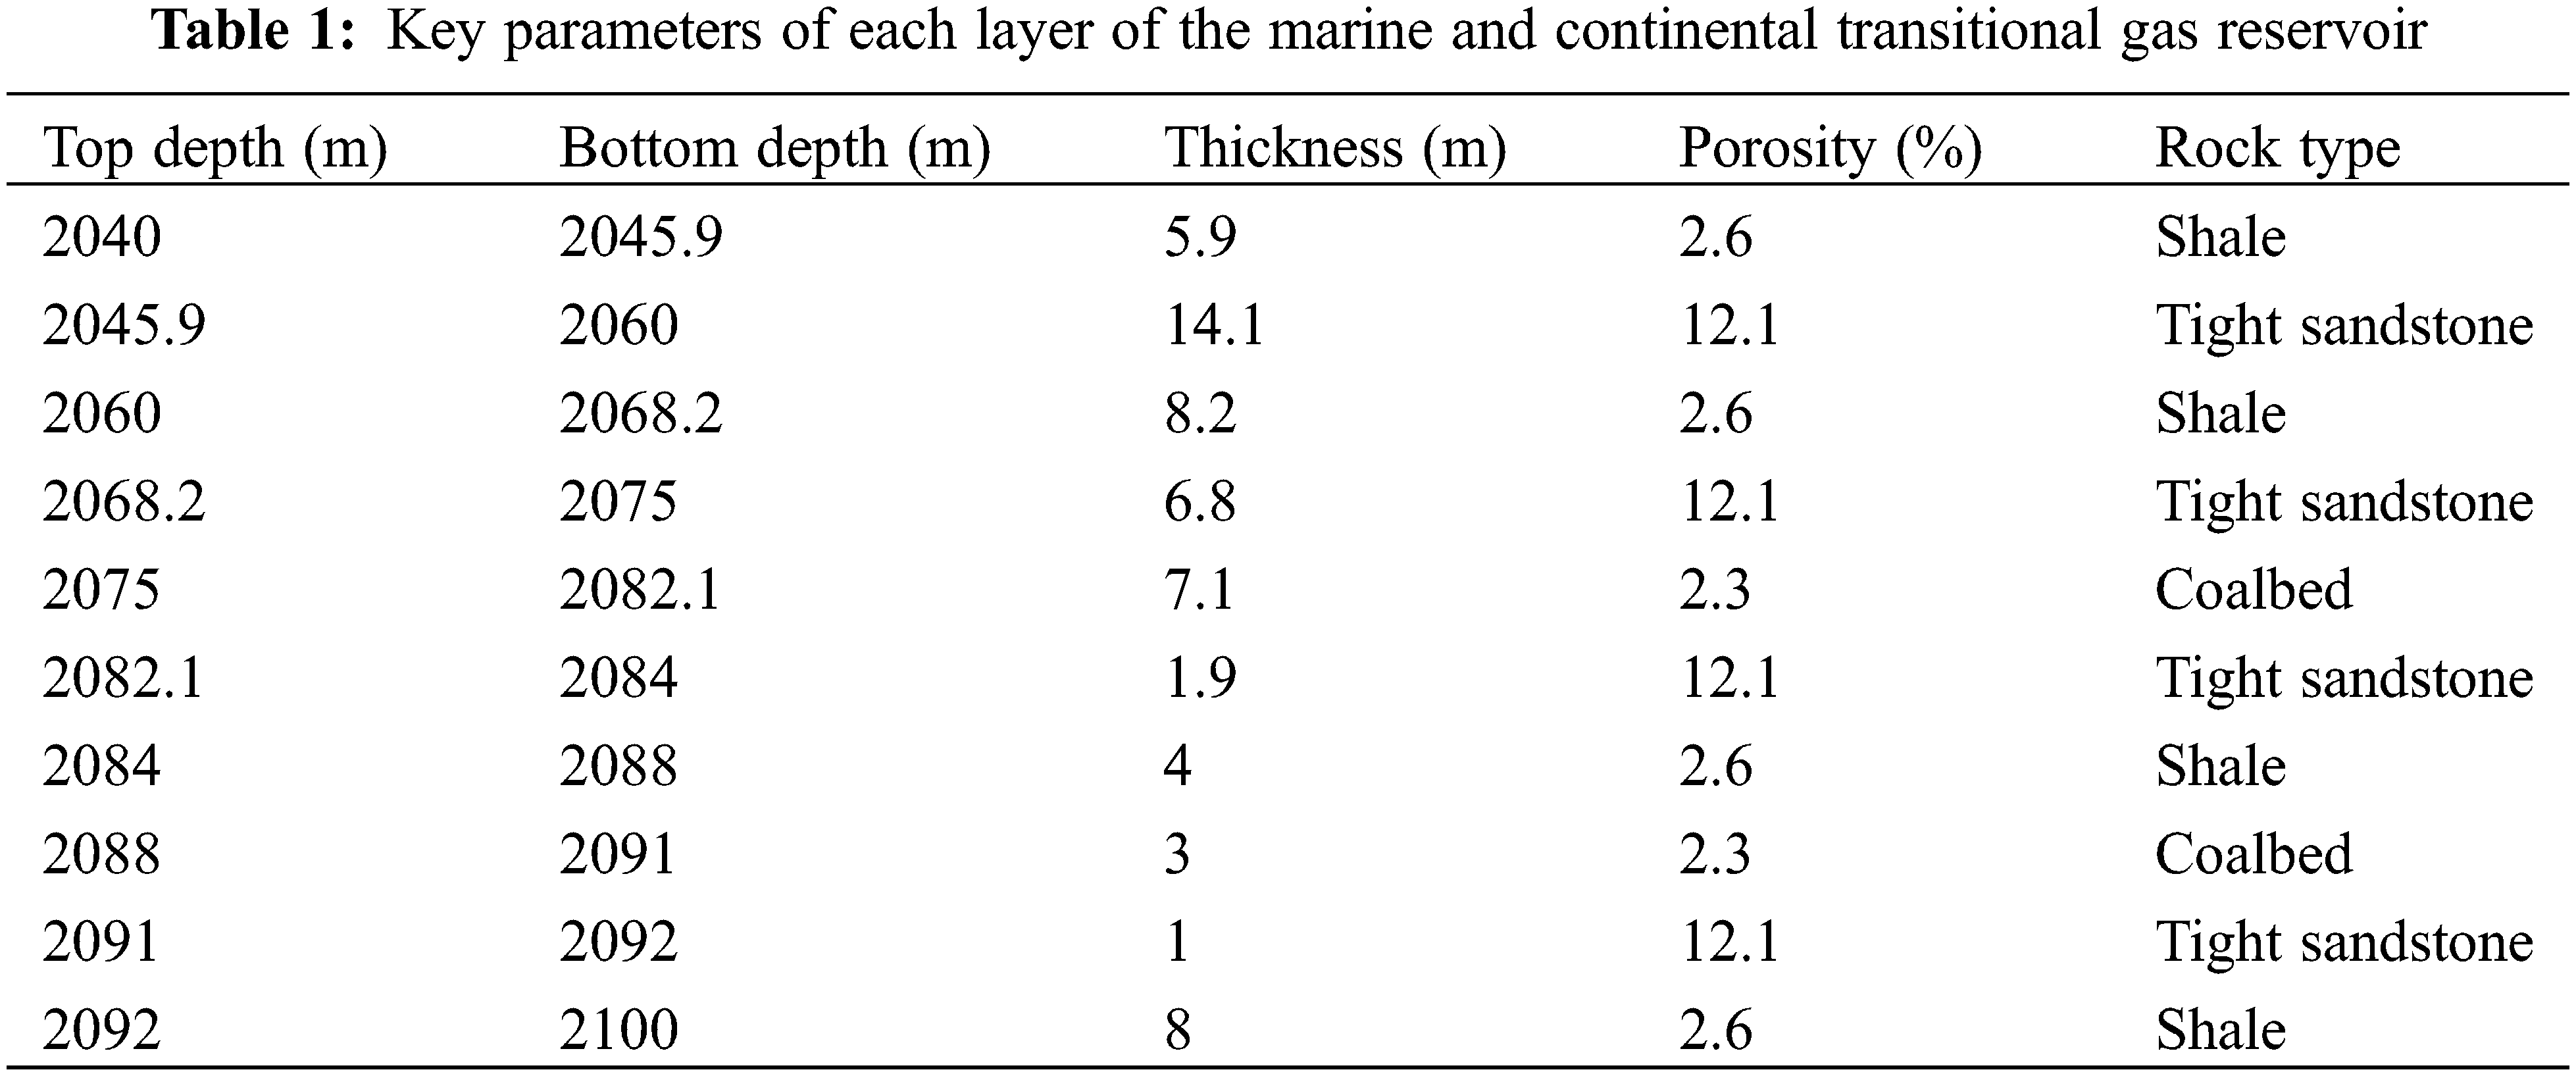
A fractured horizontal well was selected in the marine and continental transitional gas reservoir in the Ordos Basin, China. The well has a vertical depth of 2070 m, and the different rock types in the reservoir are divided based on the well log profiles obtained from exploration wells (Table 1). The area of the reservoir is 2000 m × 800 m, and the thickness of the reservoir is 60 m (2040–2100 m). It is divided into 10 layers vertically, consisting of tight sandstone, shale, and coal layers.
The simulated production time is 20 years, and the calculated results according to the proposed models are shown in Fig. 7. The calculated results closely match the production data, with a cumulative gas production of 6.57 million cubic meters after 20 years of production, which differs from the predicted estimated ultimate recovery (EUR) of the well (6.34 million cubic meters) by 3.63%. The heterogeneity within the gas reservoir leads to the occurrence of this difference. However, this is sufficient to meet industry standards and engineering errors and validates the accuracy of the model. In addition, the quick decline rate of gas production in the early production year is very typical for this type of reservoir. Because the producing layer is usually very thin, even several meters, this highlights the importance of fracturing all three types of reservoirs to commingle the production to increase the production capacity.
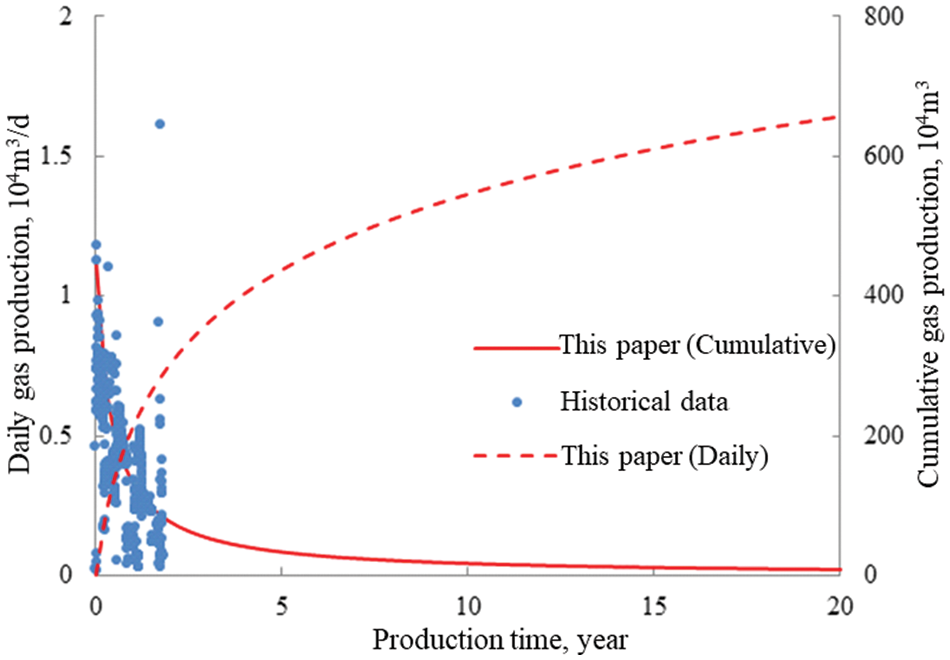
Figure 7: Comparison of production calculated using the model and the practical production data
6.1 Production Contribution of Different Layers
The production curves for the three types of unconventional gases are shown in Fig. 8. After 20 years of production, the cumulative productions of the sandstone gas, shale gas, and coalbed gas amount to 3.14, 2.54, and 0.89 million cubic meters, respectively. After one year of production, the daily gas production of the horizontal well for the tight sandstone gas decreases from an initial rate of 6,700 to 1,400 m3/d, a decrease of 78.6%. For the shale gas, the daily production decreases from an initial rate of 3,900 to 1,200 m3/d, a decrease of 69.7%. The daily gas production of the coalbed gas decreases from an initial rate of 1,300 to 410 m3/d, a decrease of 67.4%. The thin production layer, which affects the gas flow, is the reason for the rapid decline in early production. The shale and coal formations contain adsorbed gas, and as free gas is produced, the adsorbed gas desorbs to replenish the gas source. This is why the decline in production is slower compared with that of sandstone gas.
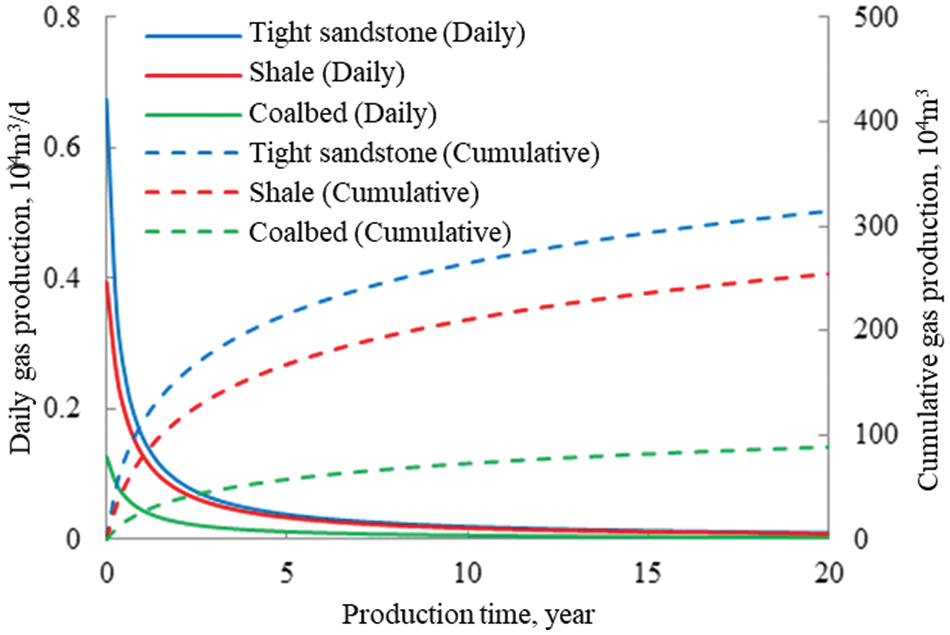
Figure 8: Comparison of production calculated using the model and practical production data
Based on the comparison of the gas production per unit thickness (Fig. 9), the gas productivities of the different reservoir types are as follows: tight sandstone gas > shale gas > coalbed gas, with values of 13,200, 9,700, and 8,800 m3/m, respectively. Sandstone reservoirs have larger pore throats and a higher permeability, resulting in the highest gas productivity. Both shale and coal formations contain adsorbed gas, but coalbeds have poorer properties and shale reservoirs have a higher proportion of free gas, leading to a higher gas productivity from shale formations. Here, the total productions of shale gas and coalbed gas may be larger than that of tight sandstone gas after a longer production period. This is because of the continued contribution of desorbed gas from these two types of reservoirs, while the lack of absorbed gas in sandstone reservoirs may lead to a lower production rate in long-term production.
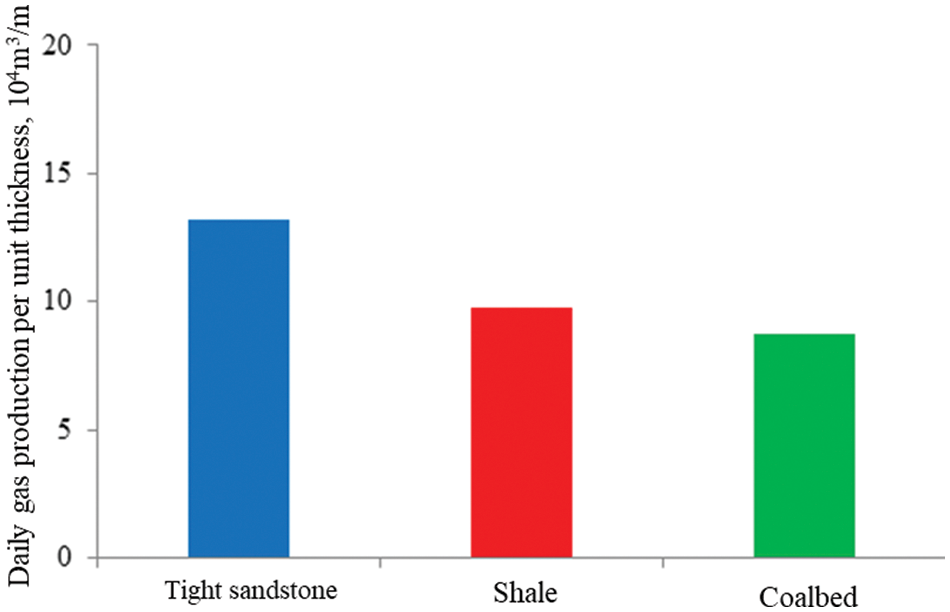
Figure 9: Comparison of gas productivity per unit thickness for different types of gas reservoirs
6.2 Production along a Horizontal Well
Because the reservoir physical properties and the fractured volumes along a horizontal well are different, the gas production from each cluster or stage may be different. Using the proposed model, the distribution of the gas production along a horizontal well is shown in Fig. 10, where the gas production per cluster and per stage exhibits an approximately U-shaped distribution. Here, after excluding the influences of the reservoir heterogeneity along the horizontal well, we conclude that the central fractures are influenced by the adjacent fractures and have overlapping control areas, resulting in lower gas production naturally. Therefore, during hydraulic fracturing operations, it is necessary to optimize the spacing between clusters and to make full use of the control area of each individual fracture to maximize production. From another perspective, it can also be noted that in each cluster or stage, the largest gas production contribution is always from tight sandstone layers, and the smallest is from coalbed gas layers. Therefore, for multi-layered marine and continental transitional gas reservoirs, the region with a large total thickness of sandstone layers should be the main priority for drilling a production well.
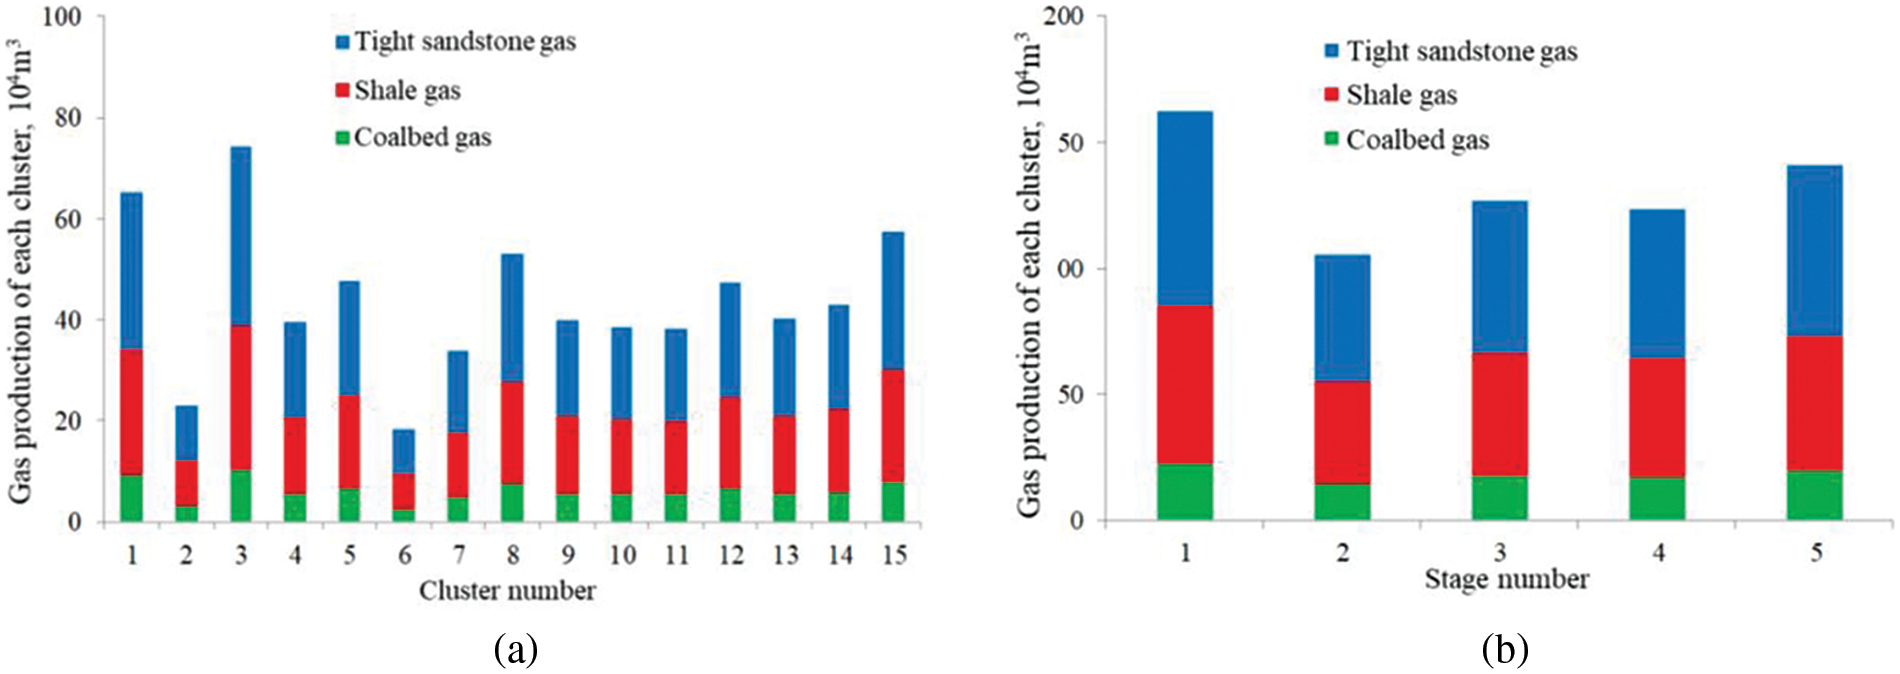
Figure 10: Production distributions of (a) each cluster and each stage and (b) along a horizontal well
6.3 Effects of Desorption and Diffusion
The desorption and diffusion of adsorbed gas are the main characteristics that differentiate shale gas and coalbed methane from other types of gas reservoirs. It is always very interesting to quantify the contribution of the adsorbed gas on gas production. This is because if the contribution of the adsorbed gas to the total gas production is noticeable, the gas can be produced from the reservoir continuously during the medium- and late-stage production. In this situation, even the production of a gas well in a marine and continental transitional gas reservoir is not very large, and the well will not be shut down for a long period, which can also have a good economic benefit. As shown in Fig. 11, after simulating production for 20 years, the cumulative gas production from desorption and diffusion in coalbed methane is 120,000 m3/d, accounting for 8.9% of the total production. For shale gas, the cumulative gas production from desorption and diffusion is 80,000 m3/d, accounting for 4.7% of the total production. Therefore, when calculating the production of shale gas and coalbed methane, it is necessary to comprehensively consider the desorption and diffusion of adsorbed gas.
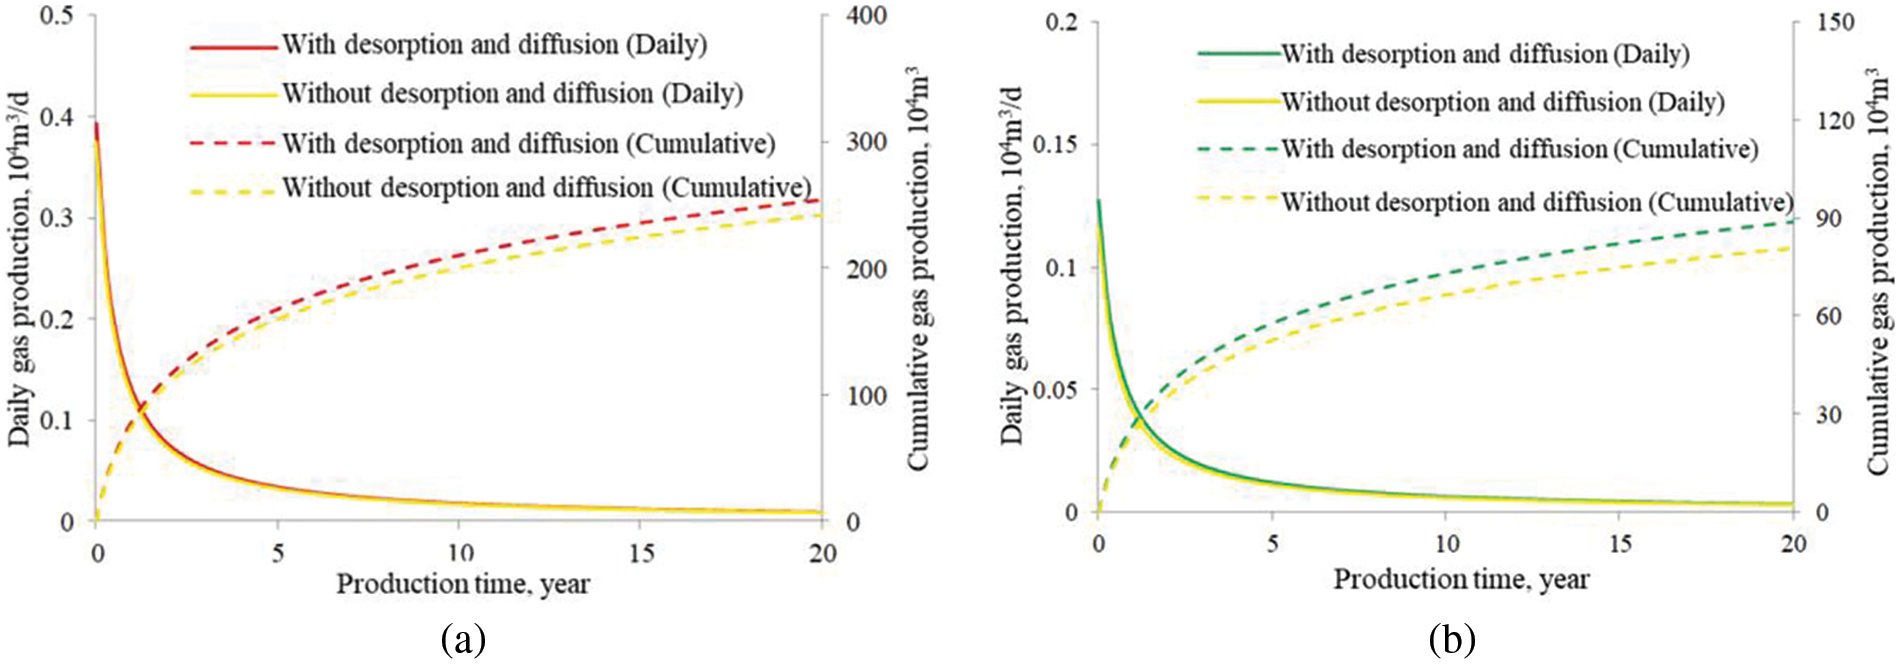
Figure 11: Effects of desorption and diffusion on the production of (a) shale gas and (b) coalbed gas
6.4 Effects of Water Saturation of Coalbed Gas Reservoir
A high initial water saturation always exists in coalbed gas reservoirs. The water saturation of the pores of the coal matrix significantly affects the production of coalbed methane. As a result, during the production of this type of reservoir, the gas well will usually experience a period of single-phase water production until a gas breakthrough occurs. Therefore, it is necessary to understand the effects of the initial water saturation of a coalbed gas reservoir on the total gas production performance. As shown in Fig. 12, when the water saturation increases from 10% to 20% and 30%, the gas production decreases by 16.8% and 34.9%, respectively. As the water saturation increases, the thickness of the pore water film increases, reducing the permeation pathway for gas molecules and leading to a decrease in production. Here, it should be noted that the multilayer interference is not considered in the model, and the produced water from the coal layer may flowback into other low-pressure layers, impeding their gas production.
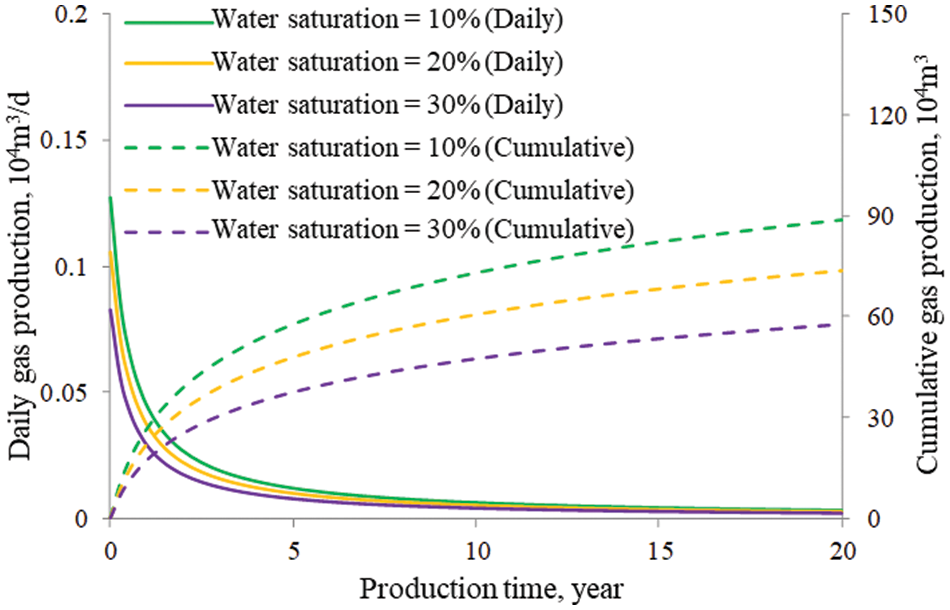
Figure 12: Effects of water saturation on gas production of a coalbed gas reservoir
Considering the vertical multi-layer characteristics of marine and continental transitional gas reservoirs, in this study, we incorporated the multiple gas flow mechanisms of each layer into a fractured horizontal well productivity model. The dynamic productivities of each type of gas reservoir, including tight sandstone gas, shale gas, and coalbed gas, were investigated. The results of this study have certain theoretical and practical significance for production capacity research and benefit the development of marine and continental transitional reservoirs. The main conclusions of this study are as follows:
(1) The unit thickness gas production of tight sandstone reservoirs is the highest, followed by shale gas reservoirs, and coalbed gas reservoirs have the lowest production. Furthermore, as the reservoir pressure decreases, the daily production of shale gas and coalbed gas decreases more rapidly compared with the production of tight sandstone gas.
(2) Due to the influence of adjacent fractures, the distribution of the gas production along a horizontal well in each cluster or each stage exhibits an overall U-shaped pattern. Therefore, in hydraulic fracturing operations, it is important to select an optimal cluster spacing to maximize the utilization of the control area of individual fractures.
(3) The impacts of desorption and diffusion of adsorbed gas cannot be ignored when evaluating the production of shale gas and coalbed gas reservoirs. In the later stages of production, the desorption and diffusion portion of the adsorbed gas in shale gas accounts for approximately 9% of the total gas production, while for coalbed gas, it accounts for approximately 5%. Therefore, the effects of desorption and diffusion need to be comprehensively considered when assessing the production of these two types of unconventional natural gas.
(4) The water saturation of the pores in the coal matrix significantly affects the production of coalbed methane. With every 10% increase in water saturation, the coalbed gas production decreases by approximately 17%.
(5) There are some limitations to the research presented in this paper, such as the assumption of infinite conductivity in the wellbore and the assumption that the gas flows in adjacent thin layers do not affect each other when establishing a mathematical model. In the future, researchers can further consider the impacts of these aspects and continue to conduct in-depth research.
Acknowledgement: None.
Funding Statement: The authors received no specific funding for this study.
Author Contributions: The authors confirm contribution to the paper as follows: study conception and design, data collection: Zhijian Hu; analysis and interpretation of results: Zhijian Hu, Huiyan Zhao and Xuezhong Chen; draft manuscript preparation: Man Chen, Bo Xiong and Jianying Yang. All authors reviewed the results and approved the final version of the manuscript.
Availability of Data and Materials: The data involved in this study has been provided in the paper.
Conflicts of Interest: The authors declare that they have no conflicts of interest to report regarding the present study.
References
1. Zou, C. N., Yang, Z., He, D. B., Wei, Y. S., Li, J. et al. (2018). Theory, technology and prospects of conventional and unconventional natural gas. Petroleum Exploration and Development, 45(4), 575–587. [Google Scholar]
2. He, J., Okere, C. J., Su, G., Hu, P., Zhang, L. et al. (2021). Formation damage mitigation mechanism for coalbed methane wells via refracturing with fuzzy-ball fluid as temporary blocking agents. Journal of Natural Gas Science and Engineering, 90, 103956. https://doi.org/10.1016/j.jngse.2021.103956 [Google Scholar] [CrossRef]
3. Aguilera, R. F., Ripple, R. D., Aguilera, R. (2014). Link between endowments, economics and environment in conventional and unconventional gas reservoirs. Fuel, 126, 224–238. https://doi.org/10.1016/j.fuel.2014.02.063 [Google Scholar] [CrossRef]
4. Wenyang, L., Honglan, Z., Chunzhong, W., Yonghui, W. (2013). An analysis of shale gas development in view of engineering technologies. Acta Petrolei Sinica, 34(6), 1218–1224. [Google Scholar]
5. Nandlal, K., Weijermars, R. (2022). Shale well factory model reviewed: Eagle ford case study. Journal of Petroleum Science and Engineering, 212, 110158. https://doi.org/10.1016/j.petrol.2022.110158 [Google Scholar] [CrossRef]
6. Cheng, Z. M., Wang, J. N., Liao, X. W., Zeng, L. B., Zhao, P. F. et al. (2021). An unstable porous flow model of marine-continental transitional shale gas reservoir. Chinese Journal of Theoretical and Applied Mechanics, 53(8), 2257–2266. [Google Scholar]
7. Zhang, Y., Okere, C. J., Su, G. (2021). Effect of loading rates on accurate in-situ stress determination in different lithologies via Kaiser effect. Arabian Journal of Geosciences, 14, 1304. https://doi.org/10.1007/s12517-021-07674-3 [Google Scholar] [CrossRef]
8. Lichun, K., Dazhong, D., Wenyuan, H., Shengming, W., Shasha, S. (2020). Geological characteristics and development potential of transitional shale gas in the east margin of the Ordos Basin, NW China. Petroleum Exploration and Development, 47(3), 471–482. https://doi.org/10.1016/S1876-3804(20)60066-0 [Google Scholar] [CrossRef]
9. Zhang, T., Li, X. F., Wang, X. Z., Tang, Y. H., Li, Q. Y. et al. (2021). Advantages of hybrid well types including both vertical and horizontal wells to develop continental and transitional shale gas. Petroleum Science Bulletin, 6(2), 272–281. [Google Scholar]
10. Wu, J., Wang, H. Y., Shi, Z. S., Wang, Q., Zhao, Q. et al. (2021). Favorable lithofacies types and genesis of marine-continental transitional black shale: A case study of Permian Shanxi Formation in the eastern margin of Ordos Basin, NW China. Petroleum Exploration and Development, 48(6), 1315–1328. https://doi.org/10.1016/S1876-3804(21)60289-6 [Google Scholar] [CrossRef]
11. Jia, P., Cheng, L., Clarkson, C. R., Williams-Kovacs, J. D. (2017). Flow behavior analysis of two-phase (gas/water) flowback and early-time production from hydraulically-fractured shale gas wells using a hybrid numerical/analytical model. International Journal of Coal Geology, 182, 14–31. https://doi.org/10.1016/j.coal.2017.09.001 [Google Scholar] [CrossRef]
12. Verga, F., Viberti, D., Borello, E. S., Serazio, C. (2015). Estimation of skin from the interpretation of injection tests in fractured reservoirs. Geoingegneria Ambientale e Mineraria, 146(3), 45–52. [Google Scholar]
13. Farah, N., Delorme, M., Ding, D. Y., Wu, Y. S., Codreanu, D. B. (2019). Flow modelling of unconventional shale reservoirs using a DFM-MINC proximity function. Journal of Petroleum Science and Engineering, 173, 222–236. https://doi.org/10.1016/j.petrol.2018.10.014 [Google Scholar] [CrossRef]
14. Velasco-Lozano, M., Balhoff, M. T. (2022). Modeling of early-and late-time countercurrent spontaneous imbibition in porous media: A semi-analytical approach. Journal of Petroleum Science and Engineering, 208, 109499. https://doi.org/10.1016/j.petrol.2021.109499 [Google Scholar] [CrossRef]
15. Zhao, Y. L., Huang, X., Zhang, L. H., Li, S. X., Li, X. T. et al. (2023). Numerical simulation of fractured horizontal wells in transitional shale gas reservoirs based on embedded discrete fracture model optimization. Natural Gas Industry, 43(4), 116–126. [Google Scholar]
16. Lee, S., Wheeler, M. F., Wick, T., Srinivasan, S. (2017). Initialization of phase-field fracture propagation in porous media using probability maps of fracture networks. Mechanics Research Communications, 80, 16–23. https://doi.org/10.1016/j.mechrescom.2016.04.002 [Google Scholar] [CrossRef]
17. Zhang, J., Feng, Q., Zhang, X., Hu, Q., Wen, S. (2020). Multi-fractured horizontal well for improved coalbed methane production in eastern Ordos basin, China: Field observations and numerical simulations. Journal of Petroleum Science and Engineering, 194, 107488. https://doi.org/10.1016/j.petrol.2020.107488 [Google Scholar] [CrossRef]
18. Fathi, E., Yücel Akkutlu, I. (2009). Matrix heterogeneity effects on gas transport and adsorption in coalbed and shale gas reservoirs. Transport in Porous Media, 80, 281–304. https://doi.org/10.1007/s11242-009-9359-4 [Google Scholar] [CrossRef]
19. Swami, V., Settari, A. (2012). A pore scale gas flow model for shale gas reservoir. SPE 155756 Presented at the Americas Unconventional Resources Conference, Pittsburgh, Pennsylvania, USA. [Google Scholar]
20. Roy, S., Raju, R., Chuang, H. F., Cruden, B. A., Meyyappan, M. (2003). Modeling gas flow through microchannels and nanopores. Journal of Applied Physics, 93(8), 4870–4879. https://doi.org/10.1063/1.1559936 [Google Scholar] [CrossRef]
21. Civan, F. (2010). Effective correlation of apparent gas permeability in tight porous media. Transport in Porous Media, 82(2), 375–384. https://doi.org/10.1007/s11242-009-9432-z [Google Scholar] [CrossRef]
22. Wang, Z., Lu, S., Wang, M., Tian, S. S. (2016). Fractal characteristics of lacustrine shale and marine shale. Lithologic Reservoirs, 28(1), 88–93. [Google Scholar]
23. Yu, B., Li, J. (2001). Some fractal characters of porous media. Fractals, 8(2), 365–372. [Google Scholar]
24. Beskok, A., Karniadakis, G. E. (1999). A model for flows in channels, pipes, and ducts at micro and nano scales. Microscale Thermophysical Engineering, 3(1), 43–77. https://doi.org/10.1080/108939599199864 [Google Scholar] [CrossRef]
25. Zhang, L., Li, D., Lu, D., Zhang, T. (2015). A new formulation of apparent permeability for gas transport in shale. Journal of Natural Gas Science and Engineering, 23(2), 221–226. [Google Scholar]
26. Akilu, S., Padmanabhan, E., Zheng, S. (2021). A review of transport mechanisms and models for unconventional tight shale gas reservoir systems. International Journal of Heat and Mass Transfer, 175, 121125. https://doi.org/10.1016/j.ijheatmasstransfer.2021.121125 [Google Scholar] [CrossRef]
27. Zhang, L. H., Shan, B. C., Zhao, Y. L., Guo, Z. L. (2019). Review of micro seepage mechanisms in shale gas reservoirs. International Journal of Heat and Mass Transfer, 139, 144–179. https://doi.org/10.1016/j.ijheatmasstransfer.2019.04.141 [Google Scholar] [CrossRef]
28. Fink, R., Amann-Hildenbrand, A., Bertier, P., Littke, R. (2018). Pore structure, gas storage and matrix transport characteristics of lacustrine Newark shale. Marine and Petroleum Geology, 97, 525–539. https://doi.org/10.1016/j.marpetgeo.2018.06.035 [Google Scholar] [CrossRef]
29. Fink, R., Krooss, B. M., Gensterblum, Y., Amann-Hildenbrand, A. (2017). Apparent permeability of gas shales–superposition of fluid-dynamic and poro-elastic effects. Fuel, 199, 532–550. https://doi.org/10.1016/j.fuel.2017.02.086 [Google Scholar] [CrossRef]
30. Arash, B., Apostolos, K. (2017). A hybrid methodology to predict gas permeability in nanoscale organic materials; a combination of fractal theory, kinetic theory of gases and Boltzmann transport equation. Fuel, 188, 239–245. https://doi.org/10.1016/j.fuel.2016.10.014 [Google Scholar] [CrossRef]
31. Kamrava, S., Sahimi, M., Tahmasebi, P. (2021). Simulating fluid flow in complex porous materials by integrating the governing equations with deep-layered machines. npj Computational Materials, 7, 127. https://doi.org/10.1038/s41524-021-00598-2 [Google Scholar] [CrossRef]
32. Jiao, F. Z., Wen, S. M., Liu, X. J., Xiong, X. Y., Li, S. X. et al. (2023). Research progress in exploration theory and technology of transitional shale gas in the Ordos Basin. Natural Gas Industry, 43(4), 11–23. [Google Scholar]
Cite This Article
 Copyright © 2024 The Author(s). Published by Tech Science Press.
This work is licensed under a Creative Commons Attribution 4.0 International License , which permits unrestricted use, distribution, and reproduction in any medium, provided the original work is properly cited.
 Downloads
 Citation Tools